1.0 OVERVIEW - hydroone.com · SAP™ This is an integrated enterprise asset management (EAM)...
21
Filed: May 19, 2010 EB-2010-0002 Exhibit C1 Tab 2 Schedule 9 Page 1 of 21 SHARED SERVICES OM&A - INFORMATION TECHNOLOGY 1 2 1.0 OVERVIEW 3 4 Information Technology (“IT”) refers to computer systems (hardware, software and 5 applications), data and voice communication systems that support business processes and 6 allow employees to perform work activities. 7 8 IT work programs include both OM&A and capital items and include the ongoing 9 maintenance and sustainment of existing and newly commissioned applications and 10 technologies; the development and implementation of new technologies or systems; the 11 provision of Business Telecom services; and the overall management and control of the 12 information technology program – including capital projects. IT capital investments are 13 made in accordance with approved business strategies and are described in Exhibit D1, 14 Tab 3, Schedule 6. 15 16 OM&A costs associated with supporting Hydro One’s information technology assets are 17 shown in Table 1 and are described below. 18
Transcript of 1.0 OVERVIEW - hydroone.com · SAP™ This is an integrated enterprise asset management (EAM)...

Filed: May 19, 2010 EB-2010-0002 Exhibit C1 Tab 2 Schedule 9 Page 1 of 21
SHARED SERVICES OM&A - INFORMATION TECHNOLOGY 1
2
1.0 OVERVIEW 3
4
Information Technology (“IT”) refers to computer systems (hardware, software and 5
applications), data and voice communication systems that support business processes and 6
allow employees to perform work activities. 7
8
IT work programs include both OM&A and capital items and include the ongoing 9
maintenance and sustainment of existing and newly commissioned applications and 10
technologies; the development and implementation of new technologies or systems; the 11
provision of Business Telecom services; and the overall management and control of the 12
information technology program – including capital projects. IT capital investments are 13
made in accordance with approved business strategies and are described in Exhibit D1, 14
Tab 3, Schedule 6. 15
16
OM&A costs associated with supporting Hydro One’s information technology assets are 17
shown in Table 1 and are described below. 18

Filed: May 19, 2010 EB-2010-0002 Exhibit C1 Tab 2 Schedule 9 Page 2 of 21
Table 1 1 Information Technology Summary of OM&A Expenditures 2
($ Millions) 3 4
Historic Bridge Test TX Allocation Description 2007 2008 2009 2010 2011 2012 2011 2012 Sustainment 63.9 72.4 81.9 90.0 90.8 92.5 39.0 39.6 Development 6.0 2.8 3.5 10.8 8.4 8.6 3.5 3.6 Business Telecom 17.2 17.2 20.8 21.2 23.4 23.6 12.2 12.3 IT Management & Project Control 12.0¹ 16.3² 22.5³ 25.5 25.5 25.8 12.8 13.0
Total Cost 99.1 108.7 128.7 147.5 148.1 150.5 67.5 68.5 ¹Information Assets department and ISS group not included in IT Management in 2007. 5 ²Partial year of amalgamation of IT resources from the Enablement, Information Assets department and ISS 6 group. 7 ³Full year of amalgamation of IT resources from the Enablement, Information Assets department and ISS 8 group. 9 10 11 Sustainment costs are paid to Inergi LLP (“Inergi”) pursuant to the Outsourcing Contract. 12
March 1, 2010 marks the start of year 9 of the 10 + 3 year contract. As of May 2010, a 3 13
year extension was negotiated to take the outsourced services with Inergi to March 2015. 14
Sustainment costs are costs to support the Hydro One information technology 15
applications and infrastructure. 16
17
Starting in 2010, sustainment costs represent full year costs of supporting the solutions 18
delivered by the Cornerstone Phase 1 and Phase 2 projects. When projects are “in-19
service” the costs to sustain the applications are included in Sustainment costs. 20
Additional incremental costs are attributed to growth in license costs as well as 21
incremental data storage costs. 22
23
IT Development includes non-capital business improvement and enhancement work 24
within SAP and ancillary systems including associated business processes. Expenditures 25

Filed: May 19, 2010 EB-2010-0002 Exhibit C1 Tab 2 Schedule 9 Page 3 of 21
include keeping the core systems within the vendors’ upgrade path as well as highlighting 1
business improvement areas through enhanced analytics and reporting. 2
3
Business Telecom costs include data and voice telecommunications and associated 4
maintenance of Hydro One’s telecom network. Changes in costs vary with the number of 5
offices, their locations and the size of Hydro One’s workforce. 6
7
IT Management and Project Control costs relate to IT administration, project oversight 8
and reporting, program and spend coordination, and Quality Assurance (“QA”)/Quality 9
Control (“QC”) processes. 10
11
Technology costs are subject to an IT governance process at Hydro One. IT Governance 12
looks proactively at IT strategy, project expenditures and service delivery to align 13
technology spend with business and corporate objectives. 14
15
The IT governance model involves the senior business managers who provide guidance, 16
direction and support to the decision-making for corporate technology decisions. The 17
Line of Business executives act as an IT Steering Committee to which the CIO reports to 18
at regular intervals ensuring alignment between business needs and technology solutions. 19
The Steering Committee’s mandate is to review and prioritize IT investments on a 20
corporate enterprise basis. 21
22
2.0 IT SUSTAINMENT OM&A 23
24
Table 2 shows the specific expenditures for IT sustainment of the Information 25
Technology infrastructure. 26
27

Filed: May 19, 2010 EB-2010-0002 Exhibit C1 Tab 2 Schedule 9 Page 4 of 21
Table 2 1 OM&A Sustainment of Information Technology 2
($ Millions) 3 4
Historic Bridge Test TX Allocation Description 2007 2008 2009 2010 2011 2012 2011 2012 Base IT Sustainment Services
43.5 51.4 49.7 52.7 51.2 50.6 22.5 22.1
OMS Incremental Sustainment 6.5 6.2 6.0 6.1 5.3 5.1 1.1 1.0
Other Incremental Sustainment 13.9 14.8 26.2 31.2 34.3 36.8 15.4 16.5
Total 63.9 72.4 81.9 90.0 90.8 92.5 39.0 39.6 5
IT OM&A Sustainment work includes help desk and desk side support; implementing 6
system patches; applying fixes for application, resolving application problems; security 7
patching; decommissioning or installing software applications or equipment; maintaining 8
and operating Hydro One IT assets located at offices and the data centres; and data 9
storage capacity and data storage management. 10
11
Sustainment OM&A costs also include amounts which are paid to third parties for 12
software licenses and annual maintenance fees. 13
14
IT sustainment work is broken down into the three categories discussed below. 15
16
2.1 Base IT Sustainment Services 17
18
The term “Base” IT Sustainment Services refers to those IT services, including the 19
sustainment services discussed above, that were part of the original scope of work 20
outsourced in March, 2002 to Inergi and which are scheduled in the negotiated contract. 21

Filed: May 19, 2010 EB-2010-0002 Exhibit C1 Tab 2 Schedule 9 Page 5 of 21
Base IT services include charges for Inergi pension costs (approximately $1.5 million 1
each year) and the Base IT costs are adjusted for Cost of Living changes (COLA). 2
3
The COLA factor is “based upon the Statistics Canada Indices of total wages, salaries, 4
and supplementary labour income in Ontario, and total number of employees in Ontario” 5
and uses 2001 as a base year. The COLA factor for each year is calculated by comparing 6
the annual Statistics Canada Indices for that year with the 2001 values. 7
8 In 2010, the COLA cost factor is $13.5 million. In 2011 it is estimated at $14.3 million 9
and in 2012 at $14.9 million. 10
11
Base IT services are discussed under the five categories below. 12
13
Hardware Maintenance/Software License Fees 14
15
Application software license costs and maintenance fees are costs paid to third party 16
vendors for software applications which are used by Hydro One. 17
18
At the inception of the outsourcing agreement $13.4 million of application costs were 19
transferred to Inergi to administer on a pass through basis. Over time many of these 20
contracts have migrated back to Hydro One, and are now administered (managed) by 21
Hydro One. Contract costs which are now being managed by Hydro One, and 22
administered by Inergi, are reflected in Other Incremental Sustainment costs. 23
24
License or maintenance agreements are usually subject to annual increases as part of the 25
contractual terms with the vendor. These fees are subject to annual audits by the third 26
party vendors to confirm the fees match the services provided. 27
28
Filed: May 19, 2010 EB-2010-0002 Exhibit C1 Tab 2 Schedule 9 Page 6 of 21 Application Maintenance 1
2
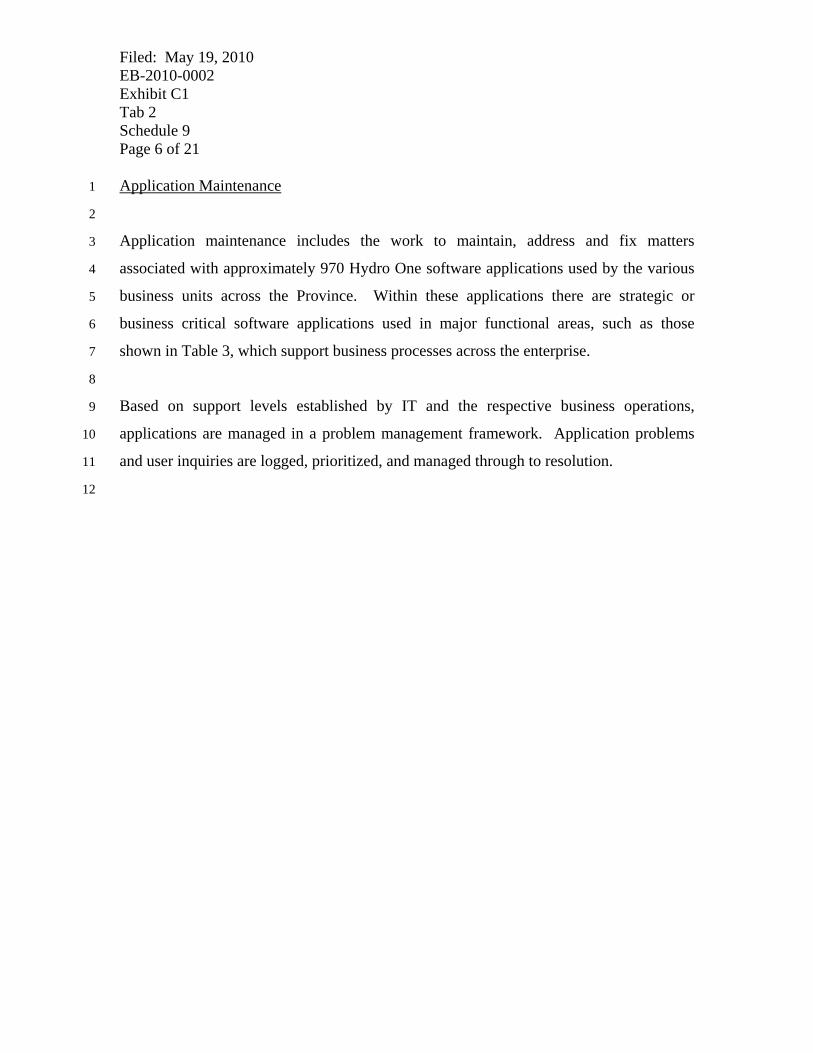
Application maintenance includes the work to maintain, address and fix matters 3
associated with approximately 970 Hydro One software applications used by the various 4
business units across the Province. Within these applications there are strategic or 5
business critical software applications used in major functional areas, such as those 6
shown in Table 3, which support business processes across the enterprise. 7
8
Based on support levels established by IT and the respective business operations, 9
applications are managed in a problem management framework. Application problems 10
and user inquiries are logged, prioritized, and managed through to resolution. 11
12

Filed: May 19, 2010 EB-2010-0002 Exhibit C1 Tab 2 Schedule 9 Page 7 of 21
Table 3 1 Strategic Information Technology Systems 2
3 IT Systems Description
Desktop Applications These include Microsoft Office XP/2003 (for example, Word, Excel, Access, and PowerPoint), e-mail, Internet browser, and various other applications such as anti-virus and directory functions. Hydro One’s e-mail system processes approximately 80,000 e-mails per day.
SAP™ This is an integrated enterprise asset management (EAM) application suite that provides Asset and Work Management, Purchasing and Supply Chain functions as well as Inventory Management functions. The application was implemented through a series of phases which saw it replace the Peoplesoft application in 2009. This Financial and HR application suite now provides General Ledger, Accounts Receivable, Fixed Assets, Project Accounting, Payroll, and Pension functions. In order to be compliant with Federal Tax regulations Hydro One is required to retain the Passport application as a reference application for the next 7 years. Some support costs are required to maintain the Passport system and the related database to be compliant with regulatory requirements.
Customer Information System The CIS is an application suite providing billing and services support through sub-systems of Customer Service System (CSS) and Open Market Systems that interface with each other. The CIS application is also scheduled for replacement under the Cornerstone Program though no replacement application has been selected. Timing of the application replacement is partially dependent on the timing and implementation of Smart Metering.
Contact Centre Technology This suite of applications enables contact centre operators to respond to customers (service requests, billing inquiries, information), including telephony interfaces and call centre technology and provides operators scheduling and service quality-monitoring functions.
Open Market Systems (OMS) These are a set of applications that provide for meter data collection, sending/receiving of electronic business transactions with market participants, bill calculations, and settlement functions with the Independent Electricity System Operator.
Field Design Tool (ArcFM) This is a geographic application that is used to design and modify customer connections to the electrical distribution system.
Work Execution Project (WEP) WEP consists of 3 applications (Pragma CAD, P3e,e-time) which are used to plan, schedule, dispatch and report on work completion. The applications are used for work planning, crew scheduling and for both planned and unplanned field work. The applications are “out of the box” and are cross linked to ArcFM, SAP and to Customer One through the use of the enterprise bus or enterprise middleware.
4

Filed: May 19, 2010 EB-2010-0002 Exhibit C1 Tab 2 Schedule 9 Page 8 of 21 Data Centre Services 1
2
Data centre services include the operations, maintenance, and management of hardware 3
(servers, mainframe, storage area network and data storage devices), operating systems, 4
associated applications and infrastructure located at the data centre facilities. This 5
hardware is used to run enterprise business applications, noted above, that are critical to 6
operating the business. 7
8
Data Centre service levels have been established to ensure the reliable operation of 9
business applications and are based on system criticality. The system hardware is located 10
at production and backup data centres, which have the required system redundancies 11
including 24/7 monitoring. Hydro One utilizes the backup data centre facility as a 12
Disaster Recovery site in the case it is unable to operate from its production data centre. 13
14
Distributed Server Sustainment 15
16
Distributed server sustainment includes the support services that maintain and operate the 17
application and file servers that are located at various Hydro One facilities across the 18
province. The servers are used to run business applications and administration systems 19
such as file sharing, e-mail exchange, web hosting and security monitoring systems. This 20
work is required to maintain the reliability of the servers and the business applications 21
supporting business operations. 22
23
Help-Desk & Desktop Support 24
25
Help-Desk and Desktop Support includes daily and emergency IT maintenance services 26
delivered to employees across the Province. 27

Filed: May 19, 2010 EB-2010-0002 Exhibit C1 Tab 2 Schedule 9 Page 9 of 21
The support function is provided through two key service areas: the Help Desk which 1
provides centralized call handling through a 1-800 number and through e-mail; problem 2
resolution and escalation or referral for all IT and telecom service areas; and Desktop 3
Workstation Support which provides physical desk side support to fix hardware and 4
software problems for laptops, desktops and rugged tablet computers. Desktop 5
Workstation Support includes the support for IT peripherals such as printers, plotters, 6
scanners and other equipment. Help Desk support includes work comprising a number of 7
functions including handling trouble calls, trouble or requested service e-mails, providing 8
application support and resetting or enabling application or system passwords. 9
10
Desktop and Help Desk support is available to all users across the province and 11
assistance can be provided by telephone, remotely through the data network, or if 12
necessary through the use of Inergi field technicians. On a monthly basis, approximately 13
8,000 (2009 monthly average) help desk calls are logged, dealt with and cleared. 14
Effective and timely response to these calls ensures the efficient operation of the 15
technology infrastructure which enables Hydro One staff to perform their work 16
unimpeded. 17
18
2.2 Open Market Systems (“OMS”) Incremental Sustainment 19
20
This category is incremental to the base sustainment identified and was sourced to Inergi 21
in 2002. Specifically, the workconsists of the support functions performed to sustain the 22
OMS hardware and software applications. The OMS is comprised of a suite of software 23
applications that have been bundled together to provide the required functionality using 24
service oriented architecture and middleware applications. The support for the OMS was 25
contractually “locked in” and is supported by Inergi at an annual cost of $6.1 million in 26
2010, $5.3 million in 2011, and $5.1 million in 2012. The OMS suite is used to enable 27
wholesale and retail settlement processes. The processes provide interaction with the 28

Filed: May 19, 2010 EB-2010-0002 Exhibit C1 Tab 2 Schedule 9 Page 10 of 21 IESO and other market participants and are required for the business to operate under the 1
Province’s open market policies, driven in part by the Electricity Act, 1998 and related 2
legislative policies. 3
4
2.3 Other Incremental Sustainment 5
6
Other Incremental Sustainment includes additional sustainment services provided in order 7
to support and manage business applications, commissioned since March, 2002. These 8
costs include license and software costs (which have transferred to Hydro One as noted 9
earlier in Section 2.1), new services, as well as volumetric changes in service levels due 10
to staff growth and new business requirements. 11
12
New applications are being continually commissioned or added to meet evolving business 13
requirements. Additionally, service levels increase as demand for services increase. 14
Contractually, Hydro One is required to pay for these increased service levels and is 15
required to purchase revised volumes (“lock in”) when service level demand meets 16
specific volumes. Since 2002, the incremental sustainment cost has increased as 17
additional applications have been added annually through capital projects, such as 18
Cornerstone, and also through development projects. 19
20
In 2009 Other Incremental Sustainment totaled $26.2 million and consisted of $6.5 21
million for SAP application support, $0.9 million for support of other applications, and 22
$18.8 million for third party license and maintenance contracts. 23
24
In 2010 Other Incremental Sustainment will total $31.2 million. SAP application support 25
will increase to $9 million to accommodate a full year of support for the phase 2 rollout 26
of SAP, and support of other applications will remain at $0.9 million. Third party license 27
and maintenance contracts will increase to $21.3 million due to increased Microsoft 28

Filed: May 19, 2010 EB-2010-0002 Exhibit C1 Tab 2 Schedule 9 Page 11 of 21
licensing fees, SAP software maintenance (previous years were included in the software 1
purchase price), and other license and maintenance fees. 2
3
In 2011 Other Incremental Sustainment will total $34.3 million. SAP application support 4
will remain at $9 million and support of other applications will remain at $0.9 million. In 5
2011 Smart Metering application support costs of $1.5 million will be transferred from 6
the line of business to Other Incremental Sustainment. Third party contracts will increase 7
to $22.9 million, primarily due to increased usage of Microsoft tools (Office 8
Communicator, Sharepoint, LiveMeeting) and a related increase in Microsoft licensing 9
costs. 10
11
In 2012 Other Incremental Sustainment will total $36.8 million. SAP application support 12
will increase to $9.6 million due to added functions/modules, Smart Metering application 13
support will increase to $1.6 million, and the support of other applications, like the 14
Mobile IT platform, will increase to $1.1 million. Third party contracts will increase to 15
$24.4 million, primarily due to increased Microsoft licensing costs and added Microsoft 16
product usage. 17
18
A list of planned incremental capital projects, excluding Cornerstone, which in turn will 19
create incremental sustainment needs when these projects are commissioned, is found in 20
Exhibit D1, Tab 3, Schedule 6. 21
22
3.0 IT DEVELOPMENT OM&A 23
24
Table 4 lists the expenditures driven by non-Capital small IT projects and the OM&A 25
portions of capital projects. 26
27

Filed: May 19, 2010 EB-2010-0002 Exhibit C1 Tab 2 Schedule 9 Page 12 of 21
Table 4 1 OM&A Development Expenditures 2
($ Millions) 3 4
Historic Bridge Test TX Allocation Description 2007 2008 2009 2010 2011 2012 2011 2012 Small Projects 5.6 2.7 3.5 10.8 8.3 8.5 3.5 3.6 Impact of Capital Projects 0.3 0.1 0.0 0.0 0.1 0.1 0.0 0.0
Total 6.0 2.8 3.5 10.8 8.4 8.6 3.5 3.6 5
3.1 Small Projects 6
7
Small project costs for 2011 include application rationalization, upgrades to the Arc FM 8
GIS application and enhancements to workflow and the customer relationship 9
management systems in support of Distributed Generation connections. Also included are 10
changes to the customer information and billing system. Additional expenditures for 2011 11
include the continuation of business driven application enhancements and ensuring that 12
the environment remains current and continues to provide adequate function for evolving 13
business requirements. 14
15
With the transfer of the Enablement organization from Finance into IT, their business 16
improvement and enhancement work program is added to this category as of 2010. The 17
work is similar to small projects with a focus on leveraging SAP assets and ancillary 18
systems to their full potential including associated business processes, data and interfaces. 19
20
Expenditures for 2010 and 2011 include: enhancements to enterprise analytics and 21
reporting by further leveraging SAP Business Intelligence/Business Warehouse (BI/BW); 22
performance management improvements through the development of key performance 23
indicators (KPI’s) for SAP enabled processes; and improvements to work management 24
and supply chain processes and system interfaces to those processes. Also included are 25
Filed: May 19, 2010 EB-2010-0002 Exhibit C1 Tab 2 Schedule 9 Page 13 of 21
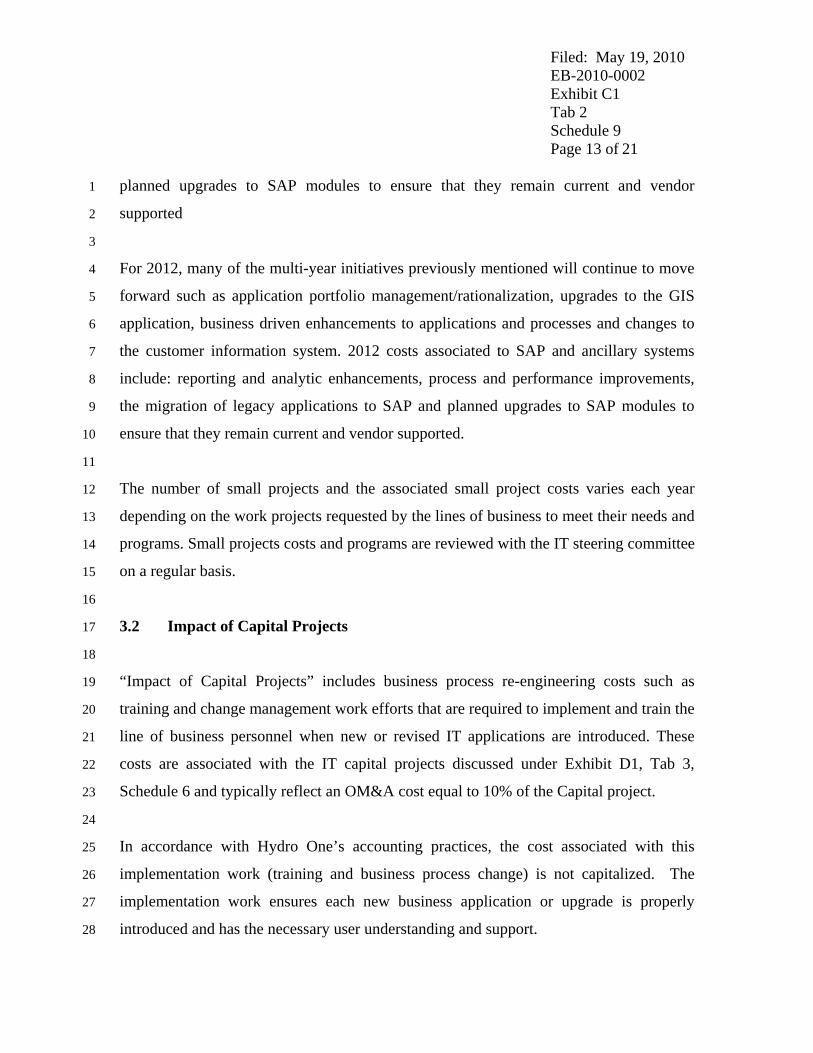
planned upgrades to SAP modules to ensure that they remain current and vendor 1
supported 2
3
For 2012, many of the multi-year initiatives previously mentioned will continue to move 4
forward such as application portfolio management/rationalization, upgrades to the GIS 5
application, business driven enhancements to applications and processes and changes to 6
the customer information system. 2012 costs associated to SAP and ancillary systems 7
include: reporting and analytic enhancements, process and performance improvements, 8
the migration of legacy applications to SAP and planned upgrades to SAP modules to 9
ensure that they remain current and vendor supported. 10
11
The number of small projects and the associated small project costs varies each year 12
depending on the work projects requested by the lines of business to meet their needs and 13
programs. Small projects costs and programs are reviewed with the IT steering committee 14
on a regular basis. 15
16
3.2 Impact of Capital Projects 17
18
“Impact of Capital Projects” includes business process re-engineering costs such as 19
training and change management work efforts that are required to implement and train the 20
line of business personnel when new or revised IT applications are introduced. These 21
costs are associated with the IT capital projects discussed under Exhibit D1, Tab 3, 22
Schedule 6 and typically reflect an OM&A cost equal to 10% of the Capital project. 23
24
In accordance with Hydro One’s accounting practices, the cost associated with this 25
implementation work (training and business process change) is not capitalized. The 26
implementation work ensures each new business application or upgrade is properly 27
introduced and has the necessary user understanding and support. 28
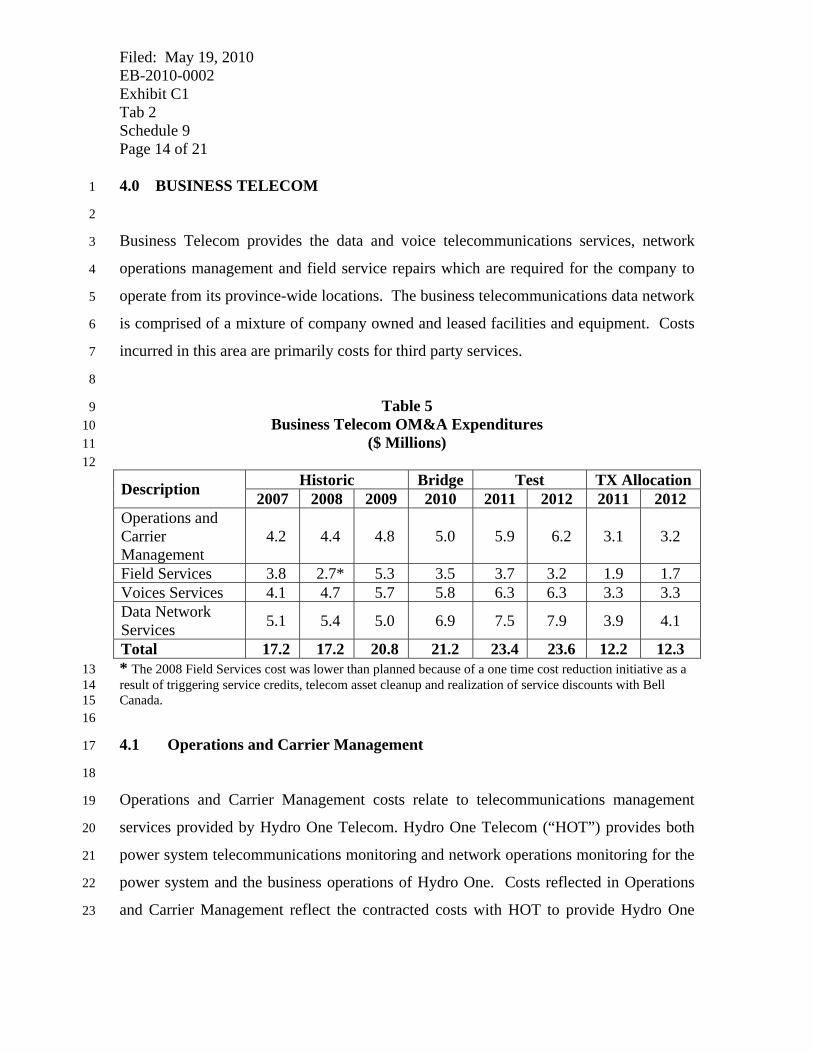
Filed: May 19, 2010 EB-2010-0002 Exhibit C1 Tab 2 Schedule 9 Page 14 of 21 4.0 BUSINESS TELECOM 1
2
Business Telecom provides the data and voice telecommunications services, network 3
operations management and field service repairs which are required for the company to 4
operate from its province-wide locations. The business telecommunications data network 5
is comprised of a mixture of company owned and leased facilities and equipment. Costs 6
incurred in this area are primarily costs for third party services. 7
8
Table 5 9 Business Telecom OM&A Expenditures 10
($ Millions) 11 12
Historic Bridge Test TX Allocation Description 2007 2008 2009 2010 2011 2012 2011 2012 Operations and Carrier Management
4.2 4.4 4.8 5.0 5.9 6.2 3.1 3.2
Field Services 3.8 2.7* 5.3 3.5 3.7 3.2 1.9 1.7 Voices Services 4.1 4.7 5.7 5.8 6.3 6.3 3.3 3.3 Data Network Services 5.1 5.4 5.0 6.9 7.5 7.9 3.9 4.1
Total 17.2 17.2 20.8 21.2 23.4 23.6 12.2 12.3 * The 2008 Field Services cost was lower than planned because of a one time cost reduction initiative as a 13 result of triggering service credits, telecom asset cleanup and realization of service discounts with Bell 14 Canada. 15 16
4.1 Operations and Carrier Management 17
18
Operations and Carrier Management costs relate to telecommunications management 19
services provided by Hydro One Telecom. Hydro One Telecom (“HOT”) provides both 20
power system telecommunications monitoring and network operations monitoring for the 21
power system and the business operations of Hydro One. Costs reflected in Operations 22
and Carrier Management reflect the contracted costs with HOT to provide Hydro One 23
Filed: May 19, 2010 EB-2010-0002 Exhibit C1 Tab 2 Schedule 9 Page 15 of 21
with telecommunication management services and operations oversight and control for its 1
business operations. The affiliate agreement is found in Exhibit A, Tab 7, Schedule 3. 2
3
In 2005 an independent industry review concluded that the service level agreement for 4
the Hydro One Telecom operation centre, and for the services provided by it, reflects 5
market conditions and that Hydro One Telecom has provided an advantage to Hydro One 6
in respect of telecom administration and the resultant costs. The study also concluded 7
there are unique requirements for operating the telecommunication system of an electric 8
utility which are not easily delivered through a third party non-electric utility carrier. 9
10
In 2006 and 2008, updated independent assessments were undertaken by The Shpigler 11
Group to benchmark the costs of services being provided by Hydro One Telecom. The 12
assessment process included looking at the contracts and statement of work for services 13
to be covered in the regulatory review period. The reports considered the revised services 14
which will be performed in the years covered and the costs to be charged by Hydro One 15
Telecom in providing those services. 16
17
Consistent with the opinion provided in earlier studies undertaken, the 2008 study states: 18
“In our opinion, the unique voltage potential of a power system has created the need for 19
electric utilities to create their own telecommunications entities that can isolate and 20
insulate the telecommunication infrastructure, which protects communications during 21
electrical disturbances. Protecting electrical equipment requires sophisticated systems 22
that need to communicate between substations and power plants. The need to isolate 23
electrical and telecommunications facilities for safety and service reliability has 24
supported the development of large utility telecommunication entities. Even with fiber 25
optic channels negating some interfacing concerns, the need for end electronics 26
equipment to interface with optical equipment at risk to voltage surges still exists. 27
Network operation centers of public and private telecommunications companies rarely 28

Filed: May 19, 2010 EB-2010-0002 Exhibit C1 Tab 2 Schedule 9 Page 16 of 21 have the experience or knowledge necessary to manage a power systems 1
telecommunication system. Therefore, for benchmarking purposes, we determined that 2
the most meaningful and comparative data would need to be obtained from similar 3
Canadian utility telecommunication entities.” 4
5
The report concluded the contracted costs are indicative of fair market value. The reports 6
reaffirmed the conclusion that Hydro One obtains commercial and operations benefit 7
through its relationship with Hydro One Telecom. These costs were deemed acceptable 8
by the Board in the EB-2008-0272 Transmission proceedings. 9
10
The increase in 2012 costs represents the anticipated commissioning and ongoing support 11
of IT security monitoring services that supplement the existing telecom operations and 12
monitoring services. 13
14
Work performed by Hydro One Telecom includes operating and monitoring the business 15
telecom and data networks, management of security firewalls, security patching, 16
management of network interfaces with third parties, spam control, managing data and 17
voice system problems, obtaining and managing fibre services from third party vendors, 18
and directing other telecom service providers and vendors to change, maintain, and 19
restore the networks as required. On an ongoing basis, this function includes managing 20
third party supplier contracts as well as analyzing and processing bill payments to 3rd 21
party common carriers and other telecom service providers. 22
23
Telecom service firms who provide fibre and network access include common carriers 24
such as Bell Canada, Telus and MTS/Allstream. These companies lease telecom data and 25
voice circuits to Hydro One at competitive market rates. The management of these 26
services requires the contracted services of Hydro One Telecom to proactively liaise with 27
the many common carriers in Ontario and other service suppliers. 28
Filed: May 19, 2010 EB-2010-0002 Exhibit C1 Tab 2 Schedule 9 Page 17 of 21
Operations and Carrier Management also provides oversight of the Bell Field Services 1
contract as described below. 2
3
4.2 Field Services 4
5
Field Services includes the maintenance and repair of voice and data telecom equipment. 6
Field Services also includes the handling of connection changes for moves, additions, 7
changes, and deletions (“MACDs”). Since 2004 this work has been outsourced to Bell 8
Canada after a competitive process. In 2008, service credits, telecom asset cleanup and 9
realization of service discounts were triggered as part of the contract. The result was 10
lower than anticipated Field Services costs in 2008. 11
12
The year-over-year costs for Field Services is due to staff movements (move/add/changes 13
to voice and data telecom configuration) as well as introduction new sites. 14
2009 Field Services impacts: 15
• Additional floor space at 95 Mural for project office 16
• Newmarket Garage 17
• South Tower 483 Bay (trinity floor 4 and 6) 18
19
Through another competitive tendering process in 2009 where a new services contract 20
was awarded to Bell Canada, costs in 2010 to 2012 will be lower than the costs paid for 21
those services from previous years. This is counter-balanced by increased costs to 22
accommodate staff additions and relocations in support of the capital work program. 23
24
The MACD agreement calls for Bell Canada technicians to be dispatched across the 25
province to resolve any telecommunications issues. These include MACDs and 26
preventive maintenance at any of the Hydro One sites across the entire Province. 27

Filed: May 19, 2010 EB-2010-0002 Exhibit C1 Tab 2 Schedule 9 Page 18 of 21 Selected Bell Canada staff has been specifically trained to work at the Hydro One sites 1
and facilities and to work safely in a high voltage environment. 2
3
4.3 Voice Services 4
5
Voice Services investments consist of payments made to common carriers and vendors to 6
use and lease voice circuits and equipment. Rates charged by common carriers are 7
competitive. Voice Services include monthly charges, usage fees and equipment rentals 8
for voice grade business telecom (local and long distance). The local voice service rates 9
are regulated under CRTC. Long distance rates were secured using a competitive bid 10
process. Annual costs are volumetric and usage-based. 11
12
4.4 Data Network Services 13
14
Data Network Services investments consist of payments made to third party common 15
carriers such as Bell, MTS/Allstream, and Telus to lease data network circuits and 16
equipment at market rates. The data network is used to connect servers and computers 17
across the province for software applications. 18
19
Hydro One continues to monitor and upgrade band width as applications are deployed to 20
field offices in order to support business processes and business requirements. 21
22
While network capacity grows each year to accommodate sharing more data among more 23
functions, to address increases in office size and to address connectivity requirements 24
from distributed enterprise applications, the Company has maintained cost control on data 25
network components. Downward cost pressure is maintained through investments in 26
efficient up-to-date IT hardware and by ensuring a competitive process for services. 27

Filed: May 19, 2010 EB-2010-0002 Exhibit C1 Tab 2 Schedule 9 Page 19 of 21
Data Network Services costs increases follow the same trend as the Voice Services 1
because of the change of existing sites or the addition of new sites. 2
3
5.0 IT MANAGEMENT & PROJECT CONTROL 4
5
Table 6 lists the associated costs for IT Management and for Project Support and Control. 6
7
Table 6 8 IT Management & Project Control Expenditures 9
($ Millions) 10 11
Historic Bridge Test TX Allocation Description 2007 2008 2009 2010 2011 2012 2011 2012 IT Management 10.9 13.2 18.1 19.0 20.0 20.5 10.4 10.7 Project Support and Control 1.1 3.1 4.4 6.5 5.5 5.3 2.4 2.3
Total 12.0¹ 16.3² 22.5³ 25.5 25.5 25.8 12.8 13.0 ¹ Information Assets department and ISS group not included in IT Management in 2007. 12 ² Partial year of amalgamation of IT resources from the Enablement, Information Assets department and 13 ISS group. 14 ³ Full year of amalgamation of IT resources from the Enablement, Information Assets department and ISS 15 group. 16 17
To manage the overall IT program and as the enabler and controller of IT projects, IT 18
Management and Project Support and Control develops and implements IT strategies, 19
policies and processes along with IT architectural standards for application 20
interoperability, infrastructure capacity, network security, regulatory compliance and IT 21
governance, and telecom capabilities and communications security. Within the scope of 22
these costs is work associated with hardware procurement, training, detailing vendor 23
responsibilities, architecture development, and research services that are required to 24
match IT solutions to known business needs and opportunities. Work performed also 25
includes keeping current on industry trends, product innovations, technology changes in 26
infrastructure and applications, research, as well as planning for future investments. 27

Filed: May 19, 2010 EB-2010-0002 Exhibit C1 Tab 2 Schedule 9 Page 20 of 21 IT Management includes the cost to coordinate, manage and plan the extensive IT 1
infrastructure, to manage the daily issues around IT outsourced services, and to oversee 2
projects. IT Management performs work covered through needs assessment, business 3
case preparation, planning, development, and service delivery to the lines of business. 4
5
Projects or programs that the IT Management and Project Support and Control will 6
manage or deliver in 2011 and 2012 include Mobile IT, development and application 7
migration; architectural design and compliance policies (particularly around SAP); 8
application rationalization; data architecture and data management; updating IT policies 9
and technology roadmaps; Bill 198 compliance; ongoing security requirements and 10
enhancements including documentation, training and testing; negotiation of contracts; 11
supporting hardware purchases for major projects and for growth; supporting the 12
outsourcing optimization process with Inergi; implementation of the Enterprise Content 13
Management project for record retention; and selection and implementation of more self 14
service products for end users. In addition to the above, project support and control 15
functions will provide QA/QC review and compliance verification on 3rd party work. 16
17
Expenditures include the formation of the Enablement department into IT from Finance 18
starting mid way through 2008. Enablement costs in 2011 and 2012 are estimated at $7.9 19
million and $8.1 million respectively. Year-over year increases are to support new 20
enterprise application functions as they are configured and commissioned. 21
22
The Enablement group is the corporate owner for the SAP application and they are 23
accountable for process and data management, performance improvement, and training 24
and business solutions related to the systems and processes implemented by the various 25
phases of the Cornerstone program. The Enablement group supports the organization in 26
the effective and efficient use of the SAP system. 27
28

Filed: May 19, 2010 EB-2010-0002 Exhibit C1 Tab 2 Schedule 9 Page 21 of 21
The Enablement group will drive productivity through enterprise process improvements 1
and will ensure Hydro One leverages and consolidates legacy applications into SAP and 2
associated systems. This will include adding new functionality where it delivers 3
increased end user productivity, quality of work, and other measurable business 4
improvements. It will also govern data as an asset and drive better analysis and decision 5
making. The costs include staff and other expenses to provide technical expertise, 6
business analysis, problem solving, governance, and continuous improvement to deliver 7
these accountabilities. 8