
10 Noise and Vibration - Transport Scotland Noise and Vibration 10.1 Introduction 10.1.1 This...
29
A9/A96 Inshes to Smithton DMRB Stage 2 Scheme Assessment Report Part 3: Environmental Assessment Page 10-1 10 Noise and Vibration 10.1 Introduction 10.1.1 This chapter presents the Design Manual for Roads and Bridges (DMRB) Stage 2 assessment of the expected noise and vibration impacts arising from each of the route options on the nearest sensitive receptors (such as residential properties, schools, hospitals and care homes). 10.1.2 The assessment includes the following: baseline conditions within the calculation area; potential impacts of each of the route options with regard to the identified baseline conditions; outline of the possible number of properties for which mitigation measures would be considered for each of the route options; and a summary of the types of mitigation that could be incorporated into the DMRB Stage 3 design for the preferred option. 10.1.3 The assessment is supported by the following appendices, which can be found in Part 6 (Appendices) of this report: Appendix A10.1 Noise and Vibration – Introduction and Terms; Appendix A10.2 Predicted Road Traffic Noise Levels at Sample Noise Sensitive Receptors (NSRs); and Appendix A10.3 Predicted Changes in Road Traffic Noise Levels at Noise Sensitive Outdoor Areas. 10.2 Approach and Methods Scope and Guidance 10.2.1 The assessment of road traffic noise and vibration is carried out according to established prediction and assessment methodologies that are governed or guided by the following key documents: DMRB Volume 11, Section 3, Part 7, HD213/11: Noise and Vibration (Highways Agency, Transport Scotland, Welsh Assembly Government and The Department for Regional Development Northern Ireland 2011) (hereafter DMRB HD213/11); DMRB Volume 11, Section 2, Part 5, HA205/08: Assessment and Management of Environmental Effects (Highways Agency, Scottish Government, Welsh Assembly Government and The Department for Regional Development Northern Ireland 2008); and Calculation of Road Traffic Noise (CRTN) (Department of Transport Welsh Office 1988) (hereafter CRTN). 10.2.2 In consideration of mitigation, reference was made to the advice contained in the document ‘Guidance for possible measures to manage noise from road and rail’ (The Scottish Government 2016). Study Area 10.2.3 The study area for the noise assessment was defined in accordance with DMRB HD213/11. 10.2.4 The calculation area is defined as the total area within the following 600m boundaries: route option; bypassed routes on the A96 Aberdeen – Inverness Trunk Road and A9; and
Transcript of 10 Noise and Vibration - Transport Scotland Noise and Vibration 10.1 Introduction 10.1.1 This...
A9/A96 Inshes to Smithton
DMRB Stage 2 Scheme Assessment Report
Part 3: Environmental Assessment
Page 10-1
10 Noise and Vibration
10.1 Introduction
10.1.1 This chapter presents the Design Manual for Roads and Bridges (DMRB) Stage 2 assessment ofthe expected noise and vibration impacts arising from each of the route options on the nearestsensitive receptors (such as residential properties, schools, hospitals and care homes).
10.1.2 The assessment includes the following:
baseline conditions within the calculation area;
potential impacts of each of the route options with regard to the identified baseline conditions;
outline of the possible number of properties for which mitigation measures would be consideredfor each of the route options; and
a summary of the types of mitigation that could be incorporated into the DMRB Stage 3 designfor the preferred option.
10.1.3 The assessment is supported by the following appendices, which can be found in Part 6(Appendices) of this report:
Appendix A10.1 Noise and Vibration – Introduction and Terms;
Appendix A10.2 Predicted Road Traffic Noise Levels at Sample Noise Sensitive Receptors(NSRs); and
Appendix A10.3 Predicted Changes in Road Traffic Noise Levels at Noise Sensitive OutdoorAreas.
10.2 Approach and Methods
Scope and Guidance
10.2.1 The assessment of road traffic noise and vibration is carried out according to established predictionand assessment methodologies that are governed or guided by the following key documents:
DMRB Volume 11, Section 3, Part 7, HD213/11: Noise and Vibration (Highways Agency,Transport Scotland, Welsh Assembly Government and The Department for RegionalDevelopment Northern Ireland 2011) (hereafter DMRB HD213/11);
DMRB Volume 11, Section 2, Part 5, HA205/08: Assessment and Management ofEnvironmental Effects (Highways Agency, Scottish Government, Welsh Assembly Governmentand The Department for Regional Development Northern Ireland 2008); and
Calculation of Road Traffic Noise (CRTN) (Department of Transport Welsh Office 1988)(hereafter CRTN).
10.2.2 In consideration of mitigation, reference was made to the advice contained in the document‘Guidance for possible measures to manage noise from road and rail’ (The Scottish Government2016).
Study Area
10.2.3 The study area for the noise assessment was defined in accordance with DMRB HD213/11.
10.2.4 The calculation area is defined as the total area within the following 600m boundaries:
route option;
bypassed routes on the A96 Aberdeen – Inverness Trunk Road and A9; and
A9/A96 Inshes to Smithton
DMRB Stage 2 Scheme Assessment Report
Part 3: Environmental Assessment
Page 10-2
roads, within 1km of the route options and bypassed routes, on the existing road network thatare predicted to result in noise changes of 1dB in the modelled opening year or 3dB in themodelled design year.
10.2.5 DMRB HD213/11 also requires consideration beyond the calculation area, to take into account thelikely noise impacts on the wider road network (considered in terms of change in basic noise level(BNL)). This is required for any roads where there is a 1dB increase or decrease in noise in themodelled opening year and/or a 3dB increase or decrease in the modelled design year incomparison with the modelled opening year. At this stage of the assessment process, BNLs havenot been calculated for each of the route options and therefore the likely noise impacts on the widerroad network have not been considered. This is discussed further in the limitations section(paragraphs 10.2.41 to 10.2.46).
Baseline Data
10.2.6 The future assessment year scenarios available from the Moray Firth Transport Model (MFTM) forthe DMRB Stage 2 noise assessment are the modelled opening year of 2021 and the modelleddesign year of 2036. These are not necessarily the actual opening and design years of thescheme. Further details of the transport modelling are provided in Part 4 (Traffic and EconomicAssessment).
10.2.7 Much of the area through which the route options pass is currently rural and is likely to have arelatively low existing baseline noise climate, although future development in this area isanticipated (as described in Chapter 8: Policies and Plans). However, most of the Noise SensitiveReceptors (NSRs) nearest to the route options are in residential areas, where existing baselinenoise levels may be higher due to higher levels of noise generated by human activity, includingroad traffic noise. The significance of road traffic noise on existing baseline noise levels will bedependent on distance to trafficked roads, and the traffic flow, composition and speed on thoseroads.
10.2.8 Baseline noise monitoring has not been undertaken for the route options at this stage, since it isnot required for the Simple Assessment (as defined in DMRB HD213/11) that has been undertakenfor the DMRB Stage 2 assessment. Instead, baseline (or Do-Minimum (DM)) noise levels havebeen established using predicted traffic data for the modelled opening year (2021), without theroute options in place. This may underestimate the overall noise levels at NSRs in more rurallocations away from busy roads with free-flowing traffic. This is discussed further in the limitationssection (paragraphs 10.2.41 to 10.2.46). Baseline noise monitoring will be undertaken for theDMRB Stage 3 noise and vibration assessment of the preferred option.
Impact Assessment
10.2.9 Disruption caused during the construction phase of the route options has the potential to impactresidents and other sensitive receptors adjacent to the works. Both DMRB HD213/11 and theScottish Government publication ‘Technical Advice Note (TAN) - Assessment of Noise’ (TheScottish Government 2011b) advise on the use of BS 5228 ‘Code of Practice for Noise andVibration Control on Construction and Open Sites’ to assess and control noise and vibration fromconstruction activities (British Standards Institution 2014a; British Standards Institution 2014b).
10.2.10 At present, there is no construction programme, nor details of likely construction plant andequipment to be used available to assist in carrying out detailed construction noise predictions.Therefore, an assessment of construction noise impacts cannot be carried out at this stage.Construction noise predictions would be carried out during the DMRB Stage 3 assessment, when apreferred option has been identified and a more detailed scheme design is available. Predictedimpacts would be assessed against the criteria set out in BS 5228-1 Method 2 (British StandardsInstitution 2014a).
10.2.11 The assessment of noise levels during operation (e.g. road traffic noise) at various noise sensitivereceivers has followed the Simple Assessment methodology outlined in DMRB HD213/11. The

A9/A96 Inshes to Smithton
DMRB Stage 2 Scheme Assessment Report
Part 3: Environmental Assessment
Page 10-3
assessment considers the noise and vibration climate both with and without the route options,referred to as the Do-Something (DS) and DM, respectively.
Noise Model Assumptions
10.2.12 Noise levels have been calculated at NSRs (residential dwellings and other sensitive receptors)within the calculation area as defined in paragraph 10.2.4. DMRB HD231/11 provides examples ofNSRs. Examples of other sensitive receptors include hospitals, schools, community facilities,designated areas (e.g. National Scenic Area, National Park, Special Area of conservation (SAC),Special Protection Area (SPA), Site of Special Scientific Interest (SSSI), Scheduled Monument)and public rights of way such as footpaths.
10.2.13 This assessment considers noise level changes at NSRs according to their existing baselinefaçade noise levels. It should be noted that in this context, the baseline is considered to be the DMscenario in the modelled opening year (2021).
10.2.14 The following comparisons are made:
DM scenario in the modelled opening year (2021) against DS scenario in the modelled openingyear (2021); and
DM scenario in modelled opening year (2021) against DS scenario in the modelled design year(2036).
10.2.15 The design year is that defined as the year within the first 15 years of the modelled opening yearwhere traffic flows are greatest. Therefore, the design year is usually 15 years after the modelledopening year, which in this assessment is 2036, which is the year considered.
10.2.16 Consideration has also been given to night-time noise levels in accordance with DMRB HD213/11.Consideration is given to those receptors that are predicted to experience a Lnight,outside noise level of55dB or greater in any scenario.
10.2.17 In the absence of hourly traffic data, Method 3 within the Transport Research Laboratory (TRL)Report ‘Converting the UK traffic noise index LA10,18h to EU noise indices for noise mapping’ (Abbotand Nelson 2002) has been used to determine estimated night-time levels from daytime 18-hourAnnual Average Weekday Traffic (AAWT) flows. The estimated night-time levels are dependentupon whether the road is classified as a ‘Motorway’ or ‘Non Motorway’. In general, for ‘Motorways’,the estimated night-time noise levels using Method 3 are slightly lower than the daytime levels, torepresent the relatively consistent use of the motorway network during all periods (day, eveningand night). For ‘Non Motorways’, estimated night-time noise levels are considerably lower thandaytime levels, which is generally consistent with traffic usage on these types of road.
10.2.18 The night-time noise predictions presented in this assessment have assumed that the proposedroad is classified as a ‘Non-Motorway’ and the following comparison is made:
DM scenario in modelled opening year (2021) against DS scenario in the modelled design year(2036).
10.2.19 At the time of writing, the A96 Dualling Inverness to Nairn (including Nairn Bypass) scheme has notbeen constructed. For the purposes of this assessment, it has been assumed that the A9/A96Inshes to Smithton scheme will join this new road. Therefore, the design outlined in the draftorders for the A96 Dualling Inverness to Nairn (including Nairn Bypass) scheme has been includedin both the DM and the DS scenarios, as it is assumed it would be operational on the modelledyear of opening.
10.2.20 Noise levels at receptors have been calculated using the CadnaA® noise modelling package,which incorporates the methodology contained in the CRTN (1988). CRTN is a technicalmemorandum produced by the Department for Transport and Welsh Office providing a method forpredicting road traffic noise in the United Kingdom.
A9/A96 Inshes to Smithton
DMRB Stage 2 Scheme Assessment Report
Part 3: Environmental Assessment
Page 10-4
10.2.21 Noise level predictions take account of typical weekday volumes of traffic during the eighteen-hourperiod from 6am to midnight (18-hour AAWT flows) and the following variables:
percentage of Heavy Goods Vehicles (HGVs);
traffic speeds;
road gradient;
local topography;
nature of the ground cover between the road and the receptor;
shielding effects of any intervening structures, including allowances for limited angles of viewfrom the road and any reflection effects from relevant surfaces; and
road surfacing type.
10.2.22 It has been assumed that the road surface on the existing road network is conventional hot rolledasphalt (HRA) with a texture depth of 2mm, in both the modelled opening and design years. Forthe route options, it has been assumed that a low noise road surface (LNRS) would be used for sliproads with an 18-hour AAWT vehicle speed of greater than or equal to 75kph, but not for themainlines of the route options (where 18-hour AAWT vehicle speeds would be less than 75kph),which is modelled as HRA, or any altered local roads, such those altered to connect to themainlines of the route options or those gaining or losing a lane, which remain as HRA. A LNRShas also been assumed for the mainline and slip roads for the A96 Dualling Inverness to Nairn(including Nairn Bypass) (Jacobs 2016). The roads which have a LNRS have been assumed tohave an associated surface correction in line with the maximum allowable correction containedwithin DMRB HD213/11, as detailed below.
10.2.23 DMRB HD213/11 provides specific guidance in relation to the noise level correction that should beapplied when using LNRS for new carriageways. It states that, ‘where new carriageways are to beconstructed and a thin surfacing system [low noise surfacing] used, or where an existing surface isto be replaced with a thin surfacing system, a -3.5dB(A) correction should be assumed for the thinsurface system [equivalent to a Road Surface Influence (RSI) of -5dB(A)] unless any information isavailable regarding the specific surface to be installed. This advice applies where the mean trafficspeed is >= 75kph. Where the mean speed is < 75kph, a -1dB(A) correction should be applied to anew low-noise surface’.
10.2.24 In line with DMRB HD213/11, a minimum traffic speed of 20kph is used in the noise model wherethe traffic model predictions provide speeds less than this.
10.2.25 Within the traffic modelling data provided for each of the route options, there are some road linkson which a traffic flow of <1,000 vehicles (18-hour AAWT flow) are detailed. CRTN paragraph 30provides guidance on the reliability of low traffic flows and states that calculations of noise level fortraffic flows below 1,000 vehicles (18-hour AAWT) are unreliable. As such, a number ofassumptions have been made for this assessment:
where, for a particular road link, the traffic flows for all years assessed are all <1,000 vehicles(18-hour AAWT flow), the flow for each scenario is assumed to be zero vehicles, i.e. the road isnot included in the assessment; and
where, for a particular road link, the traffic flows vary around the threshold level of 1,000vehicles (e.g. DM 2021 = 900 and DS 2021 = 1,100), the traffic flows which are <1,000 vehicles(18-hour AAWT flow) are also included in the assessment. This approach is taken to avoidexaggerating any increase or reduction in noise which would occur if one of the traffic flows wasassumed to be zero.
10.2.26 Horizontal and vertical alignment information of the route options and surrounding areas werederived from the three dimensional model of the DMRB Stage 2 route option designs.
A9/A96 Inshes to Smithton
DMRB Stage 2 Scheme Assessment Report
Part 3: Environmental Assessment
Page 10-5
10.2.27 Identification of sensitive receptors is based on Ordnance Survey (OS) MasterMap and AddressBase Plus data purchased in October 2013. Existing building heights are assumed to be 8m high,except for ‘small buildings’ (defined as those with a building footprint area of less than 20m2 and anarea divided by the perimeter of less than 1.21), which were assumed to be 3m high.
10.2.28 Existing ground (acoustic) absorption has been derived from OS MasterMap data. For thepurposes of the route option comparison undertaken for this DMRB Stage 2 assessment, theground within each route option boundary has been assumed to be hard ground. The groundabsorption within the route option boundary will be modelled in more detail during the DMRB Stage3 noise and vibration assessment of the preferred option.
10.2.29 Road traffic noise levels have been calculated at NSRs at ground floor and first floor levels, at 1.5mand 4m height, respectively.
10.2.30 Where applicable, noise levels at sensitive receptors have been predicted at a distance of 1m fromthe most exposed façade and include a 2.5dB façade correction. Noise levels for sensitivereceptors positioned in open spaces and for the night-time period are free-field.
10.2.31 For open, outdoor space sensitive receptors, such as park and other recreational areas, thechange in road traffic noise levels has been calculated across the whole of the sensitive area. Theresults for open, outdoor spaces are presented in terms of the proportion of each space that eachmagnitude of impact category is predicted to cover.
Assessment of Impact
Introduction
10.2.32 It should be noted that whilst DMRB HD213/11 provides guidance for the magnitude of noise levelchanges it does not provide any guidance on assessing the significance of noise effects.Accordingly, the reported noise impacts have been assessed using the significance of noise impactscale provided in the Scottish Government’s TAN (The Scottish Government 2011b), whichaccompanies PAN 1/2011 (The Scottish Government 2011a). The significance of impact matrix isbased on the predicted noise levels, the magnitude of noise level change between each scenario(based on the magnitude of impact tables) and the sensitivity of noise receptors (presented in theTAN).
Sensitivity of Noise Sensitive Receptors
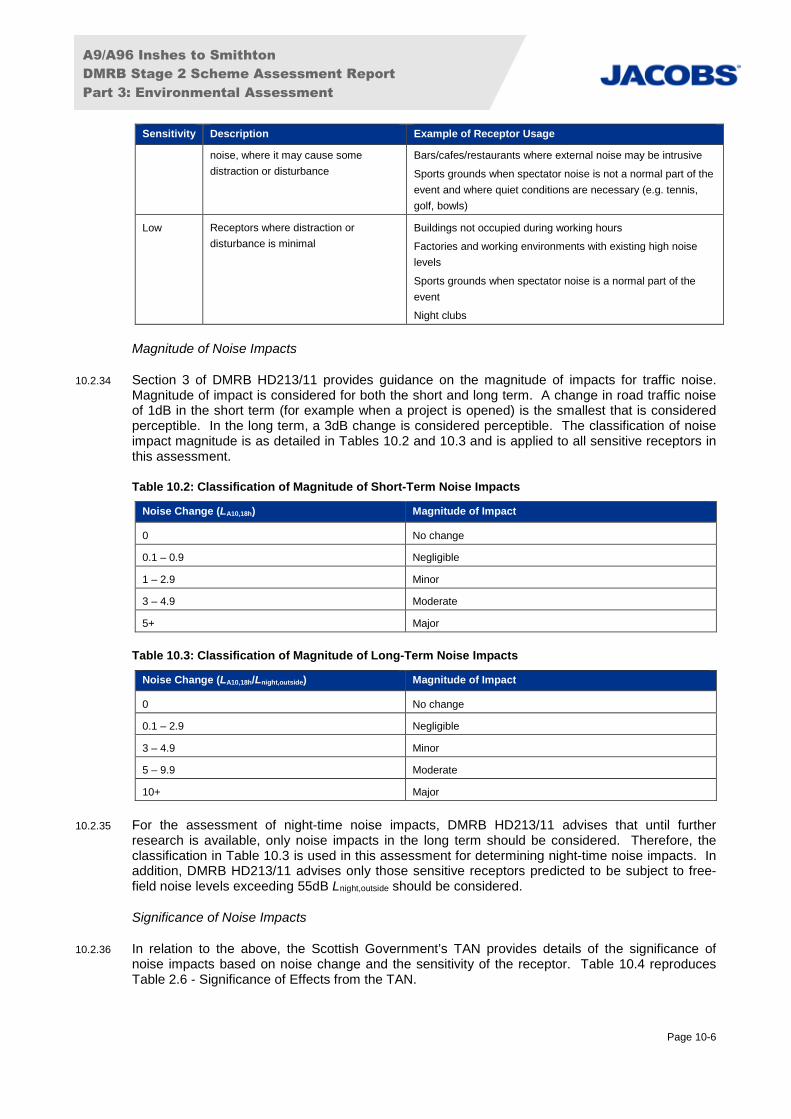
10.2.33 The sensitivity of NSRs to road traffic noise has been determined based on the criteria provided inTable 10.1 (reproduced from TAN Table 2.1).
Table 10.1: Criteria Used to Define Noise Sensitive Receptors
Sensitivity Description Example of Receptor Usage
High Receptors where people or operations
are particularly susceptible to noise
Residential, including private gardens where appropriate
Quiet outdoor areas used for recreation
Conference facilities
Theatres/auditoria/studios
Schools during the daytime
Hospitals/residential care homes
Places of worship
Medium Receptors moderately sensitive to Offices
1 As defined in ‘Facilitation of Strategic Noise Mapping for the Environmental Noise Directive 2002/49/EC Implementation’, ScottishExecutive Environmental Group, 2005.
A9/A96 Inshes to Smithton
DMRB Stage 2 Scheme Assessment Report
Part 3: Environmental Assessment
Page 10-6
Sensitivity Description Example of Receptor Usage
noise, where it may cause some
distraction or disturbance
Bars/cafes/restaurants where external noise may be intrusive
Sports grounds when spectator noise is not a normal part of the
event and where quiet conditions are necessary (e.g. tennis,
golf, bowls)
Low Receptors where distraction or
disturbance is minimal
Buildings not occupied during working hours
Factories and working environments with existing high noise
levels
Sports grounds when spectator noise is a normal part of the
event
Night clubs
Magnitude of Noise Impacts
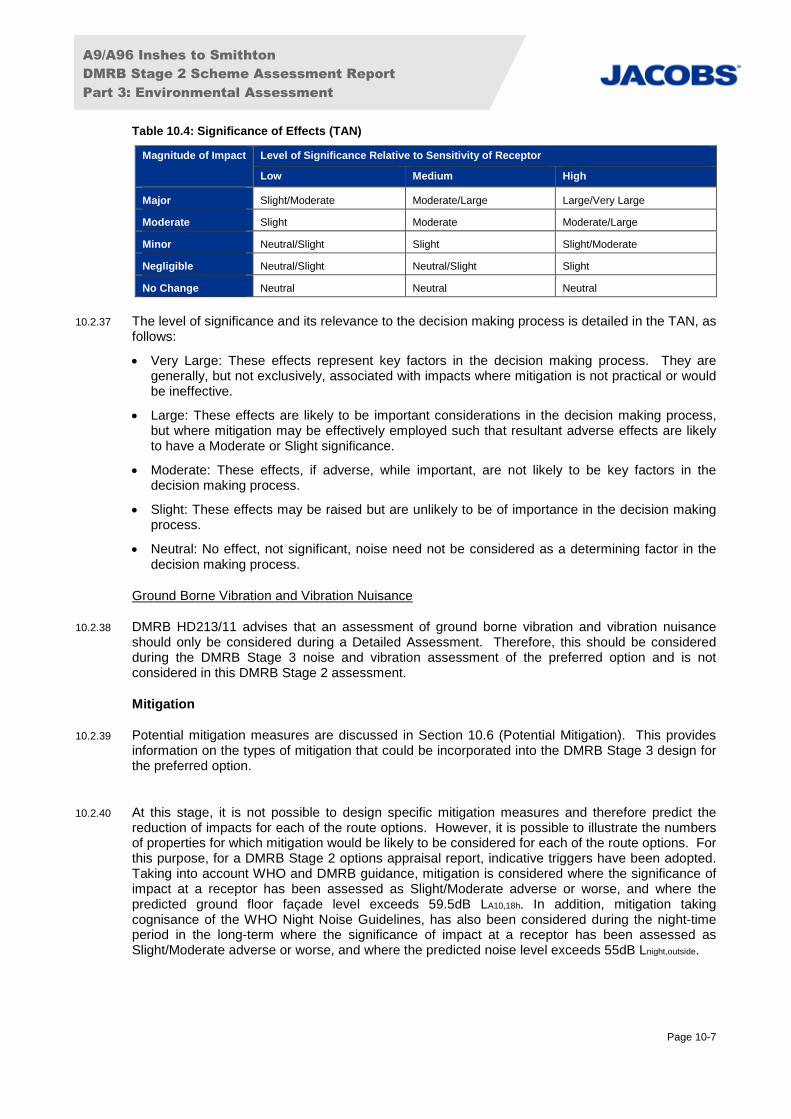
10.2.34 Section 3 of DMRB HD213/11 provides guidance on the magnitude of impacts for traffic noise.Magnitude of impact is considered for both the short and long term. A change in road traffic noiseof 1dB in the short term (for example when a project is opened) is the smallest that is consideredperceptible. In the long term, a 3dB change is considered perceptible. The classification of noiseimpact magnitude is as detailed in Tables 10.2 and 10.3 and is applied to all sensitive receptors inthis assessment.
Table 10.2: Classification of Magnitude of Short-Term Noise Impacts
Noise Change (LA10,18h) Magnitude of Impact
0 No change
0.1 – 0.9 Negligible
1 – 2.9 Minor
3 – 4.9 Moderate
5+ Major
Table 10.3: Classification of Magnitude of Long-Term Noise Impacts
Noise Change (LA10,18h/Lnight,outside) Magnitude of Impact
0 No change
0.1 – 2.9 Negligible
3 – 4.9 Minor
5 – 9.9 Moderate
10+ Major
10.2.35 For the assessment of night-time noise impacts, DMRB HD213/11 advises that until furtherresearch is available, only noise impacts in the long term should be considered. Therefore, theclassification in Table 10.3 is used in this assessment for determining night-time noise impacts. Inaddition, DMRB HD213/11 advises only those sensitive receptors predicted to be subject to free-field noise levels exceeding 55dB Lnight,outside should be considered.
Significance of Noise Impacts
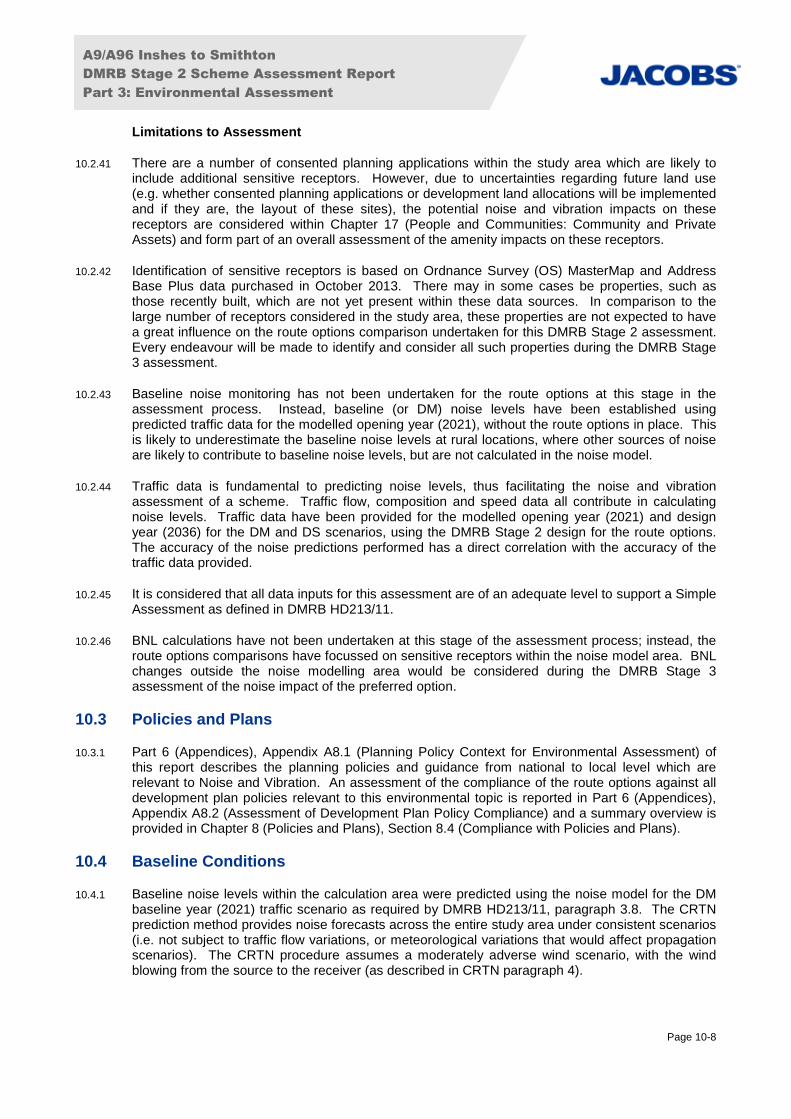
10.2.36 In relation to the above, the Scottish Government’s TAN provides details of the significance ofnoise impacts based on noise change and the sensitivity of the receptor. Table 10.4 reproducesTable 2.6 - Significance of Effects from the TAN.
A9/A96 Inshes to Smithton
DMRB Stage 2 Scheme Assessment Report
Part 3: Environmental Assessment
Page 10-7
Table 10.4: Significance of Effects (TAN)
Magnitude of Impact Level of Significance Relative to Sensitivity of Receptor
Low Medium High
Major Slight/Moderate Moderate/Large Large/Very Large
Moderate Slight Moderate Moderate/Large
Minor Neutral/Slight Slight Slight/Moderate
Negligible Neutral/Slight Neutral/Slight Slight
No Change Neutral Neutral Neutral
10.2.37 The level of significance and its relevance to the decision making process is detailed in the TAN, asfollows:
Very Large: These effects represent key factors in the decision making process. They aregenerally, but not exclusively, associated with impacts where mitigation is not practical or wouldbe ineffective.
Large: These effects are likely to be important considerations in the decision making process,but where mitigation may be effectively employed such that resultant adverse effects are likelyto have a Moderate or Slight significance.
Moderate: These effects, if adverse, while important, are not likely to be key factors in thedecision making process.
Slight: These effects may be raised but are unlikely to be of importance in the decision makingprocess.
Neutral: No effect, not significant, noise need not be considered as a determining factor in thedecision making process.
Ground Borne Vibration and Vibration Nuisance
10.2.38 DMRB HD213/11 advises that an assessment of ground borne vibration and vibration nuisanceshould only be considered during a Detailed Assessment. Therefore, this should be consideredduring the DMRB Stage 3 noise and vibration assessment of the preferred option and is notconsidered in this DMRB Stage 2 assessment.
Mitigation
10.2.39 Potential mitigation measures are discussed in Section 10.6 (Potential Mitigation). This providesinformation on the types of mitigation that could be incorporated into the DMRB Stage 3 design forthe preferred option.
10.2.40 At this stage, it is not possible to design specific mitigation measures and therefore predict thereduction of impacts for each of the route options. However, it is possible to illustrate the numbersof properties for which mitigation would be likely to be considered for each of the route options. Forthis purpose, for a DMRB Stage 2 options appraisal report, indicative triggers have been adopted.Taking into account WHO and DMRB guidance, mitigation is considered where the significance ofimpact at a receptor has been assessed as Slight/Moderate adverse or worse, and where thepredicted ground floor façade level exceeds 59.5dB LA10,18h. In addition, mitigation takingcognisance of the WHO Night Noise Guidelines, has also been considered during the night-timeperiod in the long-term where the significance of impact at a receptor has been assessed asSlight/Moderate adverse or worse, and where the predicted noise level exceeds 55dB Lnight,outside.
A9/A96 Inshes to Smithton
DMRB Stage 2 Scheme Assessment Report
Part 3: Environmental Assessment
Page 10-8
Limitations to Assessment
10.2.41 There are a number of consented planning applications within the study area which are likely toinclude additional sensitive receptors. However, due to uncertainties regarding future land use(e.g. whether consented planning applications or development land allocations will be implementedand if they are, the layout of these sites), the potential noise and vibration impacts on thesereceptors are considered within Chapter 17 (People and Communities: Community and PrivateAssets) and form part of an overall assessment of the amenity impacts on these receptors.
10.2.42 Identification of sensitive receptors is based on Ordnance Survey (OS) MasterMap and AddressBase Plus data purchased in October 2013. There may in some cases be properties, such asthose recently built, which are not yet present within these data sources. In comparison to thelarge number of receptors considered in the study area, these properties are not expected to havea great influence on the route options comparison undertaken for this DMRB Stage 2 assessment.Every endeavour will be made to identify and consider all such properties during the DMRB Stage3 assessment.
10.2.43 Baseline noise monitoring has not been undertaken for the route options at this stage in theassessment process. Instead, baseline (or DM) noise levels have been established usingpredicted traffic data for the modelled opening year (2021), without the route options in place. Thisis likely to underestimate the baseline noise levels at rural locations, where other sources of noiseare likely to contribute to baseline noise levels, but are not calculated in the noise model.
10.2.44 Traffic data is fundamental to predicting noise levels, thus facilitating the noise and vibrationassessment of a scheme. Traffic flow, composition and speed data all contribute in calculatingnoise levels. Traffic data have been provided for the modelled opening year (2021) and designyear (2036) for the DM and DS scenarios, using the DMRB Stage 2 design for the route options.The accuracy of the noise predictions performed has a direct correlation with the accuracy of thetraffic data provided.
10.2.45 It is considered that all data inputs for this assessment are of an adequate level to support a SimpleAssessment as defined in DMRB HD213/11.
10.2.46 BNL calculations have not been undertaken at this stage of the assessment process; instead, theroute options comparisons have focussed on sensitive receptors within the noise model area. BNLchanges outside the noise modelling area would be considered during the DMRB Stage 3assessment of the noise impact of the preferred option.
10.3 Policies and Plans
10.3.1 Part 6 (Appendices), Appendix A8.1 (Planning Policy Context for Environmental Assessment) ofthis report describes the planning policies and guidance from national to local level which arerelevant to Noise and Vibration. An assessment of the compliance of the route options against alldevelopment plan policies relevant to this environmental topic is reported in Part 6 (Appendices),Appendix A8.2 (Assessment of Development Plan Policy Compliance) and a summary overview isprovided in Chapter 8 (Policies and Plans), Section 8.4 (Compliance with Policies and Plans).
10.4 Baseline Conditions
10.4.1 Baseline noise levels within the calculation area were predicted using the noise model for the DMbaseline year (2021) traffic scenario as required by DMRB HD213/11, paragraph 3.8. The CRTNprediction method provides noise forecasts across the entire study area under consistent scenarios(i.e. not subject to traffic flow variations, or meteorological variations that would affect propagationscenarios). The CRTN procedure assumes a moderately adverse wind scenario, with the windblowing from the source to the receiver (as described in CRTN paragraph 4).
A9/A96 Inshes to Smithton
DMRB Stage 2 Scheme Assessment Report
Part 3: Environmental Assessment
Page 10-9
10.4.2 Due to the large number of receptors within the calculation area (over 5,000), the predictedbaseline noise levels have not been provided in this section, but have been used in theassessment to determine noise changes on scheme opening and in the long term. The baselinenoise levels for a sample of noise sensitive receptors are provided in the DM 2021 column of theresults tables in Section 10.5 (Impact Assessment).
10.4.3 The noise environment in parts of the calculation area are likely to be dominated by traffic noise (atlocations close to the residential areas of Inshes, Westhill and Smithton, and close to the existingA9 Perth – Inverness Trunk Road and A96 Aberdeen – Inverness Trunk Road), and thereforepredictable using the road traffic noise model.
10.4.4 From maps and satellite imagery, other locations are currently rural and appear to have relativelyfew sources of road traffic in the area. The noise climate at such locations are likely to beinfluenced by farming activities, birdsong and other local noise sources, as well as distanttransportation noise. Baseline noise monitoring at representative sensitive receptors would beperformed at a later stage in the assessment process, once a preferred option for the scheme hasbeen identified.
10.4.5 In accordance with the Environmental Noise Directive 2002/49/EC (END), a series of Noise ActionPlans have been prepared by the Scottish Government for the largest Scottish Cities and transportroutes, published in 2014. The geographical scope for Transportation Noise Action Plans isdetermined by the location of roads with more than three million vehicle passages a year.
10.4.6 The sections of the A9 Perth – Inverness Trunk Road and A96 Aberdeen – Inverness Trunk Roadnear Inverness were included in the noise mapping exercise and subsequent Transportation NoiseAction Plan. The two nearest Candidate Noise Management Areas (CNMA) are Telford Street andBank Street in Inverness. However, both of these are outwith the calculation area for the routeoptions under assessment.
10.5 Impact Assessment
Introduction
10.5.1 The potential impacts are reported in line with the following:
With the exception of the inclusion of a LNRS on slip roads as described in paragraph 10.2.22,the potential impacts are described without mitigation and therefore represent a worst-casescenario. Mitigation to reduce these impacts will be developed for the preferred option duringthe DMRB Stage 3 assessment.
Potential impacts are presented during operation only. Construction impacts have not beenconsidered as part of this DMRB Stage 2 assessment as no construction programme, or detailsof likely construction plant and equipment to be used is available. This will be progressed aspart of the DMRB Stage 3 assessment following development of the preferred option.
A large number of factors influence predicted noise levels at nearby sensitive receptors,including traffic flows, composition, speeds, relative heights of source and receptors, roadgradients, type of intervening ground and screening. With such a multitude of factors, noiseimpacts can be quite variable even for a given group of receptors within a single area. As such,it is expected that there will be very few impacts which are common to all (i.e. where the changein noise level will be the same). Therefore, no common to all impacts have been reported, withall impacts reported collectively for each route option.
Due to the large number of receptors potentially impacted by each of the route options, theimpacts have not been listed separately against each receptor. The assessment approach isconcerned with the total numbers of receptors impacted by the route options in each impactcategory, and not where those receptors are specifically located within the calculation area.However, to provide examples of the predicted changes in absolute noise levels, the predictedroad traffic noise levels are presented for a sample of NSRs.
A9/A96 Inshes to Smithton
DMRB Stage 2 Scheme Assessment Report
Part 3: Environmental Assessment
Page 10-10
Based on the assessment methodology detailed within DMRB HD213/11, noise calculationareas have been determined individually for each of the route options. These calculation areashave been merged into a single, overall calculation area, and used in the noise assessment foreach route option, so that the total numbers of receptors considered for each route option is thesame.
The methodology for calculating the noise changes for each option is based on the assessmentat the least beneficial façade. DMRB HD213/11 states:
‘It is acknowledged that the results from this assessment may often show the worst case andhighlight mainly the adverse impacts of a road project. Where the road project has beneficialimpacts that are not clear from the assessment these should be reported by the OverseeingOrganisation’s supply chain’.
10.5.2 Therefore, the DM noise level is presented for each option, as it can change from scenario toscenario depending on which façade is the least beneficial for each option.
10.5.3 To provide context to the impact assessment, an overview of the potential impacts for roadschemes in relation to noise are discussed below.
10.5.4 During operation, noise changes are experienced where there are new or removed roads, changesin horizontal or vertical alignments, changes in traffic flows, speeds or composition, increased ordecreased screening and changes in road surfacing type.
10.5.5 Adverse residual operational noise and vibration impacts would be permanent in nature and ingeneral terms, where a new road is constructed and results in road traffic being moved closer to asensitive receptor, an adverse impact will occur (assuming no noise mitigation and all variablesotherwise remain constant). The variables include (but are not limited to):
distance between the new road and the NSRs;
traffic flow, composition, speed, and road running surface; and
presence of existing/proposed screening of the road noise source.
10.5.6 Beneficial operational noise impacts would be permanent in nature and are likely to occur wherethe road traffic is relocated further away from receptors.
Impact on Sample Noise Sensitive Receptors
Location of Sample Noise Sensitive Receptors
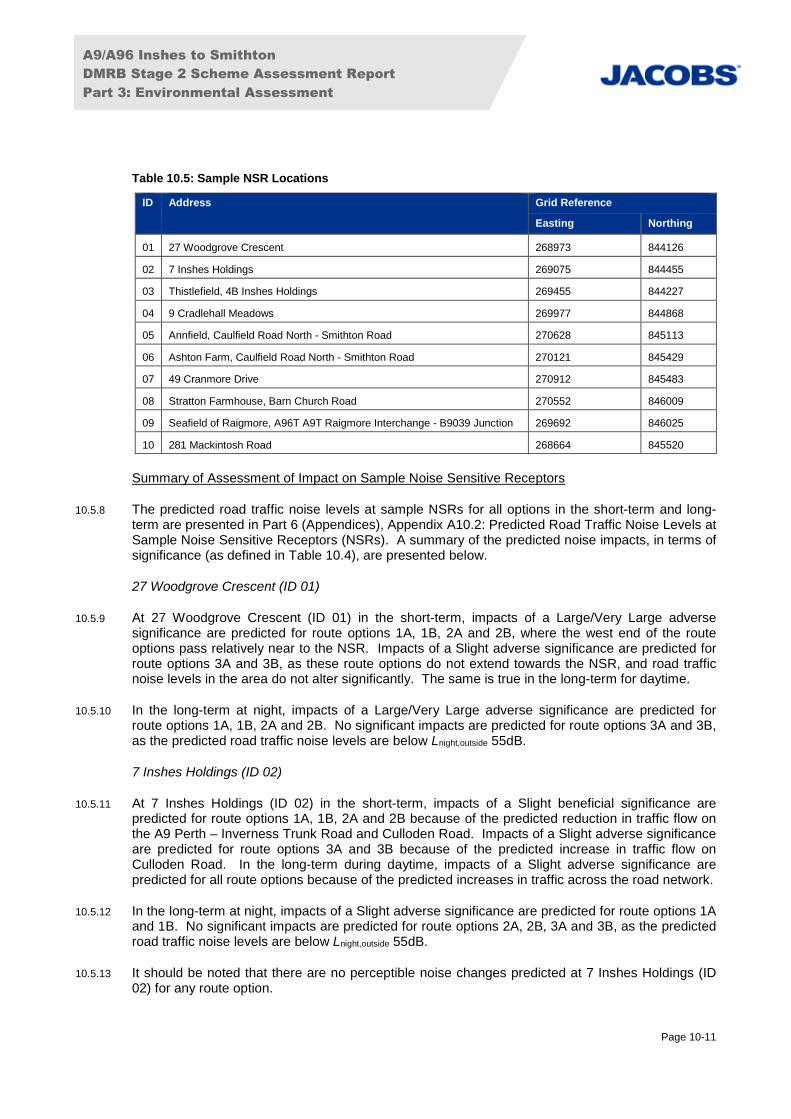
10.5.7 Predicted road traffic noise levels have been presented for the sample NSRs identified in Table10.5. The sample NSRs were selected examples of the predicted changes in road traffic noiselevels near to and along the length of the route options and bypassed routes. The locations of thesample NSRs are highlighted in Figure 10.1.
A9/A96 Inshes to Smithton
DMRB Stage 2 Scheme Assessment Report
Part 3: Environmental Assessment
Page 10-11
Table 10.5: Sample NSR Locations
ID Address Grid Reference
Easting Northing
01 27 Woodgrove Crescent 268973 844126
02 7 Inshes Holdings 269075 844455
03 Thistlefield, 4B Inshes Holdings 269455 844227
04 9 Cradlehall Meadows 269977 844868
05 Annfield, Caulfield Road North - Smithton Road 270628 845113
06 Ashton Farm, Caulfield Road North - Smithton Road 270121 845429
07 49 Cranmore Drive 270912 845483
08 Stratton Farmhouse, Barn Church Road 270552 846009
09 Seafield of Raigmore, A96T A9T Raigmore Interchange - B9039 Junction 269692 846025
10 281 Mackintosh Road 268664 845520
Summary of Assessment of Impact on Sample Noise Sensitive Receptors
10.5.8 The predicted road traffic noise levels at sample NSRs for all options in the short-term and long-term are presented in Part 6 (Appendices), Appendix A10.2: Predicted Road Traffic Noise Levels atSample Noise Sensitive Receptors (NSRs). A summary of the predicted noise impacts, in terms ofsignificance (as defined in Table 10.4), are presented below.
27 Woodgrove Crescent (ID 01)
10.5.9 At 27 Woodgrove Crescent (ID 01) in the short-term, impacts of a Large/Very Large adversesignificance are predicted for route options 1A, 1B, 2A and 2B, where the west end of the routeoptions pass relatively near to the NSR. Impacts of a Slight adverse significance are predicted forroute options 3A and 3B, as these route options do not extend towards the NSR, and road trafficnoise levels in the area do not alter significantly. The same is true in the long-term for daytime.
10.5.10 In the long-term at night, impacts of a Large/Very Large adverse significance are predicted forroute options 1A, 1B, 2A and 2B. No significant impacts are predicted for route options 3A and 3B,as the predicted road traffic noise levels are below Lnight,outside 55dB.
7 Inshes Holdings (ID 02)
10.5.11 At 7 Inshes Holdings (ID 02) in the short-term, impacts of a Slight beneficial significance arepredicted for route options 1A, 1B, 2A and 2B because of the predicted reduction in traffic flow onthe A9 Perth – Inverness Trunk Road and Culloden Road. Impacts of a Slight adverse significanceare predicted for route options 3A and 3B because of the predicted increase in traffic flow onCulloden Road. In the long-term during daytime, impacts of a Slight adverse significance arepredicted for all route options because of the predicted increases in traffic across the road network.
10.5.12 In the long-term at night, impacts of a Slight adverse significance are predicted for route options 1Aand 1B. No significant impacts are predicted for route options 2A, 2B, 3A and 3B, as the predictedroad traffic noise levels are below Lnight,outside 55dB.
10.5.13 It should be noted that there are no perceptible noise changes predicted at 7 Inshes Holdings (ID02) for any route option.

A9/A96 Inshes to Smithton
DMRB Stage 2 Scheme Assessment Report
Part 3: Environmental Assessment
Page 10-12
Thistlefield (ID 03)
10.5.14 At Thistlefield (ID 03) in the short-term, impacts of a Large/Very Large adverse significance arepredicted for route options 1A, 1B, 2A and 2B, where the west ends of the route options passrelatively near to the NSR. Impacts of a Slight Adverse, Neutral or Slight beneficial significance,with no perceptible noise changes, are predicted for route options 3A and 3B, as these routeoptions do not extend towards the NSR.
10.5.15 In the long-term during daytime, impacts of a Moderate/Large adverse significance are predictedfor route options 1A, 1B, 2A and 2B. Impacts of a Slight adverse significance are predicted forroute options 3A and 3B, because of predicted increases in traffic across the road network.
10.5.16 In the long-term at night, no significant impacts are predicted, as the predicted road traffic noiselevels are below Lnight,outside 55dB for all route options.
9 Cradlehall Meadows (ID 04)
10.5.17 At 9 Cradlehall Meadows (ID 04) in the short-term, impacts of a Large/Very Large adversesignificance are predicted for route options 1A, 2A, 1B, 2B and 3B and impacts of aModerate/Large adverse significance are predicted for route option 3A. The B variants generallyresult in more adverse impacts because these are located nearest to the NSR than the A variants.
10.5.18 In the long-term during daytime, impacts of a Moderate/Large adverse significance are predictedfor all route options.
10.5.19 In the long-term at night, no significant impacts are predicted, as the predicted road traffic noiselevels are below Lnight,outside 55dB for all route options.
Annfield (ID 05)
10.5.20 At Annfield (ID 05) in the short-term, impacts of a Slight/Moderate adverse significance arepredicted for route options 1A, 1B, 2A, 2B and 3B and an impact of Slight adverse significance ispredicted for route option 3A.
10.5.21 In the long-term during daytime, impacts of a Slight/Moderate adverse significance are predictedfor route options 1B and 2B and impacts of a Slight adverse significance are predicted for routeoptions 1A, 2A, 3A and 3B. The B route options generally result in more adverse impacts becausethese are located nearest to the NSR than the A route options.
10.5.22 In the long-term at night, no significant impacts are predicted, as the predicted road traffic noiselevels are below Lnight,outside 55dB for all route options.
Ashton Farm (ID 06)
10.5.23 At Ashton Farm (ID 06) in the short-term, impacts of a Large/Very Large adverse significance arepredicted for route options 1B, 2B and 3B, impacts of a Moderate/Large adverse significance arepredicted for route options 1A and 2A and an impact of a Slight/Moderate adverse significance ispredicted for route option 3A.
10.5.24 In the long-term during daytime, impacts of a Moderate/Large adverse significance are predictedfor route options 1B, 2B and 3B and impacts of a Slight/Moderate adverse significance arepredicted for route options 1A, 2A and 3A. The B route options result in more adverse impactsbecause these are located nearest to the NSR than the A route options.
10.5.25 In the long-term at night, no significant impacts are predicted, as the predicted road traffic noiselevels are below Lnight,outside 55dB for all route options.
A9/A96 Inshes to Smithton
DMRB Stage 2 Scheme Assessment Report
Part 3: Environmental Assessment
Page 10-13
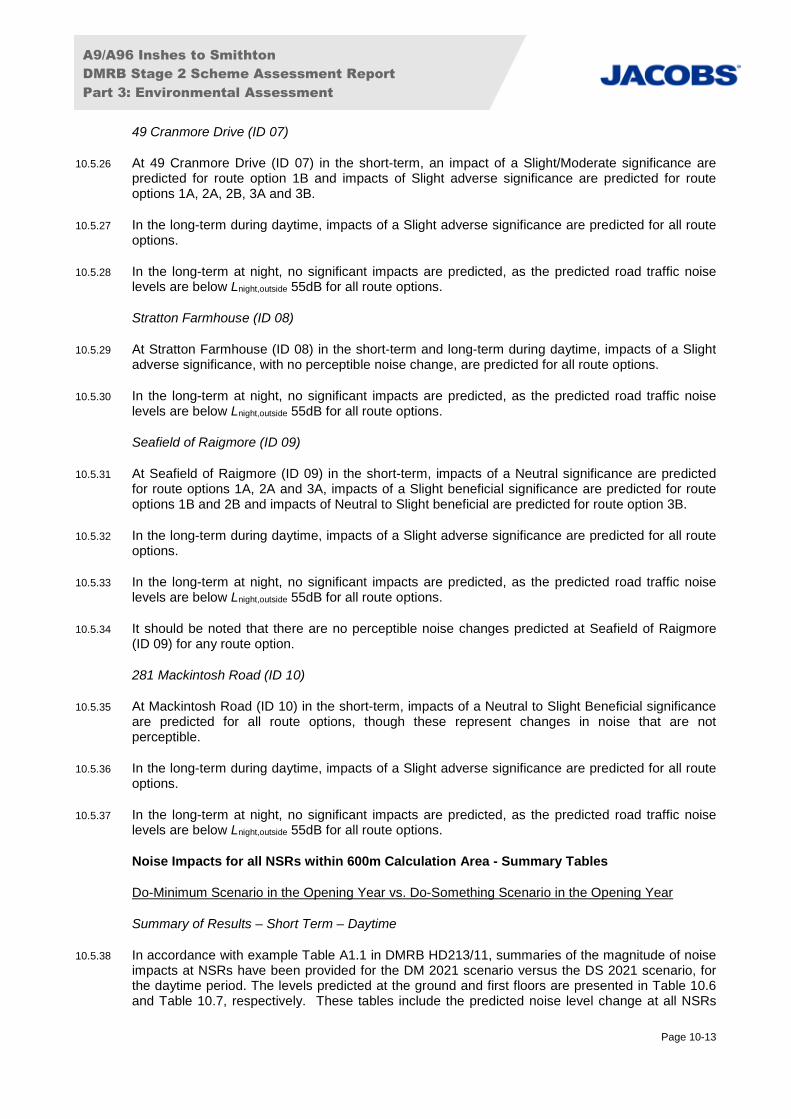
49 Cranmore Drive (ID 07)
10.5.26 At 49 Cranmore Drive (ID 07) in the short-term, an impact of a Slight/Moderate significance arepredicted for route option 1B and impacts of Slight adverse significance are predicted for routeoptions 1A, 2A, 2B, 3A and 3B.
10.5.27 In the long-term during daytime, impacts of a Slight adverse significance are predicted for all routeoptions.
10.5.28 In the long-term at night, no significant impacts are predicted, as the predicted road traffic noiselevels are below Lnight,outside 55dB for all route options.
Stratton Farmhouse (ID 08)
10.5.29 At Stratton Farmhouse (ID 08) in the short-term and long-term during daytime, impacts of a Slightadverse significance, with no perceptible noise change, are predicted for all route options.
10.5.30 In the long-term at night, no significant impacts are predicted, as the predicted road traffic noiselevels are below Lnight,outside 55dB for all route options.
Seafield of Raigmore (ID 09)
10.5.31 At Seafield of Raigmore (ID 09) in the short-term, impacts of a Neutral significance are predictedfor route options 1A, 2A and 3A, impacts of a Slight beneficial significance are predicted for routeoptions 1B and 2B and impacts of Neutral to Slight beneficial are predicted for route option 3B.
10.5.32 In the long-term during daytime, impacts of a Slight adverse significance are predicted for all routeoptions.
10.5.33 In the long-term at night, no significant impacts are predicted, as the predicted road traffic noiselevels are below Lnight,outside 55dB for all route options.
10.5.34 It should be noted that there are no perceptible noise changes predicted at Seafield of Raigmore(ID 09) for any route option.
281 Mackintosh Road (ID 10)
10.5.35 At Mackintosh Road (ID 10) in the short-term, impacts of a Neutral to Slight Beneficial significanceare predicted for all route options, though these represent changes in noise that are notperceptible.
10.5.36 In the long-term during daytime, impacts of a Slight adverse significance are predicted for all routeoptions.
10.5.37 In the long-term at night, no significant impacts are predicted, as the predicted road traffic noiselevels are below Lnight,outside 55dB for all route options.
Noise Impacts for all NSRs within 600m Calculation Area - Summary Tables
Do-Minimum Scenario in the Opening Year vs. Do-Something Scenario in the Opening Year
Summary of Results – Short Term – Daytime
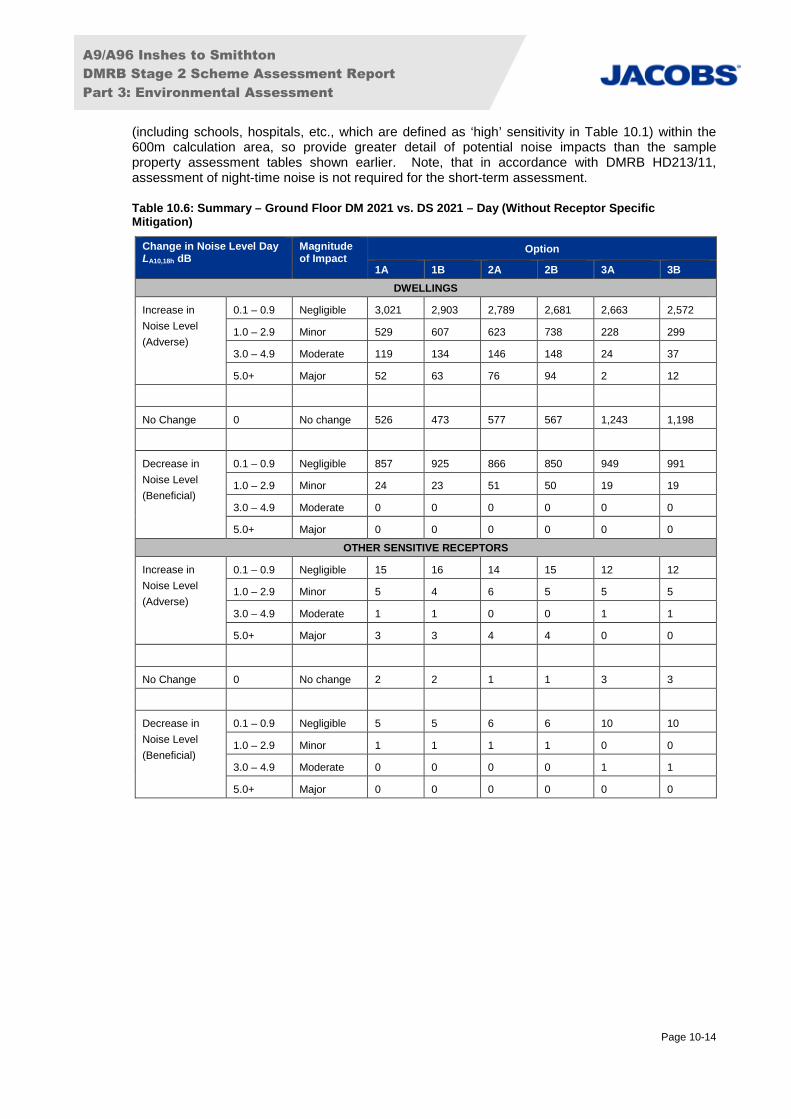
10.5.38 In accordance with example Table A1.1 in DMRB HD213/11, summaries of the magnitude of noiseimpacts at NSRs have been provided for the DM 2021 scenario versus the DS 2021 scenario, forthe daytime period. The levels predicted at the ground and first floors are presented in Table 10.6and Table 10.7, respectively. These tables include the predicted noise level change at all NSRs
A9/A96 Inshes to Smithton
DMRB Stage 2 Scheme Assessment Report
Part 3: Environmental Assessment
Page 10-14
(including schools, hospitals, etc., which are defined as ‘high’ sensitivity in Table 10.1) within the600m calculation area, so provide greater detail of potential noise impacts than the sampleproperty assessment tables shown earlier. Note, that in accordance with DMRB HD213/11,assessment of night-time noise is not required for the short-term assessment.
Table 10.6: Summary – Ground Floor DM 2021 vs. DS 2021 – Day (Without Receptor SpecificMitigation)
Change in Noise Level DayLA10,18h dB
Magnitudeof Impact
Option
1A 1B 2A 2B 3A 3B
DWELLINGS
Increase in
Noise Level
(Adverse)
0.1 – 0.9 Negligible 3,021 2,903 2,789 2,681 2,663 2,572
1.0 – 2.9 Minor 529 607 623 738 228 299
3.0 – 4.9 Moderate 119 134 146 148 24 37
5.0+ Major 52 63 76 94 2 12
No Change 0 No change 526 473 577 567 1,243 1,198
Decrease in
Noise Level
(Beneficial)
0.1 – 0.9 Negligible 857 925 866 850 949 991
1.0 – 2.9 Minor 24 23 51 50 19 19
3.0 – 4.9 Moderate 0 0 0 0 0 0
5.0+ Major 0 0 0 0 0 0
OTHER SENSITIVE RECEPTORS
Increase in
Noise Level
(Adverse)
0.1 – 0.9 Negligible 15 16 14 15 12 12
1.0 – 2.9 Minor 5 4 6 5 5 5
3.0 – 4.9 Moderate 1 1 0 0 1 1
5.0+ Major 3 3 4 4 0 0
No Change 0 No change 2 2 1 1 3 3
Decrease in
Noise Level
(Beneficial)
0.1 – 0.9 Negligible 5 5 6 6 10 10
1.0 – 2.9 Minor 1 1 1 1 0 0
3.0 – 4.9 Moderate 0 0 0 0 1 1
5.0+ Major 0 0 0 0 0 0

A9/A96 Inshes to Smithton
DMRB Stage 2 Scheme Assessment Report
Part 3: Environmental Assessment
Page 10-15
Table 10.7: Summary – First Floor DM 2021 vs. DS 2021 – Day (Without Receptor Specific Mitigation)
Change in Noise Level DayLA10,18h dB
Magnitudeof Impact
Option
1A 1B 2A 2B 3A 3B
DWELLINGS
Increase in
Noise Level
(Adverse)
0.1 – 0.9 Negligible 3,101 2,941 2,865 2,747 2,699 2,599
1.0 – 2.9 Minor 531 635 649 775 214 295
3.0 – 4.9 Moderate 106 116 127 127 25 34
5.0+ Major 49 61 66 83 2 12
No Change 0 No change 507 504 549 542 1,281 1,207
Decrease in
Noise Level
(Beneficial)
0.1 – 0.9 Negligible 811 849 832 815 886 961
1.0 – 2.9 Minor 23 22 40 39 21 20
3.0 – 4.9 Moderate 0 0 0 0 0 0
5.0+ Major 0 0 0 0 0 0
OTHER SENSITIVE RECEPTORS
Increase in
Noise Level
(Adverse)
0.1 – 0.9 Negligible 15 15 14 15 12 11
1.0 – 2.9 Minor 4 4 4 5 5 5
3.0 – 4.9 Moderate 1 1 1 1 1 1
5.0+ Major 3 3 3 3 0 0
No Change 0 No change 3 3 4 2 3 5
Decrease in
Noise Level
(Beneficial)
0.1 – 0.9 Negligible 5 5 5 5 10 9
1.0 – 2.9 Minor 1 1 1 1 0 0
3.0 – 4.9 Moderate 0 0 0 0 1 1
5.0+ Major 0 0 0 0 0 0
Option 1A – Short Term – Daytime
10.5.39 Table 10.6 shows that, for Option 1A, at ground floor level and without mitigation, 700 dwellingsand nine other sensitive receptors are predicted to experience perceptible noise increases (1dBand above). In terms of significance (as defined in Table 10.4), for the dwellings predicted toexperience perceptible noise increases, 52 are predicted to have Large/Very Large adversesignificance, 119 are predicted to have Moderate/Large adverse significance and 529 are predictedto have Slight/Moderate adverse significance. For the other sensitive receptors predicted toexperience perceptible noise increases, three are predicted to have Large/Very Large adversesignificance, one is predicted to have Moderate/Large adverse significance and five are predictedto have Slight/Moderate adverse significance.
10.5.40 Table 10.6 also shows that 24 dwellings and one other sensitive receptor are predicted toexperience perceptible noise decreases (1dB and above), all of which are predicted to haveSlight/Moderate beneficial significance.
10.5.41 Similar significance of noise impacts are predicted to occur at first floor level.

A9/A96 Inshes to Smithton
DMRB Stage 2 Scheme Assessment Report
Part 3: Environmental Assessment
Page 10-16
Option 1B – Short Term – Daytime
10.5.42 Table 10.6 shows that, for Option 1B, at ground floor level and without mitigation, 804 dwellingsand nine other sensitive receptors are predicted to experience perceptible noise increases (1dBand above). In terms of significance (as defined in Table 10.4), for the dwellings predicted toexperience perceptible noise increases, 63 are predicted to have Large/Very Large adversesignificance, 134 are predicted to have Moderate/Large adverse significance and 607 are predictedto have Slight/Moderate adverse significance. For the other sensitive receptors predicted toexperience perceptible noise increases, three are predicted to have Large/Very Large adversesignificance, one is predicted to have Moderate/Large adverse significance and four are predictedto have Slight/Moderate adverse significance.
10.5.43 Table 10.6 also shows that 23 dwellings and one other sensitive receptor are predicted toexperience perceptible noise decreases (1dB and above), all of which are predicted to haveSlight/Moderate beneficial significance.
10.5.44 Similar significance levels of noise impacts are predicted to occur at first floor level.
Option 2A – Short Term – Daytime
10.5.45 Table 10.6 shows that, for Option 2A, at ground floor level and without mitigation, 845 dwellingsand 10 other sensitive receptors are predicted to experience perceptible noise increases (1dB andabove). In terms of significance (as defined in Table 10.4), for the dwellings predicted toexperience perceptible noise increases, 76 are predicted to have Large/Very Large adversesignificance, 146 are predicted to have Moderate/Large adverse significance and 623 are predictedto have Slight/Moderate adverse significance. For the other sensitive receptors predicted toexperience perceptible noise increases, four are predicted to have Large/Very Large adversesignificance and six are predicted to have Slight/Moderate adverse significance.
10.5.46 Table 10.6 also shows that 51 dwellings and seven other sensitive receptors are predicted toexperience perceptible noise decreases (1dB and above), all of which are predicted to haveSlight/Moderate beneficial significance.
10.5.47 Similar significance levels of noise impacts are predicted to occur at first floor level.
Option 2B – Short Term – Daytime
10.5.48 Table 10.6 shows that, for Option 2B, at ground floor level and without mitigation, 980 dwellingsand nine other sensitive receptors are predicted to experience perceptible noise increases (1dBand above). In terms of significance (as defined in Table 10.4), for the dwellings predicted toexperience perceptible noise increases, 94 are predicted to have Large/Very Large adversesignificance, 148 are predicted to have Moderate/Large adverse significance and 738 are predictedto have Slight/Moderate adverse significance. For the other sensitive receptors predicted toexperience perceptible noise increases, four are predicted to have Large/Very Large adversesignificance and five are predicted to have Slight/Moderate adverse significance.
10.5.49 Table 10.6 also shows that 50 dwellings and one other sensitive receptor are predicted toexperience perceptible noise decreases (1dB and above), all of which are predicted to haveSlight/Moderate beneficial significance.
10.5.50 Similar significance levels of noise impacts are predicted to occur at first floor level.
Option 3A – Short Term – Daytime
10.5.51 Table 10.6 shows that, for Option 3A, at ground floor level and without mitigation, 254 dwellingsand six other sensitive receptors are predicted to experience perceptible noise increases (1dB andabove). In terms of significance (as defined in Table 10.4), for the dwellings predicted toexperience perceptible noise increases, two are predicted to have Large/Very Large adverse
A9/A96 Inshes to Smithton
DMRB Stage 2 Scheme Assessment Report
Part 3: Environmental Assessment
Page 10-17
significance, 24 are predicted to have Moderate/Large adverse significance and 228 are predictedto have Slight/Moderate adverse significance. For the other sensitive receptors predicted toexperience perceptible noise increases, one is predicted to have Moderate/Large adversesignificance and five are predicted to have Slight/Moderate adverse significance.
10.5.52 Table 10.6 also shows that 19 dwellings and one other sensitive receptor are predicted toexperience perceptible noise decreases (1dB and above). In terms of significance (as defined inTable 10.4), for the dwellings predicted to experience perceptible noise decreases, all are predictedto have Slight/Moderate beneficial significance. For the other sensitive receptor predicted toexperience perceptible noise increases, this is predicted to have Moderate/Large beneficialsignificance.
10.5.53 Similar significance levels of noise impacts are predicted to occur at first floor level.
Option 3B – Short Term – Daytime
10.5.54 Table 10.6 shows that, for Option 3B, at ground floor level and without mitigation, 348 dwellingsand six other sensitive receptors are predicted to experience perceptible noise increases (1dB andabove). In terms of significance (as defined in Table 10.4), for the dwellings predicted toexperience perceptible noise increases, 12 are predicted to have Large/Very Large adversesignificance, 37 are predicted to have Moderate/Large adverse significance and 299 are predictedto have Slight/Moderate adverse significance. For the other sensitive receptors predicted toexperience perceptible noise increases, one is predicted to have Moderate/Large adversesignificance and five are predicted to have Slight/Moderate adverse significance.
10.5.55 Table 10.6 also shows that 19 dwellings and one other sensitive receptor are predicted toexperience perceptible noise decreases (1dB and above). In terms of significance (as defined inTable 10.4), for the dwellings predicted to experience perceptible noise decreases, all are predictedto have Slight/Moderate beneficial significance. For the other sensitive receptor predicted toexperience perceptible noise increases, this is predicted to have Moderate/Large beneficialsignificance.
10.5.56 Similar significance levels of noise impacts are predicted to occur at first floor level.
Do-Minimum Scenario in the Opening Year vs. Do-Something Scenario in the Design Year
Summary of Results – Long Term – Daytime
10.5.57 In accordance with DMRB HD213/11 Table A1.2, summaries of the magnitude of noise impacts atNSRs for the DM 2021 scenario versus the DS 2036 scenario, for the daytime period at the groundand first floor are presented in Table 10.8 and Table 10.9, respectively.

A9/A96 Inshes to Smithton
DMRB Stage 2 Scheme Assessment Report
Part 3: Environmental Assessment
Page 10-18
Table 10.8: Summary – Ground Floor DM 2021 vs. DS 2036 – Day (Without Receptor SpecificMitigation)
Change in Noise Level DayLA10,18h dB
Magnitude ofImpact
Option
1A 1B 2A 2B 3A 3B
DWELLINGS
Increase in
Noise Level
(Adverse)
0.1 – 2.9 Negligible 4,805 4,771 4,679 4,656 5,008 4,986
3.0 – 4.9 Minor 209 220 225 237 72 87
5.0 – 9.9 Moderate 80 100 124 137 18 22
10.0+ Major 10 14 10 14 0 4
No Change 0 No change 9 11 28 24 6 5
Decrease in
Noise Level
(Beneficial)
0.1 – 2.9 Negligible 15 12 62 60 24 24
3.0 – 4.9 Minor 0 0 0 0 0 0
5.0 – 9.9 Moderate 0 0 0 0 0 0
10.0+ Major 0 0 0 0 0 0
OTHER SENSITIVE RECEPTORS
Increase in
Noise Level
(Adverse)
0.1 – 2.9 Negligible 25 25 26 26 30 30
3.0 – 4.9 Minor 2 3 1 1 0 0
5.0 – 9.9 Moderate 4 3 4 4 1 1
10.0+ Major 0 0 0 0 0 0
No Change 0 No change 0 0 0 0 0 0
Decrease in
Noise Level
(Beneficial)
0.1 – 2.9 Negligible 1 1 1 1 1 1
3.0 – 4.9 Minor 0 0 0 0 0 0
5.0 – 9.9 Moderate 0 0 0 0 0 0
10.0+ Major 0 0 0 0 0 0
A9/A96 Inshes to Smithton
DMRB Stage 2 Scheme Assessment Report
Part 3: Environmental Assessment
Page 10-19
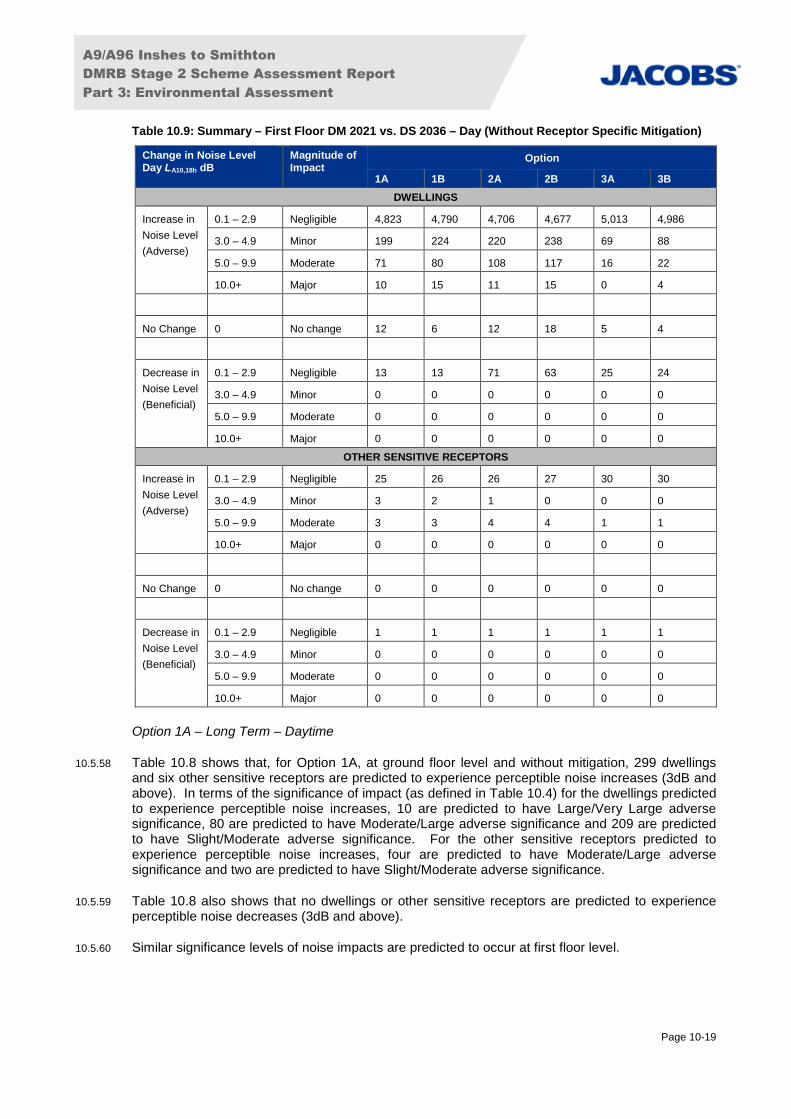
Table 10.9: Summary – First Floor DM 2021 vs. DS 2036 – Day (Without Receptor Specific Mitigation)
Change in Noise LevelDay LA10,18h dB
Magnitude ofImpact
Option
1A 1B 2A 2B 3A 3B
DWELLINGS
Increase in
Noise Level
(Adverse)
0.1 – 2.9 Negligible 4,823 4,790 4,706 4,677 5,013 4,986
3.0 – 4.9 Minor 199 224 220 238 69 88
5.0 – 9.9 Moderate 71 80 108 117 16 22
10.0+ Major 10 15 11 15 0 4
No Change 0 No change 12 6 12 18 5 4
Decrease in
Noise Level
(Beneficial)
0.1 – 2.9 Negligible 13 13 71 63 25 24
3.0 – 4.9 Minor 0 0 0 0 0 0
5.0 – 9.9 Moderate 0 0 0 0 0 0
10.0+ Major 0 0 0 0 0 0
OTHER SENSITIVE RECEPTORS
Increase in
Noise Level
(Adverse)
0.1 – 2.9 Negligible 25 26 26 27 30 30
3.0 – 4.9 Minor 3 2 1 0 0 0
5.0 – 9.9 Moderate 3 3 4 4 1 1
10.0+ Major 0 0 0 0 0 0
No Change 0 No change 0 0 0 0 0 0
Decrease in
Noise Level
(Beneficial)
0.1 – 2.9 Negligible 1 1 1 1 1 1
3.0 – 4.9 Minor 0 0 0 0 0 0
5.0 – 9.9 Moderate 0 0 0 0 0 0
10.0+ Major 0 0 0 0 0 0
Option 1A – Long Term – Daytime
10.5.58 Table 10.8 shows that, for Option 1A, at ground floor level and without mitigation, 299 dwellingsand six other sensitive receptors are predicted to experience perceptible noise increases (3dB andabove). In terms of the significance of impact (as defined in Table 10.4) for the dwellings predictedto experience perceptible noise increases, 10 are predicted to have Large/Very Large adversesignificance, 80 are predicted to have Moderate/Large adverse significance and 209 are predictedto have Slight/Moderate adverse significance. For the other sensitive receptors predicted toexperience perceptible noise increases, four are predicted to have Moderate/Large adversesignificance and two are predicted to have Slight/Moderate adverse significance.
10.5.59 Table 10.8 also shows that no dwellings or other sensitive receptors are predicted to experienceperceptible noise decreases (3dB and above).
10.5.60 Similar significance levels of noise impacts are predicted to occur at first floor level.
A9/A96 Inshes to Smithton
DMRB Stage 2 Scheme Assessment Report
Part 3: Environmental Assessment
Page 10-20
Option 1B – Long Term – Daytime
10.5.61 Table 10.8 shows that, for Option 1B, at ground floor level and without mitigation, 334 dwellingsand six other sensitive receptors are predicted to experience perceptible noise increases (3dB andabove). In terms of significance (as defined in Table 10.4), for the dwellings predicted toexperience perceptible noise increases, 14 are predicted to have Large/Very Large adversesignificance, 100 are predicted to have Moderate/Large adverse significance and 220 are predictedto have Slight/Moderate adverse significance. For the other sensitive receptors predicted toexperience perceptible noise increases, three are predicted to have Moderate/Large adversesignificance and three are predicted to have Slight/Moderate adverse significance.
10.5.62 Table 10.8 also shows that no dwellings or other sensitive receptors are predicted to experienceperceptible noise decreases (3dB and above).
10.5.63 Similar significance levels of noise impacts are predicted to occur at first floor level.
Option 2A – Long Term – Daytime
10.5.64 Table 10.8 shows that, for Option 2A, at ground floor level and without mitigation, 359 dwellingsand five other sensitive receptors are predicted to experience perceptible noise increases (3dB andabove). In terms of significance (as defined in Table 10.4), for the dwellings predicted toexperience perceptible noise increases, 10 are predicted to have Large/Very Large adversesignificance, 124 are predicted to have Moderate/Large adverse significance and 225 are predictedto have Slight/Moderate adverse significance. For the other sensitive receptors predicted toexperience perceptible noise increases, four are predicted to have Moderate/Large adversesignificance and one is predicted to have Slight/Moderate adverse significance.
10.5.65 Table 10.8 also shows that no dwellings or other sensitive receptors are predicted to experienceperceptible noise decreases (3dB and above).
10.5.66 Similar significance of noise impacts are predicted to occur at first floor level.
Option 2B – Long Term – Daytime
10.5.67 Table 10.8 shows that, for Option 2B, at ground floor level and without mitigation, 388 dwellingsand five other sensitive receptors are predicted to experience perceptible noise increases (3dB andabove). In terms of significance (as defined in Table 10.4), for the dwellings predicted toexperience perceptible noise increases, 14 are predicted to have Large/Very Large adversesignificance, 137 are predicted to have Moderate/Large adverse significance and 237 are predictedto have Slight/Moderate adverse significance. For the other sensitive receptors predicted toexperience perceptible noise increases, four are predicted to have Moderate/Large adversesignificance and one is predicted to have Slight/Moderate adverse significance.
10.5.68 Table 10.8 also shows that no dwellings or other sensitive receptors are predicted to experienceperceptible noise decreases (3dB and above).
10.5.69 Similar significance levels of noise impacts are predicted to occur at first floor level.
Option 3A – Long Term – Daytime
10.5.70 Table 10.8 shows that, for Option 3A, at ground floor level and without mitigation, 90 dwellings andone other sensitive receptor are predicted to experience perceptible noise increases (3dB andabove). In terms of significance (as defined in Table 10.4), for the dwellings predicted toexperience perceptible noise increases, 18 are predicted to have Moderate/Large adversesignificance and 72 are predicted to have Slight/Moderate adverse significance. The othersensitive receptor predicted to experience perceptible noise increases is predicted to haveModerate/Large adverse significance.
A9/A96 Inshes to Smithton
DMRB Stage 2 Scheme Assessment Report
Part 3: Environmental Assessment
Page 10-21
10.5.71 Table 10.8 also shows that no dwellings or other sensitive receptors are predicted to experienceperceptible noise decreases (3dB and above).
10.5.72 Similar significance levels of noise impacts are predicted to occur at first floor level.
Option 3B – Long Term – Daytime
10.5.73 Table 10.8 shows that, for Option 3B, at ground floor level and without mitigation, 113 dwellingsand one other sensitive receptors are predicted to experience perceptible noise increases (3dB andabove). In terms of significance (as defined in Table 10.4), for the dwellings predicted toexperience perceptible noise increases, four are predicted to have Large/Very Large adversesignificance, 22 are predicted to have Moderate/Large adverse significance and 87 are predicted tohave Slight/Moderate adverse significance. The other sensitive receptor predicted to experienceperceptible noise increases is predicted to have Moderate/Large adverse significance.
10.5.74 Table 10.8 also shows that no dwellings or other sensitive receptors are predicted to experienceperceptible noise decreases (3dB and above).
10.5.75 Similar significance levels of noise impacts are predicted to occur at first floor level.
Summary of Results – Long Term – Night-time
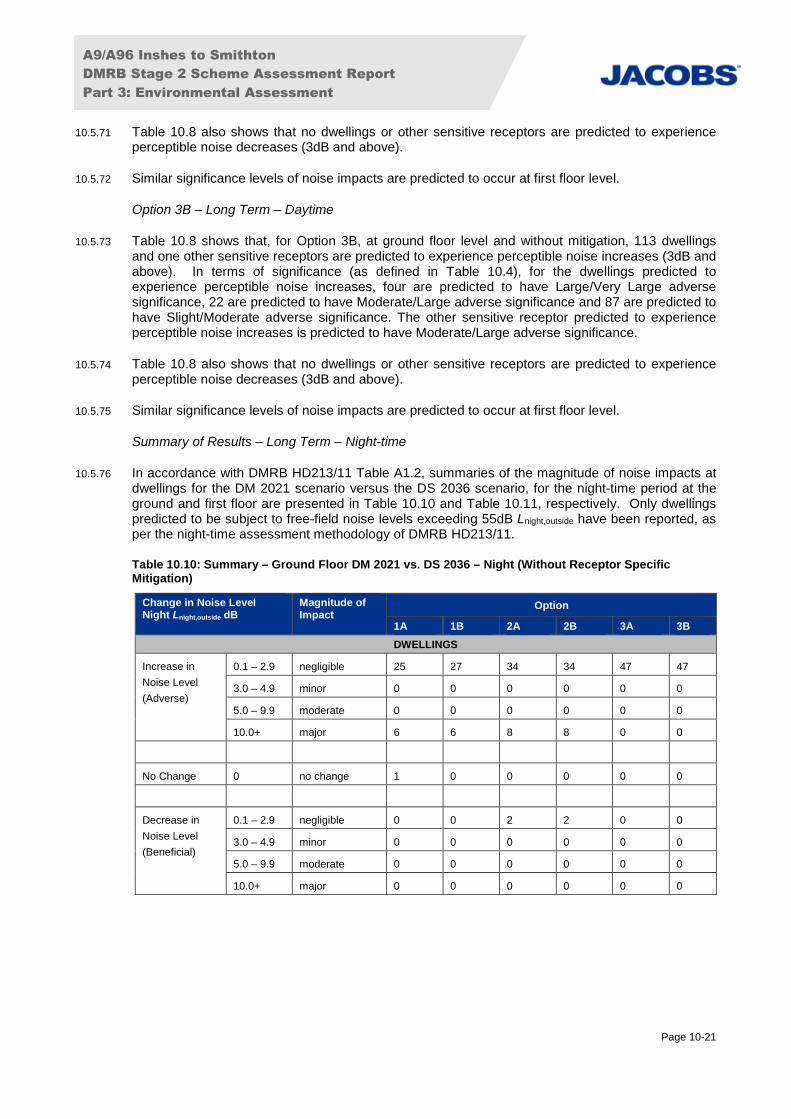
10.5.76 In accordance with DMRB HD213/11 Table A1.2, summaries of the magnitude of noise impacts atdwellings for the DM 2021 scenario versus the DS 2036 scenario, for the night-time period at theground and first floor are presented in Table 10.10 and Table 10.11, respectively. Only dwellingspredicted to be subject to free-field noise levels exceeding 55dB Lnight,outside have been reported, asper the night-time assessment methodology of DMRB HD213/11.
Table 10.10: Summary – Ground Floor DM 2021 vs. DS 2036 – Night (Without Receptor SpecificMitigation)
Change in Noise LevelNight Lnight,outside dB
Magnitude ofImpact
Option
1A 1B 2A 2B 3A 3B
DWELLINGS
Increase in
Noise Level
(Adverse)
0.1 – 2.9 negligible 25 27 34 34 47 47
3.0 – 4.9 minor 0 0 0 0 0 0
5.0 – 9.9 moderate 0 0 0 0 0 0
10.0+ major 6 6 8 8 0 0
No Change 0 no change 1 0 0 0 0 0
Decrease in
Noise Level
(Beneficial)
0.1 – 2.9 negligible 0 0 2 2 0 0
3.0 – 4.9 minor 0 0 0 0 0 0
5.0 – 9.9 moderate 0 0 0 0 0 0
10.0+ major 0 0 0 0 0 0

A9/A96 Inshes to Smithton
DMRB Stage 2 Scheme Assessment Report
Part 3: Environmental Assessment
Page 10-22
Table 10.11: Summary – First Floor DM 2021 vs. DS 2036 – Night (Without Receptor SpecificMitigation)
Change in Noise Level NightLnight,outside dB
Magnitude ofImpact
Option
1A 1B 2A 2B 3A 3B
DWELLINGS
Increase in Noise
Level (Adverse)
0.1 – 2.9 negligible 31 33 50 49 63 61
3.0 – 4.9 minor 0 0 0 0 0 0
5.0 – 9.9 moderate 0 0 1 1 0 0
10.0+ major 8 8 8 8 0 0
No Change 0 no change 0 0 0 0 0 0
Decrease in Noise
Level (Beneficial)
0.1 – 2.9 negligible 0 0 1 1 0 0
3.0 – 4.9 minor 0 0 0 0 0 0
5.0 – 9.9 moderate 0 0 0 0 0 0
10.0+ major 0 0 0 0 0 0
Option 1A – Long Term – Night-time
10.5.77 Table 10.10 shows that, for Option 1A, at ground floor level and without mitigation, six dwellingsare predicted to experience perceptible noise increases (3dB and above) above 55dB Lnight,outside, allof which are predicted to have Large/Very Large adverse significance.
10.5.78 No dwellings are predicted to experience perceptible noise decreases (3dB and above) above55dB Lnight,outside.
10.5.79 Similar significance levels of noise impacts are predicted to occur at first floor level.
Option 1B – Long Term – Night-time
10.5.80 Table 10.10 shows that, for Option 1B, at ground floor level and without mitigation, six dwellingsare predicted to experience perceptible noise increases (3dB and above) above 55dB Lnight,outside, allof which are predicted to have Large/Very Large adverse significance.
10.5.81 No dwellings are predicted to experience perceptible noise decreases (3dB and above) above55dB Lnight,outside.
10.5.82 Similar significance levels of noise impacts are predicted to occur at first floor level.
Option 2A – Long Term – Night-time
10.5.83 Table 10.10 shows that, for Option 2A, at ground floor level and without mitigation, eight dwellingsare predicted to experience perceptible noise increases (3dB and above) above 55dB Lnight,outside, allof which are predicted to have Large/Very Large adverse significance.
10.5.84 No dwellings are predicted to experience perceptible noise decreases (3dB and above) above55dB Lnight,outside.
10.5.85 Similar significance levels of noise impacts are predicted to occur at first floor level.

A9/A96 Inshes to Smithton
DMRB Stage 2 Scheme Assessment Report
Part 3: Environmental Assessment
Page 10-23
Option 2B – Long Term – Night-time
10.5.86 Table 10.10 shows that, for Option 2B, at ground floor level and without mitigation, eight dwellingsare predicted to experience perceptible noise increases (3dB and above) above 55dB Lnight,outside, allof which are predicted to have Large/Very Large adverse significance.
10.5.87 No dwellings are predicted to experience perceptible noise decreases (3dB and above) above55dB Lnight,outside.
10.5.88 Similar significance levels of noise impacts are predicted to occur at first floor level.
Option 3A – Long Term – Night-time
10.5.89 Table 10.9 shows that, for Option 3A, at ground floor level and without mitigation, no dwellings arepredicted to experience perceptible noise increases or decreases (3dB and above) above 55dBLnight,outside. The same is predicted to occur at first floor level.
Option 3B – Long Term – Night-time
10.5.90 Table 10.9 shows that, for Option 3B, at ground floor level and without mitigation, no dwellings arepredicted to experience perceptible noise increases or decreases (3dB and above) above 55dBLnight,outside. The same is predicted to occur at first floor level.
Noise Impact on Noise Sensitive Outdoor Areas
Identification of Noise Sensitive Outdoor Areas within Calculation Area
10.5.91 Table 10.12 presents the noise sensitive outdoor areas that have been identified within thecalculation area, and indicates the geometric area of each that lies within the calculation area.
Table 10.12: Noise Sensitive Outdoor Areas within Calculation Area
Name Description Amenity Area withinCalculation Area (m2)
Ashton Road Football Pitch and
Playground
Outdoor recreation area 8,799
Culloden House Garden and Designed Landscape, Battlefield 31,795
Grebe Avenue Playing Field Outdoor recreation area 5,892
Inshes District Park Outdoor recreation area 40,506
Inverness Golf Course Outdoor recreation area 80,056
Longman and Castle Stuart Bays SSSI, SPA, Important Bird Area and Ramsar
(Wetland of International Importance)
836,894
10.5.92 To assess the noise impact on sensitive outdoor areas, the change in noise levels across allsensitive areas within the calculation area have been assessed, and the percentage of the areaimpacted by each noise change category is presented in Appendix 10.3: Predicted Changes inRoad Traffic Noise Levels at Noise Sensitive Outdoor Areas. DMRB HD213/11 states that theapproach of reporting the least beneficial change in noise level should be used for the impact atareas within open spaces. As receptors for outdoor sensitive areas are assessed in this section,only the ground floor daytime scenario has been considered, both in the short and long term.
Summary of Assessment of Impact on Noise Sensitive Outdoor Receptors
10.5.93 A summary of the predicted least beneficial noise impact at each noise sensitive outdoor area ispresented below. It should be noted that none of the least beneficial impacts at noise sensitiveoutdoor areas are predicted to be perceptible for any route option, in the short-term or long-term.

A9/A96 Inshes to Smithton
DMRB Stage 2 Scheme Assessment Report
Part 3: Environmental Assessment
Page 10-24
Ashton Road Football Pitch and Playground
10.5.94 At Ashton Road Football Pitch and Playground in the short-term, impacts of a Slight beneficialsignificance are predicted for all route options, because of the predicted reduction in traffic flow onthe A9 Perth – Inverness Trunk Road.
10.5.95 In the long-term during daytime, impacts of a Slight adverse significance are predicted for routeoptions 1A, 1B, 3A and 3B and impacts of a Neutral significance are predicted for route option 2Aand 2B, as predicted increases in traffic across the road network as a whole partially cancel out thebenefits of the reduction in traffic flow on the A9 Perth – Inverness Trunk Road due to these routeoptions.
Culloden House
10.5.96 At Culloden House (Garden and Designated Landscape and Battlefield), impacts of a Slightadverse significance are predicted for all route options, both in the short and long-term.
Grebe Avenue Playing Field
10.5.97 At Grebe Avenue Playing Field, in the short-term, impacts of a Slight adverse significance arepredicted for route options 1A, 1B, 2A and 2B. Impacts of a Neutral significance are predicted forroute options 3A and 3B because the west ends of these route options do not extend as fartowards the playing field as the others. In the long-term, impacts of a Slight adverse significanceare predicted for all route options.
Inshes District Park
10.5.98 At Inshes District Park, impacts of a Slight adverse significance are predicted for all route options,both in the short and long-term.
Inverness Golf Course
10.5.99 At Inverness Golf Course, in the short-term, impacts of a Slight adverse significance are predictedfor route options 1A, 1B, 2A and 2B. Impacts of a Neutral significance are predicted for routeoption 3A and Slight Beneficial significance are predicted for route option 3B because the newsections of road on these options do not extend as far west towards the golf course as in the otherroute options. In the long-term, impacts of a Slight adverse significance are predicted for all routeoptions.
Longman and Castle Stuart Bays
10.5.100 At Longman and Castle Stuart Bays, in the short-term, impacts of a Slight adverse significance arepredicted for route options 1A and 1B and impacts of a Neutral significance are predicted for routeoptions 2A, 2B, 3A and 3B. In the long-term, impacts of a Slight adverse significance are predictedfor all route options.
Noise Change Contours
10.5.101 The noise change contours for the short and long-term at a height of 1.5m (for outdoor receptorsand indoor receptors on ground floor level) are presented in Figures 10.2 to 10.13. The noisechange results at a height of 1.5m and 4m (first floor level for indoor receptors) will be presented inthe DMRB Stage 3 assessment of the preferred option.
A9/A96 Inshes to Smithton
DMRB Stage 2 Scheme Assessment Report
Part 3: Environmental Assessment
Page 10-25
10.6 Potential Mitigation
10.6.1 At DMRB Stage 2 of the assessment process, it is not possible to accurately define likely noisemitigation measures for each of the proposed route options. As such, this section aims to identifyanticipated mitigation taking into account best practice, legislation and guidance.
10.6.2 Potential mitigation measures for both the construction and operational phases are discussedbelow.
Construction
10.6.3 During the construction phase, potential mitigation measures for the proposed route options arelikely to include:
use of ‘best practicable means’ during all construction activities;
switching off plant and equipment when it is not in use for longer periods of time;
establishing agreement with the local authority on appropriate controls for undertakingsignificantly noisy works or vibration-causing operations close to receptors;
programming works so that the requirement for working outside normal working hours isminimised;
use of low noise emission plant where possible;
where piling is required this should be bored to protect sensitive sites;
use of temporary noise screens around particularly noisy activities; and
regular plant maintenance.
Operation
10.6.4 In general terms, the greater the number of sensitive receptors experiencing perceptible noiseincreases (and particularly falling within the moderate and major impact categories), the greaterextent of noise mitigation is likely to be considered.
10.6.5 Mitigation in the form of LNRS on slip roads, as described in paragraph 10.2.22, has already beenincluded for the noise calculation of road traffic noise levels for the scheme for all DS options.
10.6.6 During the operational phase, potential mitigation measures for the proposed route options arelikely to include:
Siting the scheme within cuttings where the surrounding topography and constraints allow. Thisprovides a degree of noise screening and can be an effective noise mitigation measure. Duringthe scheme design, consideration should be given, where feasible, to increasing the extent ofthe scheme within cutting (or creating false cuttings), particularly where it runs near to noisesensitive receptors.
The use of earth bunding or noise barriers as a form of screening. The required heights andextents of screening structures would be determined during the assessment of the preferredoption as part of the DMRB Stage 3 assessment.
10.7 Summary of Route Options
10.7.1 Table 10.13 presents the total number of NSRs predicted to experience perceptible adversechanges in noise in the short term. This includes the least beneficial noise impacts predicted fornoise sensitive outdoor areas, where perceptible impacts are predicted.

A9/A96 Inshes to Smithton
DMRB Stage 2 Scheme Assessment Report
Part 3: Environmental Assessment
Page 10-26
Table 10.13: Summary of Predicted Perceptible Adverse Noise Impacts in the Short Term (Daytime)
Magnitude ofAdverse Impact
Significance ofAdverse Impact
Option
1A 1B 2A 2B 3A 3B
DWELLINGS AND OTHER SENSTIVE RECEPTORS - GROUND FLOOR
Minor Slight/Moderate 534 611 629 743 233 304
Moderate Moderate/Large 120 135 146 148 25 38
Major Large/Very Large 55 66 80 98 2 12
DWELLINGS AND OTHER SENSTIVE RECEPTORS - FIRST FLOOR
Minor Slight/Moderate 535 639 653 780 219 300
Moderate Moderate/Large 107 117 128 128 26 35
Major Large/Very Large 52 64 69 86 2 12
10.7.2 It can be seen in Table 10.13 that Options 1A, 1B, 2A and 2B have similar numbers of NSRspredicted to have perceptible adverse changes in noise in the short term, while Options 3A and 3Bhave significantly less. Route options 3A and 3B have the lowest number of perceptible adverseimpacts predicted because the other options (1A, 1B, 2A and 2B) extend the new road furthersouth from Inshes to Inshes Retail Park, in contrast to the 3A and 3B options. Options 1B, 2B and3B have a greater number of perceptible adverse impacts predicted than the A variants, which islikely to be a consequence of the B variants passing closer to residential dwellings to the east, suchas in Cradlehall and Resaurie. Option 3A has the lowest number of NSRs predicted to haveperceptible adverse changes in noise in the short term.
10.7.3 Table 10.14 presents the total number of NSRs predicted to experience perceptible adversechanges in noise in the long term during the daytime period.
Table 10.14: Summary of Predicted Perceptible Adverse Noise Impacts in the Long Term (Daytime)
Magnitude ofAdverse Impact
Significance ofAdverse Impact
Option
1A 1B 2A 2B 3A 3B
DWELLINGS AND OTHER SENSTIVE RECEPTORS - GROUND FLOOR
Minor Slight/Moderate 211 223 226 238 72 87
Moderate Moderate/Large 84 103 128 141 19 23
Major Large/Very Large 10 14 10 14 0 4
DWELLINGS AND OTHER SENSTIVE RECEPTORS - FIRST FLOOR
Minor Slight/Moderate 202 226 221 238 69 88
Moderate Moderate/Large 74 83 112 121 17 23
Major Large/Very Large 10 15 11 15 0 4
10.7.4 Table 10.14 shows that the total number of perceptible adverse changes in noise predicted in thelong term are lower than in the short term for all options. The results for predicted perceptibleadverse change in noise in the long term during the daytime period are similar to that for the shortterm in that Options 1A, 1B, 2A and 2B have similar numbers of NSRs predicted to haveperceptible adverse changes in noise, while Options 3A and 3B have significantly less. Option 3Ahas the lowest number of NSRs predicted to have perceptible adverse changes in noise.
10.7.5 Table 10.15 presents the total number of dwellings predicted to experience perceptible adversechanges in noise in the long term during the night-time period. Only dwellings predicted to besubject to free-field noise levels exceeding 55dB Lnight,outside have been reported, as per the night-time assessment methodology of DMRB HD213/11.

A9/A96 Inshes to Smithton
DMRB Stage 2 Scheme Assessment Report
Part 3: Environmental Assessment
Page 10-27
Table 10.15: Summary of Predicted Perceptible Adverse Noise Impacts in the Long Term (Night-time)
Magnitude ofAdverse Impact
Significance of AdverseImpact
Option
1A 1B 2A 2B 3A 3B
DWELLINGS - GROUND FLOOR/
Minor Slight/Moderate 0 0 0 0 0 0
Moderate Moderate/Large 0 0 0 0 0 0
Major Large/Very Large 6 6 8 8 0 0
DWELLINGS - FIRST FLOOR
Minor Slight/Moderate 0 0 0 0 0 0
Moderate Moderate/Large 0 0 1 1 0 0
Major Large/Very Large 8 8 8 8 0 0
10.7.6 It can be seen in Table 10.15 that there are a very low number of dwellings predicted to haveperceptible adverse changes in noise exceeding 55dB Lnight,outside in the long term, at night-time.Options 3A and 3B have no perceptible adverse changes in noise exceeding 55dB Lnight,outside
predicted.
10.7.7 Table 10.16 presents the total number of NSRs predicted to experience perceptible beneficialchanges in noise in the short term.
Table 10.16: Summary of Predicted Perceptible Beneficial Noise Impacts in the Short Term (Daytime)
Magnitude ofBeneficialImpact
Significance ofBeneficial Impact
Option
1A 1B 2A 2B 3A 3B
DWELLINGS AND OTHER SENSTIVE RECEPTORS - GROUND FLOOR
Minor Slight/Moderate 25 24 52 51 19 19
Moderate Moderate/Large 0 0 0 0 1 1
Major Large/Very Large 0 0 0 0 0 0
DWELLINGS AND OTHER SENSTIVE RECEPTORS - FIRST FLOOR
Minor Slight/Moderate 24 23 41 40 21 20
Moderate Moderate/Large 0 0 0 0 1 1
Major Large/Very Large 0 0 0 0 0 0
10.7.8 It can be seen in Table 10.16 that Options 1A, 1B, 3A and 3B are predicted to have the lowestnumber of perceptible beneficial changes in noise in the short term. Options 2A and 2B arepredicted to have the highest number of perceptible beneficial changes in noise, because ofpredicted reductions in traffic flow along Old Perth Road (B9006), Culloden Road (B9006),Caulfield Road and Caulfield Road North.
10.7.9 There are predicted to be no NSRs with perceptible beneficial changes in the long term, duringdaytime, for any option. There are also predicted to be no dwellings with perceptible beneficialchanges in noise exceeding 55dB Lnight,outside in the long term, at night-time, for any option.
10.7.10 Overall, Options 3A and 3B are predicted to have the least number of perceptible adverse noiseimpacts, while all other options are predicted to have a similar, greater number. Options 2A and 2Bare predicted to have the greatest number of perceptible short-term beneficial noise impacts, withthe other route options predicted to have a similar, lower number. The number of perceptibleadverse impacts is greater than the number of perceptible beneficial impacts for all options, basedon the DMRB HD213/11 assessment methodology where the impact at the least beneficial façadeof each NSR is reported.
A9/A96 Inshes to Smithton
DMRB Stage 2 Scheme Assessment Report
Part 3: Environmental Assessment
Page 10-28
10.8 Scope of DMRB Stage 3 Assessment
10.8.1 A Detailed Assessment, as defined in DMRB HD213/11, should be carried out during DMRB Stage3. The scope of a Detailed Assessment is similar to that of a Simple Assessment, with a number ofadditional steps and comparisons made.
10.8.2 Baseline noise monitoring should be undertaken at representative noise sensitive receptors closeto the preferred option and other roads on which traffic flows are likely to be significantly affected.This is likely to consist of both short term (three hour attended monitoring) and long term (up to 1week) noise monitoring. Measurements of the LAeq, LAMax, LA10 and LA90 would be undertaken as aminimum.
10.8.3 During DMRB Stage 3, an assessment of the potential impacts arising from construction of thepreferred option should be undertaken. This should involve interrogation of the measured baselinenoise data to derive anticipated noise limits using BS 5228-1 Method 2 (British StandardsInstitution 2014a). Predictions should then be undertaken for the likely worst case phases ofconstruction to estimate the impact at the nearest sensitive receptors to the preferred option, andmitigation measures would be proposed, where required.
10.8.4 During DMRB Stage 3, consideration should also be given to construction vibration, makingreference to the guidance and criteria in BS 5228-2 (British Standards Institution 2014b) relating tohuman response to vibration in buildings and damage levels from ground-borne vibration inbuildings.
10.8.5 For the operational assessment, the preferred option should be modelled using computer basedmodelling software and appropriate noise mitigation measures proposed, where required.
10.8.6 The level of reporting of permanent traffic noise impacts should include the following threecomparisons:
DM scenario in modelled opening year against DM in the modelled design year;
DM scenario in the baseline year against DS scenario in the baseline year; and
DM scenario in baseline year against DS scenario in the modelled design year.
10.8.7 In addition, assessment of both the permanent traffic nuisance impacts and the permanent trafficinduced vibration impacts should also be undertaken, and Tables A1.3 and A1.4, as defined inDMRB HD213/11, should be provided.
10.9 References
Abbot, P G and Nelson, P M. (2002). Converting the UK Traffic Noise Index LA10,18h to EU NoiseIndices for Noise Mapping. Transport Research Laboratory (TRL).
British Standards Institution (2014a). BS 5228-1:2009+A1:2014 ‘Code of practice for noise andvibration control on construction and open sites – Part 1 Noise’. London: BSI.
British Standards Institution (2014b). BS 5228-2:2009+A1:2014 ‘Code of practice for noise andvibration control on construction and open sites – Part 2 Vibration’. London: BSI.
Highways Agency, Scottish Government, Welsh Assembly Government and The Department forRegional Development Northern Ireland (2008). Design Manual for Roads and Bridges Volume 11,Section 2, Part 5, HA205/08: Assessment and Management of Environmental Effects.
Highways Agency, Transport Scotland, Welsh Assembly Government and The Department forRegional Development Northern Ireland (2011). Design Manual for Roads and Bridges Volume 11,Section 3, Part 7, HD213/11: Noise and Vibration.

A9/A96 Inshes to Smithton
DMRB Stage 2 Scheme Assessment Report
Part 3: Environmental Assessment
Page 10-29
Jacobs (2016) (on behalf of Transport Scotland). A96 Dualling Inverness to Nairn (including NairnBypass) Environmental Statement [Unpublished].
Department of Transport Welsh Office (1988). Calculation of Road Traffic Noise. London: HMSO.
The Scottish Government (2011a). PAN 1/2011 Planning Advice Note – Planning and Noise.Edinburgh: The Scottish Government.
The Scottish Government (2011b). TAN: Technical Advice Note – Assessment of Noise.Edinburgh: The Scottish Government.
The Scottish Government (2016). Guidance for Possible Measures to Manage Noise from Roadand Rail. [Online] Available from https://noise.environment.gov.scot/pdf/Mitigation_Guidance.pdf[Accessed September 2017].
Transport Scotland (2014). Transportation Action Plan. [Online] Available fromhttps://noise.environment.gov.scot/pdf/Transportation%20Noise%20Action%20Plan.pdf
EU Directives
Directive 2002/49/EC of 25 June 2002 of the European Parliament and of the Council relating tothe assessment and management of environmental noise.