10 May 6 Liesl Page-Shipp - tb-ipcp.co.za · Dr Liesl Page-Shipp ... Guyatt GH, Sudre P, Naef M,...
27
5/2/2013 1 Isoniazid preventive therapy: evidence for safety and efficacy 5th International Clinician’s course for TB/HIV in South Prof Gavin Churchyard Dr Liesl Page-Shipp 10 May 2013 Overview of presentation Meta-analysis TST Screening for TB Duration of IPT Adverse events INH Resistance IPT & ART more people living with HIV dying of TB NO
Transcript of 10 May 6 Liesl Page-Shipp - tb-ipcp.co.za · Dr Liesl Page-Shipp ... Guyatt GH, Sudre P, Naef M,...

5/2/2013
1
Isoniazid preventive therapy: evidence for
safety and efficacy
5th International Clinician’s course for TB/HIV in South
Prof Gavin Churchyard
Dr Liesl Page-Shipp
10 May 2013
Overview of presentation
� Meta-analysis
�TST
� Screening for TB
� Duration of IPT
� Adverse events
� INH Resistance
� IPT & ART
more people
living with HIV
dying of TBNO

5/2/2013
2
Isoniazid preventive therapy reduces the
risk of TB among PLWHIV
Akolo. 2010, Cochrane review
0.36
0.86
0.86
0.67
0.74
0.81
1.02
0.95
1.01.0
�RCTs demonstrated the efficacy of IPT in PLHIV infected with MTB as early as 1998Wilkinson D, Squire S B, Garner P. Effect of preventive treatment for tuberculosis in adults infected with HIV: systematic review of randomised placebo controlled trials. BMJ 1998; 317:625–629
Bucher HC, Griffith LE, Guyatt GH, Sudre P, Naef M, Sendi P, t al. Isoniazid prophylaxis for tuberculosis in HIV infection: a meta-analysis of randomized controlled trials. AIDS 1999;13:501–507
�Cochrane Systematic review (2004) of 11 trials (8130 participants)� Decreased risk of TB (33% overall) 64% (TST+ ve)
In 1998 the WHO and UNAIDS endorsed targeted IPT
Why IPT?

5/2/2013
3
� 12 trials, 8578 randomized participants
� IPT vs. placebo -lower incidence of active TB (RR 0.68, 95% CI
0.54-0.85)
� more pronounced in TST +ve (RR 0.38, 95% CI 0.25-0.57)
� Efficacy similar for all regimens (regardless of drug type, frequency or duration)� But short-course multi-drug regimens much more
likely to require discontinuation due to A/E than INH alone
� IPT reduces active TB esp. if TST +ve
Cochrane review 2010
Akolo C, Adetifa I, Shepperd S, Volmink J. Treatment of latent tuberculosis infection
in HIV infected persons. Cochrane Database of Systematic Reviews 2010, Issue 1
Art. No.: CD000171. DOI: 10.1002/14651858.CD000171.pub3.
Duration of IPT

5/2/2013
4
Churchyard GJ, Lewis JJ, Fielding KL,
Vynnycky E, White RG, Grant AD
on behalf of the Thibela TB team
Community-wide isoniazid preventive
therapy among gold miners in South
Africa: the Thibela TB study
Aim
To compare the
effectiveness of
� isoniazid preventive
therapy (IPT) given on a
community-wide basis
� to current standard of
care on TB among gold
miners in South Africa
5/2/2013
5
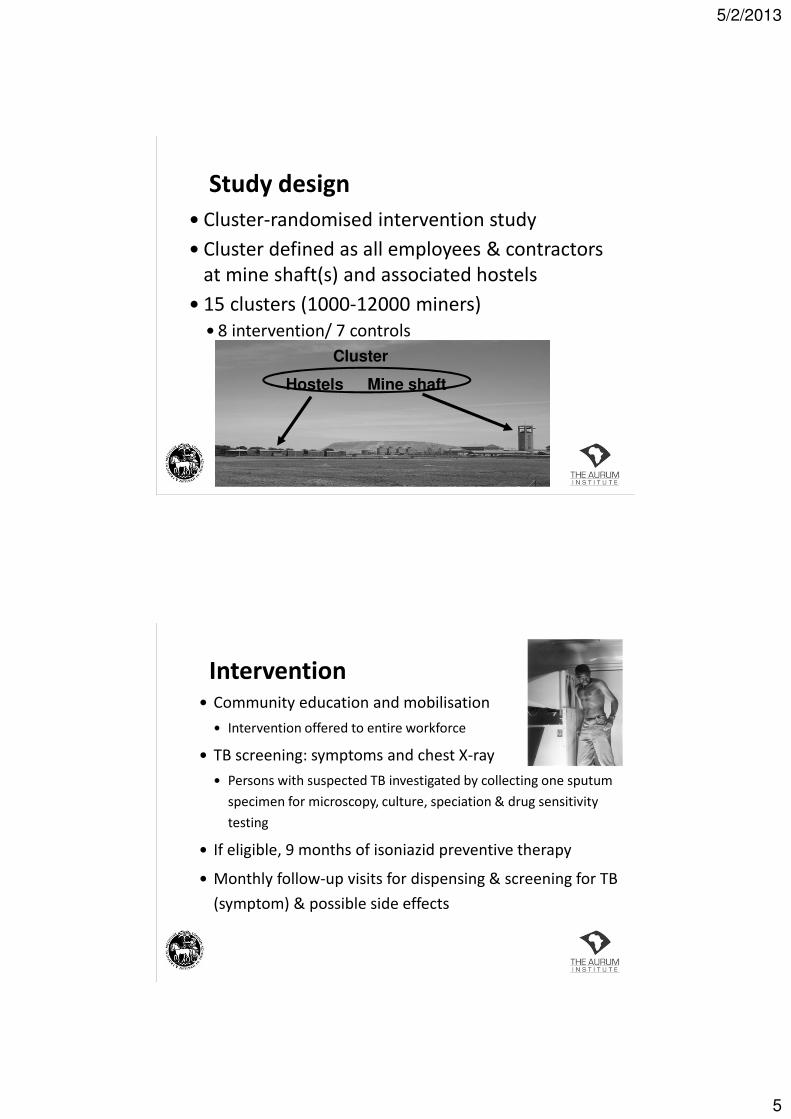
Study design
� Cluster-randomised intervention study
� Cluster defined as all employees & contractors
at mine shaft(s) and associated hostels
� 15 clusters (1000-12000 miners)
� 8 intervention/ 7 controls
Hostels Mine shaft
Cluster
Intervention� Community education and mobilisation
� Intervention offered to entire workforce
� TB screening: symptoms and chest X-ray
� Persons with suspected TB investigated by collecting one sputum
specimen for microscopy, culture, speciation & drug sensitivity
testing
� If eligible, 9 months of isoniazid preventive therapy
� Monthly follow-up visits for dispensing & screening for TB
(symptom) & possible side effects

5/2/2013
6
Participant flow
Total population
78,744
Intervention clusters
40,981
Control clusters
37,763
Consented
27,126 (66.2%)
Started IPT
23,659 (87.2%)
Ineligible
1,455 TB suspect
2,012 Ineligible for IPT
0%
20%
40%
60%
80%
100%
1 2 3 4 5 6 7 8 9 10 11 12 13 14 15 16
cum
ula
tiv
e %
of
clu
ste
r co
nse
nte
d
month from start of intervention
Uptake to the intervention
Uptake in first four clusters = 58.0%
Uptake in last four clusters = 78.7%
5/2/2013
7
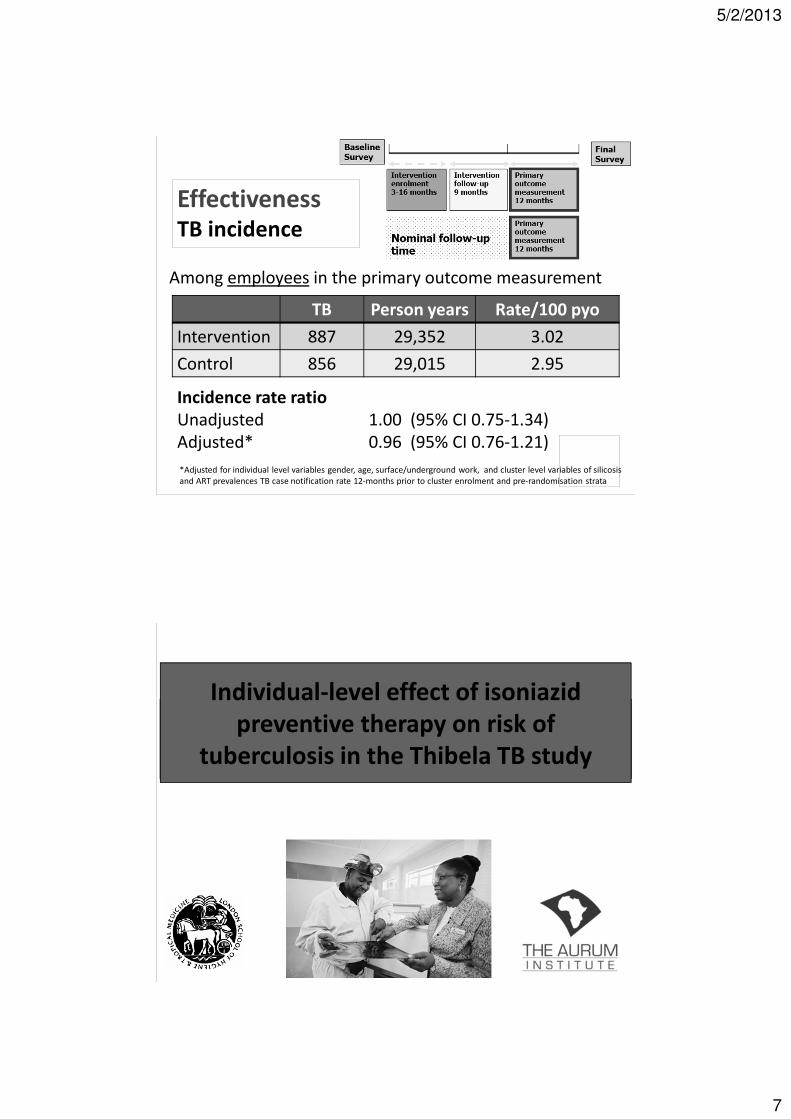
TB Person years Rate/100 pyo
Intervention 887 29,352 3.02
Control 856 29,015 2.95
EffectivenessTB incidence
Among employees in the primary outcome measurement
Incidence rate ratio
Unadjusted 1.00 (95% CI 0.75-1.34)
Adjusted* 0.96 (95% CI 0.76-1.21)
*Adjusted for individual level variables gender, age, surface/underground work, and cluster level variables of silicosis
and ART prevalences TB case notification rate 12-months prior to cluster enrolment and pre-randomisation strata
Individual-level effect of isoniazid
preventive therapy on risk of
tuberculosis in the Thibela TB study

5/2/2013
8
Objective
� We investigate the effect of IPT on TB incidence in
� individuals starting IPT in intervention clusters vs.
� individuals in control clusters
Results – flow diagramBaseline survey
(n=15,609, 15 clusters)
Employees(n=14,005, 15 clusters)
Control clusters(n=6,397, 7 clusters)
Intervention clusters(n=7,608, 8 clusters)
Control arm(not on TB rx or IPT)
(n=6,263, 7 clusters)
IPT arm(Started IPT, regardless of HIV
Status/ CD4)
(n=4,646, 8 clusters)
Excluded
Did not start IPT
(n=2,963)
Excluded
TB / IPT
(n=134)
Excluded
Not employees
(n=1,604)

5/2/2013
9
Thibela TB: durability of IPT effect at
individual level
0
0.5
1
1.5
2
2.5
3
3.5
0-9 m 9-18m >18m
TB
in
cid
en
ce p
er
10
0 p
yrs
IPT arm
Control arm
Interval Arm Adjusted IRR
(95% CI)
0-9mth
(IPT period)
IPT
Control
0.37 (0.19-0.72)
1
9-18mths IPT
Control
0.94 (0.57-1.54)
1
>18mths IPT
Control
0.79 (0.54-1.17)
1
Thibela TB: why didn't it improve TB
control?
Was it that: Results suggest:
Intervention coverage too low? yes, but even if
optimised, impact
would only be modest
IPT didn't protect individuals
against TB?
no
IPT effect didn't last long enough yes…..

5/2/2013
10
� plausible
� consistent with molecular epidemiological
data from mines and elsewhere in southern
Africa
� but very difficult to measure
Thibela TB: was IPT effect brief because
risk of reinfection very high?
Thibela TB: was IPT effect brief because
IPT does not cure latent infection?
� plausible
� consistent with data from mouse models
� no good clinical trial data from HIV+
populations
� model suggests this is important

5/2/2013
11
Targeted IPT Community-wide
IPT
Yes please! No thanks!
What was the duration of
the benefit of six months IPT?
200 days
after 6H
Start of coded medication
All participants analyzed in this graph received 6 months of IPT prior to day 0 in this graph
The Botswana IPT Trial: 36 months vs. 6mnths INH for
TB prevention in HIV-Infected adults 2004-2009
Samandari et al.

5/2/2013
12
Author Location Intention
to treat
Per
Protocol
Martinson Soweto 19% 69%
Samandari Botswana
All 54% 65%
TST+ 93%
TST- 19%
(Martinson et al. Union conference, 2008, CROI 2009)
(Samandari et al. Union Conference. 2009)
Continuous IPT effective if adherent
TST

5/2/2013
13
TST status & cumulative TB incidence
TST –0.9% per yr
The Botswana IPT Trial: 36 months vs.
6mnths INH for TB prevention in HIV-
Infected adults 2004-2009 Samandari et
al.
Requiring tuberculin skin tests before
implementing IPT leads to avoidable and
substantial number of TB cases
� Golub JE et al. 18th International AIDS Conference, abstract
MOAB0305, Vienna, 2010.

5/2/2013
14
IPT in PEPFAR assisted sites: 2010-2011
Bristow CC et al. Scale-up of isoniazid preventive therapy in PEPFAR-assisted clinical sites in South Africa. INT J TUBERC LUNG DIS 16(8):1020–1022. 2012
TB screening

5/2/2013
15
Proportion of TB detected by symptom and
CXR screening
All TB
n (%)
Smear
positive
n (%)
Smear
negative
n (%)
(n=281) (n=132) (n=149)
Symptoms
Symptom trio * 113 (40.2) 64 (48.5) 49 (32.9)
Abnormal CXR 233 (82.9) 119 (90.2) 114 (76.5)
Symptom trio and CXR
The addition of CXR to symptom screening increased the
number of TB cases detected by 2.5 fold (113 to 281)
* Cough>2 weeks, night sweats and weight loss

5/2/2013
16
TB missed at screeningB/w July 2006 and December 2008
� 23,299 participants completed screening
� 19,609 included in analysis of TB missed at screening
Prevalence
� 0.2% (definite, probable and possible TB)
� 0.12% (definite, probable TB)
Risk factors: unadjusted analysis
� age: aOR: 1.66/10yr (1.07-2.56)
� In HIV care: aOR 4.80 (1.63-14.1)
� Lower weight: aOR 2.07/10Kg (1.23-3.49)
� Alcohol use: aOR 2.52 (1.31-4.86)
Adverse events

5/2/2013
17
Methods: study-defined AEs
� AE reporting included
� hepatitis
� hypersensitivity
� peripheral neuropathy
� convulsions
� Occurring between
� first IPT dispensing date
� two months after last IPT dispensing date
AEs: results
� 24221 participants started IPT
� 95% male, median age 40 years
� 130 individuals experienced 132 possible study
defined AEs (0.54%)
� Suspected hypersensitivity rash 61
� Peripheral neuropathy 50
� Convulsions 4
� Hepatotoxicity 17
� INH non-related 2
� One AE resulted in death: overall risk of death of 4
per 100,000 (0.004%)

5/2/2013
18
Risk factors for hepatotoxicityVariable Category Hepatotoxicity/total (%) Odds ratio (95% CI)
Sex Male
Female
14/23038 (0.06%)
1/1168 (0.09%)
1
1.4 (0.2-10.7)
Age group (years) <35
35-44
45+
3/7763 (0.04%)
7/8203 (0.09%)
5/8201 (0.06%)
1
2.2 (0.6-8.5)
1.6 (0.4-6.6)
Ethnic group Black
Other
14/23794 (0.06%)
1/425 (0.24%)
1
4.0 (0.5-30.5)
Baseline weight (kg) <60
61-80
81+
2/4234 (0.05%)
8/14700 (0.05%)
5/5275 (0.09%)
1
1.2 (0.2-5.4)
2.0 (0.4-10.4)
History suggesting HIV care No
Yes
15/23584 (0.06%)
0/618 (0%)
1
-
Antiretroviral therapy No
Yes
15/23654 (0.06%)
0/544 (0%)
1
-
Alcohol use (units/week) 0
1-14
15+
4/14139 (0.03%)
10/7760 (0.13%)
1/2321 (0.04%)
1
4.6 (1.4-14.5)
1.5 (0.2-13.6)

5/2/2013
19
INH resistance
INH resistance
Balcells Emerg Infect Dis 2006;12:744-51

5/2/2013
20
0 5 10 15 20 25 30 35 40
Percentage
TB after IPT
TB after IPT
Laboratory sub-study
First
episodes
Retreatment
episodes
Any INH resistance: Mean (95% CI)
TB after IPT (n=126)
AIDS. 2010 Apr 24;24(7):1051-5.Tuberculosis outcomes and drug susceptibility in individuals exposed to isoniazid preventive therapy in a high HIV prevalence setting.van Halsema CL, Fielding KL, Chihota VN, Russell EC, Lewis JJ, Churchyard GJ, Grant AD.
INH resistance by treatment arm
Botswana background = 9% INH resistance new TB patients;
18% INH-R expected in Trial if no additional contribution by IPT
2 (14%)4 (17%)Any INH resistance >36 mo # (%)
11MDR (INH + RIF)
13INH-mono-resistant
1424Drug susceptibility test available
36H (n=1006)6H (n=989)
The Botswana IPT Trial: 36 months vs. 6mnths INH for TB
prevention in HIV-Infected adults 2004-2009 Samandari
et al.

5/2/2013
21
IPT and ART
�We know TB� remains the leading cause of death on ART
� rates are significantly reduced on ART vs. no ART
� annual risk decreases, the longer effective ART
BUT
�TB rates on effective ART still much higher than HIV-neg, possibly due to� Incomplete TB-specific immune restoration
� Poor adherence
� Nosocomial transmission (ART visits)
IPT and ART

5/2/2013
22
RCT of IPT in HIV-infected persons on
antiretroviral therapy
� Khayelitsha Ubuntu ART clinic
� Pragmatic randomized double-blind placebo-
controlled
� Efficacy of IPT on ART (established or newly
starting)
� Daily INH or matching placebo x 1 yr
� Followed for up to four years
� Tuberculosis excluded by sputum culture
MX Rangaka et al. Randomized controlled trial of isoniazid preventive therapy in HIV-infected persons on antiretroviral therapy. Nineteenth International AIDS Conference, Washington DC, abstract THLBB03, 2012
RCT continued: Results
� 1,329 : 662 on placebo/ 667 on IPT
� Comparable CD4/ proportion starting ART
� 95 developed TB
� 3.6/100py in placebo vs 2.3/100py in IPT
� Study drug discontinued
� 2.5% in placebo vs 4.1% in IPT
� Deaths was similar
� 3.0% in placebo vs 2.1 in IPT
� Apparently effect waned slower than Thibela/Botusa
MX Rangaka et al. Randomized controlled trial of isoniazid preventive therapy in HIV-infected persons
on antiretroviral therapy. Nineteenth International AIDS Conference, Washington DC, abstract THLBB03,
2012

5/2/2013
23
RCT continued: Conclusion� Under field conditions
� 12 months of IPT
�Reduced the incidence of TB
�Did not cause excess harm in HIV-infected
individuals established on ART or newly
starting ART.
� IPT feasible in busy ART clinics
MX Rangaka et al. Randomized controlled trial of isoniazid preventive therapy in HIV-infected persons on antiretroviral therapy. Nineteenth International AIDS Conference, Washington DC, abstract THLBB03, 2012
Effect of IPT and ART on TB incidence
Golub. AIDS.2009 TB Incidence
/100py
aHR (95% CI)
No IPT/ART 7.1 1
ART 4.6 0.36 (0.25-0.5)
ART/IPT 1.1 0.11 (0.02-0.8)
Golub et al. Isoniazid preventive therapy, HAART and tuberculosis risk in
HIV-infected adults in South Africa: a prospective cohort.. AIDS 2009,
23:631–636

5/2/2013
24
Death after IPT & ART
Deaths PYRS RATE/100 95% CI
Never started 227 2,047 11.08 (9.74-12.63)
Started INH 32 863 3.71 (2.62-5.24)
Golub et al. Isoniazid preventive therapy, HAART and tuberculosis risk in HIV-infected adults in South Africa: a prospective cohort. AIDS 2009, 23:631–636
Results – Multivariable analysis
Unadjusted analysis
(N=3270)
Adjusted analysis*
(N=3094)
INH Death
Rate
/100py
Hazard
Ratio (HR)
95% CI
(P value)
Hazard
Ratio
(HR)
95% CI
(P value)
No
Yes
11.10
3.71
1
0.34
(P<0.001)
0.24 – 0.49
1
0.51
P=0.002
0.32 – 0.80
*Adjusted for age group, baseline WHO stage, baseline CD4 count,
year started on ART and previous TB
Innes C et al. Effectiveness of isoniazid preventive therapy inreducing mortality in patients on ART. Seventeenth CROI abstract 102, 2010
5/2/2013
25
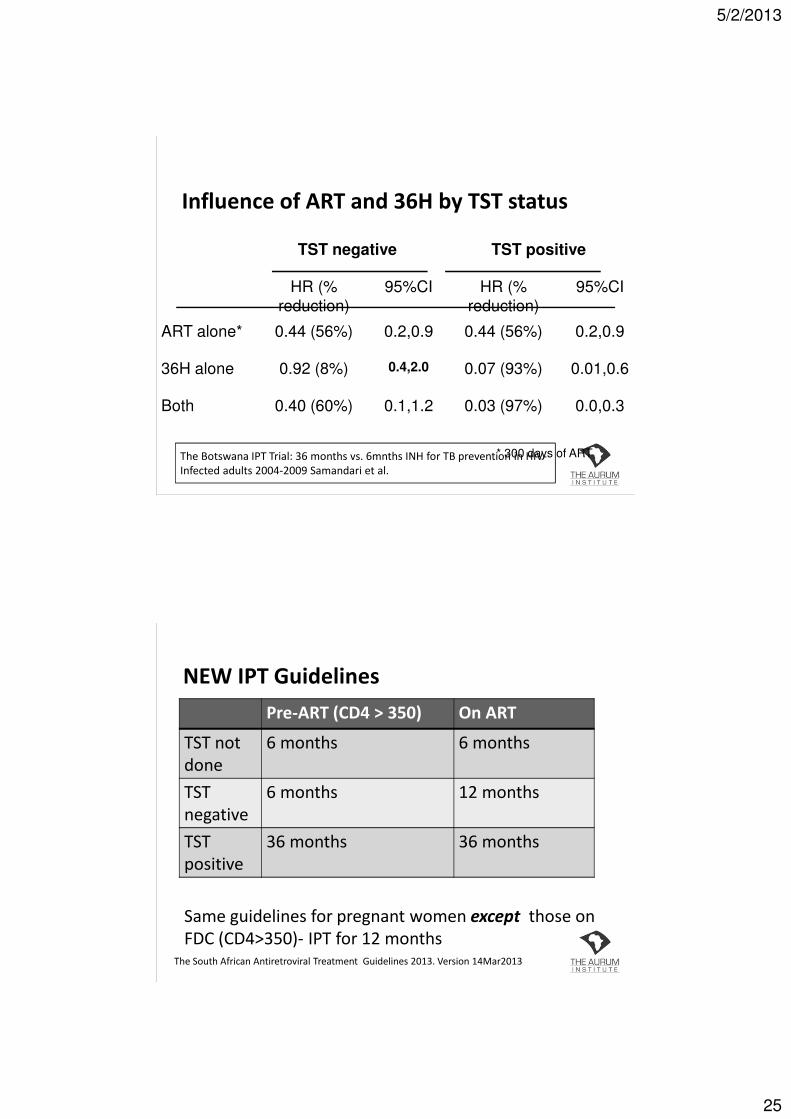
Influence of ART and 36H by TST status
TST negative TST positive
HR (%
reduction)
95%CI HR (%
reduction)
95%CI
ART alone* 0.44 (56%) 0.2,0.9 0.44 (56%) 0.2,0.9
36H alone 0.92 (8%) 0.4,2.0 0.07 (93%) 0.01,0.6
Both 0.40 (60%) 0.1,1.2 0.03 (97%) 0.0,0.3
* 300 days of ARTThe Botswana IPT Trial: 36 months vs. 6mnths INH for TB prevention in HIV-
Infected adults 2004-2009 Samandari et al.
NEW IPT Guidelines
Pre-ART (CD4 > 350) On ART
TST not
done
6 months 6 months
TST
negative
6 months 12 months
TST
positive
36 months 36 months
The South African Antiretroviral Treatment Guidelines 2013. Version 14Mar2013
Same guidelines for pregnant women except those on
FDC (CD4>350)- IPT for 12 months

5/2/2013
26
TST cont.
� Although new guidelines “require” TST
�Do not delay IPT while awaiting TST
�Provision is made for “TST not done”
Conclusion of evidence
� Feasible to implement IPT at scale
� IPT can be delivered safely with clinical
monitoring by trained nursing staff
� IPT not associated with increased INH resistance
� IPT with ART reduces TB incidence and mortality
� IPT reduces TB in HIV clinics
� TST required to determine duration of IPT

5/2/2013
27
Questions?