10 CVL 37 BMT LAB III sem, Civil Engg. - cittumkur.org sem BMT LAB MANUAL.pdf · If the student...
78
15 CVL 37 – Building Materials Testing Laboratory 2017-18 Dept. of Civil Engg, CIT, Gubbi – 572 216 Page 1 Channabasaveshwara Institute of Technology (An ISO 9001:2015 Certified Institution) NH 206 (B.H. Road), Gubbi, Tumkur – 572 216. Karnataka. SYLLABUS Building Materials Testing Laboratory (15 CVL 37) As per Choice Based Credit System (CBCS) Scheme Number of Lecture Hours/Week: 03 IA Marks: 20 Total Number of Lecture Hours: 42 Exam Marks: 80 Credits: 02 Exam Hours: 03 Experiments: 1. Tension test on mild steel and HYSD bars. 2. Compression test on mild steel, cast iron and wood. 3. Torsion test on mild steel circular sections. 4. Bending Test on Wood Under two point loading 5. Shear Test on Mild steel. 6. Impact test on Mild Steel (Charpy & Izod). 7. Hardness tests on ferrous and non-ferrous metals – Brinell’s, Rockwell and Vicker’s. 8. Test on Bricks and Tiles. 9. Tests on Fine aggregates – Moisture content, Specific Gravity, Bulk density, Sieve analysis and Bulking. 10. Tests on Coarse aggregates – Absorption, Moisture content, Specific Gravity, Bulk density and Sieve analysis. 11. Demonstration of Strain gauges and Strain Indicators. Question paper pattern: Group experiments - Tension test, compression test, torsion test and bending test. Individual Experiments - Remaining tests. Two questions are to be set - One from group experiments and the other as individual experiment. Instructions as printed on the cover page of answer script for split up of marks to be strictly followed. All exercises are to be included for practical examination. Reference Books: 1. Davis, Troxell and Hawk, “Testing of Engineering Materials”, International Student Edition – McGraw Hill Book Co. New Delhi. 2. M L Gambhir and Neha Jamwal, “Building and construction materials- Testing and Quality control”, McGraw Hill education (India)Pvt. Ltd., 2014 3. Fenner, “Mechanical Testing of Materials”, George Newnes Ltd. London. 4. Holes K A, “Experimental Strength of Materials”, English Universities Press Ltd. London. 5. Suryanarayana A K, “Testing of Metallic Materials”, Prentice Hall of India Pvt. Ltd. New Delhi. 6. Kukreja C B, Kishore K. and Ravi Chawla “Material Testing Laboratory Manual”, Standard Publishers & Distributors 1996. 7. Relevant IS Codes.
Transcript of 10 CVL 37 BMT LAB III sem, Civil Engg. - cittumkur.org sem BMT LAB MANUAL.pdf · If the student...

15 CVL 37 – Building Materials Testing Laboratory 2017-18
Dept. of Civil Engg, CIT, Gubbi – 572 216 Page 1
Channabasaveshwara Institute of Technology(An ISO 9001:2015 Certified Institution)
NH 206 (B.H. Road), Gubbi, Tumkur – 572 216. Karnataka.
SYLLABUSBuilding Materials Testing Laboratory (15 CVL 37)
As per Choice Based Credit System (CBCS) Scheme
Number of Lecture Hours/Week: 03 IA Marks: 20Total Number of Lecture Hours: 42 Exam Marks: 80
Credits: 02 Exam Hours: 03Experiments:
1. Tension test on mild steel and HYSD bars.2. Compression test on mild steel, cast iron and wood.3. Torsion test on mild steel circular sections.4. Bending Test on Wood Under two point loading5. Shear Test on Mild steel.6. Impact test on Mild Steel (Charpy & Izod).7. Hardness tests on ferrous and non-ferrous metals – Brinell’s, Rockwell and Vicker’s.8. Test on Bricks and Tiles.9. Tests on Fine aggregates – Moisture content, Specific Gravity, Bulk density, Sieve
analysis and Bulking.10. Tests on Coarse aggregates – Absorption, Moisture content, Specific Gravity, Bulk
density and Sieve analysis.11. Demonstration of Strain gauges and Strain Indicators.
Question paper pattern: Group experiments - Tension test, compression test, torsion test and bending test. Individual Experiments - Remaining tests. Two questions are to be set - One from group experiments and the other as
individual experiment. Instructions as printed on the cover page of answer script for split up of marks to
be strictly followed. All exercises are to be included for practical examination.
Reference Books:1. Davis, Troxell and Hawk, “Testing of Engineering Materials”, International StudentEdition – McGraw Hill Book Co. New Delhi.
2. M L Gambhir and Neha Jamwal, “Building and construction materials- Testing andQuality control”, McGraw Hill education (India)Pvt. Ltd., 2014
3. Fenner, “Mechanical Testing of Materials”, George Newnes Ltd. London.4. Holes K A, “Experimental Strength of Materials”, English Universities Press Ltd.London.
5. Suryanarayana A K, “Testing of Metallic Materials”, Prentice Hall of India Pvt. Ltd.New Delhi.
6. Kukreja C B, Kishore K. and Ravi Chawla “Material Testing Laboratory Manual”,Standard Publishers & Distributors 1996.
7. Relevant IS Codes.

15 CVL 37 – Building Materials Testing Laboratory 2017-18
Dept. of Civil Engg, CIT, Gubbi – 572 216 Page 2
Channabasaveshwara Institute of Technology(An ISO 9001:2015 Certified Institution)
NH 206 (B.H. Road), Gubbi, Tumkur – 572 216. Karnataka.
Department of Civil Engineering
Building Materials Testing Laboratory (15 CVL 37)
Course ObjectiveThe objective of the Materials Testing Laboratory is to demonstrate the basic
principles in the area of strength and mechanics of materials to the undergraduate students
through a series of experiments. The objectives of this course are to make students to
learn:
Ability to apply knowledge of mathematics and engineering in calculating the
mechanical properties of structural materials.
Ability to function on multi-disciplinary teams in the area of materials testing.
Ability to use the techniques, skills and modern engineering tools necessary for
engineering.
Understanding of professional and ethical responsibility in the areas of material
testing.
Ability to communicate effectively the mechanical properties of materials.
Course OutcomeAfter successful completion of the course, the students will be able to:
Reproduce the basic knowledge of mathematics and engineering in finding the
strength in tension, compression, shear and torsion.
Identify, formulate and solve engineering problems of structural elements
subjected to flexure.
Evaluate the impact of engineering solutions on the society and also will be aware
of contemporary issues regarding failure of structures due to undesirable materials.
INDEX PAGE

15 CVL 37 – Building Materials Testing Laboratory 2017-18
Dept. of Civil Engg, CIT, Gubbi – 572 216 Page 3
Note: If the student fails to attend the regular lab, theexperiment has to be completed in the same week. Thenthe manual/observation and record will be evaluated for50% of maximum marks.
Instructions to the Candidates
Sl.No
Name of theExperiment
Date
Manual
Marks
(Max.20)
Record
Marks
(Max.10)
Signature
ofStudent
Signature
ofFaculty
Conduction Repetition Submissionof Record
Average
15 CVL 37 – Building Materials Testing Laboratory 2017-18
Dept. of Civil Engg, CIT, Gubbi – 572 216 Page 4
1. Students should come with thorough preparation for the experiment to be
conducted.
2. Students will not be permitted to attend the laboratory unless they bring the
practical record fully completed in all respects pertaining to the experiment
conducted in the previous class.
3. All the calculations should be made in the observation book. Specimen
calculations for one set of readings have to be shown in the practical record.
4. Wherever graphs are to be drawn, A-4 size graphs only should be used and the
same should be firmly attached to the practical record.
5. Practical record should be neatly maintained.
6. They should obtain the signature of the staff-in-charge in the observation book
after completing each experiment.
7. Theory regarding each experiment should be written in the practical record before
procedure in your own words.
CONTENTS
15 CVL 37 – Building Materials Testing Laboratory 2017-18
Dept. of Civil Engg, CIT, Gubbi – 572 216 Page 5
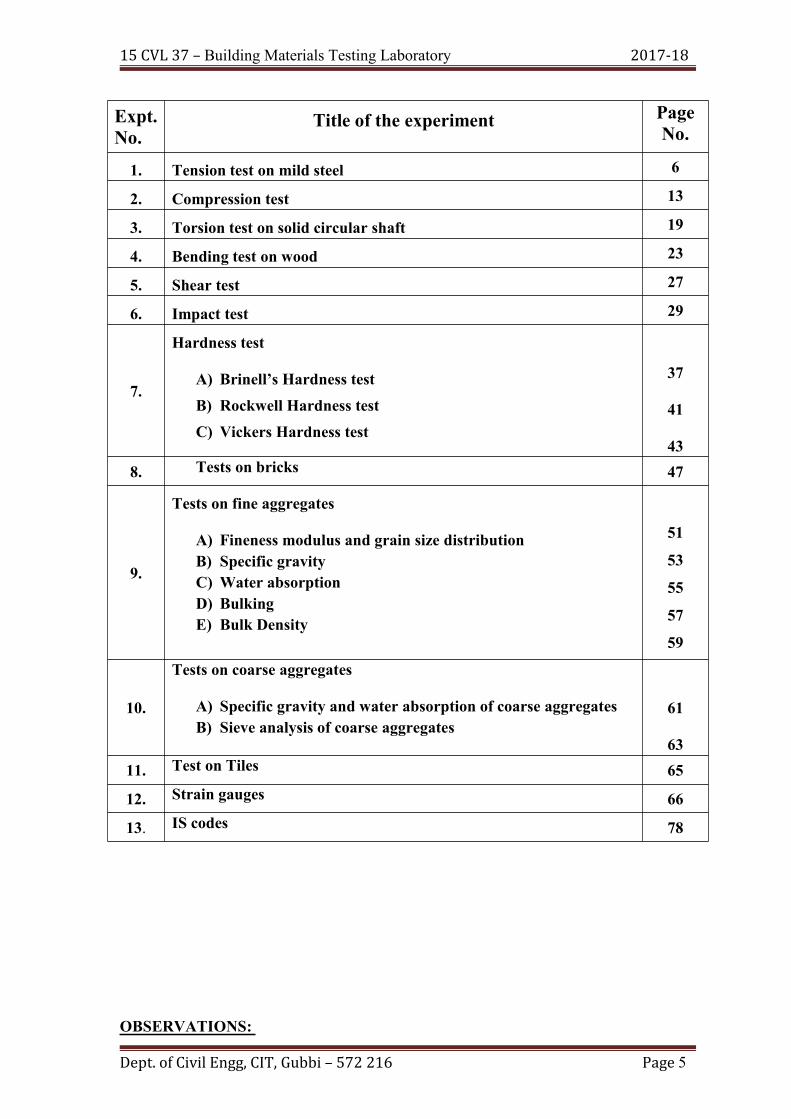
OBSERVATIONS:
Expt.No.
Title of the experiment PageNo.
1. Tension test on mild steel 6
2. Compression test 13
3. Torsion test on solid circular shaft 19
4. Bending test on wood 23
5. Shear test 27
6. Impact test 29
7.
Hardness test
A) Brinell’s Hardness testB) Rockwell Hardness testC) Vickers Hardness test
37
41
438. Tests on bricks 47
9.
Tests on fine aggregates
A) Fineness modulus and grain size distributionB) Specific gravityC) Water absorptionD) BulkingE) Bulk Density
51
53
55
57
59
10.
Tests on coarse aggregates
A) Specific gravity and water absorption of coarse aggregatesB) Sieve analysis of coarse aggregates
61
6311. Test on Tiles 65
12. Strain gauges 66
13. IS codes 78

15 CVL 37 – Building Materials Testing Laboratory 2017-18
Dept. of Civil Engg, CIT, Gubbi – 572 216 Page 6
Material of the specimen :
1. Least count of the Calipers :
2. Diameter of the specimen :
Initial Diameter (di) Final Diameter (df)
TrailNo.
Dia indirection-1(mm)
Dia indirection-2(mm)
Avg. Dia(mm)
TrailNo.
Dia indirection-1(mm)
Dia indirection-2(mm)
Avg. Dia(mm)
1. 1.2. 2.
BEFORE TEST:
1. Gauge length lo = mm
2. Length of the specimen in mm L = mm
3. Mean diameter of the specimen do = mm
4. Original cross-sectional area Ao = mm2
5.Least count of the extensometer = mm
AFTER TEST:
1. Diameter of the specimen at neck df = mm
2. Final cross-sectional area at neck Af = mm2
3. Final gauge length of the specimen lf = mm
CALCULATION:
Yield Stress = Yield load / Original c/s area=…………….
Young’s Modulus = Stress / Strain= ………………….. (from graph)
Working Stress = Yield stress / Factor of safety= ……………….
% Elongation = ( lf – lo) x 100lo
= ………………. % reduction in Area = Ao – Af)
Ao
=………………...
Expt. No. 1 Date :TENSION TEST ONMILD STEEL

15 CVL 37 – Building Materials Testing Laboratory 2017-18
Dept. of Civil Engg, CIT, Gubbi – 572 216 Page 7
OBJECTIVES:
i) To study the behavior of mild steel test specimen under the action of agradually increasing load tested up to failure.
ii) To determine the Yield stress, Modulus of Elasticity, Percentageelongation, Percentage reduction in area, Ultimate stress and Breakingstress.
APPARATUS:Universal testing machine, Extensometer, Vernier Calipers, scale and Gripping devices.
Gripping device:To grip securely the round specimen, the flat inner sides of the jaws have a
V-shaped groove. The gripping surfaces are serrated to allow a firm grip. Dependingupon the size of the specimen, jaws with appropriate V-grooves in them area selected.
Extensometer:The gauge length of extensometer used is adjustable upto a maximum value of
13cm. There are pair of knife edges at top and bottom which are used to grip thespecimen between gauge points. The top knife edges are fixed while the extension ofspecimen causes the bottom knife edges to move down. The movement of these knifeedges are magnified by a lever and transmitted to two dial gauges (one on either side) bya rack and pinion mechanism. The least count of extensometer is 0.01mm and it canmeasure upto 3mm. Two springs, one fixed at bottom and other placed at a top will keepextensometer in position.
THEORY: The definitions of the terms used in this test are given below.
Gauge Length:The reference length over which extension is measured.
Stress:When a material is subjected to action of forces, it develops resistance. The
resistance per unit area is called stress.Linear Strain :
Change in length per unit length.Yield Stress:
Stress at which considerable elongation first occurs in the test piece without acorresponding increase in the load.Tensile Strength:
The maximum load reached in a tension test divided by the original area of cross-section. This is also termed as Ultimate strength.
TABULAR COLUMN

15 CVL 37 – Building Materials Testing Laboratory 2017-18
Dept. of Civil Engg, CIT, Gubbi – 572 216 Page 8
Sl No. Load(KN)
Increase in length(l)
Stress = P / A(N/mm2)
Strain =(l / lo)
Remarks
Modulus of Elasticity:

15 CVL 37 – Building Materials Testing Laboratory 2017-18
Dept. of Civil Engg, CIT, Gubbi – 572 216 Page 9
The ratio of normal stress to axial strain within elastic limit. This is also termed asthe Young’s modulus.Percentage Elongation:
The permanent elongation of the gauge length after breaking, expressed as apercentage of the original gauge length.Percentage reduction in area:
The change in cross-sectional area which has occurred during the test at the neck ,expressed as a percentage on the original area of cross-section.Resilience:
The amount of energy that a unit volume of materials can absorb within the elasticrange is called Resilience or in quantitative terms, the modulus of resilience. The areaunder the load elongation curve upto the elastic limit is equal to energy absorbed(Resilience) by the specimen and the area under the stress – strain curve upto the elasticlimit is the energy per unit volume or the modulus of resilience. This energy is potentialenergy and is therefore released whenever a member is unloaded.Toughness:
Toughness of the material is its ability to absorb the energy in plastic range. Thearea under stress – strain curve to the fracture point may be visualized as representing theenergy to cause failure per unit volume of the material, which is referred to as Modulus oftoughness of the material. An approximate formula to measure modulus of toughness isTo = σu (Lf – Lo) / Lo
Proof Stress:Proof stress is the stress which is just sufficient to cause a non – linear elongation
equal to a specified percentage of the gauge length. This is used for materials which donot have a definite yield point.Tangent Modulus:
It is the slope of the tangent to the stress – strain diagram at any specified point.This is used where the stress strain diagram is not a straight line even in the initial stage.
tanϴ = stress/ strain A – Elastic limittanϴ = (σ/ϵ) B – Upper yield stress
C – Lower yield stressD – Ultimate stressE – Breaking stress
Stress – Strain curve
σ
ϵ

15 CVL 37 – Building Materials Testing Laboratory 2017-18
Dept. of Civil Engg, CIT, Gubbi – 572 216 Page 10
NOTE:1. Up to yield point, use gauge length of the given extensometer for calculating the strainand after the yield point, use the full length of the specimen for calculating thecorresponding strain.2. Strength of Materials is the body of knowledge, which deals with the relation betweenthe internal forces, deformation and external loads.3. Cup and Cone Fracture for mild steel (ductile materials)
When a circular wire, rod or round tensile test specimen is stressed(in tension/pulling) beyond the yield point (or yield strength) themetal will become plastic and will “flow” at the weakestlocation. The circular cross section at this location will bediminished (necking). As the stressing/pulling continues, the metalwill separate or fail at this location. The resultant fracture will have acharacteristic appearance. One side of the fracture will appear to bea cup and the mating (pointed) fracture will appear to be a“cone”. This type of tensile overload fracture is referred to as “cupand cone”.
Cup Cone

15 CVL 37 – Building Materials Testing Laboratory 2017-18
Dept. of Civil Engg, CIT, Gubbi – 572 216 Page 11
PROCEDURE:
1. Measure the diameter at three locations and take the average value. Similarly, notedown the length of the specimen.
2. Fix the specimen in the jaws of the UTM.3. Fix the extensometer on the specimen and note the gauge length of the
extensometer.4. Set the extensometer and side scale to read zero.5. Apply the load gradually making observations at regular intervals of load, the
corresponding reading on extensometer is noted.6. Observe the yield point load indicating a slight kickback of the load pointer.7. Remove the extensometer noting its reading at the yielding point.8. Further load the specimen. Start measuring the change in length with the help of
side scale reading on the UTM. Observe the maximum and breaking load.9. Remove the broken specimen and measure its final length and diameter at the
neck formation.
Result:
Working stress =
Young’s Modulus of specimen =
Yield stress =
Ultimate stress =
Breaking stress =
% Elongation =
%Reduction in area =
Date………………….Signature of the Faculty

15 CVL 37 – Building Materials Testing Laboratory 2017-18
Dept. of Civil Engg, CIT, Gubbi – 572 216 Page 12
OBSERVATIONS:Material of the specimen : Mild steel
BEFORE TEST:
1. Least count of the Vernier calipers =
2. Least count of dial gauge =
3. Mean diameter of the specimen in ‘mm’ ‘do’ =
4. length of the specimen in ‘mm’, ‘lo’ =
5. Original cross-sectional area in (mm)2, Ao’ = [π(do)2] / 4 =
AFTER TEST:
1. Diameter of the specimen at neck in ‘mm’, ‘df’ =
2. Final length of the specimen in ‘mm’, ‘lf’ =
3. Final cross-sectional area in (mm)2, ‘Af’ = [π(df)2 ] / 4 =
TABULAR COLUMN
Load(P)
Dial gaugereadings(mm)
Deformation(l)
Stress =P / Ao
(N/mm2)
Strain =l / lo
Remarks
15 CVL 37 – Building Materials Testing Laboratory 2017-18
Dept. of Civil Engg, CIT, Gubbi – 572 216 Page 13
Expt. No. 2 Date:COMPRESSION TEST
OBJECTIVES:
i) To study the behavior of the materials under a gradually increasing axialcompressive load
ii) To determine the proportionality limit for ductile materials andcompressive strength for brittle materials.
iii) To obtain the value of modulus of elasticity or tangent modulus.
APPARATUS:
Universal testing machine, Vernier caliper, Dial gauge and Scale.
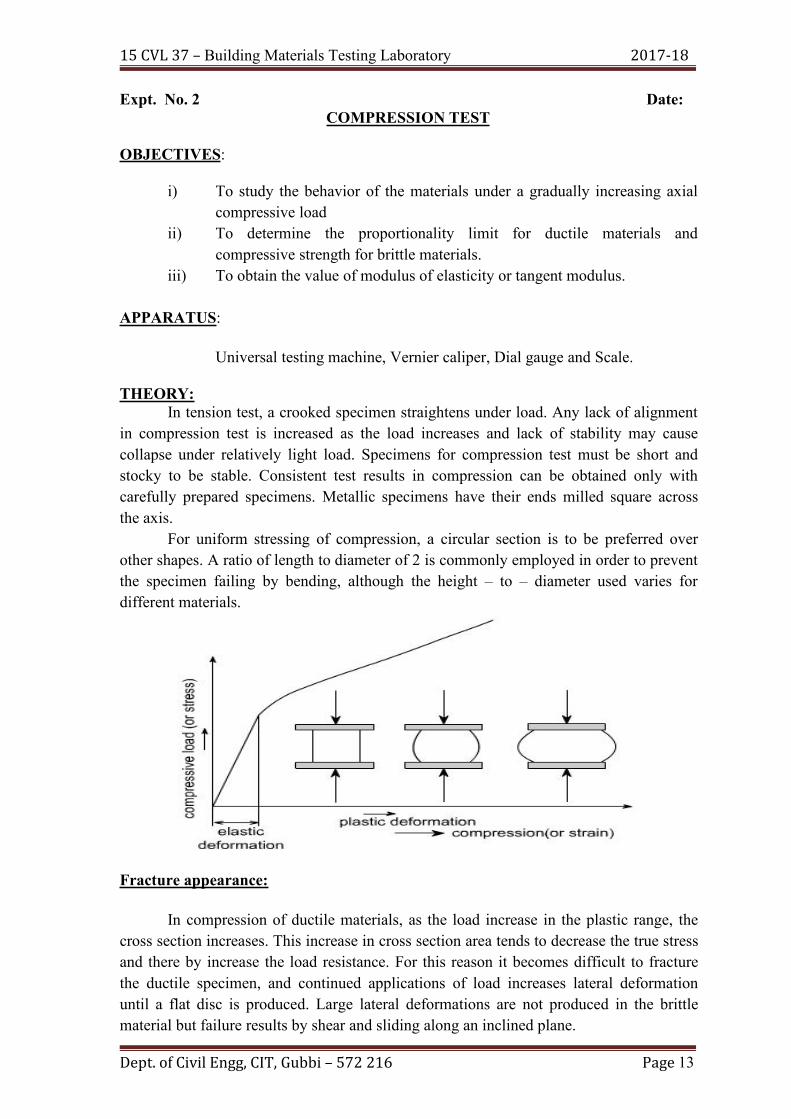
THEORY:In tension test, a crooked specimen straightens under load. Any lack of alignment
in compression test is increased as the load increases and lack of stability may causecollapse under relatively light load. Specimens for compression test must be short andstocky to be stable. Consistent test results in compression can be obtained only withcarefully prepared specimens. Metallic specimens have their ends milled square acrossthe axis.
For uniform stressing of compression, a circular section is to be preferred overother shapes. A ratio of length to diameter of 2 is commonly employed in order to preventthe specimen failing by bending, although the height – to – diameter used varies fordifferent materials.
Fracture appearance:
In compression of ductile materials, as the load increase in the plastic range, thecross section increases. This increase in cross section area tends to decrease the true stressand there by increase the load resistance. For this reason it becomes difficult to fracturethe ductile specimen, and continued applications of load increases lateral deformationuntil a flat disc is produced. Large lateral deformations are not produced in the brittlematerial but failure results by shear and sliding along an inclined plane.

15 CVL 37 – Building Materials Testing Laboratory 2017-18
Dept. of Civil Engg, CIT, Gubbi – 572 216 Page 14
CALCULATION:
Load at proportionality , Fp =
Maximum load Fmax =
Proportionality limit = Fp / Ao
=
Compressive strength = Fmax / Ao
=
% Contraction at failure = ( lo – lf) x 100
lo
= ……………….
% increase in Area = (Af – Ao) x 100
Ao =………………...

15 CVL 37 – Building Materials Testing Laboratory 2017-18
Dept. of Civil Engg, CIT, Gubbi – 572 216 Page 15
PROCEDURE:
1. Measure the diameter at three locations and take the average value using dial
gauge, similarly note down the lengths of the specimen.
2. Fix the specimen in the jaws of UTM.
3. Adjust the dial gauge to zero reading.
4. Gradually apply the load and record the yield point and maximum load in the
case of ductile materials or breaking load in the case of brittle material.
5. Remove the broken specimen (if it is brittle) from the machine. Observe the
location and the character of the fracture and measure the final diameter and
length.
6. Plot stress – strain diagram for the test and compute all properties.
tanϴ = stress/ strain
tanϴ = (σ/ϵ)
Result:
Young’s Modulus of specimen =
Maximum compressive strength or Ultimate stress =
%Decrease in length =
% increase in area =
σ
ϵ
15 CVL 37 – Building Materials Testing Laboratory 2017-18
Dept. of Civil Engg, CIT, Gubbi – 572 216 Page 16
OBSERVATIONS:
Material of the specimen : CAST IRON
BEFORE TEST:
1. Least count of the Vernier calipers =
2. Least count of dial gauge =
3. Mean diameter of the specimen in ‘mm’ ‘do’=
4. length of the specimen in ‘mm’, ‘lo’=
5. Original cross-sectional area in (mm)2, Ao’ = [π(do)2] / 4 =
AFTER TEST:
1. Diameter of the specimen at neck in ‘mm’, ‘df’=
2. Final length of the specimen in ‘mm’, ‘lf’=
3. Final cross-sectional area in (mm)2, ‘Af’= [π(df)2 ] / 4 =
TABULAR COLUMN
Load(P)
Dial gaugereadings(mm)
Deformation(l)
Stress =P / Ao
(N/mm2)
Strain =l / lo
Remarks

15 CVL 37 – Building Materials Testing Laboratory 2017-18
Dept. of Civil Engg, CIT, Gubbi – 572 216 Page 17
CALCULATION:
Load at proportionality , Fp =
Maximum load Fmax =
Proportionality limit = Fp / Ao
=
Compressive strength = Fmax / Ao
=
% Contraction at failure = ( lo – lf) x 100
lo
= ……………….
% reduction in Area = (Af – Ao) x 100
Ao
=………………...
Result:
Young’s Modulus of specimen =
Maximum compressive strength or Ultimate stress =
%Decrease in length =
% increase in area =
Date…………………. Signature of the Faculty

15 CVL 37 – Building Materials Testing Laboratory 2017-18
Dept. of Civil Engg, CIT, Gubbi – 572 216 Page 18
OBSERVATIONS:
Length of the specimen (l) = ………………….. mm
Mean diameter of a specimen (D) = ……………mm
TABULAR COLUMN
Angle of twistin degrees
Angle of twistin Radians
Torque in No.of divisions
Torque in Kg-cm Remarks
15 CVL 37 – Building Materials Testing Laboratory 2017-18
Dept. of Civil Engg, CIT, Gubbi – 572 216 Page 19
Expt.No.3 Date:TORSION TEST ONMILD STEEL CIRCULAR SECTIONS
OBJECTIVES:
To study the behavior of mild steel when subjected to a gradually increasing torque and todetermine:
i. Modulus of rigidity of the materialii. Yield point in sheariii. Modulus of rupture (torsion)
APPARATUS:Torsion testing machine, Vernier calipers, Measuring scale, Specimen etc
THEORY:
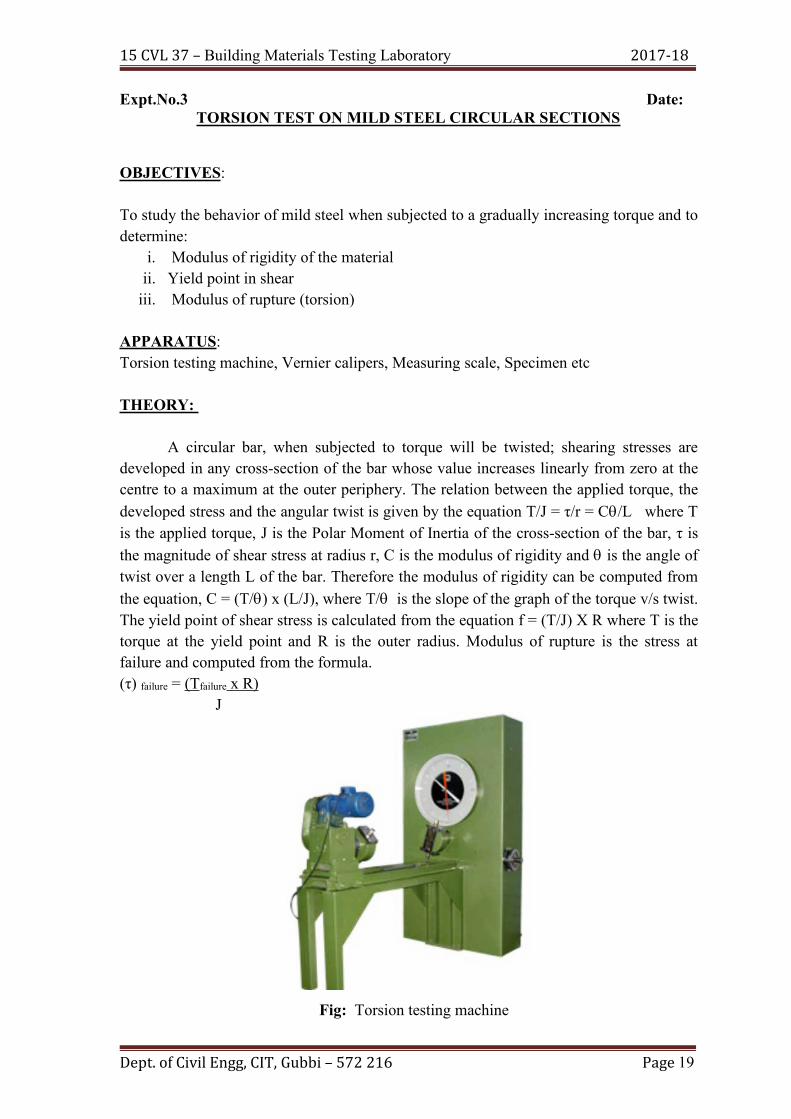
A circular bar, when subjected to torque will be twisted; shearing stresses aredeveloped in any cross-section of the bar whose value increases linearly from zero at thecentre to a maximum at the outer periphery. The relation between the applied torque, thedeveloped stress and the angular twist is given by the equation T/J = τ/r = C/L where Tis the applied torque, J is the Polar Moment of Inertia of the cross-section of the bar, τ isthe magnitude of shear stress at radius r, C is the modulus of rigidity and is the angle oftwist over a length L of the bar. Therefore the modulus of rigidity can be computed fromthe equation, C = (T/) x (L/J), where T/ is the slope of the graph of the torque v/s twist.The yield point of shear stress is calculated from the equation f = (T/J) X R where T is thetorque at the yield point and R is the outer radius. Modulus of rupture is the stress atfailure and computed from the formula.(τ) failure = (Tfailure x R)
J
Fig: Torsion testing machine
15 CVL 37 – Building Materials Testing Laboratory 2017-18
Dept. of Civil Engg, CIT, Gubbi – 572 216 Page 20
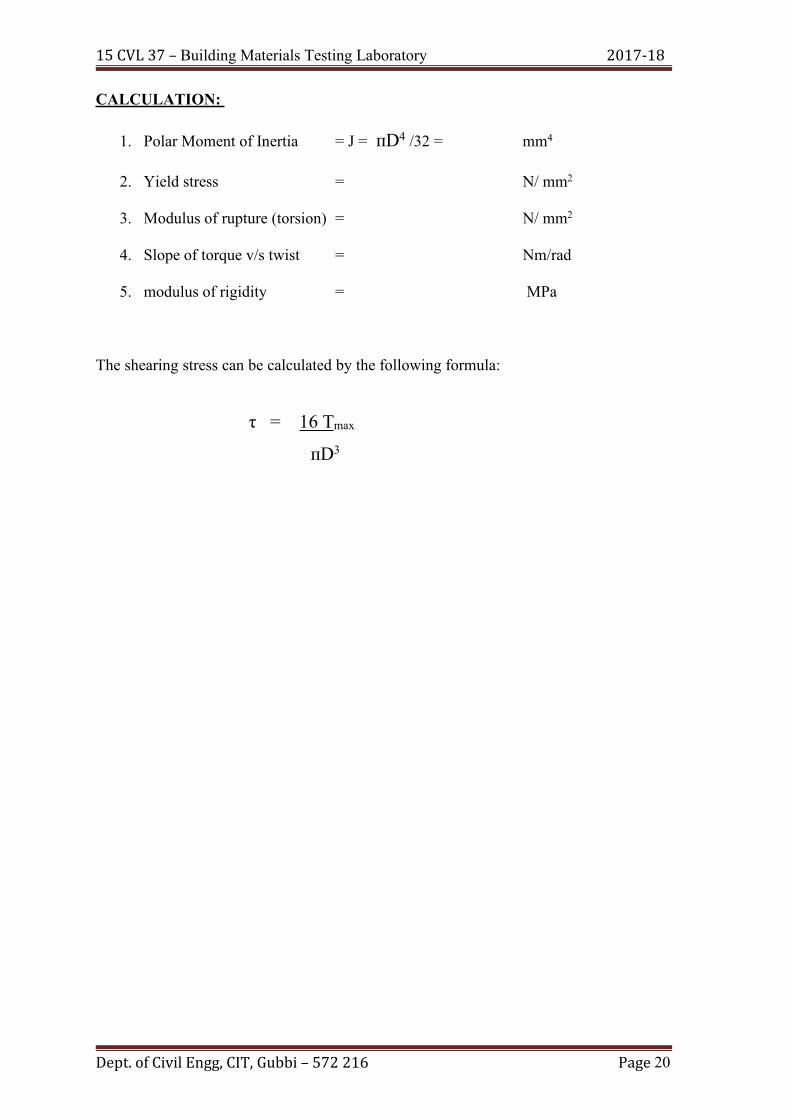
CALCULATION:
1. Polar Moment of Inertia = J = пD4 /32 = mm4
2. Yield stress = N/ mm2
3. Modulus of rupture (torsion) = N/ mm2
4. Slope of torque v/s twist = Nm/rad
5. modulus of rigidity = MPa
The shearing stress can be calculated by the following formula:
τ = 16 Tmax
пD3

15 CVL 37 – Building Materials Testing Laboratory 2017-18
Dept. of Civil Engg, CIT, Gubbi – 572 216 Page 21
PROCEDURE:
1. Measure the diameter and length of the specimen accurately using Vernier Calipers.2. Fix the specimen in the grips and clamps provided in the machine.3. Operate the driving mechanism either by hand or motor to apply the torque.4. Take the readings of torque at regular intervals of twist simultaneously until the
specimen breaks.5. Plot the graph of torque v/s angle of twist. Slope of the graph gives the torsional
stiffness.6.Calculate modulus of rigidity and torsional shear stress
Result:
Modulus of rigidity of the given specimen = C =
Maximum Torsional shear stress =
Date…………………. Signature of the Faculty
15 CVL 37 – Building Materials Testing Laboratory 2017-18
Dept. of Civil Engg, CIT, Gubbi – 572 216 Page 22
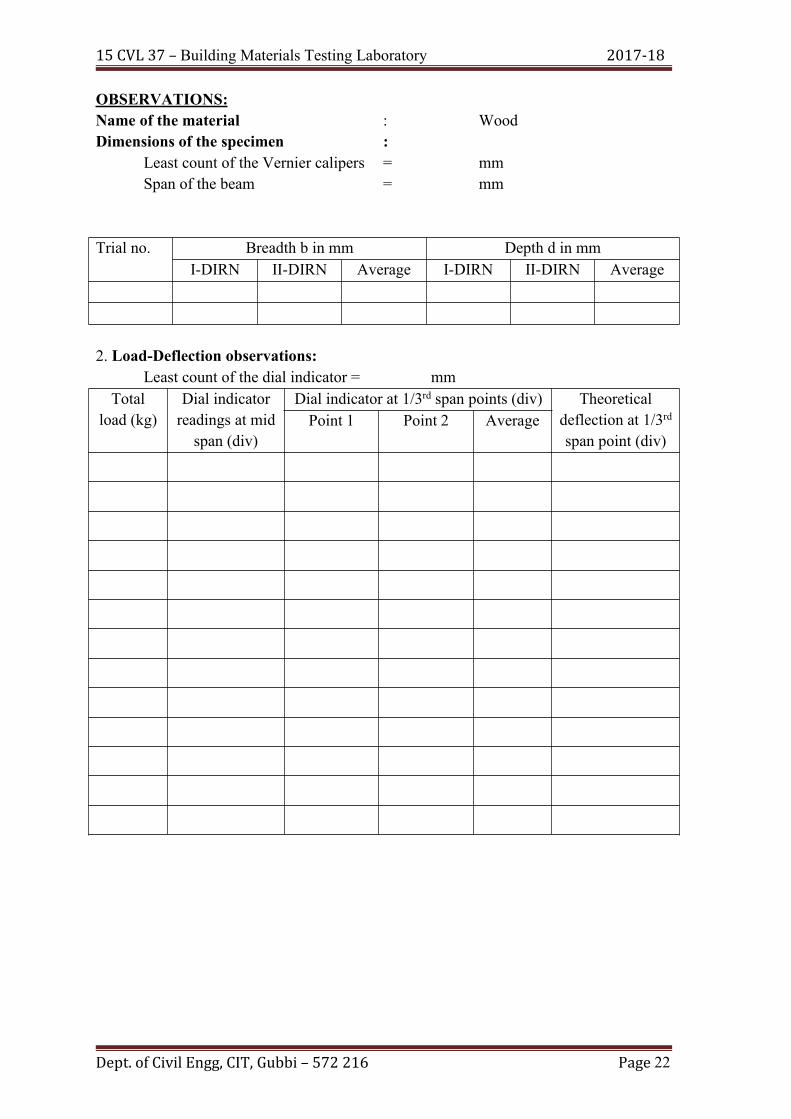
OBSERVATIONS:Name of the material : WoodDimensions of the specimen :
Least count of the Vernier calipers = mmSpan of the beam = mm
Trial no. Breadth b in mm Depth d in mmI-DIRN II-DIRN Average I-DIRN II-DIRN Average
2. Load-Deflection observations:Least count of the dial indicator = mm
Totalload (kg)
Dial indicatorreadings at midspan (div)
Dial indicator at 1/3rd span points (div) Theoreticaldeflection at 1/3rdspan point (div)
Point 1 Point 2 Average
15 CVL 37 – Building Materials Testing Laboratory 2017-18
Dept. of Civil Engg, CIT, Gubbi – 572 216 Page 23
Expt. No. 4 Date:
BENDING TEST ONWOOD UNDER TWO POINT LOADING
OBJECTIVES:i. To study the behavior of the wood specimen subjected to gradually increasing two
point equal loads each at 1/3rd of the span from both end.ii. To find the modulus of elasticity.iii. To determine the modulus of rupture or flexure modulus.
APPARATUS:Universal testing machine, dial indicators, Scale, Vernier calipers.
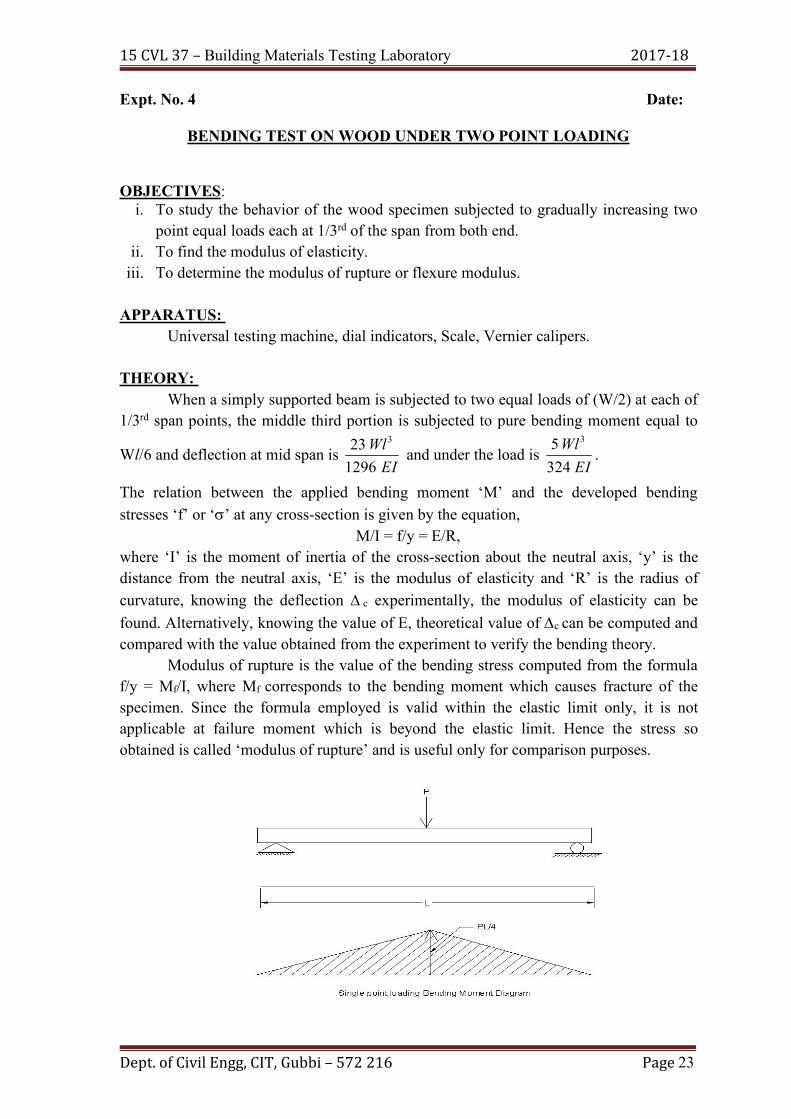
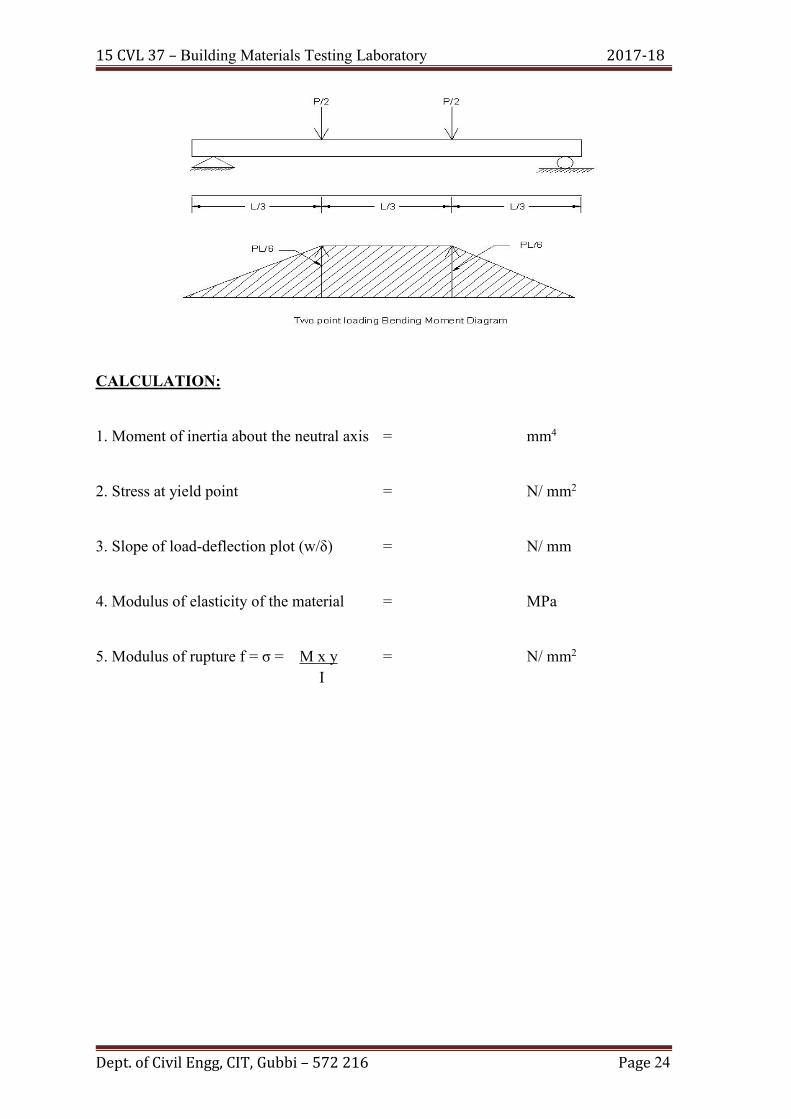
THEORY:When a simply supported beam is subjected to two equal loads of (W/2) at each of
1/3rd span points, the middle third portion is subjected to pure bending moment equal to
Wl/6 and deflection at mid span isEI
Wl129623 3
and under the load isEI
Wl3245 3
.
The relation between the applied bending moment ‘M’ and the developed bendingstresses ‘f’ or ‘’ at any cross-section is given by the equation,
M/I = f/y = E/R,where ‘I’ is the moment of inertia of the cross-section about the neutral axis, ‘y’ is thedistance from the neutral axis, ‘E’ is the modulus of elasticity and ‘R’ is the radius ofcurvature, knowing the deflection c experimentally, the modulus of elasticity can befound. Alternatively, knowing the value of E, theoretical value of c can be computed andcompared with the value obtained from the experiment to verify the bending theory.
Modulus of rupture is the value of the bending stress computed from the formulaf/y = Mf/I, where Mf corresponds to the bending moment which causes fracture of thespecimen. Since the formula employed is valid within the elastic limit only, it is notapplicable at failure moment which is beyond the elastic limit. Hence the stress soobtained is called ‘modulus of rupture’ and is useful only for comparison purposes.
15 CVL 37 – Building Materials Testing Laboratory 2017-18
Dept. of Civil Engg, CIT, Gubbi – 572 216 Page 24
CALCULATION:
1. Moment of inertia about the neutral axis = mm4
2. Stress at yield point = N/ mm2
3. Slope of load-deflection plot (w/δ) = N/ mm
4. Modulus of elasticity of the material = MPa
5. Modulus of rupture f = σ = M x y = N/ mm2
I
15 CVL 37 – Building Materials Testing Laboratory 2017-18
Dept. of Civil Engg, CIT, Gubbi – 572 216 Page 25
PROCEDURE:-
1. The cross-sectional dimensions of the specimen are noted from which the moment
of inertia about the neutral axis can be computed.
2. The specimen is placed on the roller supports which have been fixed on the lower
cross-head of the UTM and the span is noted.
3. Dial indicators are fixed to record the value of the deflections at the points of
interest.
4. The load is gradually increased and the value of the central deflection is noted for
regular load increments.
5. Plot the graph load v/s deflection.
Result:
Modulus of rupture or Bending stress =
Modulus of elasticity =
Date…………………. Signature of the Faculty
15 CVL 37 – Building Materials Testing Laboratory 2017-18
Dept. of Civil Engg, CIT, Gubbi – 572 216 Page 26
OBSERVATIONS:
Least count of Vernier Calipers = mm
TABULAR COLUMN
Type ofmaterial
Type ofshear
Dia (d)in mm
Area ‘A’(mm2)
Ultimateload(N)
Ultimate shearstrength(N/mm2)
Single
Double
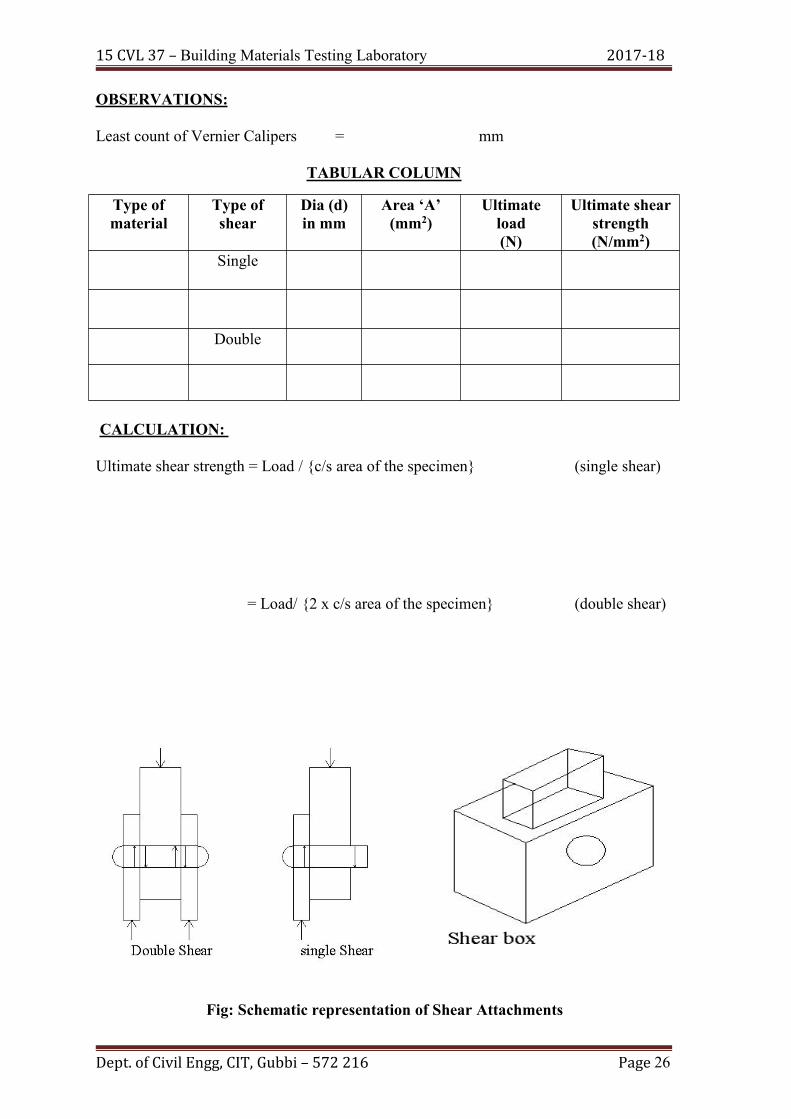
CALCULATION:
Ultimate shear strength = Load / {c/s area of the specimen} (single shear)
= Load/ {2 x c/s area of the specimen} (double shear)
Fig: Schematic representation of Shear Attachments

15 CVL 37 – Building Materials Testing Laboratory 2017-18
Dept. of Civil Engg, CIT, Gubbi – 572 216 Page 27
Expt.No.5 Date:
SHEAR TEST ONMILD STEEL
OBJECTIVES:To determine the Ultimate Shear Strength of the given material in Single shear
and Double shear.APPARATUS:
Universal Testing Machine (UTM), Vernier Calipers, Shear attachments,Micrometer, Scale.
THEORY:
Shear stress is caused by forces which act parallel to an area of cross-sectional andtend to produce sliding of one portion over another.
If there is only one cross-section which resists the failure, the material is said to bein Single Shear and the average ultimate strength in Single Shear will be equal to thefailure load divided by the area of cross-section. If two areas resist the failure, then thematerial is said to be in double Shear and the average ultimate strength in Double Shearwill be equal to the failure load divided by twice the area of cross-section
Ultimate shear strength τ = F / A for single shear andτ = F / (2A) for double shear
Where, F is the fracture load and A is the cross sectional area.
PROCEDURE:-
1. The average diameter of the given specimen is measured.2. For single shear test, fix the specimen as shown in fig (a) and apply the load
slowly at right angles to the axis of the piece through the central block. Notethe fracture load.
3. Report the shape and texture of the fractured surface.4. Repeat the above test by fixing the specimen as in fig (b) for double shear.
Result:
Ultimate shear strength (Single shear ) =
Ultimate shear strength (Double shear ) =
Date…………………. Signature of the Faculty

15 CVL 37 – Building Materials Testing Laboratory 2017-18
Dept. of Civil Engg, CIT, Gubbi – 572 216 Page 28

15 CVL 37 – Building Materials Testing Laboratory 2017-18
Dept. of Civil Engg, CIT, Gubbi – 572 216 Page 29
Expt No 6 Date:IMPACT TEST ONMILD STEEL
OBJECTIVES:To determine the impact strength of given specimen and to study the behavior of
materials under the dynamic loadings.APPARATUS:
Pendulum type Impact Testing Machine, Vernier Calipers and scale.THEORY:
The ordinary tensile and bending tests are not the true criteria of the impactqualities of a material and in all cases in which a material is employed for parts subjectedto shock or impact, tests should be made upon samples under similar conditions.1. Charpy Impact Test:
The Indian Standard method of Charpy test (U-notch) consists of breaking by oneblow from a swinging hammer under prescribed conditions, a test piece U-notched in themiddle and supported at each end. The energy absorbed for failure of the specimen isdetermined from which the impact value is obtained.
Impact strength with U-notch = KU = the energy absorbed in Joules for the failureof the specimen. The symbol KU signifies that the test was performed under standard testconditions, namely the strike energy of testing machine was 300 joules and a test piecehaving a 5mm deep U-notch was used. KU 100/3 indicates that the test was conductedwith 100 joules, striking energy on a test piece with 3mm deep notch. If during the test,piece is not completely broken; the impact value obtained is indefinite.
A standard test piece of overall length of 55mm and a square cross-section of10mm side with a central U-notch 5mm deep is employed to the test. It is placed in theCharpy impact testing machine as a simply supported beam with a span of 40mm. Thenotch is adjusted to be at the centre and such that it is on the tension side. The hammer islifted to have an initial potential energy of 300 joules, it is released without any shock andis allowed to strike the specimen and swing to the other side. After it has reached themaximum height on the other side and is in the process of swinging back, it is brought torest by the application of brakes or manually. The reading indicated by the pointer isrecorded.
2. Izod Test:The Indian standard method of Izod impact test consists of breaking by one blow
from a swinging hammer, under specified conditions, a notched test-piece, grippedvertically with the bottom of the notch in the same plane as the upper faces of the grips.The blow is struck at a fixed position on the face having the notch. The energy absorbedis determined.
15 CVL 37 – Building Materials Testing Laboratory 2017-18
Dept. of Civil Engg, CIT, Gubbi – 572 216 Page 30

15 CVL 37 – Building Materials Testing Laboratory 2017-18
Dept. of Civil Engg, CIT, Gubbi – 572 216 Page 31

15 CVL 37 – Building Materials Testing Laboratory 2017-18
Dept. of Civil Engg, CIT, Gubbi – 572 216 Page 32
OBSERVATION:
Length of the specimen (L) =
Breadth of the Specimen (b) =
Depth of the Specimen below the notch (d) =
Area of the specimen below the notch, A = (b x d) =
TABULAR COLUMN
Sl .No Type ofSpecimen
InitialReading K1
(J)
finalReading K2
(J)
Charpy impactvalue
K = K1 – K2 (J)
Charpy impactstrengthI = K / A(J / mm2)
CALCULATION:

15 CVL 37 – Building Materials Testing Laboratory 2017-18
Dept. of Civil Engg, CIT, Gubbi – 572 216 Page 33
Expt No 6 (a) Date:CHARPY IMPACT TEST
OBSERVATIONS:
Angle of drop (fall) = 140oWeight of pendulum = 20.87 Kg
SPECIFICATION:
Specimen size = (55 x 10 x 10) mmType of notch = U – NotchDepth of notch = 2 mm
PROCEDURE:
1. Fix the charpy striker in its respective position, place the charpy test specimen onsupports.
2. Align the centre at the specimen notch with respect to centre of support by meansof setting guage.
3. Touch the striker to the test specimen and adjust the indicating pointer to 300J.4. Lift the pendulum till it gets latched in its position at 140° from its vertical axis.5. Allow the pendulum to swing freely and break the specimen.6. After rupture apply the break to the pendulum slowly by operating break lever.7. Note down the reading of absorbed energy directly on the dial as indicated by the
indicating pointer.8. Before proceeding for the next test, remove the broken piece of the tested
specimen and bring indicating pointer, striker to its original position at 300J.
Result:
Average impact value of Mild Steel = …………….Joules
Average impact strength = …………….Joules / mm2
Date…………………. Signature of the Faculty

15 CVL 37 – Building Materials Testing Laboratory 2017-18
Dept. of Civil Engg, CIT, Gubbi – 572 216 Page 34
OBSERVATIONS:
Length of the specimen (L) =
Breadth of the Specimen (b) =
Depth of the Specimen below the notch (d) =
Area of the specimen below the notch, A = (b x d) =
TABULAR COLUMN
Sl .No Type ofSpecimen
InitialReading K1
(J)
finalReading K2
(J)
Charpy impactvalue
K = K1 – K2 (J)
Charpy impactstrengthI = K / A(J / mm2)
CALCULATION:
15 CVL 37 – Building Materials Testing Laboratory 2017-18
Dept. of Civil Engg, CIT, Gubbi – 572 216 Page 35
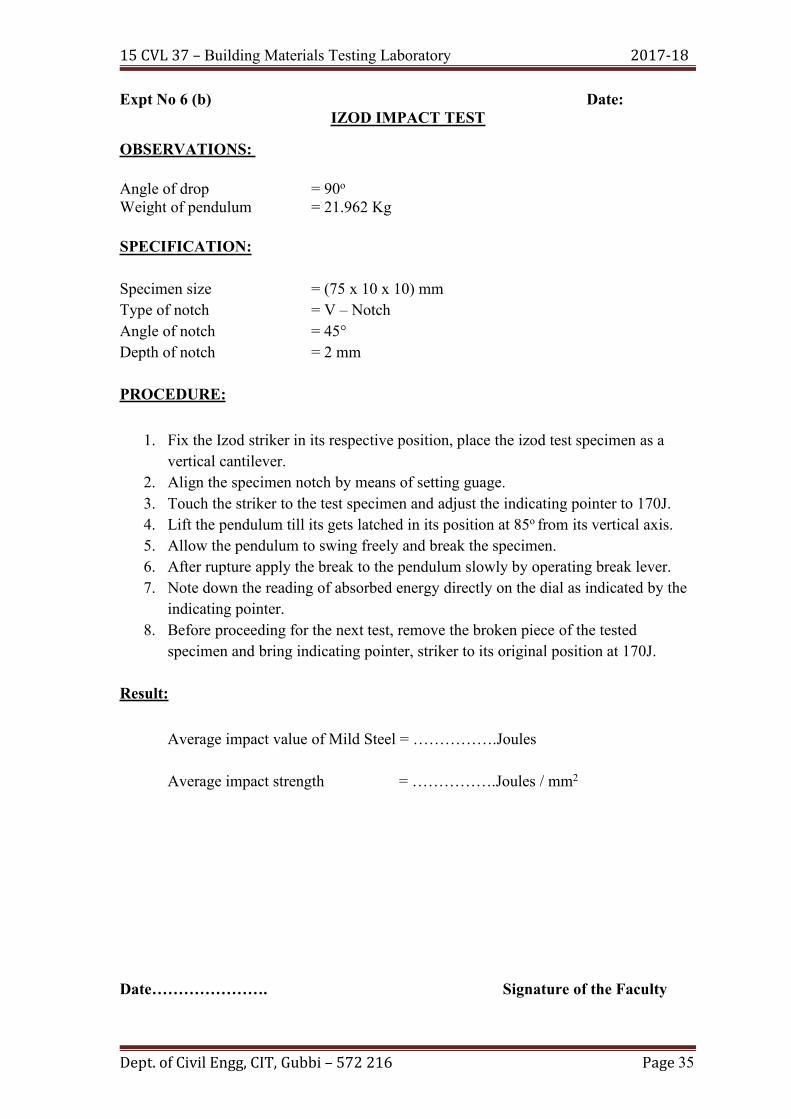
Expt No 6 (b) Date:IZOD IMPACT TEST
OBSERVATIONS:
Angle of drop = 90oWeight of pendulum = 21.962 Kg
SPECIFICATION:
Specimen size = (75 x 10 x 10) mmType of notch = V – NotchAngle of notch = 45°Depth of notch = 2 mm
PROCEDURE:
1. Fix the Izod striker in its respective position, place the izod test specimen as avertical cantilever.
2. Align the specimen notch by means of setting guage.3. Touch the striker to the test specimen and adjust the indicating pointer to 170J.4. Lift the pendulum till its gets latched in its position at 85o from its vertical axis.5. Allow the pendulum to swing freely and break the specimen.6. After rupture apply the break to the pendulum slowly by operating break lever.7. Note down the reading of absorbed energy directly on the dial as indicated by the
indicating pointer.8. Before proceeding for the next test, remove the broken piece of the tested
specimen and bring indicating pointer, striker to its original position at 170J.
Result:
Average impact value of Mild Steel = …………….Joules
Average impact strength = …………….Joules / mm2
Date…………………. Signature of the Faculty

15 CVL 37 – Building Materials Testing Laboratory 2017-18
Dept. of Civil Engg, CIT, Gubbi – 572 216 Page 36
BRINELL TEST CONDITIONS:-
Material HB Thickness oftest
specimen(mm)
Balldiameter, D
(mm)
LoadF
(Kg-f)
RelationbetweenF and D
Time load ofapplications
(sec)
Steel / Castiron
Upto 450 Over 6mm6mm to 3mm
< 3mm
1052.5
3000750187.5
F= 30D2 10 to 30
Copper & itsalloys,
Magnesiumalloys
31.8 - 130Over 6mm6mm to 3mm
< 3mm
1052.5
100025062.5
F= 10D2 30
Alluminium,Babbits 8 - 35
Over 6mm6mm to 3mm
< 3mm
1052.5
25062.515.6
F= 2.5D2 60
TABULAR COLUMN
Sl.No.
Type ofmaterial
Forceapplied(P)Kg
Time(Sec)
Indentationdia (d)In mm
BrinellHardnessNumber
AverageBHN
1
2
3
4
Mild steel
Brass
Copper
Aluminium

15 CVL 37 – Building Materials Testing Laboratory 2017-18
Dept. of Civil Engg, CIT, Gubbi – 572 216 Page 37
Expt.No.7 (a) Date:BRINELL HARDNESS TEST
OBJECTIVES:To determine the indentation hardness of the given specimen using Brinell
hardness testing machine.
APPARATUS:Brinell hardness testing machine:
In this machine the load is applied by a lever mounted on knife edges and carryinga hanger for suspending the required load. The supporting table for placing the specimencan be raised or lowered by a steel screw by operating a large hand lever. The indenterused is a hardened steel ball which will have a diameter of 10mm, 5mm or 2.5mm. Thereading microscope has a 25-fold magnification. The gap between successive graduationsof the scale is 0.5mm and a micrometer is arranged sideways which gives readings in0.01mm. The eye-piece of the reading micrometer may be turned by 90 , so thatimpressions of ball can be measured in two perpendicular directions.
THEORY:The property of hardness of a metal is usually associated with its resistance to
scratching, wear indentation or deformation. In the Brinell hardness test, which measuresresistance to indentation, a ball having a diameter ‘D’ is pressed on the material to betested under a load ‘P’. The load is maintained for 10 to 15 seconds. The diameter‘d’ ofthe produced impression is measured.
The Brinell hardness number BHN is defined as the ratio of test load to thesurface area of indentation.Brinell hardness number,
22
2dDDD
PBHN
Where,P = Applied load in Kg – fD = Diameter of Ball indentor in mmd = Diameter of indentation in mm
Although the Brinell test is a simple one to make, several precautions arenecessary in order to obtain good results. It is not adapted to testing extremely hardmaterials because the ball itself deforms too much, nor is it satisfactory for testing thinpieces such as raser blades, because the usual indentation may be greater than thethickness of the piece. It is not adopted to testing case hardened surfaces, because thedepth of indentation may be greater than the thickness of the case and because theyielding of the soft core invalidates the results; also, for such surfaces the indentation isalmost invariably surrounded by a crack that may cause fatigue failure if the part is usedin service. Obviously the Brinell test should not be used for parts the marring of thesurface of which impairs their value.Least count of Brinell Microscope = 0.01mm

15 CVL 37 – Building Materials Testing Laboratory 2017-18
Dept. of Civil Engg, CIT, Gubbi – 572 216 Page 38
CALCULATION:
We have,
22
2dDDD
PBHN
Derive the expression for BHN.

15 CVL 37 – Building Materials Testing Laboratory 2017-18
Dept. of Civil Engg, CIT, Gubbi – 572 216 Page 39
PROCEDURE:-1. Place the specimen on the anvil so that its surface will be normal to the direction
of the applied load.2. With the hand wheel, raise the anvil until the specimen just makes contact with
the ball.3. Select the load, ball diameter and the time of application of the load according to
the material to be tested as given the load test table.4. Apply the load gradually and maintain it for the specified time.5. Release the load and remove the specimen. Measure the diameter of the
impression (indentation) left by the ball indenter by using Brinell’s microscope.6. Make three trials for each specimen for calculating the hardness number.
Result:
Brinell hardness number of the given specimens is
1. Mild steel =
2. Brass =
3. Copper =
4. Aluminum =
Note: Based on BHN, the relation between the tensile strength and the hardness numberfor mild steel is as follows,
Tensile strength of Mild steel = K x BHNWhere,
K = constant between 3.4 to 3.9 for all types of steel.
Date…………………. Signature of the Faculty

15 CVL 37 – Building Materials Testing Laboratory 2017-18
Dept. of Civil Engg, CIT, Gubbi – 572 216 Page 40
ROCKWELL HARDNESS CONDITIONS:Minor load = kg
Type of material Indenter Scale Total load (Kgf)Hard metals Diamond cone C (Black graduations) 150Soft metals Ball of 1/16” in dia B (Red graduations) 100
TABULAR COLUMN
Sl.No
Type ofmaterial
Type ofindenter
Scaleused
Totalload(kg)
Rockwell Hardness NumberAverageRHN1 2 3
1 Mild steel
2 Brass
3 Copper
4 Aluminium
5 Hardenedsteel
Result:
Rockwell hardness number of the given specimens is
1. Mild steel =
2. Brass =
3. Copper =
4. Aluminum =
5. Hardened steel =

15 CVL 37 – Building Materials Testing Laboratory 2017-18
Dept. of Civil Engg, CIT, Gubbi – 572 216 Page 41
Expt.No. 7(b) Date:ROCKWELL HARDNESS TEST
OBJECTIVES:To find the Rockwell hardness number of the given specimen by using Rockwell
hardness tester.
APPARATUS:Rockwell hardness tester:
The Rockwell hardness testing machine essentially consists of a supporting tablefor placing the specimen, a hand wheel to raise or lower the supporting table, a Rockwellball indenter which is a hardened steel ball 1/16” in diameter, a Rockwell cone indenterwhich is a diamond cone of 120 apex angle, load stages adjusted by means of pushbutton switches, a light signal to indicate the application of the minor load of 10kg aclamping sleeve to hold the specimen firmly, a button for applying the major load, a handlever to release the load and a dial gauge which directly gives the Rockwell hardnessnumber. The dial gauge has sets of graduations B and C, corresponding to the ball typeindenter and the cone type indenter.THEORY:
Two consecutive loads intend on the ball, a minor load of 10Kg which does notdeform the metal and is used to seat the indenter, with the minor load still operating amajor load is added which is 90kg, for the Rockwell B test and 140kg for Rockwell C testso that the total applied load will be 100kg and 150kg, for the ‘B’ and ‘C’ testsrespectively. The depth of penetration effected by the additional load is the measure ofthe Rockwell hardness. The Rockwell hardness is read directly on the dial of theinstrument that is graduated in the hardness units. The dial has two sets of figures, (i.e.,B – 30 is at C – 0). It is made so, to avoid the negative hardness values on the B – scale, ifused to test very soft materials. This also facilitates in establishing that the highesthardness that can be measured with a 1/16” diameter ball indenter is only B – 100 and forhigher hardness the C –scale should be employed.PROCEDURE:-
1. Select the indenter type, Scale and major load accordingly as given in the load testtable.
2. Place the specimen on the anvil so that its surface will be normal to the directionof the applied load.
3. With the hand wheel, raise the anvil until the specimen just makes contact withthe ball.
4. Select the load, ball diameter and the time of application of the load according tothe material to be tested as given the load test table.
5. Apply the load gradually and maintain it for the specified time.6. Release the load and remove the specimen. The hardness number directly obtained
from experiment.7. Make three trials for each specimen for calculating the hardness number.
Date…………………. Signature of the Faculty

15 CVL 37 – Building Materials Testing Laboratory 2017-18
Dept. of Civil Engg, CIT, Gubbi – 572 216 Page 42
Measuring Scale

15 CVL 37 – Building Materials Testing Laboratory 2017-18
Dept. of Civil Engg, CIT, Gubbi – 572 216 Page 43
Expt.No. 7(c) Date:VICKERS HARDNESS TEST
OBJECTIVES:To find the Vickers hardness number of the given specimen by using Vickers
hardness tester.
APPARATUS:Vickers hardness testing machine:
This machine can be used for finding Vickers hardness VH, as well as Brinellhardness BH using a steel ball of 2.5mm diameter. It essentially consists of
1. Load stages adjusted by means of push button switches.2. Supporting table for placing the specimen, the height of which can be altered by
operating a hand wheel.3. Clamping sleeve which is meant for clamping the specimen against the
supporting table.4. A penetrator which is regular pyramid having a square base and a smoothed-off
point made of diamond. The angle between the opposite face of the pyramid is136.
5. An oil brake intended for uniformly applying the test load.6. A controlling current key for application of load.7. A hand lever for releasing the load.8. A device for projecting the impression which can be magnified 70-fold or 140-
fold.9. Attachment for measuring the impression by means of a scale and micrometer.
Under 70 fold magnification the distance a long and a short mark of the scale isequal to 0.1mm. 10 division of the Vernier scale also correspond to 0.1mm andthe micrometer gives readings in 0.001mm.
THEORY:An indenter in the form of a right pyramid with a square base and an angle of 136
(α) between opposite faces, when forced into the meter under a load P applied for 10 to15 seconds, causes an indentation which has a square base. If‘d’ is the diagonal of theindentation left on the surface of the test piece after the removal of the load, then theVickers hardness VH is the quotient of the test load P(kg) and sloping area (sq mm) ofindentation.
22 /854.1
2/136sin2dP
dP
nindentatioofareaSlopingLoadVH
One of the advantages of the Vickers machine is in the measurement of indentation: amuch more accurate reading can be made of the diagonal of the square than can be madeof the diameter of a circle. Also, it is a fairly rapid method that can be used on metal asthin as 0.006 inch.

15 CVL 37 – Building Materials Testing Laboratory 2017-18
Dept. of Civil Engg, CIT, Gubbi – 572 216 Page 44
OBSERVATIONS:
Value of one division of the measuring scaleMain scale = mmVernier scale = mmMicrometer = mm
TABULAR COLUMN
Sl.No Material Load(P)Kg
Diagonal of indentation in mm VickersHardnessNumber
d1 d2 Average d
CALCULATION:
Vickers Hardness Number VHN = 1.854 P/d2 kg/ mm2

15 CVL 37 – Building Materials Testing Laboratory 2017-18
Dept. of Civil Engg, CIT, Gubbi – 572 216 Page 45
PROCEDURE:-
1. The specimen is cleaned from dirt, oil, scale etc and the test area is made even andpolished.
2. Care is taken to see the thickness of the test piece is not less than 1.5times thediagonal of the indentation and that the distance from the centre of any indentationto the edges of the test piece or edges of any other indentation is not less than2.5times the diagonal of the indentation.
3. Proper value of the load is selected which could vary from 1 to 120kg. Normallyeither 10kg or 30kg is selected.
4. The penetrate is inserted in the thrust piece of the machine and screwed.5. The prepared specimen is placed on the supporting table and the hand wheel is
turned on the right, until the surface of the specimen is sharply imaged on thescreen. The clamping sleeve is turned to the left to clamp the specimen.
6. After ascertaining that there are enough gaps for the thrust piece to move in, thecontrolling current key is pushed in till the hand lever starts rising.
7. The full load will act on the specimen when the hand lever reaches its top position.The load is allowed to act for duration of 10 to 15 seconds after which the handlever is pushed down to remove the load.
8. The image of the impression will now be clearly visible on the screen and the twodiagonals are measured.
Result:
Vickers hardness number of the given specimens is
Hardened steel =
Date…………………. Signature of the Faculty

15 CVL 37 – Building Materials Testing Laboratory 2017-18
Dept. of Civil Engg, CIT, Gubbi – 572 216 Page 46
TABULAR COLUMN:
BrickNo.
Dry weight ofbrick w1 (gms)
Wet weight ofbrick w2 (gms)
Difference(w2 – w1) gms
% water absorption{(w2 – w1) / w1}*100
1
2
3
4
5
CALCULATION:

15 CVL 37 – Building Materials Testing Laboratory 2017-18
Dept. of Civil Engg, CIT, Gubbi – 572 216 Page 47
Expt.No.8 (a) Date:TESTS ON BRICKS
OBJECTIVES:To determine the water absorption of bricks
PROCEDURE:
1. Select five bricks at random out of the given sample.2. Dry the bricks in a ventilated oven at a temperature of 105o ± 5oC till these attain
constant mass.3. The weight (W1) of the brick is recorded after cooling them to room temperature.4. The bricks are then immersed in water at a temperature of 27o ± 2oC for 24 hours.5. Remove the bricks from water and wipe off its surface with a damp cloth.6. Weigh the brick within three minutes after its removal from water. Let its weightbe W2 Kg.
W2 – W1
7. Water Absorption Capacity = x 100W1
8. Take the average value of the Water Absorption capacities of the five bricks.9. Water Absorption shall not be more than 20 percent by weight upto class 12.5 and15 percent by weight for higher classes.
The percentage of water absorption is a very valuable indication of the degree of burning.
Result:
Average water absorption of bricks =
Date…………………. Signature of the Faculty
TABULAR COLUMN:

15 CVL 37 – Building Materials Testing Laboratory 2017-18
Dept. of Civil Engg, CIT, Gubbi – 572 216 Page 48
BrickNo.
Weight ofbrick(Kg)
Dimensions of brick (mm) c /s Area ofbrick ( l *b )
(mm2)
Compressiveload(N)
Compressivestrength(N/mm2)Length Width Height
1
2
3
4
5
CALCULATION:
Expt.No.8 (b) Date:

15 CVL 37 – Building Materials Testing Laboratory 2017-18
Dept. of Civil Engg, CIT, Gubbi – 572 216 Page 49
TESTS ON BRICKS
OBJECTIVES:
To determine the compressive strength of bricks.
APPARATUS:
1. Compression testing machine ,2. Balance of capacity 3kg.3. Electric Oven
PROCEDURE:
1. Take five bricks out of the sample at random.2. The bricks are immersed in water at room temperature for 24 hours.3. These are then taken out of water and surplus water on the surfaces is wiped off
with cotton or a moist cloth.4. The frog of the brick is flushed level with cement mortar 1:1 & 1:3 and the brick
is stored under damp jute bags for 24hrs followed by its immersion in water atroom temperature for three days.
5. The specimen is placed in the compression testing machine with flat faceshorizontal and mortar filled face being upwards.
6. Load is applied at a uniform rate of 14 N/mm2 per minute till failure.7. Take the average value of the compressive strengths of the five bricks.8. The maximum load at failure divided by the average area of bed gives the
compressive strength.
Result:
The average compressive strength of bricks is
………………..
Date…………………. Signature of the Faculty
15 CVL 37 – Building Materials Testing Laboratory 2017-18
Dept. of Civil Engg, CIT, Gubbi – 572 216 Page 50
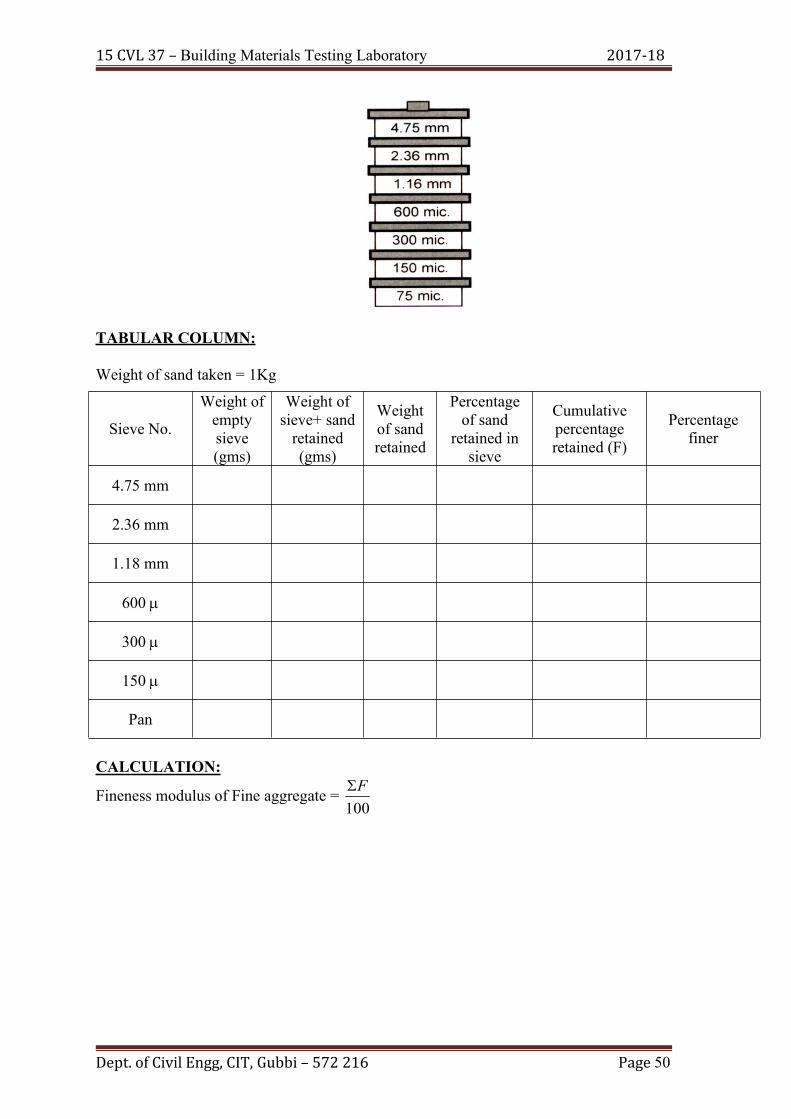
TABULAR COLUMN:
Weight of sand taken = 1Kg
CALCULATION:
Fineness modulus of Fine aggregate =100F
Sieve No.
Weight ofemptysieve(gms)
Weight ofsieve+ sandretained(gms)
Weightof sandretained
Percentageof sand
retained insieve
Cumulativepercentageretained (F)
Percentagefiner
4.75 mm
2.36 mm
1.18 mm
600
300
150
Pan

15 CVL 37 – Building Materials Testing Laboratory 2017-18
Dept. of Civil Engg, CIT, Gubbi – 572 216 Page 51
Expt.No.9 (a) Date:TEST ON FINE AGGREGATE
OBJECTIVE:To determine the Particle size distribution and fineness modulus of the given
sample of fine aggregate by sieve analysis.THEORY:
Fine aggregates as the aggregate most of which will pass 4.75mm IS sieve. Thefine aggregate is often termed as a sand size aggregate. The sand is generally consideredto have a lower size limit of 0.07mm. The material between 0.06mm and 0.002 mm isclassified as silt and still smaller particles are termed as clay. The Coarse aggregate isdefined as an aggregate most of which is retained on 4.75mm IS sieve.
The fineness modulus is a numerical index of fineness, giving some idea of themean size of the particles present in the entire body of the aggregate.
APPARATUS:IS test sieves:
Fine wire cloth nos. 4.75mm, 2.36mm, 1.16mm, 600m, 300m, 150m and75m. weighting balance(sensitive to 1/1000th of the test specimen), sieve shaker, trays,drying oven(to operate between 100 to 110 oC.
PROCEDURE:
1. Take 1Kg of sand from a laboratory sample of 10 Kg by quartering and break claylumps, if any.
2. Arrange the sieves in order of IS sieve nos: 4.75mm, 2.36mm, 1.18mm, 600m,300m and 150m keeping sieve nos. 4.75mm at the top and 150m at the bottom.Fix them in the sieve shaking machine with the pan at the bottom and cover at thetop.
3. Keep the sand in the top sieve; carry out sieving in the set of sieves as arrangedbefore for not less than 10minutes.
4. Find the mass retained on each sieve.5. Fineness modulus is an empirical factor which is obtained by dividing the
cumulative sum of the percentage of aggregate retained on each IS sieves taken inorder by 100.
Result:
Fineness modulus of the given fine aggregate =
Date…………………. Signature of the Faculty
15 CVL 37 – Building Materials Testing Laboratory 2017-18
Dept. of Civil Engg, CIT, Gubbi – 572 216 Page 52
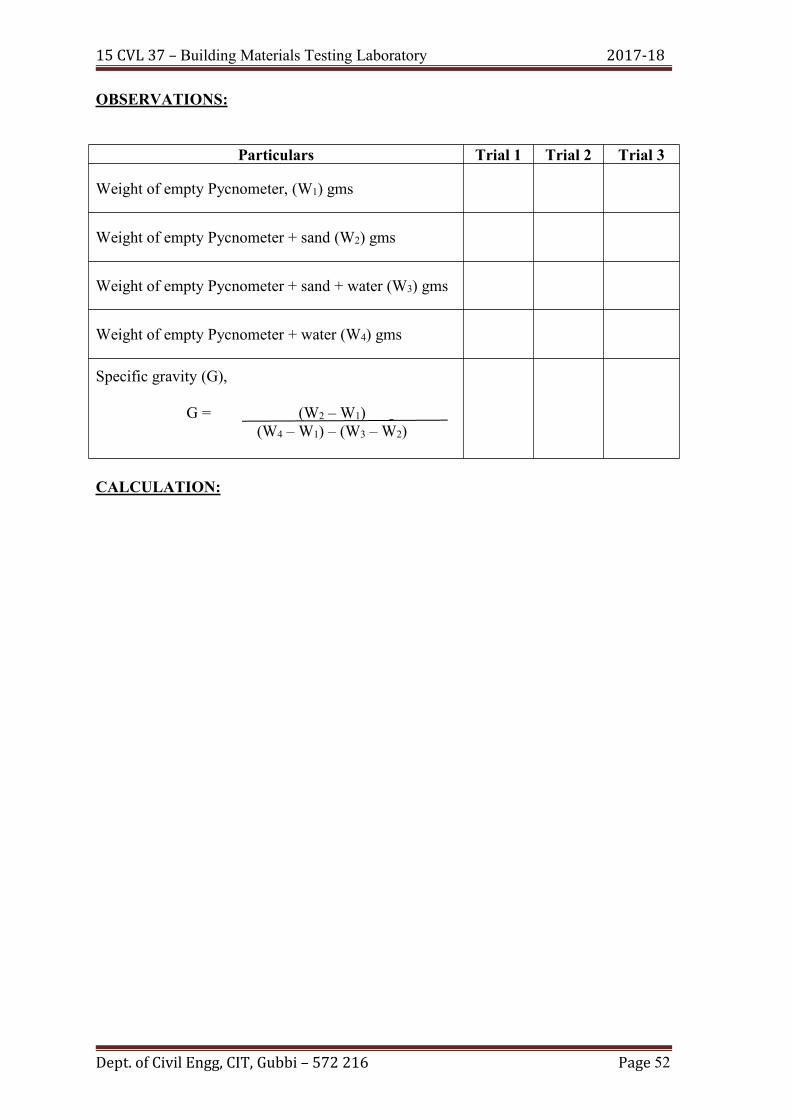
OBSERVATIONS:
Particulars Trial 1 Trial 2 Trial 3
Weight of empty Pycnometer, (W1) gms
Weight of empty Pycnometer + sand (W2) gms
Weight of empty Pycnometer + sand + water (W3) gms
Weight of empty Pycnometer + water (W4) gms
Specific gravity (G),
G = (W2 – W1)(W4 – W1) – (W3 – W2)
CALCULATION:

15 CVL 37 – Building Materials Testing Laboratory 2017-18
Dept. of Civil Engg, CIT, Gubbi – 572 216 Page 53
Expt.No.9 (b) Date:TEST ON FINE AGGREGATE
OBJECTIVE:
To determine the Specific gravity of Fine aggregate.
APPARATUS:
1. Balance of capacity 3kg.2. Pycnometer (64mm diameter at top, 90mm diameter at bottom and 73mm in
height)3. Tamping rod 25mm in diameter.
THEORY:
The Specific gravity of an aggregate is defined as themass of a given volume of sample to the mass of an equalvolume of water at the same temperature.
The Specific gravity of the fine aggregate is generallyrequired for calculations in connection with concrete mix designfor determination of moisture content and for the calculation ofvolume yield of concrete. The Specific gravity also givesinformation on the quality and properties of aggregate.
PYCNOMETER
PROCEDURE:
1.Calibrate the Pycnometer, by weighing it empty and full with water at roomtemperature. Roll and agitate the flask gently in an inclined position, to eliminateair bubbles.
2. Take a sample of the fine aggregate and soak it in water and keep it for 24±1/2hours. The temperature should be 27±5 oC.
3. Take out and spread the sample (approximately 1.5kg) on a clean flat surface flatsurface, exposed to gently moving current of warm air until the material justreaches free running condition (flowing freely).
4. Immediately weight 500gm of saturated surface dry sand in the flask.5. Fill the flask with water to the top of the cone. Roll the flask in an inclined positionto eliminate all air bubbles and replace with water by means of foundation pen filler.
6. Wipe the flask dry and weigh it accurately.7. Calculate the specific gravity.
Result:
Specific gravity of the given fine aggregate is, G =Date…………………. Signature of the Faculty

15 CVL 37 – Building Materials Testing Laboratory 2017-18
Dept. of Civil Engg, CIT, Gubbi – 572 216 Page 54
OBSERVATIONS AND CALCULATION:
Mass of empty tray, We =
Mass of tray + saturated surface dry sample ,Ws =
Mass of saturated surface dry sample, W1 = (Ws - We ) =
Mass of tray + oven dry sample, Wo =
Mass of oven dry sample, W2 = ( Wo - We) =
Absorption percentage = (W1 – W2) x 100
W1
15 CVL 37 – Building Materials Testing Laboratory 2017-18
Dept. of Civil Engg, CIT, Gubbi – 572 216 Page 55
Expt.No.9 (c) Date:TEST ON FINE AGGREGATE
OBJECTIVE:To determine the water absorption of fine aggregate.
APPARATUS:
4. Balance of capacity 3kg.5. Electric Oven6. Tray
Absorption:It influences the behavior of aggregate in concrete in several important aspects. A
highly absorptive aggregate, if used in dry condition, will reduce effective water-cementratio to an appreciable extent and may even make the concrete unworkable unless asuitable allowance is made. Hence determination of absorption of aggregate is necessaryto determine net water-cement ratio.
PROCEDURE:
1. Take a sample of the fine aggregate and soak it in water and keep it for 24+ 1/2hours. The temperature should be 27+ 5°C
2. Take out and spread the sample (approximately 1 kg) on a clean flat surface,exposed to gently moving current of warm air until the material just reaches freerunning condition (flowing freely).
3. Weigh the 1 Kg of saturated surface dry sand in the tray of known weight.4. Dry the sample in an oven at 100 - 110°C for 24 hours.5. Weigh the dry sand with tray.6. Calculate absorption capacity as the percentage of oven dry mass.
Result:
Water absorption of the given fine aggregate sample is
Date…………………. Signature of the Faculty
15 CVL 37 – Building Materials Testing Laboratory 2017-18
Dept. of Civil Engg, CIT, Gubbi – 572 216 Page 56
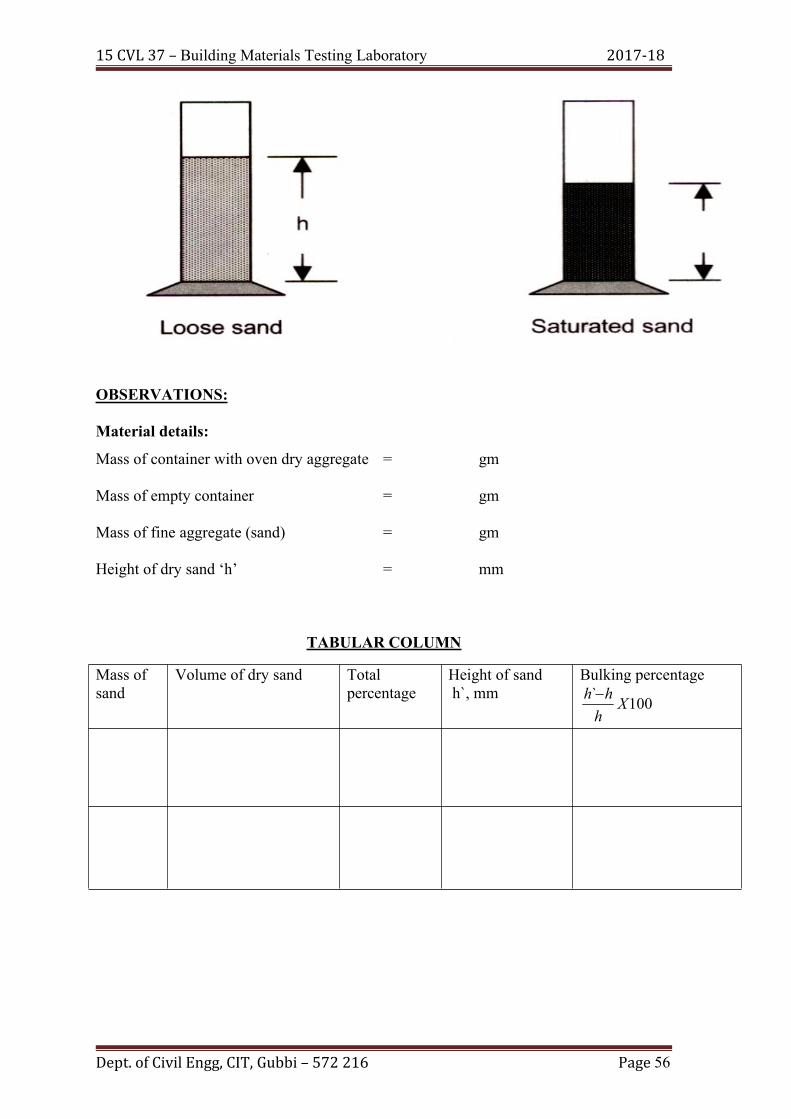
OBSERVATIONS:
Material details:
Mass of container with oven dry aggregate = gm
Mass of empty container = gm
Mass of fine aggregate (sand) = gm
Height of dry sand ‘h’ = mm
TABULAR COLUMN
Mass ofsand
Volume of dry sand Totalpercentage
Height of sandh`, mm
Bulking percentage
100` Xhhh
15 CVL 37 – Building Materials Testing Laboratory 2017-18
Dept. of Civil Engg, CIT, Gubbi – 572 216 Page 57
Expt.No.9 (d) Date:
BULKING OF FINE AGGREGATE
OBJECTIVE:To determine the bulking of fine aggregate and to draw curve between water
content and bulking.APPARATUS:
Balance, Cylinder container, graduated cylinder, beaker, tray, steel rule and oven.
THEORY:In concrete mix design, the quantity of fine aggregate used in each batch should
be related to the known volume of cement. The difficulty with measurement of fineaggregate by volume is the tendency of sand to vary in bulk according to moisturecontents. The extent of this variation is given by this test. Thus, Bulking of sand indicatesan apparent increase in volume of sand due to formation of thin layers of water aroundsand particles.
If sand is measured by volume and no allowance is made for bulking, because forgiven mass, moist sand occupies a considerably larger volume than the same mass of drysand, as the particles are less closely packed when the sand is moist. Usually the sand ismeasured by loose volume, it is necessary in such case to increase the measured volumeof the sand, in order that the amount of sand put into concrete may be the amountintended for the nominal mix used (based on the dry sand). It will be necessary toincrease the volume of sand by the ‘percentage bulking’.
PROCEDURE1. Put sufficient quantity of the oven dry sand loosely into the container until it is
two-third full. Calculate the mass of sand by deducting the mass of container.2. Push a steel rule vertically down through the sand at the middle to the bottom and
measure the height of sand. Let it be ‘h’mm.3. Empty the sand out into a clean metal tray without any loss.4. Add one percent of water by mass of sand. Mix the sand and water thoroughly by
hand.5. Put the wet sand loosely into the container without tamping it.6. Smooth and level the top surface of the inundated sand and measure its depth at
the middle with a steel rule. Let it be “h`”mm.7. Repeat the above procedure with 2 percent of water by mass.8. Go on increasing the percentage by one till bulking is maximum and starts falling
down and ultimately bulking is zero, i.e., saturated sand occupies the same volumeas dry sand.
Result:Maximum bulking of sand, % =
Volume of water =
Date…………………. Signature of the Faculty

15 CVL 37 – Building Materials Testing Laboratory 2017-18
Dept. of Civil Engg, CIT, Gubbi – 572 216 Page 58
OBSERVATIONS AND TABULAR COLUMN:
Diameter of the container , D = m
Height of the container , H = m
Volume of container, V = m3
Sl.No Description Trial 1 Trial 2 Avg
1 Empty weight of container, W1 (Kg)
2 Weight of container + fine aggregatge in loose state,W2 (Kg)
3 Weight of fine aggregate in loose state (W2 - W1) (Kg)
4 Bulk density, ρloose = (W2 - W1) / V Kg/ m3
5 Weight of container + fine aggregatge in compactedstate, W3 (Kg)
6 Weight of fine aggregate in compacted state(W3 - W1) (Kg)
7 Bulk density, ρcompact = (W3 - W1) / V (Kg/ m3)
CALCULATION:
Volume of container, V = (п d2 / 4) h = m3
Specimen Calculation:
ρloose = (W2 - W1) / V = Kg/ m3
ρcompact = (W3 - W1) / V = Kg/ m3
15 CVL 37 – Building Materials Testing Laboratory 2017-18
Dept. of Civil Engg, CIT, Gubbi – 572 216 Page 59
Expt.No.9 (e) Date:
BULK DENSITY OF FINE AGGREGATEOBJECTIVE:
To find the bulk density of fine aggregates.
APPARATUS:
Weighing balance, cylindrical container, and Vibrating machine.
THEORY:
Bulk density is the total mass M per unit of its total volume.
ρ = M / V
It is expressed in terms of g / cm3 , Kg / m3 , KN / m3
The bulk density or unit weight of aggregate gives information regarding specificgravity and grading of the aggregate. The bulk density of aggregate is measured by fillinga container by known volume in standard manner and weighing it. Bulk density ofaggregate is of interest when we deal with light weight aggregate and heavy weightaggregate.
PROCEDURE:
1. The diameter and height of the container is measured to calculate the volume.2. The container is weighed and its weight is noted.3. The container is filled with the given sample of fine aggregate and its weight is
noted.4. The container is filled with aggregate in loose state. The weight of the container
with aggregate loosest state is noted.5. The container is placed on the vibrating machine. Start the vibrating machine and
go on adding fine aggregates till the container is filled with aggregates upto thebrim. Note down the weight of the container with aggregate in densest state isnoted
6. Bulk density and percentage voids are calculated in both loose and compactedstate.
Result:
Bulk density of fine aggregate in loose state, ρloose = Kg / m3
Bulk density of fine aggregate in loose state, ρcompact = Kg / m3
Date…………………. Signature of the Faculty

15 CVL 37 – Building Materials Testing Laboratory 2017-18
Dept. of Civil Engg, CIT, Gubbi – 572 216 Page 60
OBSERVATIONS AND CALCULATION:
Mass of saturated surface dry sample W1 = gm
Mass of basket suspended in water W2 = gm
Mass of material + basket suspended in water W3 = gm
Mass of aggregate suspended in water (W3 – W2) = gm
Mass of oven dry aggregate in air W4 = gm
a) Bulk specific gravity =waterinsampleofmassinloss
airinsampleofmass= 231
1
WWWW
b) Apparent specific gravity = 234
4
WWWW
,
Water absorption:
Initial weight of aggregate, W1 = gm
Weight of saturated surface dry sample, W2 = gm
Water absorption in percentage = 1001
12 XWWW

15 CVL 37 – Building Materials Testing Laboratory 2017-18
Dept. of Civil Engg, CIT, Gubbi – 572 216 Page 61
Expt.No.10 (a) Date:SPECIFIC GRAVITY AND WATER ABSORPTION OF COARSE AGGREGATE
OBJECTIVE:Determination of Specific Gravity and Water Absorption of Coarse Aggregate.
APPARATUS:Balance of capacity 5kg, weight box, wire basket 200mm in diameter and 200mm
height of 4.75mm IS sieve net, water tub for immersing the wire basket in water,suitable arrangement for suspending the wire basket from centre of scale pan ofbalance and absorbent cloth for surface drying of the sample.
THEORY:Specific gravity of a coarse aggregate is defined as the ratio between the mass of
equal volume of coarse aggregate and water at constant temperature. Specific gravity ofan aggregate gives valuable information on its quality and properties. If the specificgravity is above or below that normally assigned to a particular type of aggregate, it mayindicate that shape and grading of aggregate has altered.
It is also important in determination of moisture content and in many concrete mixdesign calculations of volume yield of concrete.PROCEDURE:
1. Take about 5kg of aggregate by method of quartering; rejecting all materialpassing a 10mm IS sieve.
2. Wash thoroughly to remove dust etc., from the surface of particles. Dry toconstant mass at a temperature of 105 ±5 oC.
3. Immerse the sample in water at 22 to 32oC for a period of (24±1/2)hrs (30mins forlaboratory practice).
4. Remove the aggregate from water and roll in a large piece of an absorbent clothuntil all visible films of water are removed, although the surface of particles willstill appear to be damp.
5. Now, weigh 3 kg of this sample in the saturated surface dry condition and notedown the mass as W1 gm.
6. Place the weighed aggregate immediately in the wire basket and dip it in water.Weigh the basket with aggregate, while keeping it in water with the help of thebalance. Note its mass as W3 gm.
7. Dry the sample to the constant weight at the temperature of 110 oC for (24±1/2)hrs.
8. Cool to room temperature and weigh.9. Calculate the specific gravity and absorption of the aggregate.10. Repeat the procedure for fresh aggregates.
Result:Specific gravity of a given coarse aggregate = ……………..
Percentage water absorption of a given coarse aggregate = ……………..
Date…………………. Signature of the Faculty

15 CVL 37 – Building Materials Testing Laboratory 2017-18
Dept. of Civil Engg, CIT, Gubbi – 572 216 Page 62
OBSERVATIONS AND CALCULATION:
Sievesize(mm)
Weight ofempty sieve
(gm)
Weight ofsieve + sandretained(gm)
Weight ofsand
retained(gm)
Percentageof sand
retained onsieve
CumulativePercentageretained on
sieve(C)
Percentagefiner
(100 – C)
40
20
10
4.75
pan
Cumulative percentage retained (ΣC) =
Fineness modulus = (ΣC + 500) / 100 =

15 CVL 37 – Building Materials Testing Laboratory 2017-18
Dept. of Civil Engg, CIT, Gubbi – 572 216 Page 63
Expt.No.10 (b) Date:SIEVE ANALYSIS OF COARSE AGGREGATES
OBJECTIVE:
Determination of particle size distribution and fineness modulus of the givensample of coarse aggregates by sieve analysis.
APPARATUS:
Sieves of size 40mm, 20mm , 10mm, 4.75mm, pan, weighing balance.
THEORY:
Sieve analysis is a process of dividing a sample of aggregate in to various fractions basedon particle size, this process is referred to as grading. Fineness modulus is an empiricalfactor obtained by adding the cumulative percentage of aggregate retained in each ofstandard sieves and dividing the sum by 100. Smaller the value of fineness modulus, fineris the aggregate. Sieve analysis is conducted as given in IS 2386 (Part – I). Finenessmodulus is calculated as below,
Fineness modulus = (ΣC + 500) / 100
PROCEDURE:
1. The sieves of various sizes are cleaned and weighed.2. The sieves are arranged in the decreasing order of their aperture sizes.3. 5Kg of coarse aggregate is accurately weighed and placed on to the topmost sieve.4. The entire setup is placed on the sieve shaker and jolted for 5min.5. The sieves along with retained aggregate is weighed separately and the weight of
coarse aggregate in each sieve is calculated.6. Percentage weight retained is calculated and then cumulative percentage retained
and fineness is found out.
Result:
Fineness modulus of the given sample of coarse aggregate is =
Date…………………. Signature of the Faculty

15 CVL 37 – Building Materials Testing Laboratory 2017-18
Dept. of Civil Engg, CIT, Gubbi – 572 216 Page 64
OBSERVATIONS AND CALCULATION:
Calculate the maximum load carried by the tile,
Wu = W1 (a+b) (c+d) / (axc)
Wu = 12 W1
Where,W1= Weight of the lead shots
Calculate Ultimate Moment of Tile,
Mu = (WuL)/4
Fig. Tile Testing Machine

15 CVL 37 – Building Materials Testing Laboratory 2017-18
Dept. of Civil Engg, CIT, Gubbi – 572 216 Page 65
Expt.No.11 Date:TEST ON TILES
OBJECTIVE:To determine the flexural strength flexural of given roof tile.
APPARATUS:Flexural tile testing machine, lead shots, balance.
THEORY:The flexural test is conducted on a clay tile in a condition similar to its position in
a tiled roof. The tile is placed on buttons regular intervals. The battens act like two simplesupports on which the tile rests. The flexural strength is measured terms the maximumpoint load that caused failure of the tile, when supporting on two simple supports.
This machine is a lever-operated machine. It consists of two adjustable supportson which the tile rests. The tile is loaded at its centre by a cylindrical bar. The loading isdone by continuously adding lead shots in the loading pan. The load on the tile iscalculated as K times the weight of lead shots collected in the loading pan, where K is aconstant for the machine depending on the length of levers.
PROCEDURE:
1. Meaasure the distance a, b, c and d of the levers, Fix supports A & B suitably andmeasure the Span L (L —200mm)
2. Place the tile to be tested on the two Supports symmetrically.3. Adjust the loading arm C to come in contact with the tile.4. Make the lever (PQ) horizontal by adjusting the position of the balancing weight.5. Open the loading knob; the lead shots start pouring in the loading pan.6. When the load on the tile reached its maximum value, the tile breaks and
simultaneously the loading knob closes.7. Note down the weight of lead shots collected in the loading pan W1. Calculate the
maximum load carried by the tile.
15 CVL 37 – Building Materials Testing Laboratory 2017-18
Dept. of Civil Engg, CIT, Gubbi – 572 216 Page 66
Expt.No.12 Date:STRAIN GAUGES
Strain gauges are mostly used to measure strains on the free surface of a body.Strain gauges of all types are essentially devices that sense the change in length, magnifyit and indicate it in some form. They can be classified broadly into five groups on thebasis of the physical principle employed for the magnification of change in length:
1. Mechanical 2. Optical 3. Electrical4. Pneumatic 5. Acoustical
Further each strain gauge is sub divided into two types:1. Bonded strain gauge 2. Unbonded strain gaugeIn bonded strain gauge a grill of fine wire is cemented to a thin paper sheet. In
unbonded strain gauge a resistance wire is wound around the structure under study.
Properties of good strain gauge:1. The gauge factor should be high to get more resolution.2. The wires used in the strain gauge should have high resistance.3. The wires have low temperature co-efficient of resistance.4. The wires should not have any hysterisis in its response.5. The wires should have a linear relationship between strain and resistance.
Mechanical strain gauge:These mechanical devices are generally known as extensometers and are to
measure strain under static or gradually varying loading conditions. An extensometer isusually provided with two knife edges which are clamped firmly in contact with the testcomponent at a specific distance or gauge length apart. When the test component isstrained, the two knife edges undergo a small relative displacement. This is amplifiedthrough a mechanical linkage and the magnified displacement or strain is displayed on acalibrated scale.
Optical Gauges:Mechanical Optical gauges:
In mechanical-optical gauges a combination of mechanical & optical levers areused to amplify the relative displacement between the knife edges. The moving knife ispivoted so that it rotates while undergoing displacement.Electrical Gauges:
In an electrical strain gauge a change in length or strain produces a change insome electrical property. The greatest advantage common to all electrical gauges is theease with which the electrical signal can be displayed, recorded or conditioned as required.Three types of electrical gauges are in use: (i) Inductance gauges, (ii) Capacitance gauges& (iii) Electrical resistance gauges. Well over 90 percent of the strain gauges used inpractice are of the electrical-resistance type and a large proportion of these are foil gauges.
Universal Testing Machine Software Demo

15 CVL 37 – Building Materials Testing Laboratory 2017-18
Dept. of Civil Engg, CIT, Gubbi – 572 216 Page 67
Testing of specimen through PC software:
1. Clamp the specimen between the grips.
2. Start the hydraulic pump and remove dead weight.
3. In PC software first select the required test type like -Tension Test. and create new file
by selecting “Create new” menu bar or toolbar. Enter the required initial data and save the
file.
4. Click “start test” button in menu bar or toolbar.
5. Enter the required data like Sample type, Diameter of bar, Gauge length in the software
and click “data OK”. This data will get transferred to panel.
6. The real time graph window will appear. Enter the graph scale to see the graph upto
rupture. Click 'OK' button.
7. Tare the bad (if the bad value is not zero) by “TARE LOAD" button,
8. Click Start Test. button and start to open the loading valve.
9. At rupture of specimen the test will terminate automatically and machine
10. The software asks for final gauge length and final dia. (As per type of specimen), if
required enter these value by manual measurement.
11. Then you will get load v/s displacement Curve and all results.
12. Connect the printer and take print.
NOTE:
For testing the specimen with Extensometer, the above procedure will remains same.
Only the change is select test type as Extensometer test. The Extensometer has to be
removed before 2 mm extension or before rupture. To remove Extensometer click “Stop
Extensometer Test button first and then remove Extensometer.

15 CVL 37 – Building Materials Testing Laboratory 2017-18
Dept. of Civil Engg, CIT, Gubbi – 572 216 Page 68
Electronic Extensometer
Electronic Extensometer
This equipment is basically used with Universal Testing Machines for tension test; it is
used for measuring young's modules, proof stress or yield stress.
It consists of pair of knife edges at top and bottom which are used to grip the specimen
between gauge points. The top knife edges are fixed while the extension of specimen
causes the bottom knife edges to move down. The movement of these knife edges are
magnified by a lever and transmitted to two dial gauges (one on either side) by a rack and
pinion mechanism. The least count of extensometer is 0.01mm and it can measure upto
3mm. Two springs, one fixed at bottom and other placed at a top will keep extensometer
in position.
15 CVL 37 – Building Materials Testing Laboratory 2017-18
Dept. of Civil Engg, CIT, Gubbi – 572 216 Page 69
THEORY
ENGINEERING MATERIALS:
A material is that out of which anything is done. It is the stuff of which somethingis made. It comprises a wide range of metals and non-metals, which must be operated upon to form the finished product.PROPERTIES OF MATERIALS:
The term property indicates that defines a specific characteristic of a material. Itprovides a basis for predicting its behavior under various conditions like forces,temperatures, pressures, etc.
1.Physical Properties: Shape, size, finish, colour, specific gravity, density, porosity,structure, etc
2. Mechanical Properties: Strength, stiffness, elasticity, plasticity, ductility, creep,brittleness, hardness, toughness, resilience, impact, fatigue, bending, malleability.
3.Thermal Properties: Specific heat, heat of transformation, thermal expansion, thermalconductivity, thermal stresses, thermal fatigue, thermal shock, latent heat of fusion,melting point etc.
4.Chemical Properties: Corrosion resistance, atomic weight, equivalent weight, valency,molecular weight, acidity, alkalinity, atomic number, chemical composition.
5.Optical Properties: Colour, diffraction, fluorescence, reflectivity, hysterisis,luminescence, refractive index, etc.
TESTS ON MATERIALS:
1. Destructive tests: After being destructively tested, the component or specimeneither breaks or remains no longer useful for further use.Ex: Tensile test, Compression test, Torsion test, Shear test, fatigue test.
2. Non- Destructive tests: A component does not break and even after being tested so,it can be used for the purpose for which it was made.Ex: Radiography test, ultrasonic inspection, dye-penetrant test, magnetic particletest, etc.

15 CVL 37 – Building Materials Testing Laboratory 2017-18
Dept. of Civil Engg, CIT, Gubbi – 572 216 Page 70
DEFINITIONS:
1. Stress:The force per unit area of resistance offered by a body against deformation
is called the stress.
2. Tensile Stress:Stress induced in the uniform cross sectional area ‘A’ subjected to equal
and opposite collinear forces ‘P’ resulting in the elongation of the member.
3. Compressive Stress:When two equal and opposite collinear are applied to a member resulting
in the reduction in the length of the member, then the stress induced is calledcompressive stress.
4. Strain:It is defined as change in length per unit length, also termed as linear strain.
Strain = (elongation / original length of specimen)5. Yield Stress:
Stress at which considerable elongation first occurs in the test piecewithout increase in the load.
6. Direct Stress:The resistance developed in a material due to the action of direct load or
axial load passing through the centroidal axis of the section is termed as directstress.
7. Shear Stress:The stress caused by forces which are parallel to an area of cross section
and tend to produce sliding of one position over another is termed as shear stress.
8. Young’s Modulus:It is defined as ratio of linear stress to the linear strain or the ratio of
normal stress to the axial strain within elastic limit.
9. Bulk Modulus:When a body is subjected to three mutually perpendicular direct stress of
equal intensity, the ratio of direct stress to the corresponding volumetric strain isknown as Bulk modulus.
10. Lateral Strain:It is the ratio of change in lateral dimension to original is called lateral
strain.
11. Volumetric Strain:It is the ratio of change in volume to original volume is called volumetric
strain.
12. Elasticity constants:
15 CVL 37 – Building Materials Testing Laboratory 2017-18
Dept. of Civil Engg, CIT, Gubbi – 572 216 Page 71
They are the properties of materials such as young’s modulus, rigiditymodulus, Bulk modulus and Poisson’s ratio.Young’s Modulus = Linear Stress / Linear StrainBulk Modulus = K = (Volumetric stress / Volumetric strain)Poisson’s ratio = (Lateral stress / Longitudinal strain)Rigidity Modulus: (Shearing stress / Shearing strain)
13. Elastic Length:It is the maximum load attained within the elastic limit divided by the
cross sectional area of the specimen.
14. Deflection:A beam when loaded gets deflected. The axis of the loaded beam bends in
a curve known as the elastic curve. The deflection at any point on the axis of thebeam is the vertical distance between its position before the load and after loading.
15. Ultimate stress:The maximum load to which a bar is subjected to in a test divided by its
original cross-sectional area gives a nominal stress which is known as ultimatestress.
16. Breaking Stress:The stress corresponding to fracture load is called breaking stress.
17. Factor of Safety:The ratio of ultimate strength to allowable stress is called factor of safety.
18. Ductile material:It is an important property of the material that enables it to be drawn into a
wire.
19. Brittle material:A material is said to be brittle if it undergoes only small permanent
deformation prior to fracture.
20.Malleability:It is the property of the material that enables it to get rolled into structural
shapes and sheets.
21. Shearing Force:The algebraic sum of all the vertical force to one side of the section in a
beam is called its shearing force.
22. Tangential Stress:Tensile stress induced in the wall along the circumference of the cylinder
is known as tangential stress.
23. Longitudinal Stress:If the ends of the cylinder are closed, then the pressure at the ends will lead
to stress in the walls in the direction parallel to longitudinal axis of the cylinderand this stress is termed as longitudinal stress.
24. Resultant Stress:
15 CVL 37 – Building Materials Testing Laboratory 2017-18
Dept. of Civil Engg, CIT, Gubbi – 572 216 Page 72
The resultant of normal and tangential stress acting on any plane is calledresultant stress.
25. Complementary Stress:The stress which acts right angles to the original active stress is called
complementary stress.
26. Hooke’s Law:
Within the elastic limit, stress is proportional to strain.
27. Elastic Limit:It is the limit of stress upto which the material will behave elastically (and
regains its original shape on removal of load).
28. Proportional Limit:It is the limit of stress upto which the stress of the material is proportional
to strain.
29. Yield Point:It is the strain at which the elastic nature is completely lost and the
materials develops permanent deformation.
30. Yield Limit: It is the limit of stress at which considerable elongation first occursin the test piece without increase in the load.
31. Ductility:It is indicated by the amount of deformation that is possible until fracture.
32. Toughness:It is its ability to absorb energy in the plastic range.
33. Elasticity:It is the property by which a body returns to its original shape after the
removal of external load.
34. Gauge length:It is the failure length of the parallel portion of the specimen over which
extensions are measured.
35. Resilience:The strain energy stored in a body due to external loading within the
elastic limit is known as resilience and the maximum energy which can be storedin a body upto the elastic limit is called as proof resilience.
36. Plasticity:It is the property of material by which no strain disappears when it is
relieved from the stress.
37. Proof stress:

15 CVL 37 – Building Materials Testing Laboratory 2017-18
Dept. of Civil Engg, CIT, Gubbi – 572 216 Page 73
It is the stress at which the stress-strain diagram departs by a specifiedpercentage of gauge length from the produced straight line of proportionality(0.2%).
38. Brittleness:A material is said to be brittle when it cannot be drawn out by tension to
smaller section. Here, failure takes place with small deformation.
TENSILE TEST:In this, the operation is accomplished by gripping opposite ends of the specimen
and pulling it apart. Here, the specimen elongates in a direction parallel to the appliedload. It is most commonly made and one of the simplest test among the mechanical tests.
The versatility of the test lies in the fact that it permits both strength and ductileproperties to be measured. In conducting the test, a specimen of the steel is subjected toan increasing tensile pull until it fractures.
COMPRESSION TEST:
It is similar to tension test, expect that the loading is in opposite direction, i.e.,compressive load which produce crushing action. It is used for testing brittle materialssuch as stone, concrete, cast iron, glass etc. The result of this is so affected by thefrictional force occurring at the ends of the specimen.
For ductile material such as mild steel or copper, lateral distortion takes place dueto the influence of the friction at the load faces; the cross-section becomes greatest at thecenter, the specimen taking up a barrel shape. Failure finally occurs by cracks appearingon the surface and spreading inwards.
For brittle material the behavior is quite different from that of ductile material. Butthere is definite load at which specimen breaks. Materials fails by shearing along theeplane inclined at 50o deg and to the longitudinal axis.
HARDNESS TEST:
Hardness is the resistance of the metal to the penetration of another harder bodywhich does not receive a permanent set. It is the ability of a material to resist scratching,abrasion cutting or penetration.
It consists of measuring the resistance to plastic deformation of layers of metalnear the surface of the specimen. In the process of the hardness determination, when themetal is intended by a special tip (ball indentor), the tip first overcomes the resistance ofthe metal to elastic deformation and then a small amount of plastic deformation.
SCOPE:
Hardness number cannot be utilized directly in design or analysis but it is used tograde the available materials, according to hardness and indicate utility for certain use.
USES:
15 CVL 37 – Building Materials Testing Laboratory 2017-18
Dept. of Civil Engg, CIT, Gubbi – 572 216 Page 74
1. Similar materials may be graded according to hardness.2. Quality of the material or products may be checked or controlled.3. By establishing a co-relation between hardness and some other desired property
like tensile strength, etc.4. Used to test the result of heat treatment like case hardening etc.
TYPES OF HARDNESS MEASUREMENTS:
1. Scratch hardness2. Indentation hardness3. Rebound or Dynamic hardness
Scratch hardness is of primary interest to mineralogists. With this measure ofhardness various materials and other are rated on their ability to scratch one another.It is measured according to the Mohr’s scale. Indentation hardness test is performed by impressing into the specimen, which isresting on a rigid platform, an indentor of fixed and known geometry, under a knownstatic load applied by means of lever system. Depending upon the test, the hardness isexpressed by a number that is either inversely proportional to the depth of indentationfor a specified load and indentor or proportional to a mean load over the area ofindentation. In rebound hardness measurements, the indentor is usually dropped onto the metalsurface, and the hardness is expressed as the energy of impact. The shore Scleroscopemeasures the hardness in terms of the height of the rebound of the indentor.
ROCKWELL HARDNESS TEST:
In this the hardness of a material is determined by the depth of indentation of adiamond cone or small steel ball. This is conducted in a specially designed machine thatapplies load through a system of weights and levers. This test utilizes the depth onindentation under constant load as a measure of hardness. Minor load minimizes theamount of surface penetration needed and reduces the tendency for sinking in by theindentor. The dial is reversed so that a high hardness, which corresponds to a smallpenetration, results in high hardness number.
BRINELL HARDNESS TEST:
It is oldest and most used type. This is static test using relatively large indentors.Advantages of Rockwell Hardness Test over Brinell hardness Test:1. Due to the application of minor load to the penetrator, any effects due to surface
imperfections are eliminated.2. Unskilled labour can operate.3. The dial indicator eliminates the necessity for a microscope for measuring the
indentation and so that the test can be done quickly and more accurately.

15 CVL 37 – Building Materials Testing Laboratory 2017-18
Dept. of Civil Engg, CIT, Gubbi – 572 216 Page 75
4. On account of small impression made, the test is suitable for the majority offinished components.
Note: 75HB 10/500/30 indicates a Brinell hardness of 75 measured with a ball of 10mmdiameter and
load of 500kg applied for 30seconds.
IMPACT TEST:
The principal measurement is the energy absorbed in fracturing the specimen.After breaking the test bar, the pendulum rebounds to a height which decreases as theenergy absorbed in fracture increases. The energy absorbed in fracture, usually expressedin joules, is read directly from calibrated graduated scale on the machine.
SCOPE:
1. Useful in designing those components of machine which are subjected to a suddenapplied loads.
2. It gives necessary energy required to rupture the specimen.3. For evaluating the uniformity of properties in similarly heat treated steels.4. Gives guidance to the sensitivity of the material to notch propagation, or the
resistance of the material to the propagation of the crack, once it is formed.
SHEAR TEST:
A type of forces which tends or causes two continuous parts of the body to sliderelative to each other in a direction parallel to their plane of contact is called shear force.
The stress required to produce fracture in the plane of cross-section acted on bythe shear force is called shear strength.
A shearing force acts parallel to a plane whereas the tensile and compressive forcesact normal to a plane. There are two main types of shear stresses used in the laboratory.
1. Direct or transverse stress- stress encountered in rivets, bolts and beams.2. Pure or torsional stress- stress encountered in a shaft subjected to pure torsion.
Direct shear tests are conducted to obtain a measure of shear strength and pure sheartests are employed to evaluate the basic shear properties of a material.
For direct shear stress of metal, a bar is usually sheared in some device that clamps aportion of the specimen while the remaining portion is subjected to a load by meansof suitable dies. If the force is resisted by failure through one plane and single area,then the material is said to be single shear. If two areas resist the fracture, then thematerial is said to be in double shear.
VIVA-VOCE QUESTIONS

15 CVL 37 – Building Materials Testing Laboratory 2017-18
Dept. of Civil Engg, CIT, Gubbi – 572 216 Page 76
TENSION TEST ONMILD STEEL
1. What is the nature of failure for brittle and ductile materials in tensile test?2. Distinguish between
a) Yield point and yield strength b) Elastic limit and Proportionality limit3. Why percentage elongation increases as the gauge length decreases.
COMPRESSION TEST
2. Explain the behavior of ductile material and brittle material under compression?3. Why a short specimen should be used in compression test?4. The plane of failure in brittle material subjected to compression is at about 45o,
state the reason.5. Name the devices used to measure deformation in tension and compression tests.6. State the reason a) Tension test is preferred to compression test for determining
the modulus of elasticity.
TORSION TEST ONMILD STEEL CIRCULAR SECTIONS
1. What is a shaft? Give practical Examples.2. How angle of twist is measured in a torsion test.3. What mechanical property of material is determined from torsion test and how?4. Define torsion rigidity, polar moment of inertia and rigidity modulus.
SHEAR TEST ONMILD STEEL
1. Distinguish between Single shear and Double shear.2. Why modulus of rigidity is not determined by shear test.
IMPACT TEST ONMILD STEEL
1. Give three examples of machine parts or structural members subjected to impactloading.
2. Distinguish between Charpy and Izod tests.3. Why is a notch provided in the specimen for impact test?
BRINELL HARDNESS TEST
1. Very hard material cannot be tested in Brinell hardness testing machine-state thereasons.
2. How do you select the load for Brinell hardness test in case of following materials?Aluminium, Brass, Mild steel, Cast iron, Copper.
3. What are the values of P are for steel and aluminium for conducting the Brinellhardness test using a 10mm diameter ball indenter?

15 CVL 37 – Building Materials Testing Laboratory 2017-18
Dept. of Civil Engg, CIT, Gubbi – 572 216 Page 77
ROCKWELL HARDNESS TEST
1. What is the purpose of applying minor load in case of Rockwell Hardness test?2. What are the types of indenters used in hardness tests?
VICKERS HARDNESS TEST
1. What is static loading and dynamic loading applied to hardness test?2. What are the types of indenters used in hardness tests?
BENDING TEST ONWOOD UNDER TWO POINT LOADING
1. Define a) Elastic limit, b) Flexural Rigidityc) Proportionality limits d) Modulus of rupture as applied to bendingtest.
2. Define a) Section modulus b) Moment of resistancec) Tensile failure as applied to bending test.
3. Why two-point symmetrical loading is preferred in bending tests.
TESTS ON AGGREGATE
1. Define bulk density and specific gravity. Which one is most oftenly used inconcrete calculations in the field?
2. What is the range of values of specific gravity of ordinary aggregates like graveland crushed granite?
3. What are light weight aggregates and where do you use them?4. Why is the knowledge of water absorption of fine aggregate essential?5. Define bulking of aggregates and discuss its significance.6. Discuss the relative bulking tendencies of coarse sand.7. Why the bulking takes place only n sand and why not in coarse aggregate? Is this
test actually needed in field? If so explain why?8. If no allowance is made for bulking of sand, how is it going to affect the mix
proportions?9. How does specific gravity vary with hardness of stone?10. Give the average figures for specific gravity of the aggregate:
a) Gravel, b) limestone, c) granite.b) Define moisture content? Where do we need the knowledge of moisture
content
IS CODES

15 CVL 37 – Building Materials Testing Laboratory 2017-18
Dept. of Civil Engg, CIT, Gubbi – 572 216 Page 78
Slno. Specification Is code no. Title
1 Tension Test IS 1606-2008 Metallic Materials - Tensile Testing atAmbient Temperature
2 Compression Test IS –13780-1993 Hardmetals - compression test
3 Torsion TestIS 1717:2012 Metallic materials – Wire – Simple
torsion test
IS 4176:1967 Method for simple Torsion test ofaluminium and aluminium alloy wire
4 Shear Test IS –5242-1979Method of test for determining shear
strength of metals
5 Izod Impact Test IS –1598-1977 Method for Izod impact test of metals
6 Charpy Impact Test IS –1499-2003 Method for Charpy impact test (u-notch)for metals
7 Rockwell HardnessTest IS 1586-2000 Method for Rockwell hardness test for
metallic material
8 Brinell Hardness test IS 1500-2005 Method for Brinell hardness test formetallic materials
9Vickers Hardness
test IS 1501-2002Method for Vickers hardness test for
metallic materials
10 Test on bricks IS 3495 part I -1992
Methods of tests of burnt clay buildingbricks(determination of compressive
strength)
11 Test on aggregate IS 2386 part I toIV- 1963
Methods of test forAggregates for concrete