
10 (3): 96-113(2019) ISSN No. (Print) : 0975-8364 ISSN No ... Two Stage DEA OLS Approach for...
18
Khetrapal, International Journal on Emerging Technologies 10(3): 96-113(2019) 96 International Journal on Emerging Technologies 10(3): 96-113(2019) ISSN No. (Print) : 0975-8364 ISSN No. (Online) : 2249-3255 A Two – Stage DEA - OLS Approach for Analysing the Impact of Multi - Year Tariff Regulation on the Performance of Indian Electricity Distribution Utilities Pavan Khetrapal Associate Professor, Department of Electrical Engineering, Institute of Technology, Nirma University, Ahmedabad, India. (Corresponding author: Pavan Khetrapal) (Received 05 June 2019, Revised 20 August 2019 Accepted 02 September 2019) (Published by Research Trend, Website: www.researchtrend.net) ABSTRACT: This paper evaluates the impact of multi – year distribution tariff (MYT) regulation on the operational efficiency of Indian electricity distribution utilities. A two-stage estimation methodology is employed to first estimate the cross-sectional efficiency scores of distribution utilities using a variable returns to scale data envelopment analysis (DEA) model, and then to estimate the impact of contextual variables on efficiency scores using ordinary least squares (OLS) in the second-stage analysis. The results show that Indian electricity distribution utilities after implementing MYT regulation in 2006 had, on average, experienced significant efficiency improvement from 2008 to 2016. Furthermore, the efficiency improvement is most pronounced for privately-owned utilities, but not statistically significant for state-owned utilities. Keywords: Multi – year distribution tariff, Data Envelopment Analysis, electricity distribution, incentive regulation, ownership. I. INTRODUCTION The electricity governance, according to the Indian Constitution, is a “concurrent” subject implying that both the Central and State governments share authorities over supply and use of electricity. However, the primary responsibility at the consumers end is that of State governments. The year 2003 marked a new beginning of reforms in the Electricity Sector in India with enactment of the Electricity Act 2003 that replaced the legal framework for the sector hitherto governed by the Indian Electricity Act of 1910, Electric Supply Act of 1948 and the ERC Act of 1998. The Act has created a new paradigm for the development of power sector in the country and is considered as a milestone in bringing the reforms in the electricity supply industry. The key feature of EA 2003 was to introduce competition in different segments of the electricity industry and to make the distribution operations more efficient [1]. In view of this, the act proposed the framework for the introduction of multi – year distribution tariff regulation (MYT) with an aim to incentivize the distribution utilities for operating their network in an efficient way. The adoption of MYT regulation came into effect from 1 st April 2006. The proposed regulation provided the requisite framework and directions to calculate consumer electricity tariffs, and also issue the guidelines towards rationalization of electricity tariff [2]. As the thrust of proposed tariff regulation was to bring efficiency in the distribution operations, so, a decade after the implementation of MYT regulation in Indian electricity distribution industry, it seems pertinent to evaluate and analyse the impact of MYT regulation on the operational efficiency of Indian electricity distribution utilities. Acknowledging a contribution of previous academic literature, the present study needs to mention that none of the previous research document the analysis of impact of MYT regulation on the Indian electricity distribution utilities’ efficiency. With this motivation, the current study examined the impact of MYT regulation and privatization on the operational efficiency of 50 Indian electricity distribution utilities over the period 2004–2016. The present study employ a two- stage estimation methodology to first estimate the cross-sectional inefficiency scores of distribution utilities using a variable returns to scale DEA model, and then to estimate the impact of contextual variables on efficiency using Ordinary Least Squares (OLS) in the second-stage analysis. The results show that Indian electricity distribution utilities had, on average, experienced significant efficiency improvement in the post – MYT regulation implementation period i.e. from 2008 to 2016. Furthermore, the efficiency improvement is most pronounced for privately - owned utilities, but not statistically significant for state - owned utilities. II. MULTI-YEAR TARIFF REGULATION: AN OVERVIEW Prior to the enactment of Electricity Act 2003 and introduction of National Tariff Policy in 2006, the process of tariff determination followed by Indian electricity distribution utilities was an annual exercise based on Rate of Return (RoR) regulatory principles. According to this method of tariff determination, the electricity regulatory authorities set tariffs to enable utilities to recover costs plus earn a pre-determined return on the equity investment or the useful capital invested [3]. However, the RoR framework for tariff determination had not been very effective in offering sufficient incentives to utilities to reduce costs aggressively and improve their performance. Further, it should be noted that all the expenses submitted by utilities to recover distribution cost were not approved by most SERCs, and also they do not undertook prudence check on the expenditure with an aim of improving operational efficiency of utilities and thereby, reducing tariffs. Accordingly, the Government of India emphasized of replacing the annual tariff determination exercise based on RoR regulation by a new system where the tariff determination is done for a number of e t
Transcript of 10 (3): 96-113(2019) ISSN No. (Print) : 0975-8364 ISSN No ... Two Stage DEA OLS Approach for...

Khetrapal, International Journal on Emerging Technologies 10(3): 96-113(2019) 96
International Journal on Emerging Technologies 10(3): 96-113(2019) ISSN No. (Print) : 0975-8364
ISSN No. (Online) : 2249-3255
A Two – Stage DEA - OLS Approach for Analysing the Impact of Multi - Year Tariff Regulation on the Performance of Indian Electricity Distribution Utilities
Pavan Khetrapal Associate Professor, Department of Electrical Engineering,
Institute of Technology, Nirma University, Ahmedabad, India.
(Corresponding author: Pavan Khetrapal) (Received 05 June 2019, Revised 20 August 2019 Accepted 02 September 2019)
(Published by Research Trend, Website: www.researchtrend.net)
ABSTRACT: This paper evaluates the impact of multi – year distribution tariff (MYT) regulation on the operational efficiency of Indian electricity distribution utilities. A two-stage estimation methodology is employed to first estimate the cross-sectional efficiency scores of distribution utilities using a variable returns to scale data envelopment analysis (DEA) model, and then to estimate the impact of contextual variables on efficiency scores using ordinary least squares (OLS) in the second-stage analysis. The results show that Indian electricity distribution utilities after implementing MYT regulation in 2006 had, on average, experienced significant efficiency improvement from 2008 to 2016. Furthermore, the efficiency improvement is most pronounced for privately-owned utilities, but not statistically significant for state-owned utilities.
Keywords: Multi – year distribution tariff, Data Envelopment Analysis, electricity distribution, incentive regulation, ownership.
I. INTRODUCTION
The electricity governance, according to the Indian Constitution, is a “concurrent” subject implying that both the Central and State governments share authorities over supply and use of electricity. However, the primary responsibility at the consumers end is that of State governments. The year 2003 marked a new beginning of reforms in the Electricity Sector in India with enactment of the Electricity Act 2003 that replaced the legal framework for the sector hitherto governed by the Indian Electricity Act of 1910, Electric Supply Act of 1948 and the ERC Act of 1998. The Act has created a new paradigm for the development of power sector in the country and is considered as a milestone in bringing the reforms in the electricity supply industry. The key feature of EA 2003 was to introduce competition in different segments of the electricity industry and to make the distribution operations more efficient [1]. In view of this, the act proposed the framework for the introduction of multi – year distribution tariff regulation (MYT) with an aim to incentivize the distribution utilities for operating their network in an efficient way. The adoption of MYT regulation came into effect from 1
st
April 2006. The proposed regulation provided the requisite framework and directions to calculate consumer electricity tariffs, and also issue the guidelines towards rationalization of electricity tariff [2]. As the thrust of proposed tariff regulation was to bring efficiency in the distribution operations, so, a decade after the implementation of MYT regulation in Indian electricity distribution industry, it seems pertinent to evaluate and analyse the impact of MYT regulation on the operational efficiency of Indian electricity distribution utilities. Acknowledging a contribution of previous academic literature, the present study needs to mention that none of the previous research document the analysis of impact of MYT regulation on the Indian electricity distribution utilities’ efficiency. With this motivation, the current study examined the impact of
MYT regulation and privatization on the operational efficiency of 50 Indian electricity distribution utilities over the period 2004–2016. The present study employ a two-stage estimation methodology to first estimate the cross-sectional inefficiency scores of distribution utilities using a variable returns to scale DEA model, and then to estimate the impact of contextual variables on efficiency using Ordinary Least Squares (OLS) in the second-stage analysis. The results show that Indian electricity distribution utilities had, on average, experienced significant efficiency improvement in the post – MYT regulation implementation period i.e. from 2008 to 2016. Furthermore, the efficiency improvement is most pronounced for privately - owned utilities, but not statistically significant for state - owned utilities.
II. MULTI-YEAR TARIFF REGULATION: AN OVERVIEW
Prior to the enactment of Electricity Act 2003 and introduction of National Tariff Policy in 2006, the process of tariff determination followed by Indian electricity distribution utilities was an annual exercise based on Rate of Return (RoR) regulatory principles. According to this method of tariff determination, the electricity regulatory authorities set tariffs to enable utilities to recover costs plus earn a pre-determined return on the equity investment or the useful capital invested [3]. However, the RoR framework for tariff determination had not been very effective in offering sufficient incentives to utilities to reduce costs aggressively and improve their performance. Further, it should be noted that all the expenses submitted by utilities to recover distribution cost were not approved by most SERCs, and also they do not undertook prudence check on the expenditure with an aim of improving operational efficiency of utilities and thereby, reducing tariffs. Accordingly, the Government of India emphasized of replacing the annual tariff determination exercise based on RoR regulation by a new system where the tariff determination is done for a number of
et

Khetrapal, International Journal on Emerging Technologies 10(3): 96-113(2019) 97
years, in one exercise, called the Multi Year Tariff (MYT) regulation mechanism [4]. Section 61 (f) of EA 2003 states that the electricity regulatory commissions both at central and state level, while determining tariffs, shall be guided by the MYT principles so as to encourage economical use of resources, efficiency, competition, recovery of cost of electricity in a reasonable manner, offering incentives for efficiency improvements, etc. In pursuance with section 3 of the Electricity Act 2003, the National Tariff Policy announced by the Government of India in January 2006 finally mandated the CERC and SERCs to follow the MYT framework while determining consumer electricity tariffs, and thus MYT came into effect from 1
st April 2006 [5]. MYT regulatory framework
has been proposed to give an element of certainty to all stakeholders which is essential for investor interest in utilities. The basic premise is that tariffs would not fluctuate beyond a certain bandwidth unless there are force majeure events. The consumers would have a fair idea of what to expect in the next three to five years (a pre –defined control period) and the distribution utilities would also be able to plan its business having known the likely retail tariff for the control period. MYT regulations also specify provision of the annual true-up during the control period, so as to compare the actual performance (operating and cost parameters) against
earlier approved levels in the MYT order [6]. The broad objectives of MYT Regulation are: (1) Innovation: innovation in the context of a MYT framework can imply, (a) designing incentives to develop new and creative service offerings, (b) encouraging the utilities to find effective ways to reduce costs. (2) Risk allocation: MYT principles evaluate how investment decisions get influenced by various risk allocations and determine whether the utilities or consumers can sustain particular risks more efficiently. (3) Cost reduction. (a) Improving customer service and satisfaction: this generally requires the MYT framework to be accompanied with a reward/penalty scheme to encourage compliance. Subsequent to the introduction of EA 2003 and National Tariff Policy in 2006, currently 26 states out of 29 have issued MYT regulation order for the determination of consumer tariff. So, due to the limitation of data availability, the present study considered 50 distribution utilities of 24 different states. Table 1 shows the status of reforms and regulatory framework in the states undertaken in the present study.
Table 1: Status of Reforms and Regulatory Framework in the different states of India.
State Status of Reform Regulatory
Rate making
MYT Tariff Orders Issued for all the years
(FY 2008 to FY 2016)
Andhra Pradesh Unbundled Multi – Year Tariff Framework Yes
Assam Unbundled Multi – Year Tariff Framework Yes Bihar Bundled Multi – Year Tariff Framework Yes Chhattisgarh Unbundled Multi – Year Tariff Framework Yes
Delhi Unbundled Multi – Year Tariff Framework Yes Gujarat Unbundled Multi – Year Tariff Framework Yes
Haryana Unbundled Multi – Year Tariff Framework Yes Himachal Pradesh Unbundled Multi – Year Tariff Framework Yes
Jharkhand Bundled Multi – Year Tariff Framework Yes Jammu & Kashmir Unbundled Multi – Year Tariff Framework Yes Karnataka Unbundled Multi – Year Tariff Framework Yes
Kerala Bundled Multi – Year Tariff Framework Yes Madhya Pradesh Unbundled Multi – Year Tariff Framework Yes
Maharashtra Unbundled Multi – Year Tariff Framework Yes Meghalaya Unbundled Multi – Year Tariff Framework Yes Orissa Unbundled Multi – Year Tariff Framework Yes
Punjab Unbundled Multi – Year Tariff Framework Yes Rajasthan Unbundled Multi – Year Tariff Framework Yes
Tamil Nadu Generation and Distribution Bundled
Multi – Year Tariff Framework Yes
Tripura Unbundled Multi – Year Tariff Framework Yes
Uttar Pradesh Unbundled Multi – Year Tariff Framework Yes Uttarakhand Unbundled Multi – Year Tariff Framework Yes
West Bengal Unbundled Multi – Year Tariff Framework Yes
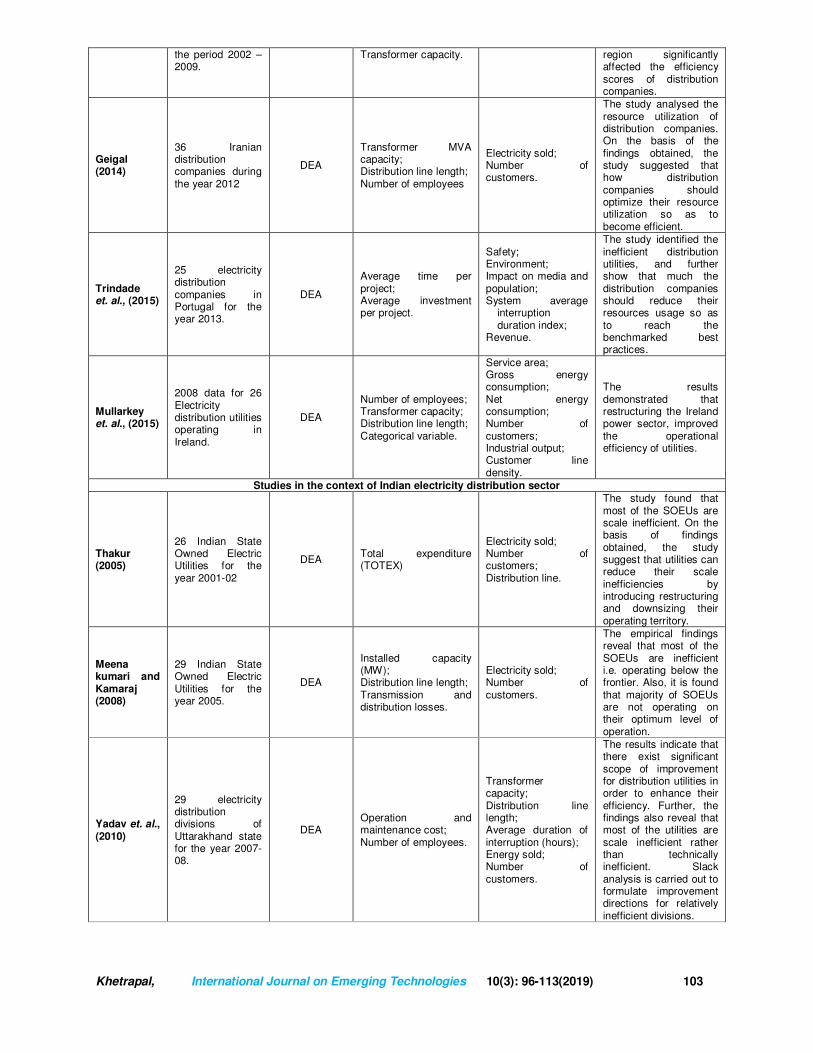
III. LITERATURE REVIEW
Over the last few years, performance evaluation of electricity supply industry has been gained increasing attention of researchers throughout the world. Analysis of electricity distribution utilities, performance optimization and policy making are very important issues for regulatory authorities in the liberalized electricity market. The existing empirical studies that have employed DEA for the performance assessment of
electricity distribution sector in the International context and in the Indian context are reviewed and summarized in Table 2. An inspection of the literature review highlights that in Indian context, none of the reviewed study evaluated and analysed the impact of MYT regulation on the performance of electricity distribution companies. The current study is an attempt to bridge the gap by evaluating and analysing the impact of MYT regulation on distribution utilities’ performance.

Khetrapal, International Journal on Emerging Technologies 10(3): 96-113(2019) 98
Table 2: Review of Electricity Distribution Benchmarking Studies.
Author (s) and year
Scope Methodology Inputs Outputs Results and Outcome
International Studies
Weyman – Jones (1991)
12 UK Area Electricity Boards in England and Wales
DEA Capital (total value of company area assets); Labour
Retail sales to domestic, commercial and industrial customers
The study finds only five technically area of the twelve boards efficient, and that there wide divergence in performance.
Hjalmarsso and Veider pass (1992)
1985 data on 142 Swedish Electricity Distributors.
DEA
Hours worked (h) by all employees; Low voltage power lines (km); High voltage power lines (km); and Total transformer capacity (KVA).
Low voltage electricity (MWh) received by the customers; High voltage (MWh) electricity received by the customers; LV customers; and HV customers.
Three different models which differ according to the outputs used were considered. All three models contained all four inputs. The urban distributors were found to be more efficient than rural distributors, but this was mostly due to scale efficiency. There was little difference observed in the relative efficiency of private and publicly owned distribution utilities.
Miliotis (1992)
45 distribution districts in the Greek Public Power Corporation (PPC)
DEA
Total network length; Installed transformers’ kVA capacity; General expenses; Administrative labour (hrs); Technical labour (hrs).
Number of customers; Energy supplied.
The DEA scores suggest higher efficiency in urban areas but this is not supported by econometric results. The applied approaches indicate the excess use of labour in inefficient utilities.
Kittlesen (1993)
1989 data on 142 Norwegian Electricity Distribution Utilities
DEA
Employee hours; Transmission losses; External services bought.
Total power delivered; Number of customers Length of power line;
Significant inefficiencies were present in the EDUs. This paper demonstrated how to choose variables for measuring technical efficiency using a stepwise procedure employing statistical tests of model specification.
Hougaard (1994)
82 Danish Electricity Distribution Utilities during the period 1991
DEA
Number of employees; Wages; OPEX; Losses; Capital value
Network size; Electricity supplied; Number of customers.
The results signify that there was significant potential for efficiency improvement among the utilities.
ESAA (1994)
114 Distribution Utilities from Australia (1990/91 data), US (1990 data) and England and Wales (1989 data)
DEA Electricity sales; Number of customers
Network length; Distributed electricity; Number of full time employees.
Average technical efficiency among the Australian distributors was significantly below than compared to international best practice/s.
Burns and Weyman – Jones (1994)
1973 – 1993 data on 12 RECs in England and Wales
DEA Malmquist
Index
Number of full time employees; Network size; Transformer KVA capacity; Customer density; Share of industrial energy.
Number of customers; Units sold to domestic customers, commercial users, and industrial consumers; Maximum demand.
The results indicated that the productivity growth before and after privatisation has been the same although there is an underlying technological progress. There was a greater diversity of performance against the RECs compared with their performance under state ownership.
Pollitt (1995) 1990 data on 9 UK distribution
DEA Network size; Labour ;
Service area; Non – residential
No strong evidence that performance is affected

Khetrapal, International Journal on Emerging Technologies 10(3): 96-113(2019) 99
firms, 136 US distribution utilities, and 129 US transmission firms.
Transformer capacity. sales; Residential sales; Number of customers; Electricity output (GWh)
by ownership. Also found that relative performance of UK distribution utilities were comparable to their US counterparts.
Bagdadioglu et. al,. (1996)
1991 data on 70 Turkish retail distribution organization
DEA
Labour; General expenses; Network size; Network losses. Transformer capacity;
Service area; Maximum demand; Electricity supplied; Number of customers.
The study tested 5 separate model specifications, and found that private utilities are both technical and scale efficient compared to public utilities
Førsund and Kittelsen (1998)
170 electricity utilities engaged in local retail distribution in Norway in 1989 and 157 in 1983.
DEA, Malmquist
Index
Material (1000 NoK); Labour (h); Capital (1000 NoK); Energy loss (MWh).
Total energy delivered (MWh); Number of customers; Distance index expressing density of customers.
An overall positive productivity growth was found during the observed period which was largely attributed to frontier technology shift.
Goto and Tsutsui (1998)
14 US electric utilities and 9 Japanese electric utilities during the period 1984 to 1993.
DEA
Quantity of power purchase; Total number of Employees; Quantity of fuel used; Nameplate generation capacity, used as proxy for total asset in order to operate utilities (MW) .
Quantity sold to non-residential (commercial, industrial, others, and wholesale) customers (GWh); Quantity sold to residential customers (GWh).
The authors found that during the observed period, the Japanese power enterprises are cost inefficient compared to US electric utilities. The allocative inefficiency was the main source of overall cost inefficiencies for Japanese utilities.
Zhang and Bartels (1998)
173 Swedish Retail Electricity distributor, 51 Electricity Power Boards in New Zealand, and 32 Electricity Supply Authorities in Australia. (considered separately).
DEA
Total transformers’ MVA capacity; Total kilometres of distribution lines; Number of employees.
Total number of customers served.
The study was carried out to illustrate the sample size effect on mean DEA technical efficiency. The findings pointed out that sample size has an effect on mean efficiency and this impact needs to be removed to reduce bias in inter – industry comparisons.
Honkatukia and Sulamaa (1999)
1996 -1998 data on all Finnish electricity distribution companies
DEA, Malmquist
Index
Labour; Transformer capacity; Length of lines.
Number of customers; Energy delivered; Total road mileage.
The average technical efficiency was obtained as 0.75 – 0.80 whereas scale efficiency was about 0.9. The study also found that no significant productivity change was observed over the period.
Lo, Chien and Lin (2001)
22 electricity distribution districts in Taiwan Power Company for the year 1997.
DEA
Transformer capacity; General expenditure; Total assets; Distribution network; Employment expenditure; .
Energy supplied; Number of customers.
The findings demonstrated that most of the Taiwan Power utilities exhibit good overall efficiency. The study also investigated that the utilities which are inefficient are due to scale inefficiency rather than technical inefficiency.
Pacudan and de Guzman (2002)
15 Philippines electricity distribution utilities
DEA Network losses; Network size; Number of employees
Electricity sold; Service area; Number of customers.
The main source of technical inefficiency in the distribution utilities was found to be scale inefficiency. The study also simulated the effect of energy efficiency policies on the technical efficiency of distribution utilities and found that

Khetrapal, International Journal on Emerging Technologies 10(3): 96-113(2019) 100
demand side management implementation and system loss reduction made significant improvements to technical efficiency.
Resende (2002)
24 Brazilian distribution system operators during the period 1997 – 98
DEA
Network size; Transformer capacity; Number of employees.
Electricity sold to non – industrial customers; Electricity sold to industrial customers; Service area; Number of customers.
The study found that there exists substantial technical inefficiency, and it was mainly due to scale inefficiencies.
Chen (2002)
22 distribution system operators during the period 1997 and 1998
DEA General expenses; Network size; Transformer capacity.
Manpower; Total revenue; Maximum demand; HV electricity supplied; LV electricity supplied; Number of HV consumers; Number of LV consumers.
Eight different model specifications were tested. Urban distribution system operators were found to be more efficient than compared to rural distribution system operators.
Agrell et. al., (2002)
1996 – 2000 data on 238 Swedish electricity distribution companies
DEA Net losses; CAPEX; OPEX.
Net stations per installed MW; Normalized network length; Climate zone; Electricity sold to HV consumers; Electricity sold to LV consumers; Number of HV connections; Number of LV connections; Coincidental peak load.
This paper compares the popular CPI – X model with DEA based dynamic yardstick model. Since the DEA based dynamic yardstick model compares favourable with the CPI – X model, this study proposed the Scandinavian electricity distribution companies to implement dynamic yardstick model to regulate the distribution tariff.
Pahwa et. al., (2002)
50 US distribution utilities
DEA
Distribution lines; Distribution line transformers; Capital additions expenses (CAPEX); Operating and maintenance expenses; Distribution system losses.
Number of retail customers; Electricity sold to retail customers; System peak load.
The results analyse sensitivity – based classification of utilities, input – output variables, inefficient utilities and performance efficiency. The findings also reveal that inefficient utilities can develop and implement better corporate strategies to enhance performance.
Chien et. al., (2003)
17 service canters of NAN-TOU electricity distribution district associated with Taiwan Power Company (TPC).
DEA
Value of general equipment (NT$10,000); Number of employees.
Transformer kVA capacity; Distribution line length (km); Number of customers.
The study found that reorganizing the service centers and electricity distribution district enhanced their performance.
Edvardsen and Førsund (2003)
122 distribution utilities from Netherland, Sweden Finland, Norway, and Denmark during the year 1997.
DEA
Replacement value; Power lines network (km); Energy lost due to interruptions; Total operating and maintenance costs;
Energy delivered; Number of customers
The empirical results pointed that Finland distribution utilities are most productive compared to the other distribution utilities.
Korhonen and Syrjanen (2003)
1998 data on 102 Finnish distribution network operators
DEA Operating expenditure (OPEX)
Number of customers; Total network length; Quality of supply; Energy sold.
The study concentrated on the practical aspects of determining and selecting the factors included in the efficiency analysis. It was found that

Khetrapal, International Journal on Emerging Technologies 10(3): 96-113(2019) 101
considerable improvements to efficiency can be achieved by the distribution network operators.
Sanhueza et. al., (2004)
35 Chilean distribution companies during the year 2000.
DEA
Distribution added value (real VAD); Salaries; Number of workers; Energy that has not been billed; Total kilometre of lines.
Number of customers; Coincident power during peak hours; Total energy sold.
The study is carried out implement DEA so as to obtain the specific estimation of the efficiency for VAD.
Jamasb et. al., (2004)
28 US distribution utilities for the financial year 2000.
DEA Operating expenditure (OPEX)
Length of network (km); Number of customers; Electricity sold.
The outcomes show that gaming have significant impact on the profitability and measured performance of the utilities.
Giannakis et. al., (2005)
14 DNOs in the UK for the period from 1991/92 to 1998/99
DEA
Operating expenditure; Total expenditure; Number of interruptions; Customer time lost due to interruptions.
Total network length; Energy delivered; Number of customers.
The study considered five different model specifications. The findings reveal that cost – efficient utilities do not necessarily exhibit high service quality and no strong correlation - ship exists between efficiency scores of quality – based models and cost – only models. The result outcomes also show that enhancement in sector’s total productivity change is mainly due to improvements in service quality.
Abbott (2006)
7 Australian State electricity sectors over the period 1969 to 1999.
DEA, Malmquist
Index
Labour employed; Energy used (TJ); Capital stock.
Electricity consumed.
The results indicate that since the mid – 80’s, there exists a substantial improvement in the performance of the sector, and still there is a potential for further improvement.
Yang and Lu (2006)
24 Electricity distribution districts (EDDs) of Taiwan Power Company during the year 2003.
DEA
Transformer KVA capacity; Length of distribution network. Total assets; Operating expenditure; Employment expenditure.
Energy loss rate; Quantity of energy sold; Number of customers.
The study found that EDDs situated in urban areas are more efficient than those situated in rural areas because of the geographical dispersion of customers.
Pombo and Taborda (2006)
12 Colombian power distribution companies over the period 1985 to 2001.
DEA, Malmquist
Index
Power lines network (km); Employees in power distribution and commercialization; Number of transformers.
Total consumers; Total sales (GWh)
An improvement in the main performance indicators of profitability, partial input productivity, output, and plant efficiency is observed after introducing regulatory reforms in 1994 in Colombia’s power distribution sector.
Yu et. al., (2009)
14 UK distribution networks between 1990/91 and 2003/04
DEA
Operating expenditure (OPEX); Capital expenditure (CAPEX).
Distribution losses; Customer interruption; Length of line; Number of customers; Energy delivered.
The study found a mix results of efficiency improvement during the price control review periods. Further, the utilities are found allocatively inefficient. The results also suggest that the utilities may not be sufficiently

Khetrapal, International Journal on Emerging Technologies 10(3): 96-113(2019) 102
incentivised to achieve socially optimal input bundles under the implemented incentive scheme.
Simab and Haghifam (2009)
41 Iranian distribution companies
DEA
Operating expenditure; Number of staff; Energy loss rate.
Quantity of energy.
DEA with k – means algorithm is introduced to determine the efficiency of distribution companies. The average overall efficiency score of sampled distribution companies is obtained as 72%. Results of slack analysis provided the specific directions to improve inefficient companies.
Reyes and Tovar (2009)
14 Peruvian distribution companies for the period 1996 – 2006.
DEA
Monetary value of the active capital; Distribution power losses; Number of employees; Medium-voltage and low-voltage network kilometres.
Energy sold (MWh); Number of customers.
The results suggest that improvements in the efficiency and productivity of electricity distribution in Peru have occurred, and that there is a relationship between the restructuring of distribution sector and the enhancement of productivity.
Pokharel and Shrestha (2010)
59 distribution companies during the fiscal year 2001/02 – 2004/05
DEA
Operating and maintenance cost; Distribution loss; Transformer MVA capacity; Number of employees; Feeder line length.
Electricity sold; Number of consumers.
The results indicate that there exist both scale and managerial inefficiencies in Nepalese electric distribution companies. The study also found that publicly owned distribution companies are more scale efficient whereas privately owned distribution companies are managerially more efficient.
Jha et. al., (2011)
57 electricity distribution utilities in Nepal during the period 2004 – 05
DEA
Distribution loss; Number of employees; Annual O & M cost; Feeder length (km); Distribution transformer KVA capacity.
Annual energy sales; Number of customers.
Based on the results of sensitivity analysis, improvement possibilities are identified for an efficient operation of the distribution companies. The results also found that most of the distribution companies have excessive O & M cost in operation and maintenance works.
Ghafouri et. al., (2012)
21 distribution network operators of Greater Tehran
DEA Network length; Number of employees.
Inverse of System Average Interruption Duration Index; Electricity sold; Number of customers.
Based on the Weighted Slack Based Measurement results, the study identified the inefficient operators, and further suggest the necessary improvements for the performance enhancement of distribution of distribution operators.
Celen (2013)
21 Turkish electricity distribution companies during
DEA
Number of employees; Distribution line length; Outage hours per customer;
Electricity sold; Number of customers.
The empirical results found that private ownership and customer density of the
Khetrapal, International Journal on Emerging Technologies 10(3): 96-113(2019) 103
the period 2002 – 2009.
Transformer capacity. region significantly affected the efficiency scores of distribution companies.
Geigal (2014)
36 Iranian distribution companies during the year 2012
DEA
Transformer MVA capacity; Distribution line length; Number of employees
Electricity sold; Number of customers.
The study analysed the resource utilization of distribution companies. On the basis of the findings obtained, the study suggested that how distribution companies should optimize their resource utilization so as to become efficient.
Trindade et. al., (2015)
25 electricity distribution companies in Portugal for the year 2013.
DEA
Average time per project; Average investment per project.
Safety; Environment; Impact on media and population; System average
interruption duration index;
Revenue.
The study identified the inefficient distribution utilities, and further show that much the distribution companies should reduce their resources usage so as to reach the benchmarked best practices.
Mullarkey et. al., (2015)
2008 data for 26 Electricity distribution utilities operating in Ireland.
DEA
Number of employees; Transformer capacity; Distribution line length; Categorical variable.
Service area; Gross energy consumption; Net energy consumption; Number of customers; Industrial output; Customer line density.
The results demonstrated that restructuring the Ireland power sector, improved the operational efficiency of utilities.
Studies in the context of Indian electricity distribution sector
Thakur (2005)
26 Indian State Owned Electric Utilities for the year 2001-02
DEA Total expenditure (TOTEX)
Electricity sold; Number of customers; Distribution line.
The study found that most of the SOEUs are scale inefficient. On the basis of findings obtained, the study suggest that utilities can reduce their scale inefficiencies by introducing restructuring and downsizing their operating territory.
Meena kumari and Kamaraj (2008)
29 Indian State Owned Electric Utilities for the year 2005.
DEA
Installed capacity (MW); Distribution line length; Transmission and distribution losses.
Electricity sold; Number of customers.
The empirical findings reveal that most of the SOEUs are inefficient i.e. operating below the frontier. Also, it is found that majority of SOEUs are not operating on their optimum level of operation.
Yadav et. al., (2010)
29 electricity distribution divisions of Uttarakhand state for the year 2007-08.
DEA Operation and maintenance cost; Number of employees.
Transformer capacity; Distribution line length; Average duration of interruption (hours); Energy sold; Number of customers.
The results indicate that there exist significant scope of improvement for distribution utilities in order to enhance their efficiency. Further, the findings also reveal that most of the utilities are scale inefficient rather than technically inefficient. Slack analysis is carried out to formulate improvement directions for relatively inefficient divisions.
Khetrapal, International Journal on Emerging Technologies 10(3): 96-113(2019) 104
IV. METHODOLOGY
A two-stage DEA estimation approach is applied in the present paper so as to evaluate the impact of incentive - based multi – year distribution tariff with DEA benchmarking on operational efficiency of electricity distribution utilities in Indian power sector. Data Envelopment Analysis (DEA) is a nonparametric econometric methodology to estimate production/cost frontiers of a group of homogenous organizations [48], [49]. Since the late 1980s, hundreds of academic studies have employed DEA to measure the efficiency of energy utilities such as electricity distribution utilities and power generation plants, and to estimate the efficient costs of electricity distribution utilities for rate setting [50-53].
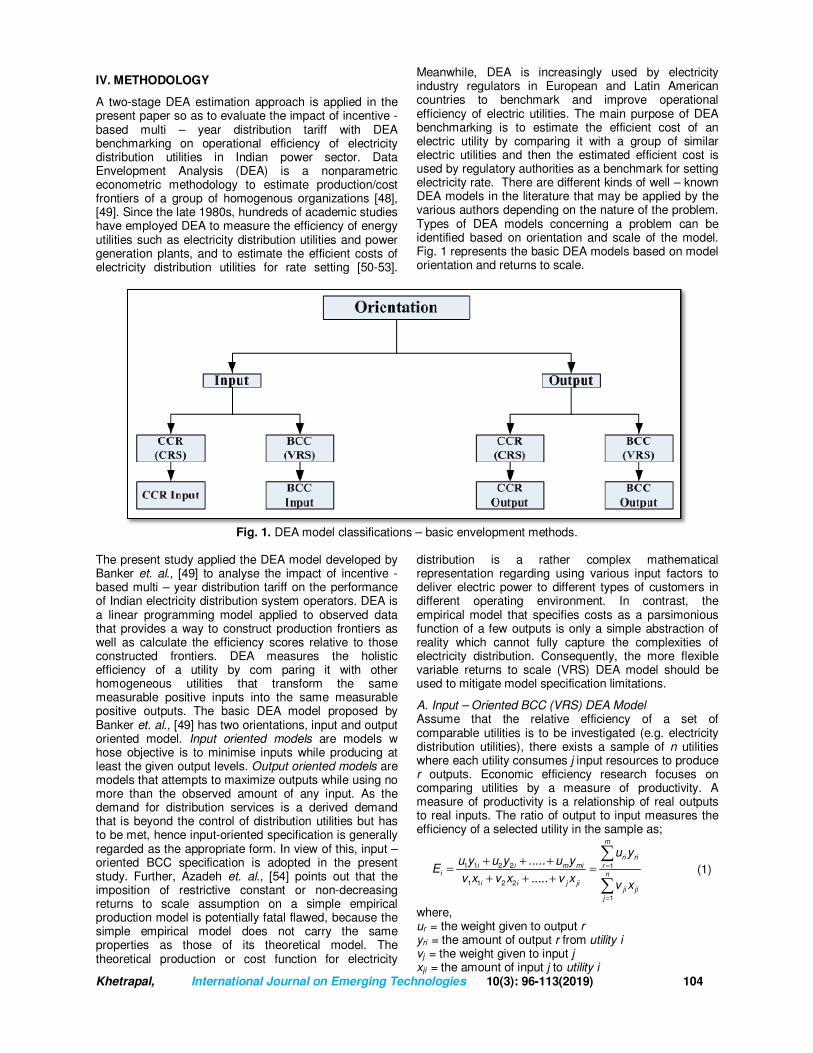
Meanwhile, DEA is increasingly used by electricity industry regulators in European and Latin American countries to benchmark and improve operational efficiency of electric utilities. The main purpose of DEA benchmarking is to estimate the efficient cost of an electric utility by comparing it with a group of similar electric utilities and then the estimated efficient cost is used by regulatory authorities as a benchmark for setting electricity rate. There are different kinds of well – known DEA models in the literature that may be applied by the various authors depending on the nature of the problem. Types of DEA models concerning a problem can be identified based on orientation and scale of the model. Fig. 1 represents the basic DEA models based on model orientation and returns to scale.
Fig. 1. DEA model classifications – basic envelopment methods.
The present study applied the DEA model developed by Banker et. al., [49] to analyse the impact of incentive - based multi – year distribution tariff on the performance of Indian electricity distribution system operators. DEA is a linear programming model applied to observed data that provides a way to construct production frontiers as well as calculate the efficiency scores relative to those constructed frontiers. DEA measures the holistic efficiency of a utility by com paring it with other homogeneous utilities that transform the same measurable positive inputs into the same measurable positive outputs. The basic DEA model proposed by Banker et. al., [49] has two orientations, input and output oriented model. Input oriented models are models w hose objective is to minimise inputs while producing at least the given output levels. Output oriented models are models that attempts to maximize outputs while using no more than the observed amount of any input. As the demand for distribution services is a derived demand that is beyond the control of distribution utilities but has to be met, hence input-oriented specification is generally regarded as the appropriate form. In view of this, input – oriented BCC specification is adopted in the present study. Further, Azadeh et. al., [54] points out that the imposition of restrictive constant or non-decreasing returns to scale assumption on a simple empirical production model is potentially fatal flawed, because the simple empirical model does not carry the same properties as those of its theoretical model. The theoretical production or cost function for electricity
distribution is a rather complex mathematical representation regarding using various input factors to deliver electric power to different types of customers in different operating environment. In contrast, the empirical model that specifies costs as a parsimonious function of a few outputs is only a simple abstraction of reality which cannot fully capture the complexities of electricity distribution. Consequently, the more flexible variable returns to scale (VRS) DEA model should be used to mitigate model specification limitations.
A. Input – Oriented BCC (VRS) DEA Model Assume that the relative efficiency of a set of comparable utilities is to be investigated (e.g. electricity distribution utilities), there exists a sample of n utilities where each utility consumes j input resources to produce r outputs. Economic efficiency research focuses on comparing utilities by a measure of productivity. A measure of productivity is a relationship of real outputs to real inputs. The ratio of output to input measures the efficiency of a selected utility in the sample as;
1 1 2 2 1
1 1 2 2
1
=
=
+ + += =
+ + +
∑
∑
m
ri rii i m mi r
i n
i i j jiji ji
j
u yu y u y ..... u y
Ev x v x ..... v x
v x
(1)
where, ur = the weight given to output r yri = the amount of output r from utility i vj = the weight given to input j xji = the amount of input j to utility i

Khetrapal, International Journal on Emerging Technologies 10(3): 96-113(2019) 105
Within the DEA framework, multiple inputs and multiple outputs are reduced to a single virtual input and a single virtual output, culminating in a single relative efficiency score. DEA establishes that each utility be allowed to adopt a set of weighted factors that portray it in the most favourable light in comparison to the other utility. The weights (u, v) corresponding to the outputs and inputs selected are to achieve Pareto efficiency for each utility. Pareto efficiency is attained by a utility, if and only if none of its inputs or outputs can be improved without worsening some of its other inputs or outputs. The fundamental CCR model assumes CRS, which is arguably less appropriate for evaluation of electricity distribution utilities, because there should be no assumption of constant returns to scale. The CRS assumption is only appropriate when all utilities are operating at an optimal scale. However, imperfect competition, government regulations, constraints of finance, among others may inhibit a utility from operating at optimal scale. The CCR model can be altered to incorporate a more general variable returns to scale (VRS) environment.
The CCR model exhibits CRS assumption and evaluates the Total Technical Efficiency (TTE) for each utility, specifically by aggregating Pure Technical Efficiency (PTE) and Scale Efficiency (SE) into one value. The BCC model with VRS can differentiate between PTE and SE, and determine if increasing returns to Scale (IRS), decreasing returns to scale (DRS), or constant returns to scale (CRS) possibilities are present. The BCC model differs from the CCR by incorporating
the condition 1
1=
λ =∑n
j
j
which is also written as ελ = 1
where ε is a row vector with all elements unity and λ is a column vector with all elements of non negative.
Together with the condition j 0λ ≥ for all j, this imposes
a convexity condition on allowable ways in which the observations for the n utilities may be combined. This added constraint introduces an additional variable into the (dual) of the multiplier problems. The primal and dual representations of input – oriented BCC models are shown as follows:
Model Orientation Multiplier Model (Primal) Envelopment Model (Dual)
Input – oriented BCC model
1=
θ = µ∑m
k rk rk
r
Max y
Subject to m n
rk rz jk jzr 1 j 1
y v x ;= =
µ −∑ ∑ z = 1,..,s; n
jk jkj 1
v x 1=
=∑
r j, v 0; r 1,..,m; j 1,..,nµ ≥ ε > = = (2)
n k
k jk rkj 1 r 1
Min s s− +
= =
θ −ε +
∑ ∑
Subject to s
jz z jk jkz 1
x s x−
=
λ + = θ∑ ; j=1,….,n;
1
+
=
λ − =∑s
rz z rk rk
z
y s y ; r=1,….,m; 1
1=
λ =∑s
z
z
0− +λ ≥z jk rk, s , s z=1,…..,s. (3)
where θk is the scalar efficiency measure of utility “k”
relative to all other utilities, −jks and
+jrks represent
input and output slacks; ε is a non-Archimedean constant, which constrains the input and output coefficients to be positive, eliminating the possibility that they will be given a zero relative value in the DEA results. It should be noted that the superscripted minus sign on input slack indicates reduction, while the superscripted positive sign on output slacks require augmentation of outputs. Since, the primal formulation (envelopment form) involves the fewer constraints than the dual form (the multiplier form), so, the standard practice due to computational convenience is to solve the primal model.
B. OLS Regression The efficiency estimates obtained from the first stage DEA model are then regressed on some environmental variables using OLS in the second stage regression. Since the efficiency scores obtained from the DEA model lies between 0.0 (left-censored) to 1.0 (right-censored), the OLS regression model is found meaningful for the second - stage of DEA analysis for further assessment. The OLS regression model for output – oriented BCC (VRS) DEA Model is formulated as:
DEAi i i
ˆln z ,θ = α + δ + ω I =1, 2,…,N (4)
where the intercept α captures the finite sample bias of the DEA estimator and the expected inefficiency, and the
composite disturbance term iω captures deviations of ui
from the expected inefficiency 1 and the noise term vi .
V. DATA VARIABLES
The fundamental step in applying DEA methodology is the selection of appropriate input and output variables. It is important to mention here that there is no common consensus on which input and output variables best explain the operating procedure of distribution utilities. On the basis of review of 20 benchmarking studies of electricity distribution operators, Jamasb and Pollitt [50] summarized the most commonly used inputs and outputs in this context. Following the extensive review by Jamasb and Pollitt [50] in selecting the inputs and outputs, the dataset in the present study contains operating expenses (OPEX) and a few outputs/cost drivers, including number of customers (Customer), electricity delivered (Energy Sold), and length of distribution network (Network). In this study, OPEX are converted to 2004 Indian rupees using annual consumer price index to adjust for inflation. In addition to OPEX and output variables, five environmental variables: service area, density of lightning, rainfall, Real GDP per capita and aggregate technical and commercial (AT & C) losses are also incorporated to control for variations in operating environment. To capture the effect of DEA-based incentive regulation on operational efficiency, we construct an Incentive dummy variable, equal to 1 if the utility submitted the MYT requirement for three review control period (i.e. 2008–2010, 2011–2013, 2014-2016); otherwise

Khetrapal, International Journal on Emerging Technologies 10(3): 96-113(2019) 106
Incentive equals 0.The electricity distribution utilities in Indian power sector have two types of ownership: state – owned government utilities and privately owned distribution utilities. To account the moderating effect of ownership, we define a Ownership dummy variable, equal to 1 if a distribution utility is government regulated; otherwise equal to zero. Additionally, Large is a dummy variable indicating whether a utility has a consumer base equal to or more than 5 lakhs. A panel data of 50 Indian electricity distribution utilities over a thirteen year period 2004 – 2016 is covered in the
present study. The dataset of inputs and outputs is collected from various sources: (a) Aggregate Revenue Requirement and MYT petition submitted by each distribution utility for tariff determination, (b) Annual Reports of each individual distribution utility, (c) Audit Reports issued by Comptroller and Auditor General (CAG) of India, (d) ‘Performance of State Power Utilities’ - yearly reports published by Power Finance Corporation Limited, New Delhi, India [55]. Descriptive statistics of the variables used in the present study are specified in Table 3.
Table 3: Descriptive statistics of operating expenses, output and environmental variables of distribution
utilities from 2004 to 2016.
VI. RESEARCH HYPOTHESIS AND EMPIRICAL MODEL
A. Hypothesis Development Network industries (e.g. electricity distribution and telecommunication) are often thought of existence of natural monopolies, and had been regulated under a cost of service regime to protect public interests from abuse of monopoly power and to attract sufficient capital investment [56, 57]. However, these regulated utilities do not have incentive to reduce costs under the cost of service regime, because their revenues are determined by costs. Economists proposed high powered incentive regimes, such as a revenue/price cap, yardstick competition, and multi – year tariff regulation, to encourage efficiency improvement and cost reduction [58-60]. Under these regimes, distribution utilities have incentives to exert effort to reduce costs because regulators decouple sales revenue from costs and allow utilities to retain their cost savings as profits [61]. Following the successful examples of the UK, Norway and other European countries, the State Electricity Regulatory Commissions mandated the distribution utilities to adopt MYT regulation since 2006 to set price cap for electricity distribution services. Economic theory shows that DEA benchmarking creates a pseudo market for distribution utilities to compete because the service price is set based on the industry best practices, but not based on the costs of the distribution utility. Consequently, each distribution utility achieves socially efficient level of cost reduction in equilibrium [62]. If a distribution utility failed to reduce costs, it would make substantial losses, threatening the long-term financial viability of the utility.
As a result, it is expected that electricity distribution utilities in India are more motivated to reduce costs after switching to MYT regulatory framework in 2006 for setting consumer tariff, which leads to research hypothesis 1. H1: Electricity distribution utilities in India have, on average, experienced significant efficiency improvement after the implementation of MYT regulation in 2006. State-owned and private utilities have different institutional arrangements and incentives, which result in differences in efficiency between the two types of utilities [63]. Because the property rights under state ownership are not clearly defined, state-owned utilities often need to meet political objectives (e.g., excess employment) from politicians, government and the media and are more cautious about cutting jobs and other resources [64, 65]. The ambiguous goals of state-owned utilities, such as maximizing public interest, make it difficult for citizens to monitor managers and politicians and hold them accountable for the performance of state-owned utilities [66]. Furthermore, state-own utilities are not disciplined by threats of bankruptcy and takeovers as they could receive government bailouts (i.e., soft budget constraints) for poor financial performance. In contrast, privatization relocates controls rights from politicians to managers and private investors, who are much more incentivized to maximize profits through efficiency improvement. Privatization also substantially increases the cost of forcing private utilities to remain inefficient because the subsidies to these private utilities are politically harder to sustain. In the 1950s, the Indian government created many state-owned firms in industries (e.g., electricity and mining) that were considered crucial for national economic development.
Variable
Descriptive Statistics
Unit Mean Standard Deviation
Maximum Minimum
Operating Expenditure (OPEX)
Crore Indian Rupees 3317.40 3694.32 8978 235
Customer Numbers 3351180.38 3866850.77 23180000 150231
Energy Sold Million Units (MU) 13450.12 16574.65 95652 415.63 Distribution Line Length Kilometre (kM) 155170.34 156862.84 870822.37 2823 Lightning Flashes/km
2/year 4.563 2.356 12 7
Rainfall mm 1958.65 2549.12 3456 313 Real GDP Per Capita Indian Lac Rupees 5.9635 7.4602 9.879 1.562
Ownership Dummy Variable 0.852 0.489 1 0 Incentive Dummy Variable 0.652 0.759 1 0 Service Area Square km 46408.2 65892.3 92547.32 7425.23
Size Dummy Variable 0.483 0.500 1 0 Aggregate Technical & Commercial Losses
MWh 6985.7 8695.3 15625 105.3
Khetrapal, International Journal on Emerging Technologies 10(3): 96-113(2019) 107
As economic theory predicts, these state-owned firms had to meet various political objectives. Meanwhile, most of these state-owned firms are funded directly from government budgets, leading to the governance issue of soft budget constraints. The fast rising losses and liabilities of the state-own firms forced the Indian government to introduce privatization in the 1990s. Because privately- and state-owned distribution utilities have different objectives for decision making, the MYT regulation in Indian electricity supply industry is likely to have different effects on efficiency improvement for utilities with different types of ownership. The primary objective of private electricity distribution utilities is profit maximization, while state-owned distribution utilities are subject to various political objectives. For instance, state-owned distribution utilities often have labour unions inside which constantly prevent the firms from reducing in-house labour costs through outsourcing. Additionally, state-owned distribution utilities have the obligation to provide remote rural communities with access to electricity in compliance with the “Light for All” program introduced by Government [67]. Because privately-owned utilities are more responsive to regulatory incentives, it is expected that mangers in privately-owned distribution utilities make more effort to reduce costs than those in state-owned firms. This leads to research hypothesis 2. H2: Privately-owned distribution utilities in India have, on average, experienced more efficiency improvement than state-owned distribution utilities after the implementation of MYT regulation in 2006.
B. Estimated Empirical Model In the present research work, the impact of MYT regulation with DEA benchmarking on operational efficiency of electricity distribution utilities in Indian electricity supply industry is estimated using a two – stage DEA model. The two-stage DEA approach first estimates the inefficiency scores of electricity distribution utilities using DEA, and then regresses the logarithm of estimated inefficiency scores on contextual variables using OLS in the second stage. Banker and Natarajan [68] show the OLS regression yields consistent estimators of the impact of contextual variables under certain regularity conditions. In the proposed model, the operating costs of electricity distribution utilities is specified as a function of three key outputs or cost drivers, number of customers (Customer), electricity sold (Energy sold) and length of distribution network (Network). In the first stage analysis, the following DEA model is adopted to estimate the cross-sectional inefficiency scores of electricity distribution utilities,
1
1
1
1
subject to
1 0 (5)
=
=
=
θ = φ
λ ≤ φ
λ ≥
λ = λ ≥
∑
∑
∑
i
j j o,j
i
j j oj
i
j j
j
( / ) min
x x
Y Y
,
where θ refers to the estimated inefficiency score of an electricity distribution firm; x refers to operating costs (OPEX); Y represents the vector of the three outputs or cost drivers, Customer, Energy Sold, and Network. The
constraini
j
j 1
1=
λ =∑ represents that the production
technology exhibits variable returns to scale (VRS). As operating expenses are specified as a parsimonious function of three outputs, we use the VRS DEA model to mitigate potential model specification limitations. In the second stage analysis, OLS regression is conducted to estimate the impact of price cap regulation with DEA benchmarking on operational inefficiency and the moderating role of ownership on efficiency improvement. The regression model is specified as follows:
it o 1 it 2
3 it it
ln ( ) * Ownership * Incentive
* Ownership * Incentive Environmentals
θ = α + α + α +
α + + ε(6)
where ln (θ) represents the logarithm of inefficiency scores of electricity distribution utilities’ estimated by DEA Model (1). Incentive is a dummy variable, equal to 1 if the utility submitted the MYT requirement for three review control period (i.e. 2008–2010, 2011–2013, 2014-2016); otherwise 0. Ownership is a dummy variable, equal to 1 if an electricity distribution utility is state government regulated ; otherwise 0. When the interaction term Incentive *Ownership is not included in the regression model (5), the coefficient estimate on Incentive, 2α , captures the overall effect of
MYT regulation on operational efficiency. According to research hypothesis 1, it is expected that 2α is
significantly negative. When the interaction term Incentive *Ownership is included in the regression model
(5), the coefficient estimate on Ownership, 1α , captures
the difference in efficiency between privately and state-owned utilities in the pre - incentive regulation period (2004-2006) (i.e. before the implementation of MYT
regulation for regulating distribution tariff), and 3α
captures the moderating effect of ownership on the relationship between DEA-based MYT regulation and
operational inefficiency. We expect that 3α is significantly
negative according to research hypothesis 2.
VI. RESULTS AND DISCUSSIONS
All the utility year observations of 50Indian electricity distribution utilities from 2004 to 2016 is pooled in the present study and employ the DEA model to estimate the cross-sectional inefficiency scores of the distribution utilities. Table 4 presents variable returns to scale (VRS) technical efficiency performances of state-owned and privately - owned distribution utilities whereas the average efficiency scores of utilities are summarized in Table 5. The empirical findings in Table 5 explain that if the utilities operated efficiently (i.e. lying on the frontier), the state-owned distribution utilities could sold the same amount of electricity to the same number of consumers with about 36.2% less input usage, and the privately – owned distribution utilities could reduce their input resource utilization by 21.1% to deliver the same amount of electricity to the same number of customers. Further, it is observed from Table 5, that the state-owned distribution utilities on average have the low efficiency scores in both pre- and post - MYT regulation periods as compared to privately-owned distribution utilities. The privately-owned distribution utilities experienced significant efficiency improvement in the post MYT

Khetrapal, International Journal on Emerging Technologies 10(3): 96-113(2019) 108
regulation period (2008-2016) following the restructuring and privatization reforms introduced in the Indian
electricity supply industry.
Table 4: Efficiency Score of State – Owned and Privately Owned Electricity Distribution Utilities in Pre – and Post – MYT implementation period.
Name of the Distribution Utility
State
2004–2006 (Pre MYT Implementation period)
2008-2016 (Post MYT Implementation
period)
Technical Efficiency Score
RTS Technical Efficiency Score
RTS
State – Owned Electricity Distribution Utilities
APCPDCL
Andhra Pradesh
0.504 IRS 0.617 IRS APEPDCL 0.521 IRS 0.638 IRS
APNPDCL 0.513 IRS 0.628 IRS APSPDCL 0.498 IRS 0.610 IRS
Assam PDCL Assam 0.456 DRS 0.558 DRS
BSEB Bihar 0.421 DRS 0.516 DRS CSPDCL Chhattisgarh 0.511 DRS 0.626 DRS
DHBVN Haryana
0.507 IRS 0.621 IRS UHBVN 0.519 IRS 0.636 IRS
DGVCL
Gujarat
1 CRS 1.000 CRS MGVCL 0.612 IRS 0.805 IRS PGVCL 0.603 IRS 0.794 IRS
UGVCL 1 CRS 1.000 CRS HPSEBL Himachal Pradesh 0.412 DRS 0.505 DRS
JSEB Jharkhand 0.431 DRS 0.528 DRS
J & K PDD Jammu and
Kashmir 0.516 DRS 0.632 DRS
BESCOM
Karnataka
0.532 IRS 0.651 IRS CHESCOM 0.531 IRS 0.650 IRS
GESCOM 0.529 IRS 0.648 IRS HESCOM 0.513 IRS 0.628 IRS MESCOM 0.518 IRS 0.634 IRS
KSEB Kerala 0.521 DRS 0.721 DRS MPMKVVCL
Madhya Pradesh
0.495 IRS 0.606 IRS
MP Paschim KVVCL 0.468 IRS 0.573 IRS MP Poor KVVCL 0.436 IRS 0.534 IRS
MSEDCL Maharashtra 0.541 DRS 0.662 DRS
MeECL Meghalaya 0.413 IRS 0.506 IRS PSPCL Punjab 0.503 DRS 0.616 DRS
AVVNL Rajasthan
0.497 IRS 0.609 IRS JVVNL 0.489 IRS 0.599 IRS
JdVVNL 0.476 IRS 0.583 IRS TANGEDCO Tamil Nadu 0.521 DRS 0.806 DRS
TSECL Tripura 0.432 DRS 0.585 DRS
DVVNL
Uttar Pradesh
0.501 IRS 0.614 IRS MVVNL 0.504 IRS 0.617 IRS
PVVNL 0.498 IRS 0.610 IRS PUVVNL 0.456 DRS 0.558 DRS UtPCL Uttarakhand 0.412 DRS 0.505 DRS
WBSEDCL West Bengal 0.519 DRS 0.636 DRS Mean Efficiency Score 0.521 0.638
Privately – Owned Electricity Distribution Utilities
BRPL Delhi
0.631 IRS 0.849 IRS BYPL 0.613 IRS 0.869 IRS
TPDDL 1 CRS 1.000 CRS RInfra
Maharashtra 0.611 DRS 0.793 DRS
BEST 0.632 DRS 0.858 DRS CESCO
Odisha
0.557 IRS 0.723 IRS
NESCO 0.532 IRS 0.690 IRS SOUTHCO 0.529 IRS 0.710 IRS
WESCO 0.543 IRS 0.705 IRS
KESCO Uttar Pradesh 0.523 IRS 0.701 IRS CESC West Bengal 0.521 DRS 0.778 DRS
Mean Efficiency Score 0.608 0.789
As Table 5 only provides results of univariate comparisons, the pooled OLS regression is continued to run in the second stage to control for differences in operating environment. Because the regularity condition in Banker and Natarajan (2008) requires contextual
variables be independent of output variables, the Pearson and Spearman correlation coefficients between outputs and contextual variables is shown in Table 6. The lower triangle of the table shows the Pearson correlation coefficients between outputs and contextual

Khetrapal, International Journal on Emerging Technologies 10(3): 96-113(2019) 109
variables, and the upper triangle of the table shows the Spearman correlation coefficients. It is observed that the correlation coefficients between the variable of interest, Ownership, and the three outputs (Customer, Energy Sold, Distribution Line Length) are close to 0, suggesting that Ownership is almost independent of the three output variables. Thus, the OLS estimator of the coefficient on Ownership has a desirable large sample property of consistency. In addition, Table 6 shows that contextual variables such as Rainfall, Lightning and
Real GDP per capita are only weakly correlated with these three outputs, while Large, Area, and AT & C Loss have much stronger correlation with the three output variables. As a result, the logarithm of DEA inefficiency scores is regressed on Ownership, Rainfall, Lightning and Real GDP per capita using pooled OLS to generate consistent estimators of impact of these four contextual variables. The regression results are presented in Table 7.
Table 5: Average efficiency score of ownership types of distribution utilities in pre – and post - MYT regulation periods.
Period State – owned distribution utilities Privately – owned distribution utilities
Pre – MYT Regulation Implementation (2004 – 2006)
0.521(52.1%) 0.608(60.8%)
Post – MYT Regulation Implementation (2008 - 2016)
0.638 (63.8%) 0.789 (78.9%)
Efficiency Improvement 0.117 (11.7%) 0.181 (18.1%)
Table 6: Correlation Matrix between output and contextual variables.
Customer Electricity
Sold Line
Length Ownership Large
Service Area
Real GDP per
Capita Rainfall Lightning
AT&C Loss
Customer 1 0.985 0.963 -0.015 0.856 0.813 -0.054 -0.356 -0.169 0.468
Electricity Sold
0.934 1 0.889 -0.014 0.852 0.769 0.012 -0.321 -0.079 0.4
Line Length 0.841 0.710 1 -0.048 0.832 0.939 -0.140 -0.350 -0.169 0.451
Ownership -0.048 -0.059 -0.210 1 -0.501 -0.036 0.110 -0.227 0.008 -0.149 Large 0.658 0.612 0.558 -0.050 1 0.720 -0.108 -0.290 -0.096 0.529
Service Area 0.673 0.530 0.921 -0.170 0.495 1 -0.270 -0.341 -0.224 0.428 Real GDP per capita
0.015 0.095 -0.041 0.153 -0.140 -0.158 1 0.096 0.230 -0.340
Rainfall -0.248 -0.120 -0.223 -0.220 -0.280 -0.170 0.120 1 0.660 -0.148
Lightning -0.052 0.098 -0.118 -0.116 -0.106 -0.103 0.135 0.760 1 -0.228
AT&C Loss 0.092 0.043 0.017 -0.290 0.385 0.013 -0.179 0.096 0.114 1
Table 7: Estimation results of regression model.
Variables Predicted
Sign
Dependent Variable Log (Inefficiency)
M1 M2 M3 M4 M5 M6
Incentive H1: (-) -0.052
**
(-2.36)1
-0.052**
(-2.36) 0.051
(1.162) 0.051
(1.162) 0.051
(1.162) 0.051
(1.162)
Ownership -0.241
***
(-2.798) -0.284
***
(-3.232) -0.216
**
(-2.501) -0.255
***
(-2.959) -0.210
**
(-2.490)
Incentive *Ownership H2: (-) -0.144
***
(-2.949) -0.144
***
(-2.950) -0.144
***
(-2.952)
Log (Real GDP per Capita)
0.0051
(0.0503) 0.0070 (1.023)
0.0052 (0.0048)
0.116 (1.102)
0.111 (1.229)
0.0029 (0.0036)
Log (Rainfall) 0.389
***
(3.172)
0.389***
(3.172)
0.759***
(3.454) 0.720
***
(3.301)
Log (Lightning) 0.0460 (1.197)
0.0460 (1.197)
-0.175**
(-2.701) -0.160
**
(-2.501)
Constant -1.812
**
(-2.063) 0.961
***
(4.502) -1.829
**
(-2.083) 0.956
***
(4.454) -4.221
***
(-2.840) -4.010
***
(-2.710)
Observations 676 676 676 676 676 676
R-Squared 0.250 0.187 0.251 0.190 0.293 0.310 (1)
Robust t – statistics in parenthesis ***
p < 0.01 (1% level of significance); **p < 0.05 (5% level of significance);
*p < 0.1 (10% level of significance).
Because the environment variables Rainfall and Lightning are highly correlated (Pearson correlated coefficient = 0.760), columns (1, 3) show the results of average reduction in the pre- and post- MYT regulation period when only Rainfall is included in the regression model and columns (2-4) present the results when only Lightning is included. Columns (1-2) of Table 4 show
that the coefficient estimates on Incentive are both significantly negative at 5% level, indicating that the average inefficiency of Indian electricity distribution utilities was significantly reduced after the implementation of MYT regulation scheme in year 2006 for regulating the distribution utilities. The coefficient estimates on Incentive *Ownership in Columns (3-5) are

Khetrapal, International Journal on Emerging Technologies 10(3): 96-113(2019) 110
-0.144, indicating that compared to state-owned distribution utilities, the operational inefficiency of privately-owned distribution utilities had been significantly reduced in the post-incentive regulation period. In contrast, the coefficient estimates on Incentive in Columns (3-5) become positive but are not significant from 0, suggesting that there was no significant change in operational inefficiency for state-owned distribution utilities in the post implementation of MYT regulation scheme. In other words, the significant efficiency improvement in Columns (1, 2) is mainly driven by the inefficiency reduction of privately owned distribution utilities in India. Overall, the results obtained support the second research hypothesis that privately-owned distribution utilities in India have experienced more efficiency improvement than state - owned distribution utilities after the implementation of MYT regulation scheme for tariff determination. Ownership has an important moderating effect on the relationship between incentive regulation and efficiency improvement. Meanwhile, the coefficient estimates on Private are significantly negative across model specifications,
indicating that privately-owned distribution utilities, on average, operate more efficiently than state-owned utilities, consistent with the results documented in prior studies regarding privatization and operational efficiency [68], [69], [41], [70]. Columns (1), (3), (5) and (6) show that the coefficient estimates on Rainfall are significantly positive at 1% level, suggesting distribution utilities in area with more rainfalls are less efficient. The coefficient estimates on Lightning in Columns (2, 4) are not significantly different from 0, suggesting that Lightning does not have a significant impact on the operational efficiency of distribution utilities. The significantly negative coefficients on Lightning in Columns (5-6) are likely to be caused by the multi-collinearity issue between Rainfall and Lightning. The coefficient estimates on Real GDP per Capita in Columns (1-6) are not significantly different from 0. Further more, the logarithm of DEA inefficiency scores is regressed on Private as well as all the other contextual variables for robustness check. The regression results are presented in Table 8.
Table 8: Results of robustness analysis in pre – and post – era of implementation of MYT regulation scheme for tariff determination.
Variables Predicted Sign
Dependent Variables Log (Inefficiency)
M1 M2 M3
Incentive H1: (-) -0.0503
**
(-2.168) 0.0667 (1.517)
0.0657 (1.490)
Ownership -0.241
***
(-3.238) -0.209
***
(-2.742)
Incentive *Ownership H2: (-) -0.154
***
(-3.028)
Large -0.339
***
(-2.960) -0.342
***
(-2.920) -0.350
***
(-2.758)
Incentive *Large -0.0190 (-0.450)
-0.0170 (-0.360)
Log(Area) -0.270
(-0.480) -0.0268 (-0.475)
-0.0260 (-0.458)
Log (Real GDP per Capita) 0.0160 (1.024)
0.102 (1.299)
0.101 (1.102)
Log (Rainfall) 0.349
*
(1.901) 0.350
*
(1.898) 0.348
*
(1.871)
Log (Lightning) -0.0770 (-1.180)
-0.0764 (-1.177)
-0.0773 (-1.174)
AT & C Loss 0.288
*
(1.980) 0.284
*
(1.989) 0.286
*
(1.975)
Constant -1.208
(-0.970) -1.235
(-0.985) -1.220
(-0.960)
Observations 676 676 676
R-Squared 0.438 0.442 0.457 (1)
Robust t – statistics in parenthesis ***
p < 0.01 (1% level of significance); **p < 0.05 (5% level of significance);
*p <0.1 (10% level of significance)
The coefficient estimates on Large in Columns (1-3) are significantly negative, suggesting the existence of economies of scale in the electricity distribution industry in India, i.e. large distribution utilities are more efficient than small distribution utilities. However, the coefficient estimates on Incentive *Large in Columns (2, 3) are not significantly different from 0, indicating that large distribution utilities did not experience significantly more improvement in operational efficiency compared to small distribution utilities. In addition, because Large is
strongly correlated with the outputs, the coefficient estimates on Large and Incentive *Large are likely to be biased [71]. Similar to these in Table 7, Columns (1-3) in Table 8show that the coefficient estimates on Rainfall are significantly positive at 10% level and the coefficient estimates on Lighting are not significantly different from 0. The coefficient estimates on AT & C Losses are positive significant at 10% level, indicating that distribution utilities in area with more theft of electric power are less efficient. Other contextual variables,

Khetrapal, International Journal on Emerging Technologies 10(3): 96-113(2019) 111
Area and Real GDP per Capita do not have a significant impact on operational efficiency of distribution utilities. As discussed earlier, the present study implemented a simple DEA model with non-decreasing returns to scale in order to estimate the efficient costs for distribution utilities. The basic assumption made is that the simple empirical benchmarking model carries out the theoretical property of the underlying true production function.
Fig. 2. DEA efficiency scores of TANGEDCO from 2004 to 2016.
Fig. 3. DEA efficiency scores of R Infra from 2004 to
2016.
As a result, the estimated efficient costs are extremely tight for large electricity distribution utilities, such as Tamil Nadu Generation and Distribution Corporation Limited (TANGEDCO), R Infra, and Kerala State Electricity Board Limited (KSEBL), which are in fact in the region of decreasing returns to scale (i.e. these utilities have considerable scope for improvements in their efficiencies by downsizing their scale of operations to the optimal scale). The tight performance targets might lead to two completely different behaviours of large distribution utilities. On one hand, a tight performance target may provide the large distribution utilities with strong incentives to improve operational efficiency. On the other hand, the tight performance target may induce large distribution utilities to exert less effort for efficiency improvement once the management in large distribution utilities find that the performance
target is too high to achieve. Figs. 2-4 illustrate the DEA efficiency scores of TANGEDCO, R Infra and KSEBL from 2004 to 2016. The figures reveal that the efficiency scores of TANGEDCO, R Infra, and KSEBL increased after 2010, but the efficiency improvement were not significant. These results suggest that the unrealistic cost targets estimated by non-decreasing returns to scale DEA model are not likely to provide large distribution utilities with strong incentive for efficiency improvement.
Fig. 4. DEA efficiency scores of KSEBL from 2004 to 2016.
VII. CONCLUSIONS
The present study investigated whether MYT regulation with DEA benchmarking motivates electric utilities to improve operational efficiency and whether privatization affects the effectiveness of MYT regulation. Consistent with the predictions of economic theory, the study found that Indian electricity distribution utilities undertaken in the present study have, on average, significantly improved their operational efficiency after the implementation of MYT regulation in 2006. Furthermore, the empirical results indicate that privately-owned distribution utilities have experienced more efficiency improvement than state-owned distribution utilities, consistent with the prediction of economic theory. The empirical findings also reveal that fully vertically integrated utilities (i.e. generation, transmission and distribution (G-T-D) owned by single utility) or partially unbundled utilities (GD-T) can improve technical efficiency of their distribution sector by adjusting the scale of operations towards optimal size. Overall, the empirical results suggest that utilities’ regulatory managers should implement high-powered incentive schemes (e.g., price/revenue cap, yardstick competition) accompanied with DEA benchmarking methods to create strong external incentives for utilities to improve operational efficiency. Furthermore, privatization is one important policy for electricity distribution utilities to be responsive to external regulatory incentives. For the future research, it is interesting to investigate the effect of MYT regulation on other performance measures, such as quality of service, electricity price, financial performance and risk of electricity distribution utilities. Funding: The author doesn't receive any research funds or grant from any organization.

Khetrapal, International Journal on Emerging Technologies 10(3): 96-113(2019) 112
REFERENCES
[1]. Thakur, T., Deshmukh, S. G., Kaushik, S. C. and Kulshrestha, M. (2005). Impact assessment of the Electricity Act 2003 on the Indian power sector. Energy Policy, 33(9): 1187-1198. [2]. Singh, A. (2010). Towards a competitive market for electricity and consumer choice in the Indian power sector. Energy Policy, 38(8): 4196-4208. [3]. Singh, A. (2006). Power sector reform in India: current issues and prospects. Energy Policy, 34(16): 2480-2490. [4]. TERI, (2006). Analysis and compilation of tariff orders, New Delhi. The Energy and Resources Institute, Project Report No. 2006RP23, New Delhi, India. [5]. Shukla, U. & Thampy, A. (2011). Analysis of competition and market power in the wholesale electricity market in India. Energy Policy, 39(5): 2699-2710. [6]. CEA, (2014). Status of implementation of progress of reforms under Electricity Act 2003. Central Electricity Authority, Ministry of Power, Government of India, New Delhi. [7]. Weyman-Jones, T. G. (1991). Productive efficiency in a regulated industry. the area electricity boards of England and Wales. Energy Economics, 13: 116 - 122. [8]. Hjalmarsson, L. & Veiderpass, A. (1992). Efficiency and ownership in Swedish electricity retail distribution. Journal of Productivity Analysis, 3(1-2): 7-23. [9]. Miliotis, P. A. (1992). Data envelopment analysis applied to electricity distribution districts. Journal of the Operational Society, 43(5): 549-555. [10]. Kittlesen, S. A. C. (1993). Stepwise DEA; choosing variables for measuring technical efficiency in Norwegian electricity distribution. Foundation for Research in Economics and Business Administration (SNP), University of Oslo. [11]. Hougaard, J. L. (1994). Productivity analysis of the Danish electricity distribution. Copenhagen: AKF Forlaget. [12]. ESAA (1994). International Performance Measurement for the Australian Electricity Supply Industry 1990-1991. Electricity Supply Association of Australia, Sydney. [13]. Burns, P. & Weyman-Jones, T. (1994). Regulatory incentives, privatisation, and productivity growth in UK electricity distribution. CRI Technical paper 1, London: CIPFA. [14]. Pollitt, M. G. (1995). Ownership and Performance in Electric Utilities: The International Evidence on Privatization and Efficiency. Oxford University Press, Oxford. [15]. Bagdadioglu, N., Price, C. & Weyman-Jones, T. (1996). Efficiency and ownership in electricity distribution: A non-parametric model of the Turkish experience. Energy Economics, 18(1-2): 1-23. [16]. Førsund, F.R. & Kittelsen, S.A.C. (1998). Productivity development of Norwegian electricity distribution utilities. Resource and Energy Economics, 20(3): 207-224. [17]. Goto, M. & Tsutsui, M. (1998). Comparison of productive and cost efficiencies among Japanese and US electric utilities. Omega, 26(2): 177-94. [18]. Zhang, Y. & R. Bartels (1998). The effect of sample size on the mean efficiency in DEA with an application
to electricity distribution in Australia, Sweden and New Zealand. Journal of Productivity Analysis, 9(3): 187-204. [19]. Honkatukia, J. & Sularnaa, P. (1999). Technical Efficiency and Total Productivity in Finnish Electricity Distribution 1996-1998. Helsinki: ETLA. The Research Institute of the Finnish Economy. [20]. Lo, F. Y., Chien, C. F. & Lin, J. T. (2001). A DEA study to evaluate the relative efficiency and investigate the district reorganization of the Taiwan power company. IEEE Transactions on Power Systems, 16(1): 170-178. [21]. Pacudan, R. and de Guzman, E. (2002). Impact of energy efficiency policy to productive efficiency of electricity distribution industry in the Philippines. Energy Economics, 24(1): 41-54. [22]. Resende, M. (2002). Relative efficiency measurement and prospects for yardstick competition in Brazilian electricity distribution. Energy Policy, 30(8): 637–647. [23]. Chen, T. (2002). An assessment of technical efficiency and cross-efficiency in Taiwan’s electricity distribution sector. European Journal of Operational Research, 137(2): 421-433. [24]. Agrell, P. J., Bogetoft, P. & Tind, J. (2002). Incentive plans for productive efficiency, innovation and learning. International Journal of Production Economics, 78(1): 1-11. [25]. Pahwa, A., Feng, X. & Lubkerman, D. (2002). Performance evaluation of electric distribution utilities based on Data Envelopment Analysis. IEEE Transactions on Power Systems, 17(3): 400-405. [26]. Chien, C. F., Lo, F. Y. & Lin, J. T. (2003). Using DEA to measure the relative efficiency of the service center and improve operation efficiency through reorganization. IEEE Transactions on Power Systems, 18(1): 366-373. [27]. Edvardsen, D. F. & Førsund, F. R. (2003). International benchmarking of electricity distribution utilities. Resource and Energy Economics, 25(4): 353- 371. [28]. Korhonen, P. & Syrjänen, M. J. (2003). Evaluation of cost efficiency in Finnish electricity distribution. Annals of Operations Research, 121(1-4): 105-122. [29]. Sanhueza, R., Rudnick, H. & Lagunas, H. (2004). DEA efficiency for the determination of the electric power distribution added value. IEEE Transactions on Power Systems, 19(2): 919-925. [30]. Jamasb, T., Mota, R., Newbery, D. & Pollitt, M. (2004). Electricity sector reform in developing Countries: a Survey of Empirical Evidence on Determinants and Performance. Working Paper 47, Cambridge–MIT Institute (CMI). [31]. Giannakis, D., Jamasb, T. & Pollitt, M. (2005). Benchmarking and incentive regulation of quality of service: an application to the UK electricity distribution networks. Energy Policy, 33(17): 2256-2271. [32]. Abbott, M. (2006). The productivity and efficiency of the Australian electricity supply industry. Energy Economics, 28(4): 44-454. [33]. Yang, C. & Lu, W. M. (2006). Assessing the performance and finding the benchmarks of the electricity distribution districts of Taiwan Power Company. IEEE Transactions on Power Systems, 21(2): 853-861. [34]. Pombo, C. & Taborda, R. (2006). Performance and efficiency in Colombia’s power distribution system:

Khetrapal, International Journal on Emerging Technologies 10(3): 96-113(2019) 113
effects of the 1994 reform. Energy Economics, 28(3): 339-369. [35]. Yu, W., Jamasb, T. & Pollitt, M. (2009). Does weather explain cost and quality performance? An analysis of UK electricity distribution companies. Energy Policy, 37(11): 4177-4188. [36]. Simab, M. & Haghifam, M. R. (2009), DEA efficiency for the benchmarking of Iranian electric distribution utilities. CIRED 2009 - 20th International Conference and Exhibition on Electricity Distribution - Part 1, Prague, Czech Republic, 1–4. [37]. Reyes, P. R. & Tovar, B. (2009). Measuring efficiency and productivity change (PTF) in the Peruvian electricity distribution companies after reforms. Energy Policy, 37(6): 2249–2261. [38]. Pokharel, S. P. & Shrestha, R. (2010). Performance evaluation of electric distribution centers using Data Envelopment Analysis. North American Power Symposium 2010, Arlington, TX, 2010, pp. 1-7. [39]. Jha, D. K., Yorino, N. & Karki, N. J. (2011). Evaluating performance of electricity distribution centers and improving relative operational efficiencies through reorganization: a case of Nepal. International Journal of Emerging Electric Power Systems, 12(2): 1–22. [40]. Ghafouri, A., Fereidunian, A., Lesani, H., Torabi, H. & Kharazmi, P. (2012). Performance evaluation for DNO governance using data envelopment analysis method. Iranian Conference on Smart Grids, Tehran: 1-5. [41]. Celen, A. (2013). Efficiency and productivity (TFP) of the Turkish electricity distribution companies: an application of two-stage (DEA & Tobit) analysis. Energy Policy, 63, 300-310. [42]. Geigal, B. O. (2014). Measuring the efficiency of electricity distribution companies in Iran – Data Envelopment Analysis (DEA) approach. Indian Journal of Scientific Research, 1(1): 45–51. [43]. Trindade, D., Barroso, A. & Machado, V. H. (2015). Project management efficiency of a Portuguese electricity distribution utility using Data Envelopment Analysis. Procedia Computer Science, 64: 674-682. [44]. Mullarkey, S., Caulfield, B., McCormack, S. & Basu, B. (2015). A framework for establishing the technical efficiency of electricity distribution counties (EDC) based on Data Envelopment Analysis. Energy Conversion and Management, 94: 112-123. [45]. Thakur, T. (2005). Benchmarking study for the Indian electric utilities using data envelopment analysis. Proceedings of the 37th Annual North American Power Symposium, 2005, Ames, IA, USA: 545-549. [46]. Meenakumari, R. & Kamaraj, N. (2008). Measurement of relative efficiency of state owned electric utilities in India using Data Envelopment analysis. Modern Applied Science, 2(5): 61–71. [47]. Yadav, V., Padhy, N. P. & Gupta, H. O. (2010). A micro level study of an Indian electric utility for efficiency enhancement. Energy, 35(10): 4053-4063. [48]. Charnes, A., Cooper, W. W. & Rhodes, E. (1978). Measuring the efficiency of decision making units. European Journal of Operational Research, 2(6): 429-444.
[49]. Banker, R. D., Charnes, A. & Cooper, W. W. (1984). Some models for the estimation of technical and scale efficiency in Data Envelopment Analysis. Management Science, 30(9): 1078-1092. [50]. Jamasb, T. & Pollitt, M. (2001). Benchmarking and regulation: international electricity experience. Utilities Policy, 9(3): 107-130. [51]. Haney, A. B. & Pollitt, M. G. (2009). Efficiency analysis of energy networks: An international survey of regulators. Energy Policy, 37(12): 5814-5830. [52]. Hou, P., Ang, B. & Poh, K. (2008). A survey of data envelopment analysis in energy and environmental studies. European Journal of Operational Research, 189(1): 1-18. [53]. Santos, S. P., Amado, C. A. F. & Rosado, J. R. (2011). Formative evaluation of electricity distribution utilities using data envelopment analysis. Journal of the Operational Research Society, 62(7): 1298-1319. [54]. Azadeh, A., Ghaderi, S. F. & Omrani (2009). A deterministic approach for performance assessment and optimization of power distribution units in Iran. Energy Policy, 37(1): 274-280. [55]. Government of India (2017). Report on the performance of the state power utilities for the years 2006-2007 to 2015-16. Power Finance Corporation Limited, New Delhi. [56]. Joskow, P. L. (1997). Restructuring, competition and regulatory reform in the U. S. electricity sector. Journal of Economic Perspectives, 11(3): 119-138. [57]. Joskow, P. (2014). Incentive Regulation in Theory and Practice: Electricity Distribution and Transmission Networks. In N.L. Rose (Eds.), Economic Regulation and Its Reform: What Have We Learned?, Chicago, IL: University of Chicago Press: 291-344. [58]. Laffont, J. & Tirole, J. (1986). Using cost observation to regulate firms. Journal of Political Economy, 94(3): 614-641. [59]. Laffont, J. (1994). The new economics of regulation ten years after. Econometrica, 62(3): 507-537. [60]. Joskow, P. L. (2007). Regulation of Natural Monopolies. In A.M. Polinsky, & S. Shavell (Eds.), Handbook of Law and Economics, 1: 1227-1348. [61]. Ai, C.R. & Sappington, D.E. (2002). The impact of state incentive regulation on the U.S. telecommunication industry. Journal of Regulatory Economics, 22(2): 133-160. [62]. Shleifer, A. (1985). A theory of yardstick competition. The RAND Journal of Economics, 16(3): 319-327. [63]. Laffont, J. & Tirole, J. (1991). Privatization & incentives. Journal of Law Economics and Organization, 7: 84-105. [64]. Boycko, M., Shleifer, A. & Vishny, R. W. (1996). A theory of privatization. Economic Journal, 106(435): 309-319. [65]. Mountain, B. & Littlechild, S. (2010). Comparing electricity distribution network revenues and costs in Wales, Great Britain and Victoria. Energy Policy, 38(10): 5770-5782.
How to cite this article: Khetrapal, P. (2019). A Two – Stage DEA - OLS Approach for Analysing the Impact of Multi - Year Tariff Regulation on the Performance of Indian Electricity Distribution Utilities. International Journal on Emerging Technologies, 10(3): 96-113.