10-1-02 Air and Water Temperature Monitoring Within … Tech Memos/Air_Water Temp Revised.pdf ·...
56
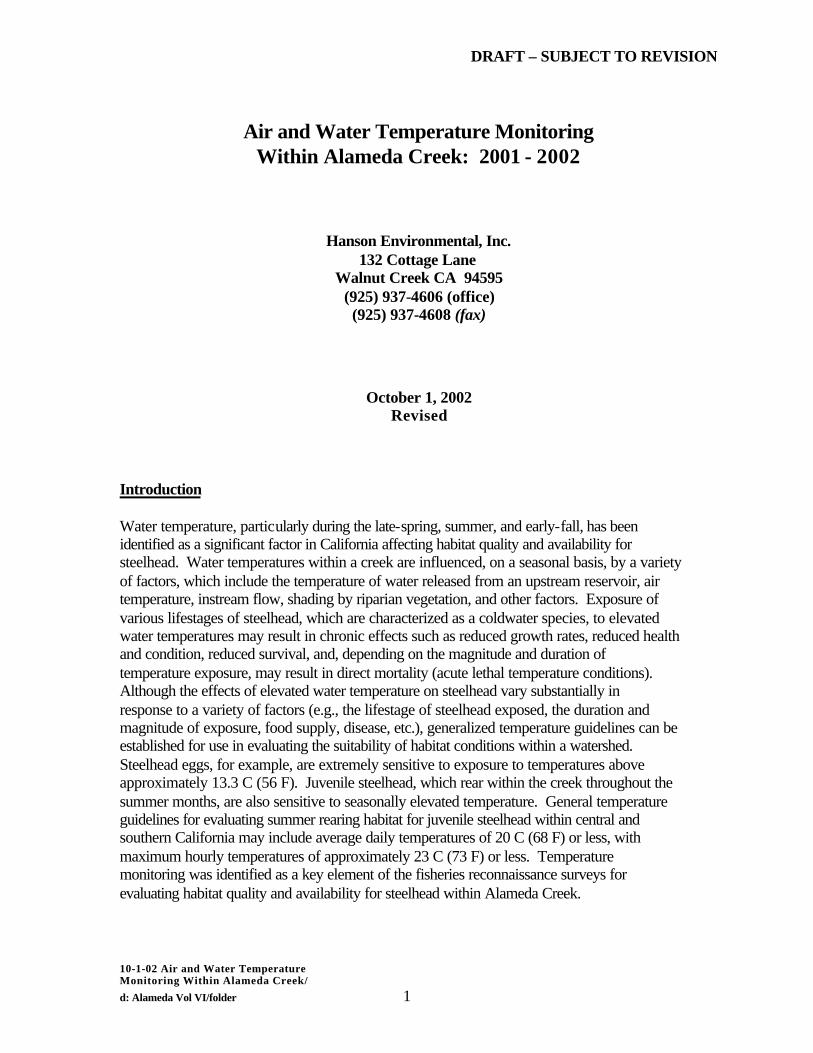
DRAFT – SUBJECT TO REVISION 10-1-02 Air and Water Temperature Monitoring Within Alameda Creek/ d: Alameda Vol VI/folder 1 Air and Water Temperature Monitoring Within Alameda Creek: 2001 - 2002 Hanson Environmental, Inc. 132 Cottage Lane Walnut Creek CA 94595 (925) 937-4606 (office) (925) 937-4608 (fax) October 1, 2002 Revised Introduction Water temperature, particularly during the late-spring, summer, and early-fall, has been identified as a significant factor in California affecting habitat quality and availability for steelhead. Water temperatures within a creek are influenced, on a seasonal basis, by a variety of factors, which include the temperature of water released from an upstream reservoir, air temperature, instream flow, shading by riparian vegetation, and other factors. Exposure of various lifestages of steelhead, which are characterized as a coldwater species, to elevated water temperatures may result in chronic effects such as reduced growth rates, reduced health and condition, reduced survival, and, depending on the magnitude and duration of temperature exposure, may result in direct mortality (acute lethal temperature conditions). Although the effects of elevated water temperature on steelhead vary substantially in response to a variety of factors (e.g., the lifestage of steelhead exposed, the duration and magnitude of exposure, food supply, disease, etc.), generalized temperature guidelines can be established for use in evaluating the suitability of habitat conditions within a watershed. Steelhead eggs, for example, are extremely sensitive to exposure to temperatures above approximately 13.3 C (56 F). Juvenile steelhead, which rear within the creek throughout the summer months, are also sensitive to seasonally elevated temperature. General temperature guidelines for evaluating summer rearing habitat for juvenile steelhead within central and southern California may include average daily temperatures of 20 C (68 F) or less, with maximum hourly temperatures of approximately 23 C (73 F) or less. Temperature monitoring was identified as a key element of the fisheries reconnaissance surveys for evaluating habitat quality and availability for steelhead within Alameda Creek.
Transcript of 10-1-02 Air and Water Temperature Monitoring Within … Tech Memos/Air_Water Temp Revised.pdf ·...
DRAFT – SUBJECT TO REVISION
10-1-02 Air and Water Temperature Monitoring Within Alameda Creek/
d: Alameda Vol VI/folder 1
Air and Water Temperature Monitoring Within Alameda Creek: 2001 - 2002
Hanson Environmental, Inc.
132 Cottage Lane Walnut Creek CA 94595
(925) 937-4606 (office) (925) 937-4608 (fax)
October 1, 2002
Revised Introduction Water temperature, particularly during the late-spring, summer, and early-fall, has been identified as a significant factor in California affecting habitat quality and availability for steelhead. Water temperatures within a creek are influenced, on a seasonal basis, by a variety of factors, which include the temperature of water released from an upstream reservoir, air temperature, instream flow, shading by riparian vegetation, and other factors. Exposure of various lifestages of steelhead, which are characterized as a coldwater species, to elevated water temperatures may result in chronic effects such as reduced growth rates, reduced health and condition, reduced survival, and, depending on the magnitude and duration of temperature exposure, may result in direct mortality (acute lethal temperature conditions). Although the effects of elevated water temperature on steelhead vary substantially in response to a variety of factors (e.g., the lifestage of steelhead exposed, the duration and magnitude of exposure, food supply, disease, etc.), generalized temperature guidelines can be established for use in evaluating the suitability of habitat conditions within a watershed. Steelhead eggs, for example, are extremely sensitive to exposure to temperatures above approximately 13.3 C (56 F). Juvenile steelhead, which rear within the creek throughout the summer months, are also sensitive to seasonally elevated temperature. General temperature guidelines for evaluating summer rearing habitat for juvenile steelhead within central and southern California may include average daily temperatures of 20 C (68 F) or less, with maximum hourly temperatures of approximately 23 C (73 F) or less. Temperature monitoring was identified as a key element of the fisheries reconnaissance surveys for evaluating habitat quality and availability for steelhead within Alameda Creek.
DRAFT – SUBJECT TO REVISION
10-1-02 Air and Water Temperature Monitoring Within Alameda Creek/
d: Alameda Vol VI/folder 2
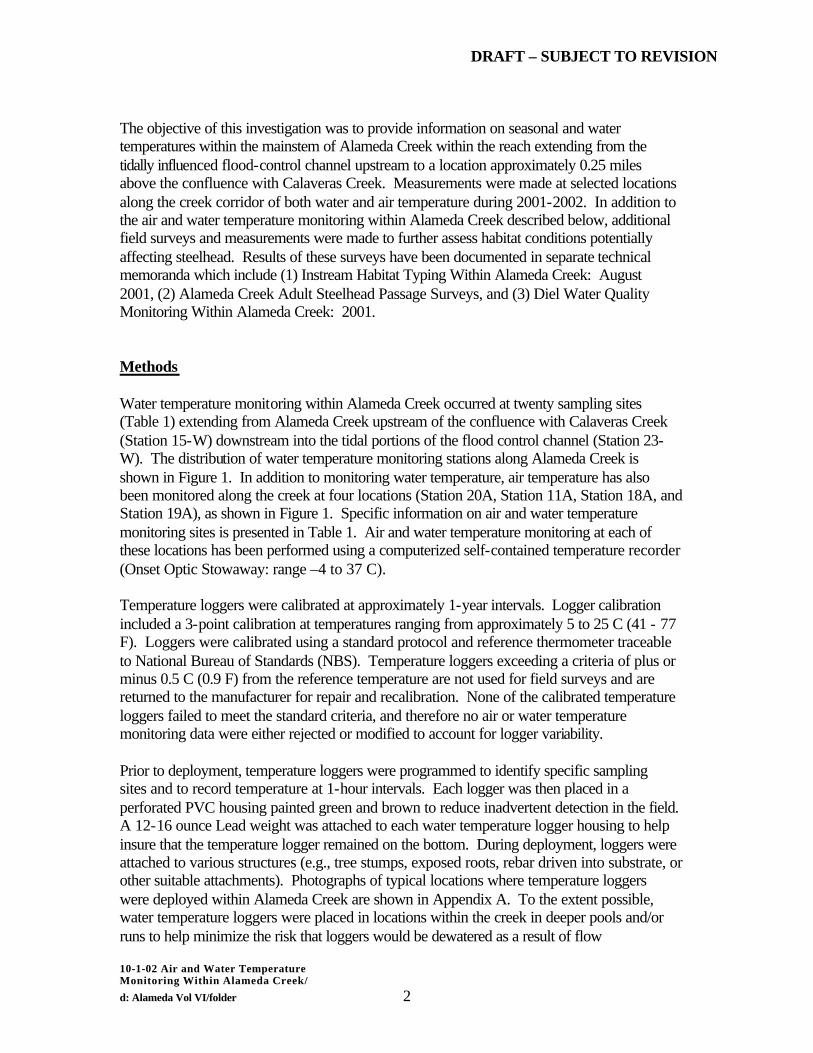
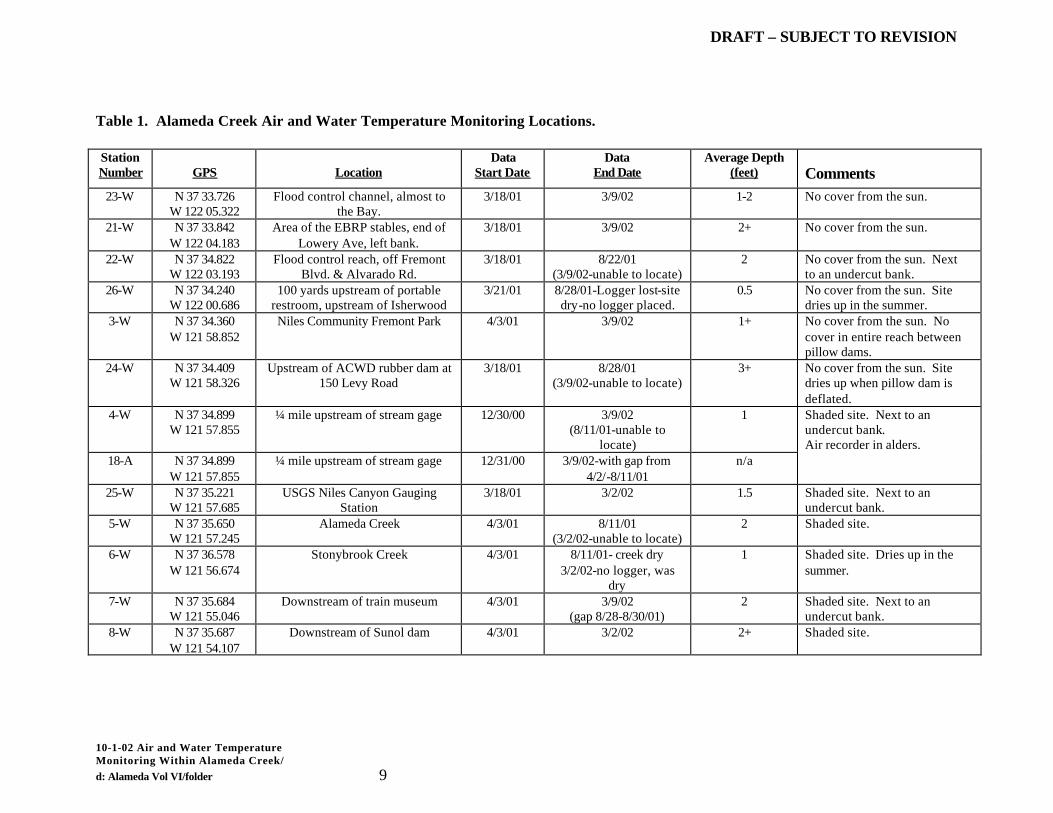
The objective of this investigation was to provide information on seasonal and water temperatures within the mainstem of Alameda Creek within the reach extending from the tidally influenced flood-control channel upstream to a location approximately 0.25 miles above the confluence with Calaveras Creek. Measurements were made at selected locations along the creek corridor of both water and air temperature during 2001-2002. In addition to the air and water temperature monitoring within Alameda Creek described below, additional field surveys and measurements were made to further assess habitat conditions potentially affecting steelhead. Results of these surveys have been documented in separate technical memoranda which include (1) Instream Habitat Typing Within Alameda Creek: August 2001, (2) Alameda Creek Adult Steelhead Passage Surveys, and (3) Diel Water Quality Monitoring Within Alameda Creek: 2001. Methods Water temperature monitoring within Alameda Creek occurred at twenty sampling sites (Table 1) extending from Alameda Creek upstream of the confluence with Calaveras Creek (Station 15-W) downstream into the tidal portions of the flood control channel (Station 23-W). The distribution of water temperature monitoring stations along Alameda Creek is shown in Figure 1. In addition to monitoring water temperature, air temperature has also been monitored along the creek at four locations (Station 20A, Station 11A, Station 18A, and Station 19A), as shown in Figure 1. Specific information on air and water temperature monitoring sites is presented in Table 1. Air and water temperature monitoring at each of these locations has been performed using a computerized self-contained temperature recorder (Onset Optic Stowaway: range –4 to 37 C). Temperature loggers were calibrated at approximately 1-year intervals. Logger calibration included a 3-point calibration at temperatures ranging from approximately 5 to 25 C (41 - 77 F). Loggers were calibrated using a standard protocol and reference thermometer traceable to National Bureau of Standards (NBS). Temperature loggers exceeding a criteria of plus or minus 0.5 C (0.9 F) from the reference temperature are not used for field surveys and are returned to the manufacturer for repair and recalibration. None of the calibrated temperature loggers failed to meet the standard criteria, and therefore no air or water temperature monitoring data were either rejected or modified to account for logger variability. Prior to deployment, temperature loggers were programmed to identify specific sampling sites and to record temperature at 1-hour intervals. Each logger was then placed in a perforated PVC housing painted green and brown to reduce inadvertent detection in the field. A 12-16 ounce Lead weight was attached to each water temperature logger housing to help insure that the temperature logger remained on the bottom. During deployment, loggers were attached to various structures (e.g., tree stumps, exposed roots, rebar driven into substrate, or other suitable attachments). Photographs of typical locations where temperature loggers were deployed within Alameda Creek are shown in Appendix A. To the extent possible, water temperature loggers were placed in locations within the creek in deeper pools and/or runs to help minimize the risk that loggers would be dewatered as a result of flow

DRAFT – SUBJECT TO REVISION
10-1-02 Air and Water Temperature Monitoring Within Alameda Creek/
d: Alameda Vol VI/folder 3
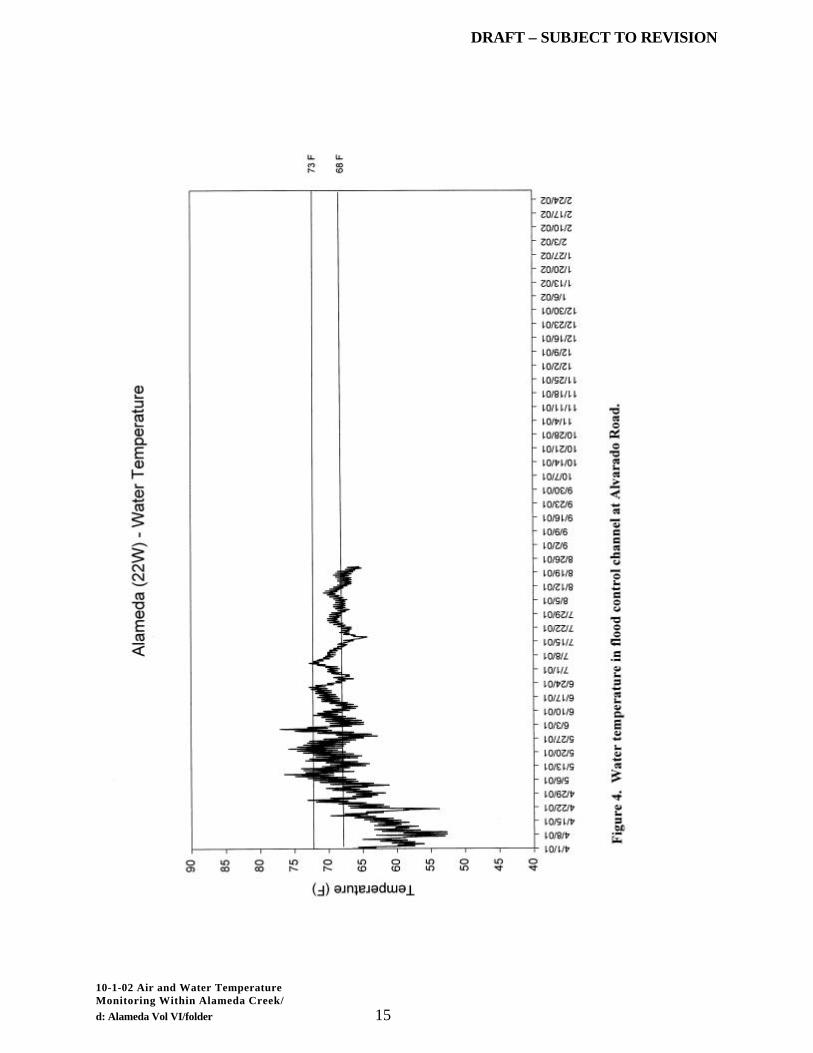
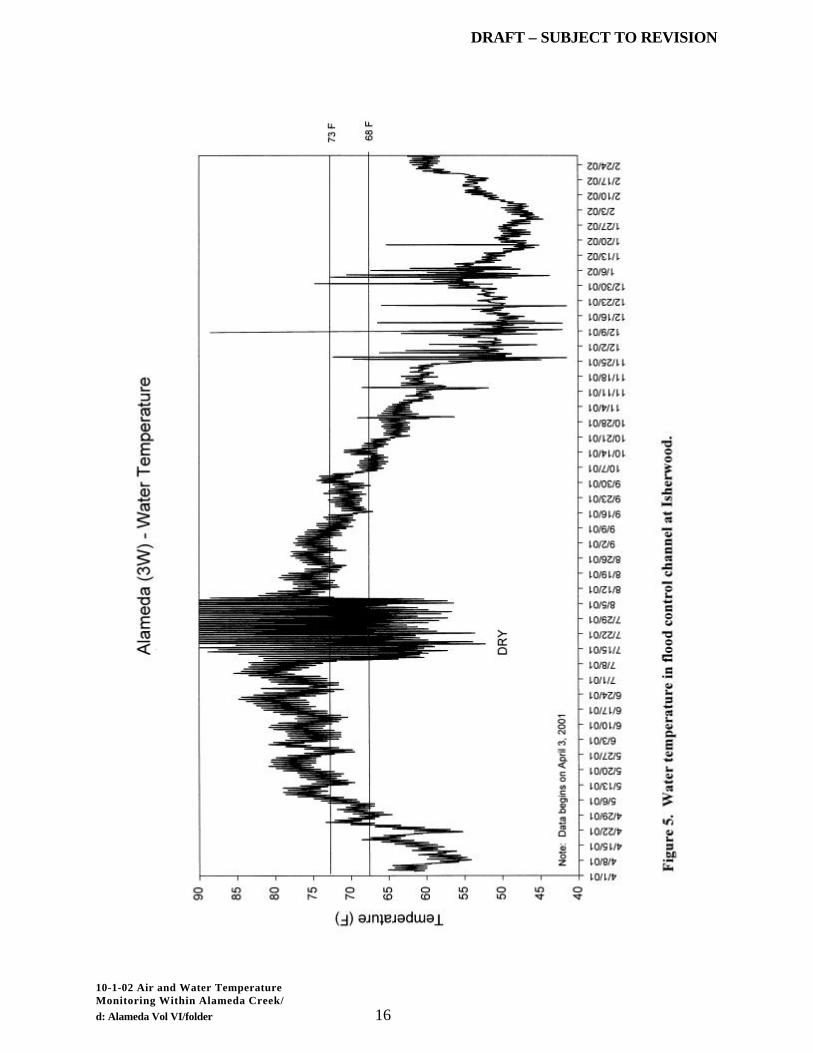
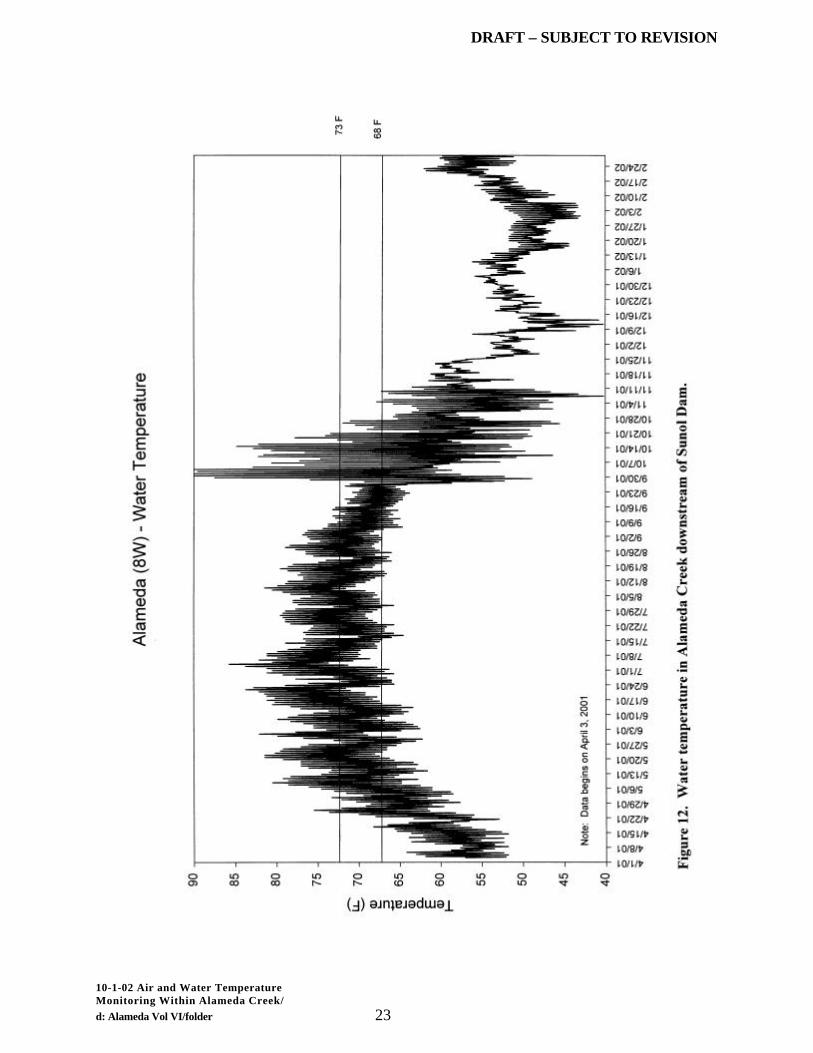
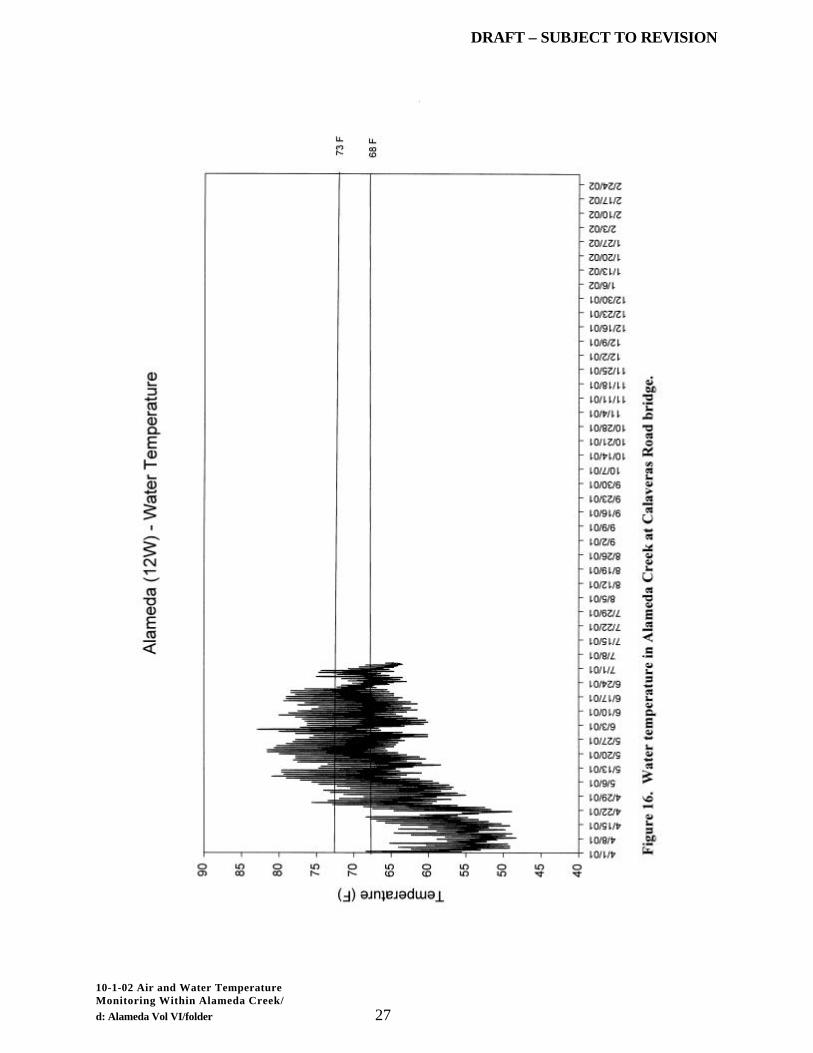
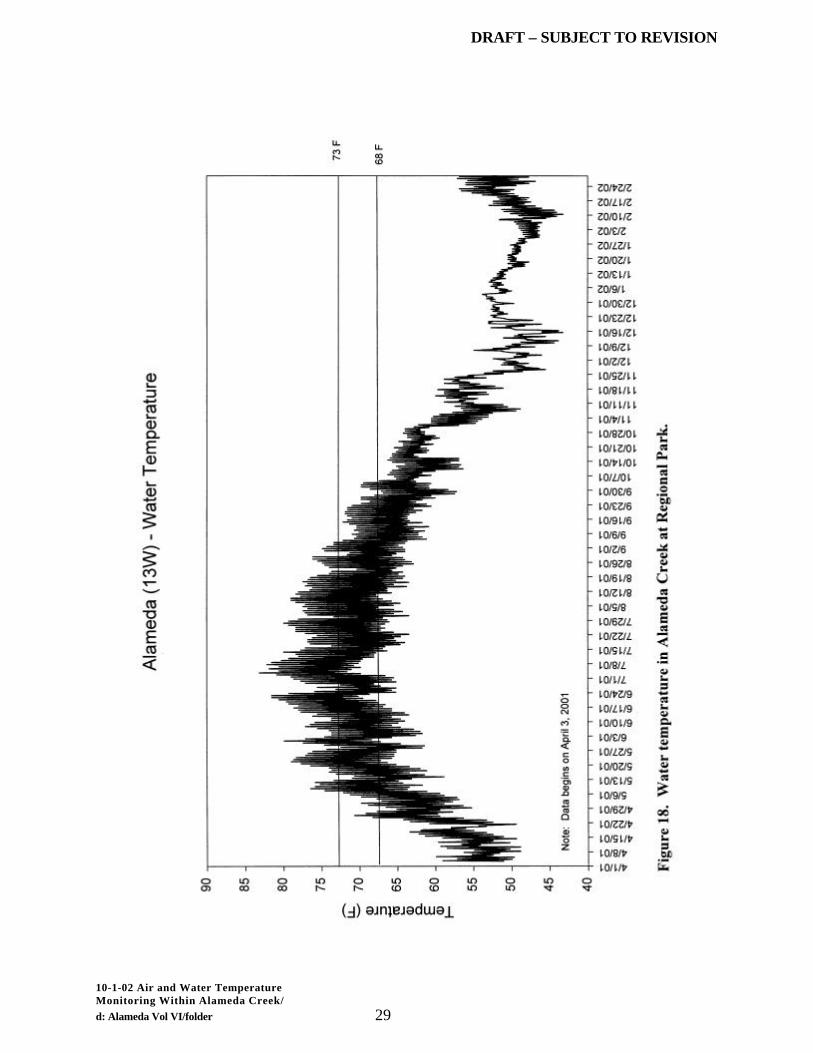
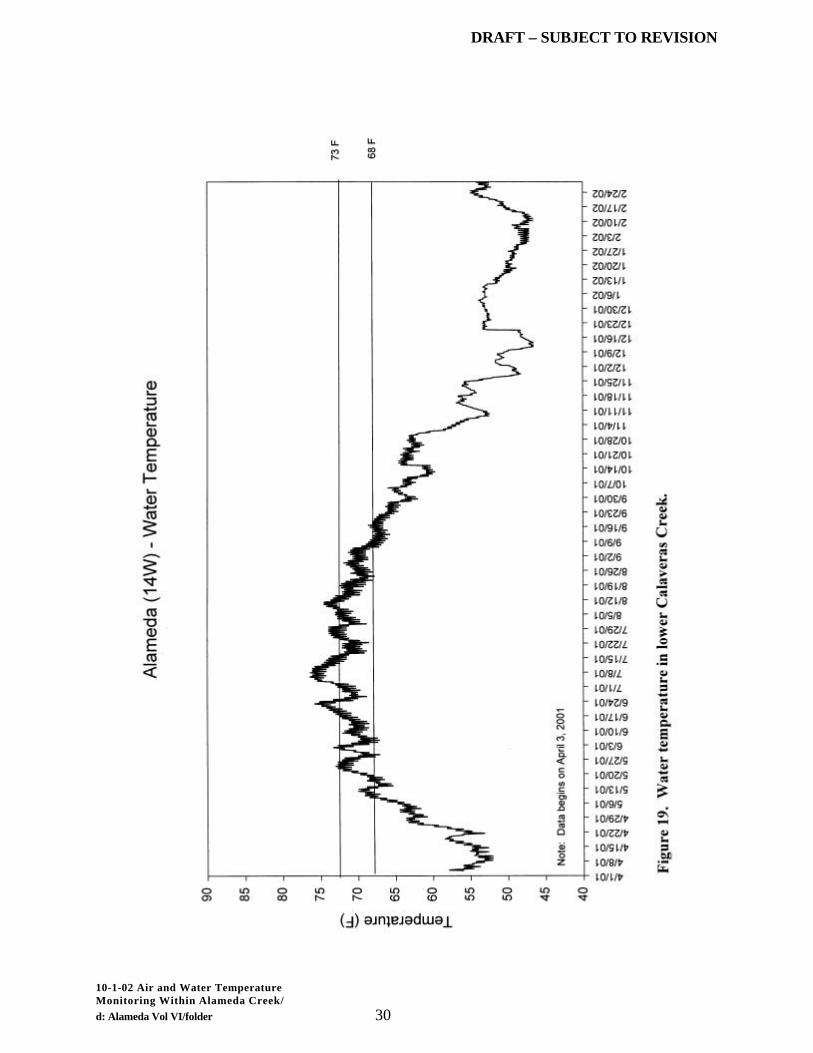
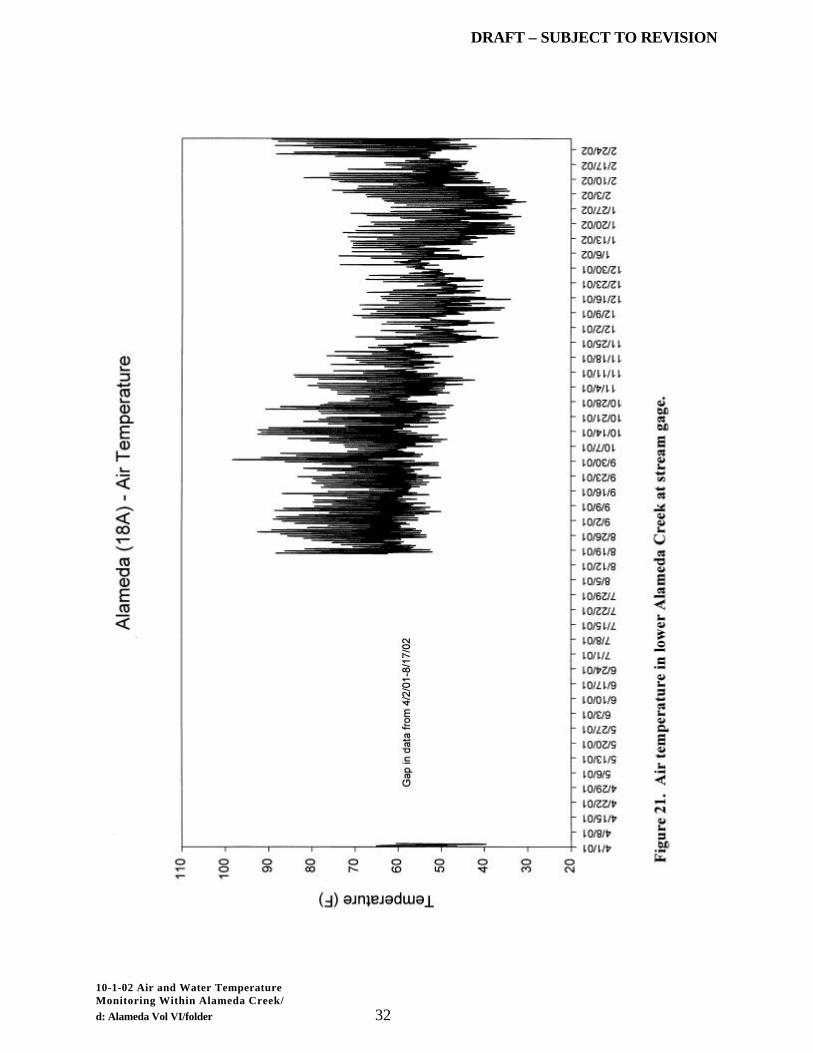
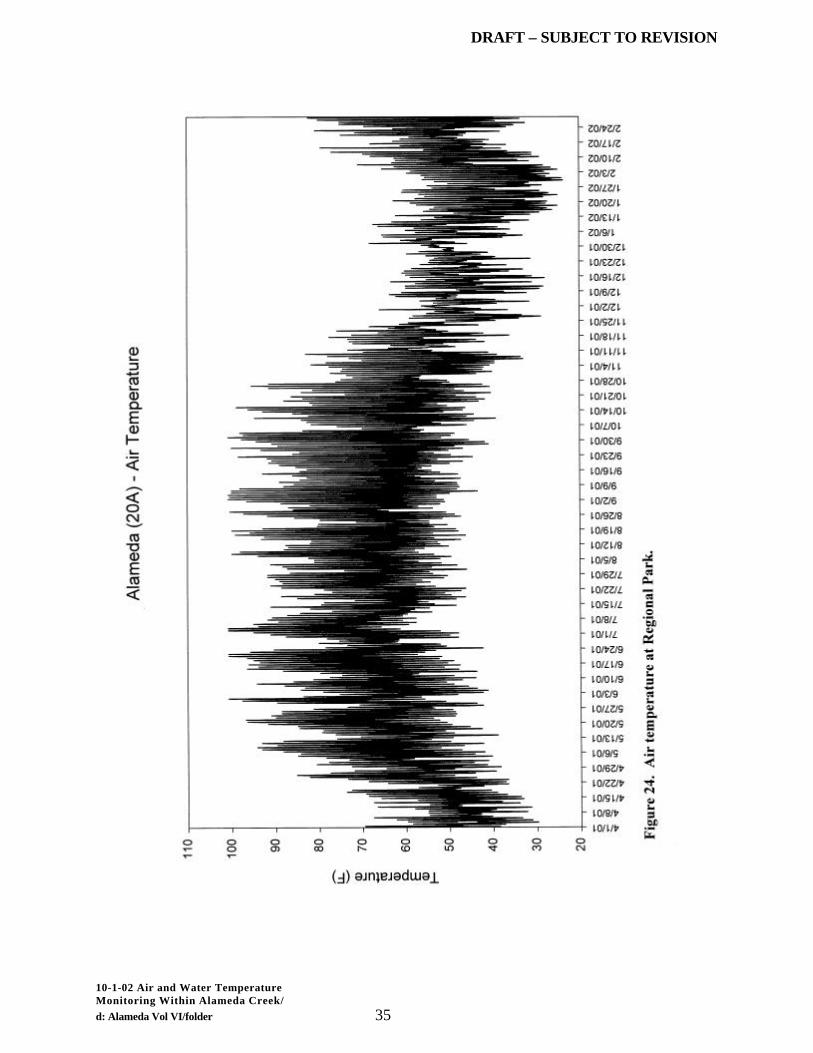
fluctuations. Despite these precautions, water temperature monitoring results for several locations identified temperature patterns characteristic of loggers being dewater, which has been noted in the attached results. Information on logger placement, GPS coordinates, dewatered loggers, missing loggers, and other information are also recorded at the time of logger deployment and logger retrieval. Temperature loggers were retrieved at periodic intervals and data downloaded to temperature files for each individual station using computer software provided by the manufacturer. Air and water temperature data were subsequently input into a computer graphics program (Sigmaplot) for display. To facilitate display and comparison of temperature monitoring results from one sampling site to another, temperature graphs have been standardized. Water temperature monitoring results are presented consistently for each sampling location on a scale ranging from 40-90 F over the period from April 1, 2001 through February 28, 2002. To provide general guidelines for the interpretation of water temperature monitoring results with respect to suitability for juvenile steelhead rearing, temperatures of 68 F (20 C) and 73 F (23 C) have been noted on each graph. Results Results of water temperature monitoring within Alameda Creek are shown for various station locations in Figures 2–20 moving from downstream to upstream locations. Air temperature measurements are shown in Figures 21-24. Results of water temperature monitoring within Alameda Creek showed a characteristic seasonal pattern of declining temperatures during the fall and winter, followed by increasing temperatures throughout the spring and summer. Temperatures observed within the creek during late May through August 2001 frequently exceeded 68 F, with peak daily temperatures frequently exceeding 73 F. Summer temperatures exceeding approximately 68 F are generally thought to result in stressful juvenile rearing conditions. Water temperatures exceeding approximately 73 F are generally thought to result in unacceptable habitat conditions for juvenile steelhead rearing. Discussion Air and water temperature monitoring was conducted between spring 2001 and winter 2002 at selected locations along the Alameda Creek corridor extending from upstream of the confluence with Calaveras Creek downstream to the tidally influenced flood-control section near the confluence with San Francisco Bay. Water temperatures measured within the creek (Figures 2-20) reflect actual meteorological, hydrologic, and water supply operations occurring during the monitoring period. Hydrologic conditions occurring within the Alameda Creek watershed, as characterized by precipitation, were below the long-term average in 2001. Variation in instream flow rates within and among years would be expected to influence water temperature conditions within various reaches of Alameda Creek which could not be characterized given the limited data available from the study.

DRAFT – SUBJECT TO REVISION
10-1-02 Air and Water Temperature Monitoring Within Alameda Creek/
d: Alameda Vol VI/folder 4
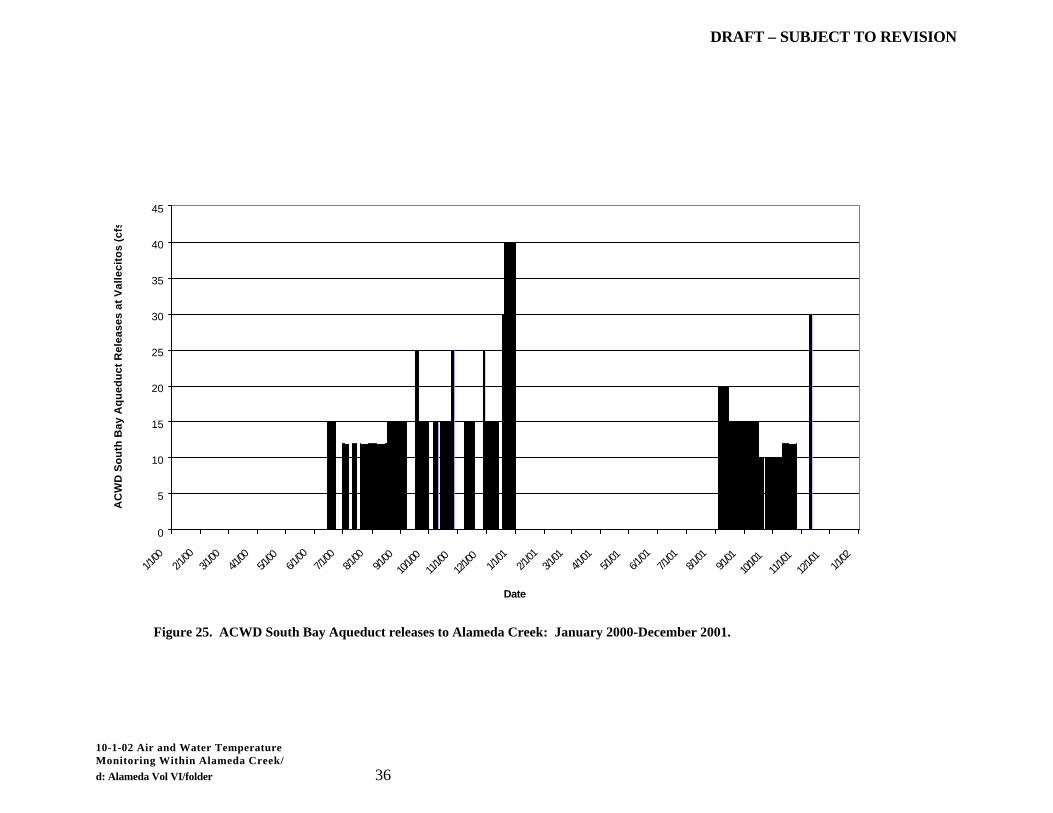
In addition, inter- and intra-annual variability in ambient air temperatures also represent a significant factor affecting water temperature within a creek. Impoundments and water supply operations may also influence water temperature conditions within various reaches of the creek. For example, variation in the magnitude and water temperature of releases from impoundments, such as Calaveras Reservoir, would be expected to influence water temperatures within various reaches of Alameda Creek. However, evaluation of these relationships was beyond the scope of this investigation. The Alameda County Water District (ACWD) obtains water from the South Bay aqueduct for release at Vallecitos into Alameda Creek. It has been hypothesized that the release of water from the South Bay aqueduct may affect water temperature within the creek downstream of the point of release. To investigate the potential effects of South Bay aqueduct operations on water temperatures within Alameda Creek, operational records were obtained from ACWD on the daily releases (cfs) into Alameda Creek at Vallecitos during 2000 and 2001. Figure 25 shows the seasonal pattern and magnitude of water releases from the South Bay aqueduct into Alameda Creek. Based upon the observed release patterns, water temperature records were reviewed for sampling stations located both upstream and downstream of the point of release during the late summer months (August-October) in 2001, representing the period of greatest releases of water into the creek. A variety of factors influence water temperature conditions within Alameda Creek including the effects of tributary inflows, riparian shading, instream flows, and air temperatures. Examination of the available temperature monitoring data showed differences in both absolute temperature and diel variation in temperature among sampling sites, however no apparent pattern or trend was detected in water temperature that could be directly attributable to releases from the South Bay aqueduct into Alameda Creek. Stream flow data from USGS gages within the Alameda Creek watershed are shown in Figures 26-30. Stream flows in the upper portion of the watershed generally increased progressively between the confluence with Calaveras Creek (Figure 26) and upstream of Sunol Dam (Figure 28). Stream flow within Arroyo de la Laguna (Figure 29) represented a major contribution to the flows observed within Alameda Creek in Niles Canyon (Figure 30). Water temperatures within the lower reach of Arroyo de la Laguna (Figure 13) were within the range considered to be stressful or unsuitable for juvenile steelhead rearing throughout much of the summer, and therefore had a relatively strong influence on temperature conditions within Alameda Creek within the Niles Canyon reach. Water temperatures measured upstream of the confluence with Arroyo De La Laguna at the Highway 680 overcrossing (Figure 14) were also within the range considered to be stressful or unsuitable. Water impoundments, such as Sunol Dam and USGS Niles gage station, created relatively large open water areas exposed to solar radiation which, in addition to the contribution of Arroyo de la Laguna, contributed to the observed pattern of summer water temperatures within the Niles Canyon reach of Alameda Creek. Based on results of water temperature monitoring within Alameda Creek during 2001-2002, a question arose regarding the potential occurrence of deeper pool habitat where vertical stratification of water temperatures may provide cold-water refuges suitable as
DRAFT – SUBJECT TO REVISION
10-1-02 Air and Water Temperature Monitoring Within Alameda Creek/
d: Alameda Vol VI/folder 5
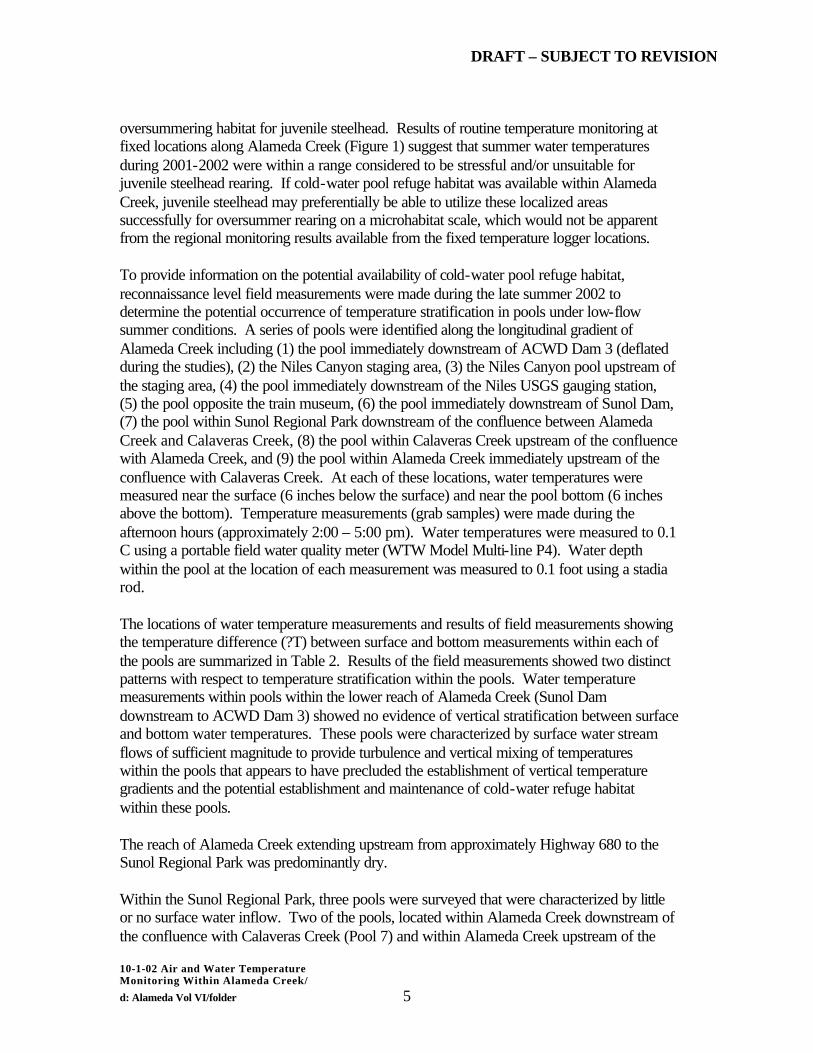
oversummering habitat for juvenile steelhead. Results of routine temperature monitoring at fixed locations along Alameda Creek (Figure 1) suggest that summer water temperatures during 2001-2002 were within a range considered to be stressful and/or unsuitable for juvenile steelhead rearing. If cold-water pool refuge habitat was available within Alameda Creek, juvenile steelhead may preferentially be able to utilize these localized areas successfully for oversummer rearing on a microhabitat scale, which would not be apparent from the regional monitoring results available from the fixed temperature logger locations. To provide information on the potential availability of cold-water pool refuge habitat, reconnaissance level field measurements were made during the late summer 2002 to determine the potential occurrence of temperature stratification in pools under low-flow summer conditions. A series of pools were identified along the longitudinal gradient of Alameda Creek including (1) the pool immediately downstream of ACWD Dam 3 (deflated during the studies), (2) the Niles Canyon staging area, (3) the Niles Canyon pool upstream of the staging area, (4) the pool immediately downstream of the Niles USGS gauging station, (5) the pool opposite the train museum, (6) the pool immediately downstream of Sunol Dam, (7) the pool within Sunol Regional Park downstream of the confluence between Alameda Creek and Calaveras Creek, (8) the pool within Calaveras Creek upstream of the confluence with Alameda Creek, and (9) the pool within Alameda Creek immediately upstream of the confluence with Calaveras Creek. At each of these locations, water temperatures were measured near the surface (6 inches below the surface) and near the pool bottom (6 inches above the bottom). Temperature measurements (grab samples) were made during the afternoon hours (approximately 2:00 – 5:00 pm). Water temperatures were measured to 0.1 C using a portable field water quality meter (WTW Model Multi-line P4). Water depth within the pool at the location of each measurement was measured to 0.1 foot using a stadia rod. The locations of water temperature measurements and results of field measurements showing the temperature difference (?T) between surface and bottom measurements within each of the pools are summarized in Table 2. Results of the field measurements showed two distinct patterns with respect to temperature stratification within the pools. Water temperature measurements within pools within the lower reach of Alameda Creek (Sunol Dam downstream to ACWD Dam 3) showed no evidence of vertical stratification between surface and bottom water temperatures. These pools were characterized by surface water stream flows of sufficient magnitude to provide turbulence and vertical mixing of temperatures within the pools that appears to have precluded the establishment of vertical temperature gradients and the potential establishment and maintenance of cold-water refuge habitat within these pools. The reach of Alameda Creek extending upstream from approximately Highway 680 to the Sunol Regional Park was predominantly dry. Within the Sunol Regional Park, three pools were surveyed that were characterized by little or no surface water inflow. Two of the pools, located within Alameda Creek downstream of the confluence with Calaveras Creek (Pool 7) and within Alameda Creek upstream of the

DRAFT – SUBJECT TO REVISION
10-1-02 Air and Water Temperature Monitoring Within Alameda Creek/
d: Alameda Vol VI/folder 6
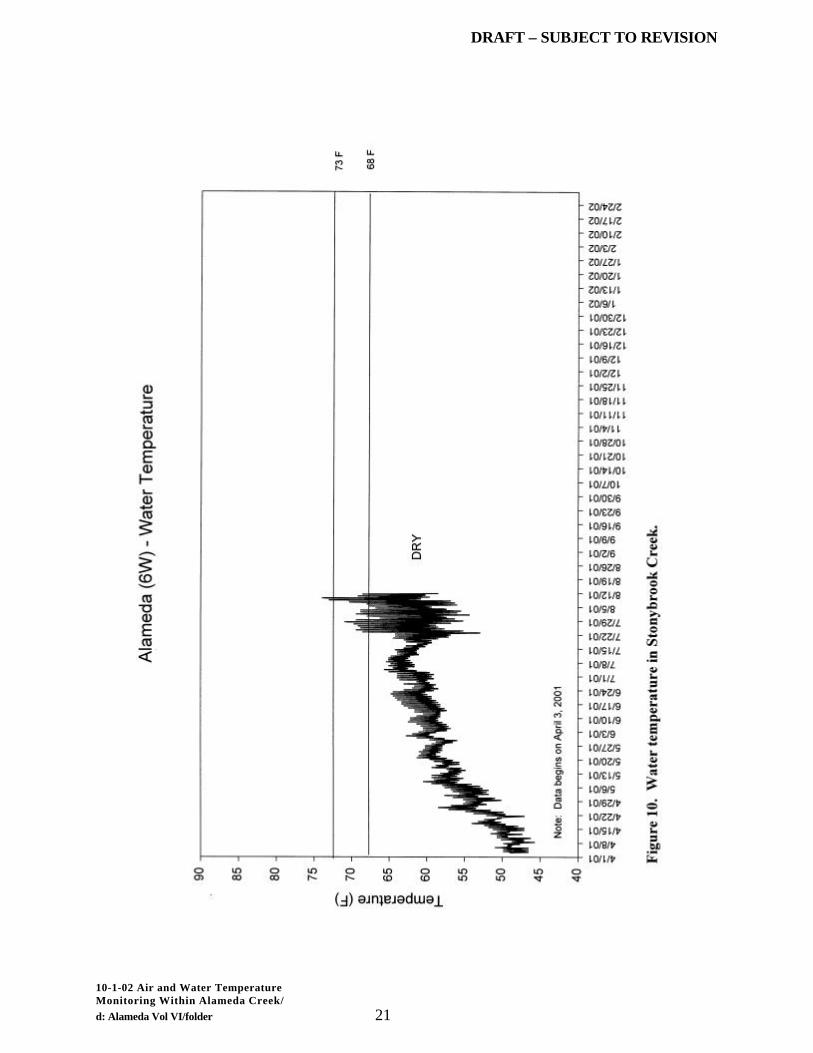
confluence with Calaveras Creek (Pool 9), had very low surface water inflow and outflow. The pool on Calaveras Creek was isolated, lacking surface water continuity with other habitats upstream and downstream of the pool. Water temperatures within these largely static pools were characterized by reduced temperatures near the bottom. Bottom temperatures ranged from 0.9 to 2.1 C lower than surface temperatures within the three pools (Table 2). Water temperatures near the bottom of these three pools were within a temperature range that would be considered to be suitable for juvenile steelhead oversummering. Although there was evidence in each of the three pools of vertical stratification, the pool area was relatively small and would provide limited physical habitat space for juvenile steelhead rearing under conditions occurring during the summer 2002. The estimated surface area of the three pools monitored during this survey were: Alameda Creek pool downstream of the confluence with Calaveras Creek - 3000 square feet, Calaveras Creek pool - 3500 square feet, and Alameda Creek pool upstream of the confluence of Calaveras Creek – 450 square feet. Results of these field observations of vertical temperature stratification within pools along the Alameda Creek corridor suggests that water temperature stratification does occur and would provide potentially suitable oversummering habitat for juvenile steelhead within pools characterized by relatively deep water depths (pool depth ranged from 2.3 to 5.5 feet) and little or no surface inflow during the summer months. No estimate of the carrying capacity for juvenile steelhead rearing was made, however, within these pools as part of this reconnaissance level investigation. Depressed dissolved oxygen concentrations (diel fluctuations) may affect habitat conditions within these isolated pools, but was not monitored as part of this reconnaissance survey. Within pools characterized by higher inflow (e.g., pools 1-6; Table 2), water velocities and turbulent mixing appear to be sufficient to disrupt and eliminate vertical stratification in temperatures within the pools where there was no evidence of cold-water refuge habitat within these areas under the conditions observed during 2002. Results of water temperature monitoring within the mainstem of Alameda Creek were characterized by seasonally increased temperatures during the late spring, summer, and early fall, reaching or exceeding temperature conditions considered to be stressful and/or unsuitable for juvenile steelhead oversummering. Although there was variation observed in water temperature conditions within the mainstem creek among stations, which may reflect in part factors such as groundwater accretions, localized pools and shading, and other factors, a generally consistent pattern was apparent throughout the reach from approximately the confluence with Calaveras Creek downstream to the flood-control section. Water temperature monitoring within Stonybrook Creek (Station 6-W; Figure 10) showed that water temperatures were within the range considered to be suitable for juvenile steelhead rearing through approximately mid-July, however, Stonybrook Creek had no surface flow during the late summer. Had steelhead successfully spawned within Stonybrook Creek, juvenile steelhead would have had to move downstream during the late spring and summer as flows receded within the creek, moving into an area of the mainstem Alameda Creek within

DRAFT – SUBJECT TO REVISION
10-1-02 Air and Water Temperature Monitoring Within Alameda Creek/
d: Alameda Vol VI/folder 7
the Niles Canyon reach where summer temperatures observed during 2001 (Figures 6-12) were within the range considered to be stressful or unsuitable for juvenile rearing. Water temperatures monitored in Alameda Creek immediately upstream of the confluence with Calaveras Creek (Figure 20) suggest that potentially suitable habitat for juvenile steelhead summer rearing may occur further upstream within Alameda Creek (e.g., within the area of Little Yosemite). Water temperature monitoring results observed during the summer 2001 are consistent with information on the distribution of resident trout within the mainstem of Alameda Creek (T. Taylor, pers. comm. 2002) in suggesting that potentially suitable summer rearing habitat for juvenile steelhead may be limited to the upstream reaches of the mainstem creek, and potentially in upstream tributaries. Additional temperature monitoring is being conducted during the summer 2002, on behalf of Alameda County Zone 7 Water Agency, to provide further information on water temperatures and potential suitability of habitat for juvenile steelhead summer rearing within portions of Arroyo Mocho and Arroyo del Valle. Water temperature monitoring within Alameda Creek was conducted, where possible, in deeper pools and run habitat that would potentially provide summer rearing habitat for juvenile steelhead. Within several reaches of the creek, low-flow summer conditions resulted in very shallow conditions (e.g., water depths of 6 inches or less) and several loggers, including those in tributaries (e.g., Welsh Creek, Stonybrook Creek) were dewatered during summer months. In addition, temperature loggers within the tidally influenced section of the Alameda Creek flood-control channel (Stations 23-W and 21-W; Figures 2 and 3) experienced tidal variation in surface water elevation which exposed mudflats over a substantial portion of the channel cross-section at low tide (particularly Station 21-W) and may have, therefore, been influenced by air temperature. Water temperature monitoring within the Niles Canyon Reach, extending from Sunol Dam (Station 8-W) downstream to the ACWD rubber dams (Stations 24-W and 3 W) were all located in deeper pools or run habitats that provided reliable water temperature monitoring throughout the summer 2001. Water temperature loggers within the upper reach of the creek (e.g., Sunol Regional Park, Calaveras Creek, and upstream of Calaveras Creek (Figures 18-20)) were located in areas that would have potentially provided summer rearing habitat conditions for juvenile steelhead. Summer water temperatures at these sites were within a range thought to be stressful and/or unsuitable for juvenile steelhead. Results of the water temperature monitoring at stations located throughout the mainstem of Alameda Creek showed a consistent pattern of summer temperatures within the range considered to be stressful and/or unsuitable for juvenile steelhead rearing during the summer 2001. The consistency of these results suggests that under environmental conditions similar to those that occurred during the summer 2001, potentially suitable habitat for steelhead rearing may have been limited to areas further upstream within the watershed that were not included as part of this investigation. In addition, there may be small-scale microhabitat temperature refugia within deeper pools along portions of the mainstem of Alameda Creek (e.g., areas where groundwater accretions may provide suitable conditions during summer months that would not have been detected by water temperature monitoring at the fixed

DRAFT – SUBJECT TO REVISION
10-1-02 Air and Water Temperature Monitoring Within Alameda Creek/
d: Alameda Vol VI/folder 8
sampling locations selected for this survey). Water temperature monitoring within the reach of Alameda Creek upstream of the confluence with Calaveras Creek and surveys to determine the potential presence of cold water microhabitat refugia within deeper pools would provide additional information on the potential occurrence, aerial extent, and geographic distribution of habitat suitable for juvenile steelhead summer rearing within the mainstem Alameda Creek. Air and water temperature monitoring is continuing to occur within the mainstem of Alameda Creek throughout the spring, summer, and fall 2002. Water temperature is being monitored at hourly intervals at the mainstem sampling locations (Figure 1; Table 1) as monitored during 2001. Air temperature monitoring is also continuing to occur to provide additional information on seasonal patterns and intra-annual variability in temperatures along Alameda Creek. The temperature monitoring program has been expanded to include additional monitoring locations within the Little Yosemite reach (Stations 16-W and 17-W) of Alameda Creek upstream of Station 15-W (Figure 1; Table 1). Results of the 2002 air and water temperature monitoring investigation will be documented in a supplemental technical memorandum anticipated to be available in early 2003. Acknowledgements Financial support for the 2001-2002 air and water temperature monitoring studies within Alameda Creek was provided by the Alameda County Water District (ACWD). We would like to thank the staff of ACWD for their support throughout this project. The San Francisco Public Utility Commission (SFPUC) and East Bay Regional Parks District (EBRPD) provided access to various portions of Alameda Creek for these surveys. Jeff Hagar (Hagar Environmental Science) and Gary Stern (National Marine Fisheries Service) provided helpful comments on an earlier draft of this technical memorandum.
DRAFT – SUBJECT TO REVISION
10-1-02 Air and Water Temperature Monitoring Within Alameda Creek/ d: Alameda Vol VI/folder 9
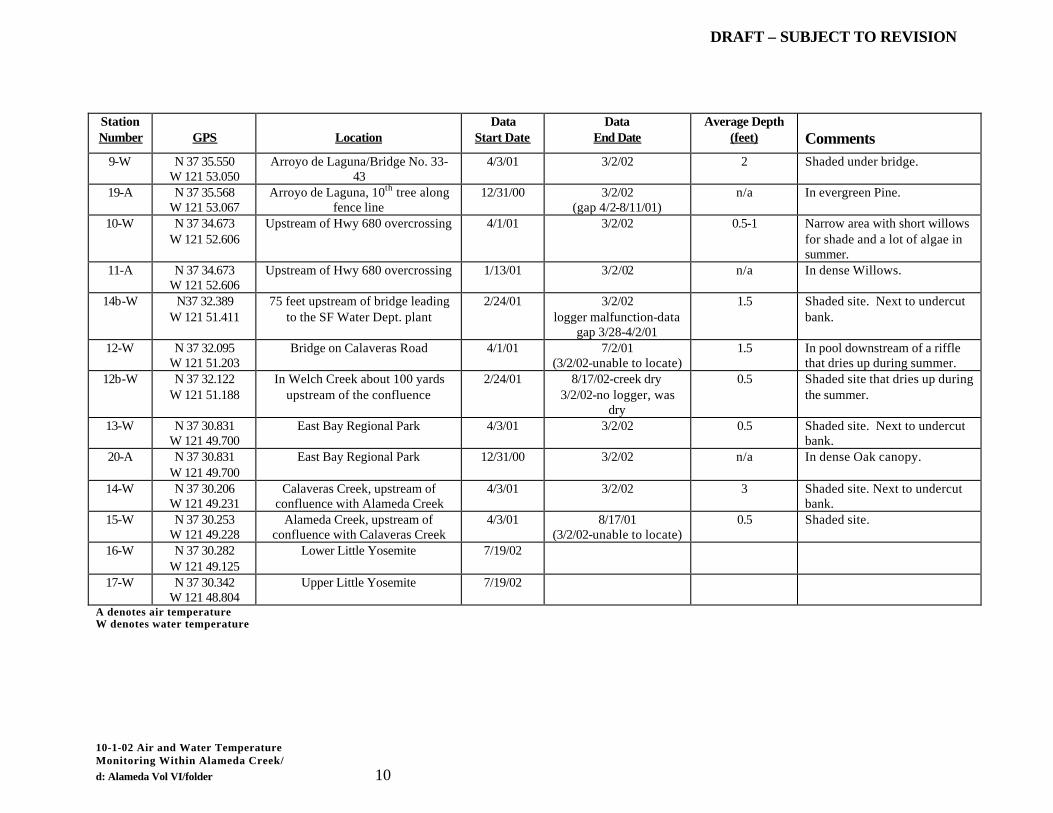
Table 1. Alameda Creek Air and Water Temperature Monitoring Locations. Station Number
GPS
Location
Data Start Date
Data End Date
Average Depth (feet)
Comments
23-W N 37 33.726 W 122 05.322
Flood control channel, almost to the Bay.
3/18/01 3/9/02 1-2 No cover from the sun.
21-W N 37 33.842 W 122 04.183
Area of the EBRP stables, end of Lowery Ave, left bank.
3/18/01 3/9/02 2+ No cover from the sun.
22-W N 37 34.822 W 122 03.193
Flood control reach, off Fremont Blvd. & Alvarado Rd.
3/18/01 8/22/01 (3/9/02-unable to locate)
2 No cover from the sun. Next to an undercut bank.
26-W N 37 34.240 W 122 00.686
100 yards upstream of portable restroom, upstream of Isherwood
3/21/01 8/28/01-Logger lost-site dry-no logger placed.
0.5 No cover from the sun. Site dries up in the summer.
3-W N 37 34.360 W 121 58.852
Niles Community Fremont Park 4/3/01 3/9/02 1+ No cover from the sun. No cover in entire reach between pillow dams.
24-W N 37 34.409 W 121 58.326
Upstream of ACWD rubber dam at 150 Levy Road
3/18/01 8/28/01 (3/9/02-unable to locate)
3+ No cover from the sun. Site dries up when pillow dam is deflated.
4-W N 37 34.899 W 121 57.855
¼ mile upstream of stream gage 12/30/00 3/9/02 (8/11/01-unable to
locate)
1
18-A N 37 34.899 W 121 57.855
¼ mile upstream of stream gage 12/31/00 3/9/02-with gap from 4/2/-8/11/01
n/a
Shaded site. Next to an undercut bank. Air recorder in alders.
25-W N 37 35.221 W 121 57.685
USGS Niles Canyon Gauging Station
3/18/01 3/2/02 1.5 Shaded site. Next to an undercut bank.
5-W N 37 35.650 W 121 57.245
Alameda Creek 4/3/01 8/11/01 (3/2/02-unable to locate)
2 Shaded site.
6-W N 37 36.578 W 121 56.674
Stonybrook Creek 4/3/01 8/11/01- creek dry 3/2/02-no logger, was
dry
1 Shaded site. Dries up in the summer.
7-W N 37 35.684 W 121 55.046
Downstream of train museum 4/3/01 3/9/02 (gap 8/28-8/30/01)
2 Shaded site. Next to an undercut bank.
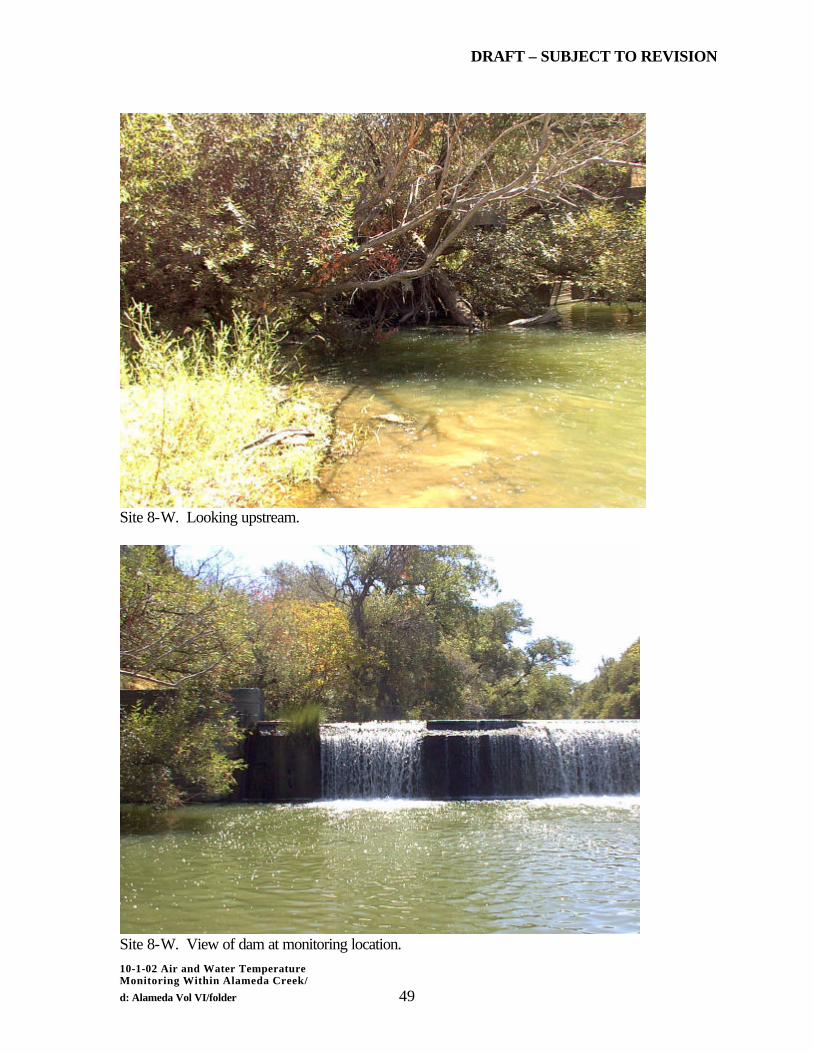
8-W N 37 35.687 W 121 54.107
Downstream of Sunol dam 4/3/01 3/2/02 2+ Shaded site.
DRAFT – SUBJECT TO REVISION
10-1-02 Air and Water Temperature Monitoring Within Alameda Creek/ d: Alameda Vol VI/folder 10
Station Number
GPS
Location
Data Start Date
Data End Date
Average Depth (feet)
Comments
9-W N 37 35.550 W 121 53.050
Arroyo de Laguna/Bridge No. 33-43
4/3/01 3/2/02 2 Shaded under bridge.
19-A N 37 35.568 W 121 53.067
Arroyo de Laguna, 10th tree along fence line
12/31/00 3/2/02 (gap 4/2-8/11/01)
n/a In evergreen Pine.
10-W N 37 34.673 W 121 52.606
Upstream of Hwy 680 overcrossing 4/1/01 3/2/02 0.5-1 Narrow area with short willows for shade and a lot of algae in summer.
11-A N 37 34.673 W 121 52.606
Upstream of Hwy 680 overcrossing 1/13/01 3/2/02 n/a In dense Willows.
14b-W N37 32.389 W 121 51.411
75 feet upstream of bridge leading to the SF Water Dept. plant
2/24/01 3/2/02 logger malfunction-data
gap 3/28-4/2/01
1.5 Shaded site. Next to undercut bank.
12-W N 37 32.095 W 121 51.203
Bridge on Calaveras Road 4/1/01 7/2/01 (3/2/02-unable to locate)
1.5 In pool downstream of a riffle that dries up during summer.
12b-W N 37 32.122 W 121 51.188
In Welch Creek about 100 yards upstream of the confluence
2/24/01 8/17/02-creek dry 3/2/02-no logger, was
dry
0.5 Shaded site that dries up during the summer.
13-W N 37 30.831 W 121 49.700
East Bay Regional Park 4/3/01 3/2/02 0.5 Shaded site. Next to undercut bank.
20-A N 37 30.831 W 121 49.700
East Bay Regional Park 12/31/00 3/2/02 n/a In dense Oak canopy.
14-W N 37 30.206 W 121 49.231
Calaveras Creek, upstream of confluence with Alameda Creek
4/3/01 3/2/02 3 Shaded site. Next to undercut bank.
15-W N 37 30.253 W 121 49.228
Alameda Creek, upstream of confluence with Calaveras Creek
4/3/01 8/17/01 (3/2/02-unable to locate)
0.5 Shaded site.
16-W N 37 30.282 W 121 49.125
Lower Little Yosemite 7/19/02
17-W N 37 30.342 W 121 48.804
Upper Little Yosemite 7/19/02
A denotes air temperature W denotes water temperature

DRAFT – SUBJECT TO REVISION
10-1-02 Air and Water Temperature Monitoring Within Alameda Creek/ d: Alameda Vol VI/folder 11
Table 2. Summary of vertical temperature differences (?T) within Alameda Creek pools.
Pool
Location (GPS) Number of
Measurements
Depth (ft) ?T (Surface-Bottom)
(C) 1. ACWD Dam 3
37 34.379 N 121 58.327 W
4 2.3 - 2.6 0 - -0.1
2. Niles Staging Park
37 34.848 N 121 57.867 W
7 2.3 – 3.3 0 - +0.1
3. Niles Canyon 37 35.135 N 121 57.862 W
6 3.4 – 4.2 0
4. Niles USGS Gage
37 35.221 N 121 57.686 W
2 4 – 4.5 0 - +0.1
5. Train Museum 37 35.765 N 121 55.138 W
2 2.4 – 2.7 0
6. Downstream of Sunol Dam
37 35.691 N 121 54.064 W
5 3.3 – 4.3 0 - -0.1
7. Sunol Park downstream of Calaveras Creek
37 30.294 N 121 49.618 W
5 2.7 – 5.5 -1.2 - -1.5
8. Calaveras Creek 37 30.210 N 121 49.227 W
6 2.3 – 2.9 -0.9 - -2.1
9. Alameda Creek upstream of Calaveras Creek
37 30.215 N 121 49.687 W
5 2.1 – 3.6 -1.0 - -1.9

DRAFT – SUBJECT TO REVISION
10-1-02 Air and Water Temperature Monitoring Within Alameda Creek/ d: Alameda Vol VI/folder 12
Figure 1. Air and water temperature monitoring locations within Alameda Creek.

DRAFT – SUBJECT TO REVISION
10-1-02 Air and Water Temperature Monitoring Within Alameda Creek/ d: Alameda Vol VI/folder 13

DRAFT – SUBJECT TO REVISION
10-1-02 Air and Water Temperature Monitoring Within Alameda Creek/ d: Alameda Vol VI/folder 14
DRAFT – SUBJECT TO REVISION
10-1-02 Air and Water Temperature Monitoring Within Alameda Creek/ d: Alameda Vol VI/folder 15
DRAFT – SUBJECT TO REVISION
10-1-02 Air and Water Temperature Monitoring Within Alameda Creek/ d: Alameda Vol VI/folder 16

DRAFT – SUBJECT TO REVISION
10-1-02 Air and Water Temperature Monitoring Within Alameda Creek/ d: Alameda Vol VI/folder 17

DRAFT – SUBJECT TO REVISION
10-1-02 Air and Water Temperature Monitoring Within Alameda Creek/ d: Alameda Vol VI/folder 18

DRAFT – SUBJECT TO REVISION
10-1-02 Air and Water Temperature Monitoring Within Alameda Creek/ d: Alameda Vol VI/folder 19

DRAFT – SUBJECT TO REVISION
10-1-02 Air and Water Temperature Monitoring Within Alameda Creek/ d: Alameda Vol VI/folder 20
DRAFT – SUBJECT TO REVISION
10-1-02 Air and Water Temperature Monitoring Within Alameda Creek/ d: Alameda Vol VI/folder 21

DRAFT – SUBJECT TO REVISION
10-1-02 Air and Water Temperature Monitoring Within Alameda Creek/ d: Alameda Vol VI/folder 22
DRAFT – SUBJECT TO REVISION
10-1-02 Air and Water Temperature Monitoring Within Alameda Creek/ d: Alameda Vol VI/folder 23

DRAFT – SUBJECT TO REVISION
10-1-02 Air and Water Temperature Monitoring Within Alameda Creek/ d: Alameda Vol VI/folder 24

DRAFT – SUBJECT TO REVISION
10-1-02 Air and Water Temperature Monitoring Within Alameda Creek/ d: Alameda Vol VI/folder 25

DRAFT – SUBJECT TO REVISION
10-1-02 Air and Water Temperature Monitoring Within Alameda Creek/ d: Alameda Vol VI/folder 26
DRAFT – SUBJECT TO REVISION
10-1-02 Air and Water Temperature Monitoring Within Alameda Creek/ d: Alameda Vol VI/folder 27

DRAFT – SUBJECT TO REVISION
10-1-02 Air and Water Temperature Monitoring Within Alameda Creek/ d: Alameda Vol VI/folder 28
DRAFT – SUBJECT TO REVISION
10-1-02 Air and Water Temperature Monitoring Within Alameda Creek/ d: Alameda Vol VI/folder 29
DRAFT – SUBJECT TO REVISION
10-1-02 Air and Water Temperature Monitoring Within Alameda Creek/ d: Alameda Vol VI/folder 30

DRAFT – SUBJECT TO REVISION
10-1-02 Air and Water Temperature Monitoring Within Alameda Creek/ d: Alameda Vol VI/folder 31
DRAFT – SUBJECT TO REVISION
10-1-02 Air and Water Temperature Monitoring Within Alameda Creek/ d: Alameda Vol VI/folder 32

DRAFT – SUBJECT TO REVISION
10-1-02 Air and Water Temperature Monitoring Within Alameda Creek/ d: Alameda Vol VI/folder 33

DRAFT – SUBJECT TO REVISION
10-1-02 Air and Water Temperature Monitoring Within Alameda Creek/ d: Alameda Vol VI/folder 34
DRAFT – SUBJECT TO REVISION
10-1-02 Air and Water Temperature Monitoring Within Alameda Creek/ d: Alameda Vol VI/folder 35
DRAFT – SUBJECT TO REVISION
10-1-02 Air and Water Temperature Monitoring Within Alameda Creek/ d: Alameda Vol VI/folder 36
0
5
10
15
20
25
30
35
40
45
1/1/00
2/1/00
3/1/00
4/1/00
5/1/00
6/1/00
7/1/00
8/1/00
9/1/00
10/1/0
011/
1/00
12/1/0
01/1
/012/1
/013/1
/014/1
/015/1
/016/1
/017/1
/018/1
/019/1
/01
10/1/0
111/
1/01
12/1/0
11/1
/02
Date
AC
WD
So
uth
Bay
Aq
ued
uct
Rel
ease
s at
Val
leci
tos
(cfs
)
Figure 25. ACWD South Bay Aqueduct releases to Alameda Creek: January 2000-December 2001.

DRAFT – SUBJECT TO REVISION
10-1-02 Air and Water Temperature Monitoring Within Alameda Creek/ d: Alameda Vol VI/folder 37
11173510-Alameda Creek Below Calaveras Creek, Near SunolDaily Mean Values
0
10
20
30
40
50
60
70
80
90
100
4/1/
014/
8/01
4/15
/01
4/22
/01
4/29
/01
5/6/
015/
13/0
15/
20/0
15/
27/0
16/
3/01
6/10
/01
6/17
/01
6/24
/01
7/1/
017/
8/01
7/15
/01
7/22
/01
7/29
/01
8/5/
018/
12/0
18/
19/0
18/
26/0
19/
2/01
9/9/
019/
16/0
19/
23/0
19/
30/0
110
/7/0
110
/14/
0110
/21/
0110
/28/
0111
/4/0
111
/11/
0111
/18/
0111
/25/
0112
/2/0
112
/9/0
112
/16/
0112
/23/
0112
/30/
011/
6/02
1/13
/02
1/20
/02
1/27
/02
2/3/
022/
10/0
22/
17/0
22/
24/0
2
Date
Flow
(cub
ic fe
et p
er s
econ
d)
Data available through 9/30/01
Figure 26. Streamflow within Alameda Creek downstream of Calaveras Creek, April 2001-February 2002.

DRAFT – SUBJECT TO REVISION
10-1-02 Air and Water Temperature Monitoring Within Alameda Creek/ d: Alameda Vol VI/folder 38
11173575-Alameda Creek Below Welch Creek, Near SunolDaily Mean Values
0
10
20
30
40
50
60
70
80
90
100
4/1/
01
4/8/
014/
15/0
14/
22/0
1
4/29
/01
5/6/
015/
13/0
1
5/20
/01
5/27
/01
6/3/
01
6/10
/01
6/17
/01
6/24
/01
7/1/
017/
8/01
7/15
/01
7/22
/01
7/29
/01
8/5/
018/
12/0
18/
19/0
1
8/26
/01
9/2/
01
9/9/
019/
16/0
19/
23/0
1
9/30
/01
10/7
/01
10/1
4/01
10/2
1/01
10/2
8/01
11/4
/01
11/1
1/01
11/1
8/01
11/2
5/01
12/2
/01
12/9
/01
12/1
6/01
12/2
3/01
12/3
0/01
1/6/
021/
13/0
2
1/20
/02
1/27
/02
2/3/
02
2/10
/02
2/17
/02
2/24
/02
Date
Flow
(cub
ic fe
et p
er s
econ
d)
Figure 27. Streamflow within Alameda Creek downstream of Welch Creek, April 2001-February 2002.

DRAFT – SUBJECT TO REVISION
10-1-02 Air and Water Temperature Monitoring Within Alameda Creek/ d: Alameda Vol VI/folder 39
11172945-Alameda Creek Above Diversion Dam, Near SunolDaily Mean Values
0
10
20
30
40
50
60
70
80
90
100
4/1/
01
4/8/
014/
15/0
1
4/22
/01
4/29
/01
5/6/
015/
13/0
1
5/20
/01
5/27
/01
6/3/
016/
10/0
16/
17/0
1
6/24
/01
7/1/
01
7/8/
017/
15/0
1
7/22
/01
7/29
/01
8/5/
018/
12/0
1
8/19
/01
8/26
/01
9/2/
019/
9/01
9/16
/01
9/23
/01
9/30
/01
10/7
/01
10/1
4/01
10/2
1/01
10/2
8/01
11/4
/01
11/1
1/01
11/1
8/01
11/2
5/01
12/2
/01
12/9
/01
12/1
6/01
12/2
3/01
12/3
0/01
1/6/
02
1/13
/02
1/20
/02
1/27
/02
2/3/
02
2/10
/02
2/17
/02
2/24
/02
Date
Flo
w (
cub
ic f
eet
per
sec
on
d)
Figure 28. Streamflow within Alameda Creek upstream of Sunol Dam, April 2001-February 2002.

DRAFT – SUBJECT TO REVISION
10-1-02 Air and Water Temperature Monitoring Within Alameda Creek/ d: Alameda Vol VI/folder 40
11177000-Arroyo De La Laguna Near PleasantonDaily Mean Values
0
10
20
30
40
50
60
70
80
90
100
4/1/
01
4/8/
01
4/15
/01
4/22
/01
4/29
/01
5/6/
01
5/13
/01
5/20
/01
5/27
/01
6/3/
01
6/10
/01
6/17
/01
6/24
/01
7/1/
01
7/8/
01
7/15
/01
7/22
/01
7/29
/01
8/5/
01
8/12
/01
8/19
/01
8/26
/01
9/2/
01
9/9/
01
9/16
/01
9/23
/01
9/30
/01
10/7
/01
10/1
4/01
10/2
1/01
10/2
8/01
11/4
/01
11/1
1/01
11/1
8/01
11/2
5/01
12/2
/01
12/9
/01
12/1
6/01
12/2
3/01
12/3
0/01
1/6/
02
1/13
/02
1/20
/02
1/27
/02
2/3/
02
2/10
/02
2/17
/02
2/24
/02
Date
Flo
w (
cu
bic
fe
et
pe
r s
ec
on
d)
Figure 29. Streamflow within Arroyo De La Laguna, April 2001-February 2002.

DRAFT – SUBJECT TO REVISION
10-1-02 Air and Water Temperature Monitoring Within Alameda Creek/ d: Alameda Vol VI/folder 41

DRAFT – SUBJECT TO REVISION
10-1-02 Air and Water Temperature Monitoring Within Alameda Creek/ d: Alameda Vol VI/folder 42
11179000-Alameda Creek Near NilesDaily Mean Values
0
10
20
30
40
50
60
70
80
90
100
4/1/
2001
4/8/
2001
4/15
/200
1
4/22
/200
1
4/29
/200
1
5/6/
2001
5/13
/200
1
5/20
/200
1
5/27
/200
1
6/3/
2001
6/10
/200
1
6/17
/200
1
6/24
/200
1
7/1/
2001
7/8/
2001
7/15
/200
1
7/22
/200
1
7/29
/200
1
8/5/
2001
8/12
/200
1
8/19
/200
1
8/26
/200
1
9/2/
2001
9/9/
2001
9/16
/200
1
9/23
/200
1
9/30
/200
1
10/7
/200
1
10/1
4/20
01
10/2
1/20
01
10/2
8/20
01
11/4
/200
1
11/1
1/20
01
11/1
8/20
01
11/2
5/20
01
12/2
/200
1
12/9
/200
112
/16/
2001
12/2
3/20
01
12/3
0/20
01
1/6/
2002
1/13
/200
2
1/20
/200
2
1/27
/200
2
2/3/
2002
2/10
/200
2
2/17
/200
2
2/24
/200
2
Date
Flo
w (
cub
ic f
eet
per
sec
on
d)
Figure 30. Streamflow within Alameda Creek near Niles, April 2001-February 2002.
DRAFT – SUBJECT TO REVISION
10-1-02 Air and Water Temperature Monitoring Within Alameda Creek/
d: Alameda Vol VI/folder 43
Appendix A
Temperature Monitoring Location Photos
August 2001

DRAFT – SUBJECT TO REVISION
10-1-02 Air and Water Temperature Monitoring Within Alameda Creek/
d: Alameda Vol VI/folder 44
Site 26-W. Dry and overgrown.
Site 3-W. No cover along levees.

DRAFT – SUBJECT TO REVISION
10-1-02 Air and Water Temperature Monitoring Within Alameda Creek/
d: Alameda Vol VI/folder 45
Site 4-W. Looking downstream.
Site 4-W. Looking upstream.

DRAFT – SUBJECT TO REVISION
10-1-02 Air and Water Temperature Monitoring Within Alameda Creek/
d: Alameda Vol VI/folder 46
Site 18-A. Air temperature logger located in Alders in center of photo.
Site 5-W. Looking downstream.

DRAFT – SUBJECT TO REVISION
10-1-02 Air and Water Temperature Monitoring Within Alameda Creek/
d: Alameda Vol VI/folder 47
Site 5-W. Looking upstream.
Site 6-W. Site dry.

DRAFT – SUBJECT TO REVISION
10-1-02 Air and Water Temperature Monitoring Within Alameda Creek/
d: Alameda Vol VI/folder 48
Site 6-W. Pool upstream of monitoring site.
Site 6-W. Looking downstream at pool above monitoring site.
DRAFT – SUBJECT TO REVISION
10-1-02 Air and Water Temperature Monitoring Within Alameda Creek/
d: Alameda Vol VI/folder 49
Site 8-W. Looking upstream.
Site 8-W. View of dam at monitoring location.

DRAFT – SUBJECT TO REVISION
10-1-02 Air and Water Temperature Monitoring Within Alameda Creek/
d: Alameda Vol VI/folder 50
Site 10-W. Located near bridge. Note vegetation and algae growth.
Site 14b-W. Looking downstream at bridge.
DRAFT – SUBJECT TO REVISION
10-1-02 Air and Water Temperature Monitoring Within Alameda Creek/
d: Alameda Vol VI/folder 51
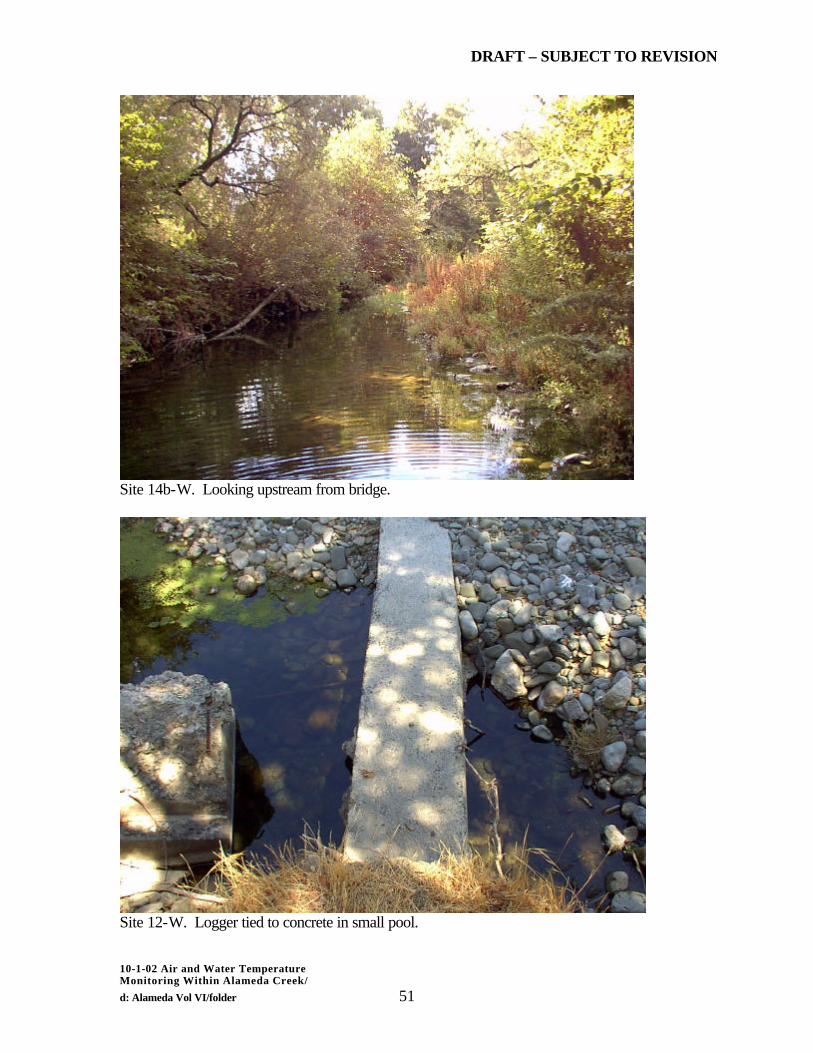
Site 14b-W. Looking upstream from bridge.
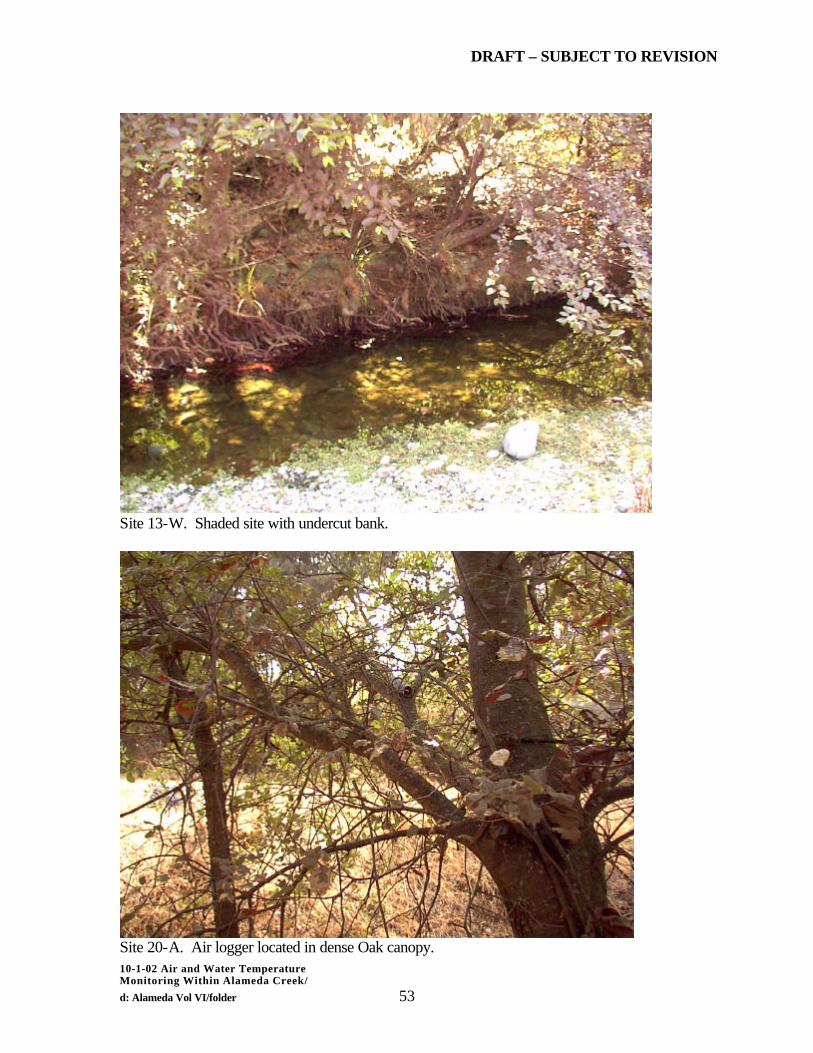
Site 12-W. Logger tied to concrete in small pool.

DRAFT – SUBJECT TO REVISION
10-1-02 Air and Water Temperature Monitoring Within Alameda Creek/
d: Alameda Vol VI/folder 52
Site 12-W. Photo shows dry riffle and pool above riffle.
Site 12b-W. Shows Welch Creek bank and dry channel.
DRAFT – SUBJECT TO REVISION
10-1-02 Air and Water Temperature Monitoring Within Alameda Creek/
d: Alameda Vol VI/folder 53
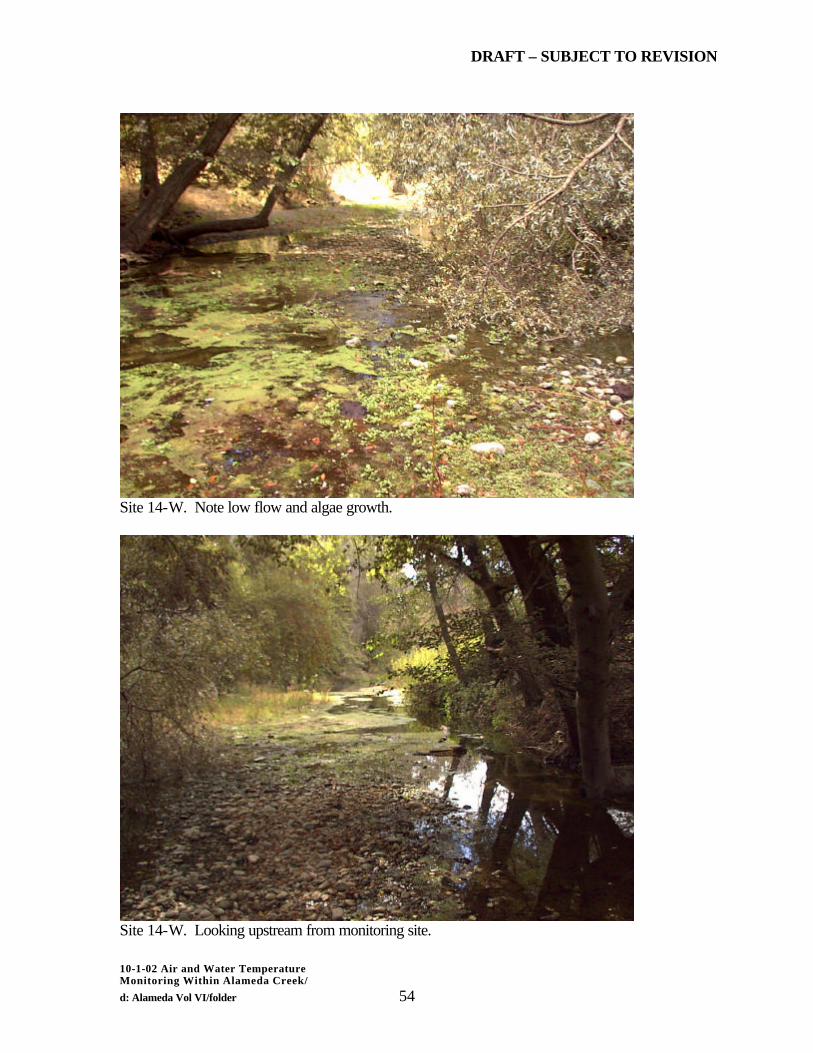
Site 13-W. Shaded site with undercut bank.
Site 20-A. Air logger located in dense Oak canopy.
DRAFT – SUBJECT TO REVISION
10-1-02 Air and Water Temperature Monitoring Within Alameda Creek/
d: Alameda Vol VI/folder 54
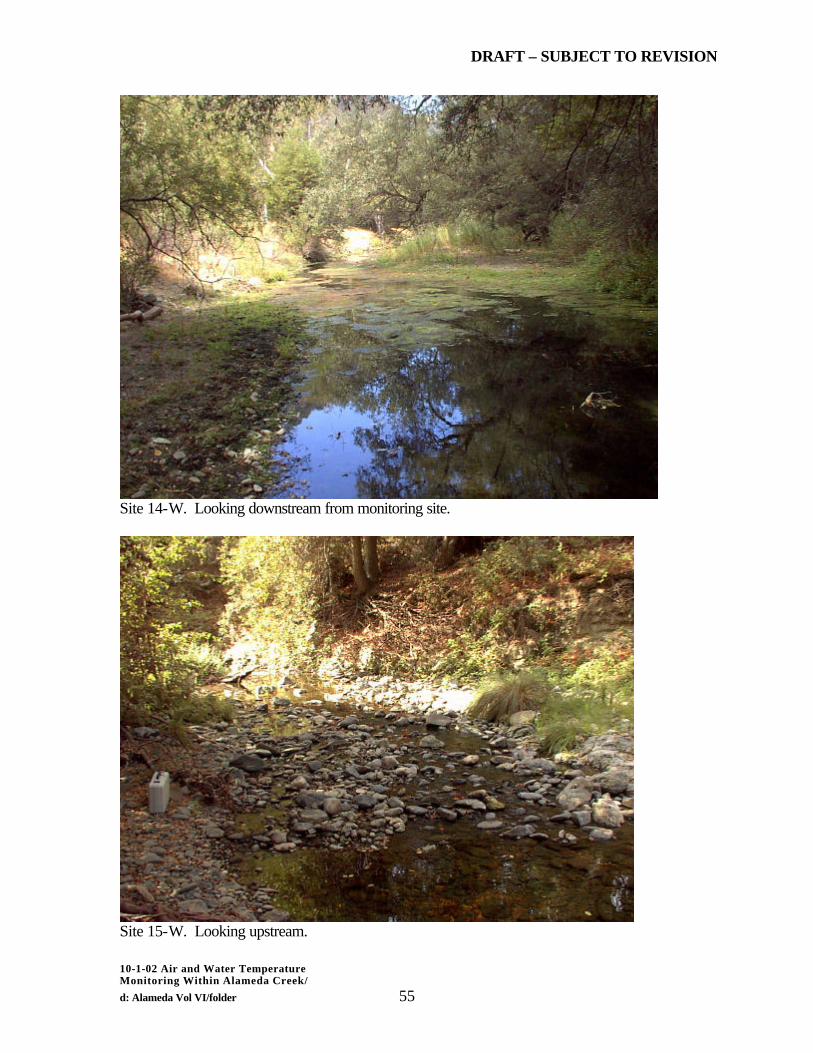
Site 14-W. Note low flow and algae growth.
Site 14-W. Looking upstream from monitoring site.
DRAFT – SUBJECT TO REVISION
10-1-02 Air and Water Temperature Monitoring Within Alameda Creek/
d: Alameda Vol VI/folder 55
Site 14-W. Looking downstream from monitoring site.
Site 15-W. Looking upstream.

DRAFT – SUBJECT TO REVISION
10-1-02 Air and Water Temperature Monitoring Within Alameda Creek/
d: Alameda Vol VI/folder 56