dspace.stir.ac.uk 1 wish to thank the Agency for Forestry Research and Development (AFRD), the...
156
-
Upload
vuongkhanh -
Category
Documents
-
view
215 -
download
0
Transcript of dspace.stir.ac.uk 1 wish to thank the Agency for Forestry Research and Development (AFRD), the...


ABSTRACT
A study on tlie regeneration of the forest after logging was conducted in tlie Hutan Kintap concession. South Kalimantan. Indonesia. The study began in 1991, and nineteen 0.2S lia plots were set up in a total of six blocks Block A was a newly logged forest and had five plots, and Blocks B - D were in forest which had been logged in 1979. Block B (five plots) had received no silvicultural treatment. Block C (fi\e plots) and D (one plot) had been lightly tliiimed after felling and Block C received a further thinning treatment. Block E (one plot) had been heavily tliimted. and Block F (2 plots) was an unlogged control. The study included observations on the condition of tlie forest in the plots, the growth rate of the remaining trees, seedlings and saplings, and the size of the soil seed banks and seed rain. It was completed in 1996.Tlie average aimual precipitation in tlie study area was about 3000 mm, the average temperature recorded in Pelaihari (60 km from tlie study site) ranged between 26.4° C and 27.6° C, humidity between 76 % and 87 and irradiation between 35 % and 77 % sunsliinc hours (between 0800 and 1600), Tlie topograph> was undulating with an altitude of 10 - 200 m above sea level. A soil survey revealed mainly ultisols but there were gleyed areas and some lithosols. Soil particles were dominated by clay with pH’s ranging between 4.8 and 6 I. available-P between 0.1 and 5.9 pg g ' , total P between 92 and 503 pg g ', and organic C. CEC and the sum of
e.xchangeablc cations all relatively high.In all 19 plots the Dipterocarpaceae were the leading family in terms of number of indi\ iduals and basiil area There were at least 305 species of tree (> 10 cm dbh) included in 49 families. Growth rates in the plots \ aricd among Blocks and among plots of tl\e same Block, ranging from 0.31 to 0.57 n r ha 'year ' depending among other factors on tlie site condition and species composition. Liberation treatment in Block C resulted in a liigher increment rate than in Blocks A and B, the difference however was not significant. Dipterocarps had the highest increment in the study area. Mortality within tlie study sites ranged from 1.15 to 2.70 % year ' The density of seedlings varied within the study sites, and averaged 47000 ha"' to 121000 ha''. Tlie mean height growth per Block was from 2.9 cm year ' to 10.5 cm year '. Seedling mortality ranged from 16 to 37 % year"', and declined with height class. Tlie density of saplings ranged from 68(K) ha ' to 7700 ha ' and the\ had a diameter growth of 0.8 nun year ' to 2.2 nun year ', and a height growth of 12.6 cm year ' to 21.8 cm year"'Tlte size of seed banks varied greatly among plots, ranging from 73 m'* to 1084 m'-. and the number of identified species varied from 10 to 29 per plot. Pioneers contributed most to the seed banks both in numbers of species and individuals. Seed fall was 4534 (collected in traps with a total area of 57 nr), with the pc;ik occurring in Febniao' - March 1992 (45 Vo). Tlte heavy seed rain in Febnmry - March 1992 followed a mast flowering and fruiting in November - December 1991. Dipterocarp seeds contributed 847 seeds (15 m ') from
12 species and 3 genera.Given llic condition of the logged-over forest of the study sites, the forest rccot ery will take up to 50 t ears. Sufficient seedlings and saplings and the productivity of the remaining stands as indicated by the seed fall dunng a mast fniiting ensure the regeneration of tlie forest after logging. Unfortunately the condition of the logged-over forests were very much worse outside the study area, and no predictions can be made of the rccovert time or even if recovery w ill ever occur over most of the concessionary area.

ACKNOWLEGMENTS
1 wish to thank the Agency for Forestry Research and Development (AFRD), the Office of Forest Research Development and Nature Conservation (FRDNC) Bogor, and the INDECO Supporting Office, for the permission for, and support of, my study. I owe much to the Finnish International Agency (FINNIDA) for support during the field work at Kintap, South Kalimantan, and funding for the completion of the study in joint efforts with the Ministry of Forestry, Indonesia.I would like to thank Professor John Proctor, my supervisor, for his constant inspiration, advice and help in Stirling and in Kintap. Mr. A. P. Sagala for his comments and encouragement and the staff of the Reforestation Technology Institute Banjarbaru for
help during the field study.Professor Jussi Kuusipalo and Mr Goran Adjers from the Enso Forest Development Ltd deserve particular thanks for sharing ideas and efforts. Special thanks goes to Mr Amrun, a field guide and a vernacular tree names expert in Kintap, who faithfully cooperated throughout the field work, and to Mr. Dian Lazuardi, a soil scientist of the Reforestation Technology Institute Banjarbaru, for help in soil surveying. I would like to thank Mr Hairunsyah from the Soil Laboratory of the Horticultural Research Institute, Banjarbaru, for the analysis of soil samples. My friends Mr. Jens-Peter B. Lilleso and Mr Jens Grahnhof are thanked for their help in South Kalimantan. I would like to thank Dr. Yves Laumonier and Dr. Purnadjaja for support and encouragement, and to all friends and colleagues in Bogor and in the University of Stirling for encouragement and cooperation The staff of Herbarium of the FRDNC helped me with the identification of plant
specimensFinally I thank my wife Elly and all my sons and daughters for their patience, sacrifices,
encouragement and support.

CONTENTSAbstractAcknowledgementCHAPTER 1. GEENERAL INTRODUCTION
Background .................................................................................................................................Kintap forest and tlic FINNIDA Trropical Forest Management Project, South KaslimantanTlie aims of tliis s tudy ...................................................................................................................
CHAPTER 2. THE STUDY SITE AND ITS PHYSICAL ENVIRONMENTIntroduction.....................................................................................................................................Climate
Precipitation.....................................................................................................................Temperature.....................................................................................................................Humidity..........................................................................................................................Solar radiation.................................................................................................................
Geology ..........................................................................................................................................Soil
Soil survey.......................................................................................................................Soil chemical and texture...............................................................................................
CHAPETR SELECTION, HIS1ORY AND FLORJSTIC COMPOSITION OF THE STUDY SITE
IntroductionTlie main study plots......................................................................................................The subsidiary plots.......................................................................................................
Plot descriptionPlot establishment...........................................................................................................Topography.....................................................................................................................
Floristic composition......................................................................................................................
CHAPTER 4 THE NEWLY LOGGED FOREST AT KINTAPIntroduction.....................................................................................................................................Materials and methods...................................................................................................................Results.............................................................................................................................................Discussion.......................................................................................................................................
CHAPTER 5. GROWTH, MORTALITY AND RECRUITMENT OF TREES AT KINTAPIntroduction.....................................................................................................................................Materials and m ethods..................................................................................................................Results
Block A (newly logged forest)......................................................................................Block B (forest logged in 1979)....................................................................................Block F (unloggcd forest)..............................................................................................Tlie effect o f liberation treatment.................................................................................Mortality and recruitment..............................................................................................Discussion.......................................................................................................................
CHAPTER f). GROWTH AND SURVIVAL OF SEEDLINGS AND SAPLINGS IN THE LOGGED-OVER FOREST
Introduction.....................................................................................................................................Materials and metliods..................................................................................................................Results
Seedlings.........................................................................................................................Saplings...........................................................................................................................
Discussion.......................................................................................................................................
It)
18

CHAPTER 7. SOIL SEED BANKS AT KINTAPIntroduction...................................................................................................................Materials and methods
Sampling and shade house observ'ation.......................................................Results
Size of seed bank ...........................................................................................Floristic composition
Size of seed banks.........................................................................Floristic composition ...................................................................Life form .........................................................................................
Discussion....................................................................................................................
CHAPTER K. SEED RAIN OF DIPTEROCARPS AND SOME NON-DIPTEROCARPSIntroduction..................................................................................................................Materials and methods.................................................................................................Results...........................................................................................................................Discussion....................................................................................................................
CHAPTER 9. CONCLUDING REMARKS............................................................................
REFERENCES............................................................................................................................
93
93
94
I 14
121
APPENDICES1 Procedures of the soil analysis in tlie Laborator>' of the Horticultural Research Institute.
Banjarbaru. Soutli Kalintantan.2. Precipitation (P) and number of rain days (Nrd) recorded at Pclaihari. South Kalimantan. 1979 -
1995.3 Precipitation (P) and number of rain days (Nrd) recorded at Jorong. Soutli Kalimantan. 1979 - 19954. The average maximum and highest maximum temperature at Pelaihari, South Kalimantan. 1981 -
1995.5. The daily average temperature in Pelaihari, Soutli Kalimantan, 1981 - 1995.6. The average humidity (%) at Pelaihari, South Kalimantan, 1981 - 1995.7. Tlie average daily sunsliine hours (%). 0800 - 1600, in Pelailtari, Soutli Kalimantan. 1981 - 19958. Soil group aand cchemical profierties in tlie Kintaap sstudy plots. South Kalimantan.9. Composition, diversity and equitability of seed bank. Kintap, Soutli Kalimantan. January 1992.10. Dipterocarp seeds trapped by plot in February - May 1992.11. Non-dipterocarp seeds trapped by plot, Kintap. Soutli Kalimantan. February - March 1992.12. Dipterocarp trees by plot (@ 50m x 50 in), Kintap, South Kalimantan.
CHAPTER 1 GENERAL INTRODUCTION
Background
The natural regeneration of forests has been widely studied in gaps which are
recognized as an important part o f the forest growth cycle (Whitmore 1978, Hartshorn
1978; Denslow 1980; Brokaw 1982; Brokaw 1985; Canham & Marks 1985) Tree
population dynamics, species composition, and growth rates are dependent on the
frequency and size of gaps (Brokaw 1985).
Logged forests may be regarded as a severely disturbed natural system, and through
natural dynamic processes and with an appropriate management system sustainable
forest production may be maintained (Swaine et al. 1987). Studies on the response of
forest to logging are still inadequate in spite of the vast areas of logged forests which
occur throughout the wet tropics.
The most favoured management system in Indonesia is the Indonesian Selective
Cutting and Replanting System (“Tebang Pilih Tanam Indonesia”) which is designed
to have a 35-years cutting cycle. This requires that after logging, 25 mother trees (>
35 cm) must be left per ha and no tree of less than 50 cm must be cut (Djamaludin
1991). The selective cutting creates gaps and forest patches of varying sizes,
depending on the intensity of logging. A grouping of desired commercial trees
(notably dipterocarps) will open larger gaps and cause heavy damage to the area
Felling and mechanized log extraction are the two main factors damaging forests, soil
water resources, and animal habitats during logging (Nicholson 1958; Fox 1969; Tinal
& Palenewen 1978; Abdulhadi e ta ! 1980; Ewel & Condo 1980; Kartawinata 1981).
Felling damage includes that to bark or crowns or both, and fallen or broken stems.

and may range up to 36% of the former total number of trees (> 14 cm dbh)
(Nicholson 1958, Tinal & Palenewen 1978). Log extraction is more damaging than
felling (Burgess 1971; Fox 1978). Mechanical log extraction opens up the forest floor
by up to 40% (Nicholson 1979; Hutchinson 1980). The logging operation affects the
soil physically and chemically and has a potential effect on soil micro-organisms
(Ewel & Condo 1980). Erosion is one of the apparent effects of logging, especially on
roads and skid trails (Burgess 1971; Ewel & Condo 1980; Kellman 1969; Liew 1974,
Wyatt-Smith 1949). A cleared area in the logged forest may have slower
decomposition and hence less mineralization of nutrients and organic inputs
contributing to a lower cation exchange capacity (Ewel 1976; Ewel & Condo 1980).
In order to understand the damage to the forest caused by logging and the processes
involved in its recovery several aspects must be studied. These include a
quantification of the damage, growth of trees, seedlings and saplings, the mortality
and recruitment of trees, the survivorship o f seedlings and saplings, and the seed
banks and the seed rain.
The natural growth rate of trees in the tropical rain forest differs among emergent,
canopy and understory species, and within individuals of the same species at the same
site (Whitmore, 1984 ; Swaine et a! 1987a; Manokaran & Kochummen, 1987,
Korning & Balslev 1994). Manokaran & Kochummen (1987) studied the growth rate
of trees in primary lowland tropical rain forest in Peninsular Malaysia over 34 years
A higher growth rate was observed for some emergent trees than upper canopy
species, and the latter had a higher growth rate than understory species. Similarly
Korning & Balslev (1994) observed a higher growth rate of higher-layer tree species
in primary rain forest in Amazonian Equador. The growth of trees in a successional
stage (60-years old forest on abandoned agricultural land) was studied by Lang &

Knight (1983) on Barro Colorado Island, Panama, over 10 years. The study suggested
that diameter growth was highly variable among species and among size classes
Small understory trees grew most slowly, mostly less than 1 mm year'' dbh, while
individual canopy trees had a maximum growth rate of 15 mm year''. Growth at this
site was very slow for most species with a 0 - 2% dbh increment over the first 10
years. Growth of dipterocarps in contrasting primary forest types, managed forest,
logged-forest and plantations was studied by Primack et al. (1989). The results of the
study suggested that the growth response of species and genera is site specific, and
growth rates are distinctly increased by silvicultural treatment following logging
Studies on the advance growth of pole-size dipterocarps in Sabah (Nicholson 1965)
indicated that the girth increment after logging was higher than before. The growth
rate of residual stands (excluding damaged trees) in a heavily logged forest in East
Kalimantan showed a significant increase (Miller, 1981). In the older logged-over
forest competition may increase and reduce the growth rates. Primack et al (1985)
found that growth rates in the Moraceae increased in 1 and 2 years-old logged-over
forest and declined 3 and 4 years after logging.
Tree mortality is related to the maximum age of species, relative density, size-class
distribution and the occurrence of canopy gaps. There is a constant proportion of tree
mortality in any age class over a time period, even though mortality is independent of
tree age for trees > 10 cm dbh. Annual mortality rate in tropical rain forest sites shows
a narrow range of 1% - 2% (Swaine et al. 1987). In a successional stage, the mortality
rate may be higher in the understory species followed by mid-canopy and canopy
species (Lang & Knight, 1983).
Recruitment to pole size from seedlings and saplings occurs generally in gaps
(Whitmore, 1978; Brokaw 1985). Canopy opening may also enhance the growth of

light-demanding tree species. During a certain period of succession, mortality exceeds
recruitment (Manokaran & Kochummen 1987; Lang & Knight 1983). This may be
understood during a building phase (Whitmore 1984) when most short-lived pioneers
could have died and been replaced by the growth of primary species. The equilibrium
of the forest is achieved when the growth of some trees may cause the death of the
others and the loss o f trees is replaced by new recruits. In the steady state forest,
mortality closely matches recruitment and there is an inverse relationship between
mortality and growth rate (Swaine et al. 1987).
Regeneration after logging depends among other factors on the availability, pattern of
growth, and survivorship of seedlings and saplings remaining on the forest floor or
germinated from dispersed seeds and from seeds deposited in the soil seed bank
Forest trees may be divided into: climax species (shade bearers) of which the seeds may
germinate and establish in the shade, although they may respond with rapid growth
when the forest canopy is opened, and pioneer species which germinate, establish and
complete their life cycle in large gaps (Whitmore, 1984; Brokaw, 1985; Swaine &
Whitmore, 1988). Regeneration after logging involves both species groups and to some
extent simulates the regeneration in large natural gaps.
Growth of seedlings under the closed canopy of virgin forest is slow (Popma &
Bongers, 1988; Turner, 1990) whereas in a logged-over forest seedling growth may be
markedly higher. Nicholson (1958b) indicated that the large openings caused by heavy
logging induced the growth of dipterocarp seedlings, with larger seedlings responding
more than smaller ones, whereas about 40 % of seedlings in virgin forests were almost
dormant. Growth of seedlings in the gaps increased with light intensity (Popma &
Bongers, 1988; Whitmore, 1989; Turner, 1990). Light intensity in this case may
correspond to the size o f the gaps, the larger the gap the higher the intensity of light on
the gap floor. Species composition in gaps, either from formerly suppressed seedlings
and saplings or from germinating seeds, is determined by growth and mortality
associated with gap-size variation, individual species density, and other factors such as
shading from the earlier growing trees (inhibiting pioneer seedlings), root competition,
and pattern of flowering and fruiting (frequently recruitment after mass fruiting is
subject to rapid death, whereas species with infrequent fruiting generally have longer-
lived seedlings) (Whitmore 1984; Whitmore 1987; Connell 1989). Survivorship varies
between species (Liew & Wong 1973; Turner 1990), and larger seedlings show higher
survivorship than smaller ones (Uhl et al. 1988; Turner 1990).
The soil seed bank in both primary and secondary forest is composed mainly of
pioneers (Guevara & Gomez-Pompa 1972; Liew 1973; Hall & Swaine 1980; Hopkins
& Graham 1983; Putz 1983; Whitmore 1983; Vazquez-Yanes & Orozco Segovia 1984)
and plays a role in succession after disturbance. The seed bank responds quickly to gap
formation and was shown to be much more important than seed rain in the first nine
months after sucession at the Pasoh Forest Reserve, Malaysia (Putz & Appanah 1987).
The seed bank in primary forests is less than in secondary forests because of the higher
continuous input of seeds in the latter (Hopkins & Graham 1984). The species
composition of a disturbed area in a forest may be predicted to some extent from the
floristic composition of its seed bank (Liew 1973; Hopkins & Graham 1984).
Seeds or fruits of species with a gregarious occurrence in secondary forest are generally
provided with an efficient mechanism of dispersal by wind or animals (particularly
birds and bats). In the primary forest, seeds and fruits have but few special adaptations
for wind dispersal (Richards 1966), and aerial movement is physically more obstructed
(Ridley 1930, Sheldon & Burrows 1973, Willson & Crome 1989). Canopy or emergent
tree species however, are exposed to wind (Richards 1966), which can act as a

dispersal agent. The height o f the release affects dispersal distance of winged seeds
(Harper 1977, Lament 1985, Sheldon & Burrows 1973). The Dipterocarpaceae usually
have fruits which are dispersed by wind. The flowering of dipterocarps occurs at
irregular intervals and at varying intensities (Ashton 1982). Gregarious flowering
follows high average maximum temperatures and a sharp increase in irradiation or both
(Wycherley 1973, Ng 1977), and many other families flower in a good dipterocarp year
(Medway 1972, Ng 1977, Ashton 1982). Gregarious flowering following a sharp
increase in daily sunshine occurred at Kepong, Malaysia, in March or April in certain
years, and mast seeding occurred in August - September (Ng 1977). The section Mutica
(Red Meranti group) have been observed to flower at different times but serially,
reducing the chance of hybridisation and avoiding competition between pollinators
(Whitmore 1984).
Kintap forest and the FINNIDA Tropical Forest Management Project
The logging concession at Kintap in South Kalimantan was available for a study of the
forest regeneration characteristics.
Kintap forest is about 90 km south-east of Banjarmasin, the Provincial capital. It lies
between 3“40’ - 3°45’ S and 115° - 115° 30’ E, and has a rugged topography with the
altitude up to 200 m above sea level. The Kintap forest has been logged since 1979 by
the South Korean Hutan Kintap concessionaries, and has a total forest area of 125,000
ha Within the concession a research project has been conducted since 1985 by the
Reforestation and Tropical Forest Management Project (formerly the Mechanized
Nursery and Plantation Project), a collaborative project between the Finnish
International Development Agency (FINNIDA) and the Ministry of Forestry,
Indonesia. Studies on the regeneration and plantation trials have been reported by

Hadengganan e! a! (1992), Adjers et a! (1995a), Adjers et a! (1995b), Kuusipalo et a!
(1996) and Tuomela et a l { \996).
One of the FfNlNIDA projects had involved the setting up of four permanent 50 m x
100 m plots in 1985 with the following treatments: two unlogged and unmanaged
plots, one intensively managed plot, and one lightly managed plot. The recording of
these plots formed part of the work in this thesis.
It must be pointed out at this stage that during the course of the work it was found that
the Kintap forest had been excessively and illegally exploited by the concessionaries
No unlogged forest was available for comparisons beyond the FINNIDA permanent
plot which had been chosen by the concessionaries almost certainly because it was
atypical with little commercial value. The logged forest studied was relatively lightly
damaged compared with the rest of the concession because the concessionaries
respected the presence of this project and my conclusions will unfortunately not apply
to the bulk of the virtually destroyed concession.
The aims of this study
In view of the background information given in this general introduction and the
likelihood that there will be many site-specific factors involved, a study was designed
with the following aims:
(a) To provide a description of the physical environment in the Kintap area, including
the soil
(b) To describe the tree composition in the 19 study sites in the five Blocks which
have been subjected to different treatments.
(c) To assess the extent of the logging damage particularly in the newly-logged 50 m
by 50 m plots.

CHAPTER 2. PHYSICAL ENVIRONMENT
CLIMATE
Precipitation
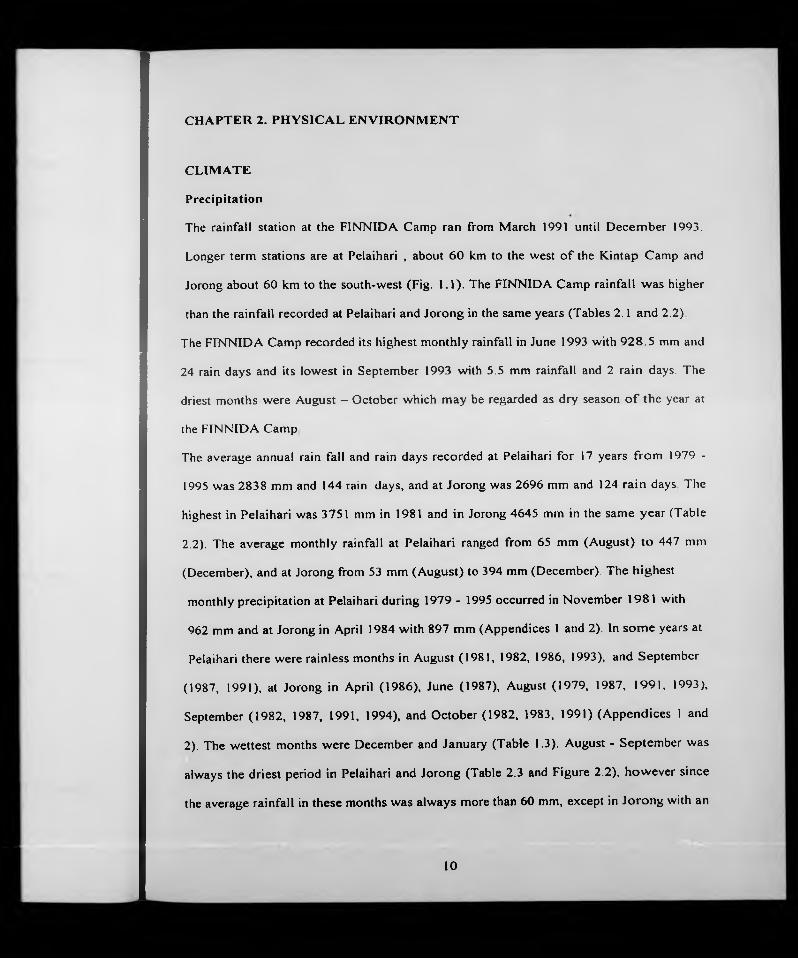
The rainfall station at the FINNIDA Camp ran from March 1991 until December 1993.
Longer term stations are at Pelaihari , about 60 km to the west of the Kintap Camp and
Jorong about 60 km to the south-west (Fig. 1.1). The FINNIDA Camp rainfall was higher
than the rainfall recorded at Pelaihari and Jorong in the same years (Tables 2.1 and 2.2)
The FINNIDA Camp recorded its highest monthly rainfall in June 1993 with 928.5 mm and
24 rain days and its lowest in September 1993 with 5.5 mm rainfall and 2 rain days. The
driest months were August - October which may be regarded as dry season o f the year at
the FINNIDA Camp
The average annual rain fall and rain days recorded at Pelaihari for 17 years from 1979 -
1995 was 2838 mm and 144 rain days, and at Jorong was 2696 mm and 124 rain days The
highest in Pelaihari was 3751 mm in 1981 and in Jorong 4645 mm in the same year (Table
2.2). The average monthly rainfall at Pelaihari ranged from 65 mm (August) to 447 mm
(December), and at Jorong from 53 mm (August) to 394 mm (December). The highest
monthly precipitation at Pelaihari during 1979 - 1995 occurred in November 1981 with
962 mm and at Jorong in April 1984 with 897 mm (Appendices 1 and 2). In some years at
Pelaihari there were rainless months in August (1981, 1982, 1986, 1993), and September
(1987, 1991), at Jorong in April (1986), June (1987), August (1979, 1987, 1991, 1993),
September (1982, 1987, 1991, 1994), and October (1982, 1983, 1991) (Appendices 1 and
2). The wettest months were December and January (Table 1.3). August - September was
always the driest period in Pelaihari and Jorong (Table 2.3 and Figure 2.2), however since
the average rainfall in these months was always more than 60 mm, except in Jorong with an
10
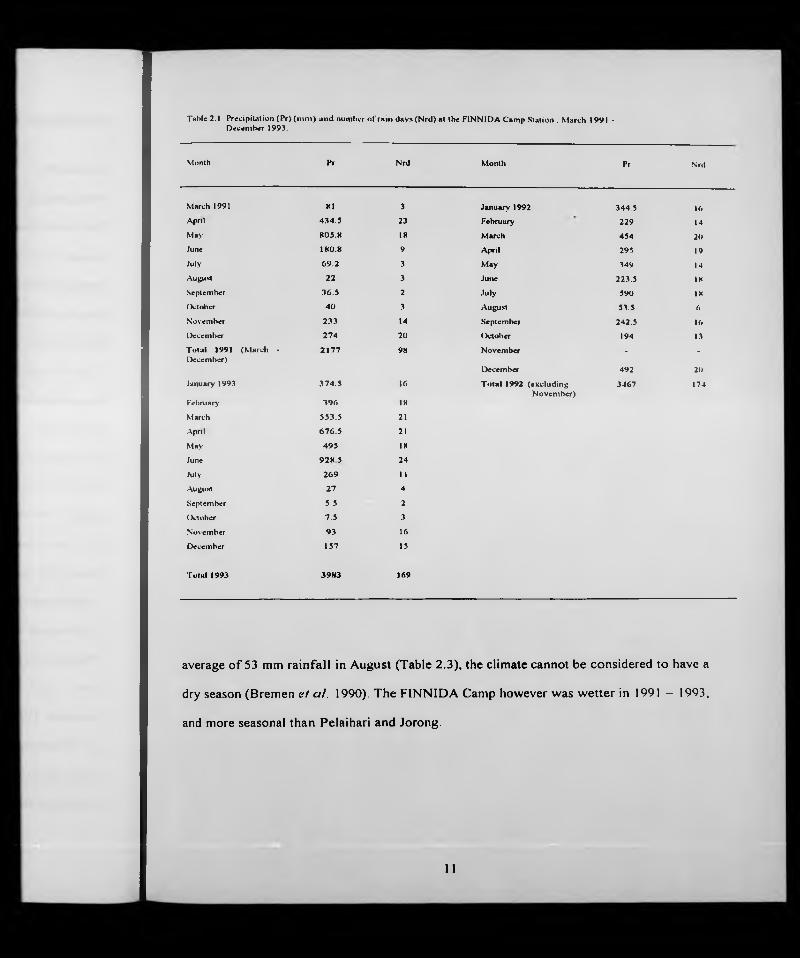
Table 2.1 Precipitation (P r) (m m ) an d number o t'ra in days (N rd) at the FINNIDA Cam p Station . M arch 1991 - Decem ber 1993.
Month Pr Nrd Month Pr Nrd
March 1991 XI 3 January 1992 344.5 16April 434.5 23 February 229 UMay 805 .8 18 March 454 20June 180.8 9 April 295 19
July 69.2 3 May 349 UAugust 22 3 June 223.5 18
September 36.5 2 July 590 18
October 40 3 August 53.5 6
November 233 14 September 242.5 16
December 274 20 October 194 1.3
T ulal 1991 (M arch • 2177 98 November . .
December)December 492 20
January 1993 374 .5 ■ 6 T o ta l 1992 (excluding 3467 174N ovem ber)
February 396 18
March 553.5 21
.'Xpril 676 .5 21
May 495 IX
June 92X 5 24
July 269 1 1
August 27 4
September 5.5 2
( )dober 7.5 3
November 93 16
December 157 15
TutuI 1993 3983 169
average of 53 mm rainfall in August (Table 2.3), the climate cannot be considered to have a
dry season (Bremen e! al. 1990). The FINNIDA Camp however was wetter in 1991 - 1993,
and more seasonal than Pelaihari and Jorong.
II


Table 2.3. T he average monthly precipitation (P) and num ber o f ra in day» (Nrd) at Pelaihari and Jorong stations. South K alim antan. 1979 - 1995.
M onth
P (mm )
Pelaihari
N R D P (min)
Jorong
N RD
January 428 19 3X6 16
Februar>' 323 16 272 13
March 307 17 286 14
April 229 14 301 12
M ay 215 13 257 12
June 171 9 197 10
July 120 8 141 8
August 65 4 53 3
September 76 5 84 4
O ctober 122 X K2 6
November 336 IS 243 1 1
December 447 17 394 15
Temperature
The temperature in Pelaihari was relatively constant throughout the year (Table 2 4,
Fig.2.2) The daily average temperature ranged from 26.4“ C (January) - 27.6" C (October),
the average monthly maximum from 30.9" C (December, January) - 33.2" C (October), and
the average highest maximum 33.6*̂ C (January) - 34.9^ C (October) (Table 14) The
absolute maximum of 36.0" C occurred in October 1987 and in September and October
1991 (Appendix 3). The hottest months were always August, September and October
Humidity
Humidity followed the pattern of rainfall (Fig. 2.3). The most humid months were
December and January with average relative humidities of 86% and 87% respectively, and
the driest months were August, September and October with 76% - 77% relative humidity
(Table 2.4).
14

Table 2.4. Tem perature and relative hum idity recorded in Pelaihari, South Kalimantan. 1981 - 1993.
Month
Daily average
Tem perature (*C)
A verage maximum Average highest m ax im u m
Humidity (•'©)
A verage
January 26.4 30.9 33.6 87
February 26.3 31.3 33.8 83
March 26.6 31.6 34.1 86
April 26.8 32.2 34.3 86
May 26.9 31.8 34.0 85
June 26.7 31.6 33.6 83
July 26.6 31.3 33.3 82
August 27.2 32.0 34.0 76
Septem ber 27.4 32.6 34.4 76
October 2 7 6 33.2 34.9 77
November 26.9 32.1 34.6 83
December 26.3 30.9 33.8 86
Table 2.5. The average daily sunshine hours expressed as a percentage of the eight hours (0800 - 1600) recorded daily in Pelaihari, South Kalimantan, 1981 - 1995.
Month Sunshinehours
%
January 2.8 35.2
February .3.4 42.6
March 3.2 40.1
April 3.7 46.3
May 4.0 49.9
June 4.0 50.6
July 4.8 60.3
August 6.2 76.9
September 5.4 66.9
October 5.0 62.4
November 3.4 42.7
December 2.9 36.7
15
The highest average humidity was 91% in January 1981 and 1984, and the lowest average
was 68% in September (1993, 1994) and October 1994 (Appendix 5).
Daily avaraga tamparatura
Monthly m axim um tamparatura
Avaraga maiomum Highaat mawnum
Figure 2.2 Average daily temperature and monthly maximum temperature recorded at Pelaihari, South Kalimantan, 1981 - 1995.
Solar radiation
Solar radiation for Pelaihari was measured using a Campbell-Stokes solarimeter with its
paper was exposed to sunlight from 0800 - 1600 every day.
16

The brightest months were August and September, and the cloudiest months were
December and January. The highest radiation occurred in August with 76.9% of the eight
hours daily exposure and the least in January with 35.2% (Table 1.5).
Figure 2.3 Monthly average humidity recorded at Pelaihari, South Kalimantan, 1981 1995
1 2 3 4 5 6 7 a 8 10 11 12Month
Figure 2.4 The average daily sunshine (as a percentage of the hours exposed) recorded at Pelaihari. South Kalimantan. 1981 - 1995
17

GEOLOGY
Kintap is included on the 1: 250,000 geological map of the Banjarmasin quadrangle 1 (3"00
- 4"15’ and 114°00’ - 115°30 E.) produced by the Agency for Geological Research and
Development (1986) and is discussed by Sikumbang & Heryanto (1986). The geology of
the study sites is included in the Tanjung Formation, and consists of Tertiary sedimentary
rocks of quartz sandstones, siltstones, claystones and coal, and locally intercalated
limestone. Quartz sandstone has a yellowish-white colour, and contains feldspar and mica
flakes with silica cement. Claystone has a grey colour, shaly in some places, and occurs as
an intercalation in the upper part of the Formation. Coal, black, lustrous and massive, is
intercalated in the lower part. Conglomerate appears as the base, dominated by milky
quartz and other rocks
SOIL
Soil survey
A soil survey was made in cooperation with Mr. Dian Lazuardi, a soil scientist from the
Reforestation Technology Institute Banjarbaru; South Kalimantan. According to Peta
Tematik (1986) the soil in the area of the study plots in the Kintap forest is of the red-
yellow podzolic/lateritic type, which together with latosols and reddish brown lateritic soils
is in the order Ultisol in the Soil Taxonomy System (Sanchez 1976). The Ultisols are
dominant in South East Asia (Dent 1980). A great group of the Ultisols, Typic Paleudults
are the major soils of the lowland dipterocarp forests in East Kalimantan (Ohta e! a!. 1992).
Soil sub-types (Young 1976) which are found at Kintap include pedalfers, hydromorphic
soils and lithosols. Pedalfers are leached soils with free or only slightly impeded drainage.
18

hydromorphic soils have poor drainage and are dominated by mottling with dark grey
colours; and lithosois are shallow or stony soils.
The present soil survey was aimed at identifying the soil heterogeneity in every plot. The
results of the study are shown in table 1.6. Five soil groups were recognized:
Group I : Soil which lacked concretions, granules, mottles and nodules. The clay content
was high and relatively homogenous throughout the profile. Soil layers were diffuse and
the solum deep {>125 cm). This group had two units lA and IB based on the colour. The
former group was reddish brown and occurred in plots 1, 2, 3, 4, 5 and 19; and the latter
was dusky red and occurred in plot 19.
Group II : Soil profile with concretions, nodules and gravels which occurred > 30 cm
depth. The group can be divided into two units : Group IIA, was not gleyed and mottled,
and contained iron nodules and gravel. The soil was reddish brown to red. This unit
occurred in plots 7, 8, 13, 14, 16, 17 and 18. Group IIB, was mottled and gleyed at 50 -
120 cm depth. It also contained nodules and gravel. The colour was red yellow or reddish
brown. In the study plots it occurred in plot 6 on the higher slopes down to the lower
slopes with a high water table.
Group III ; Lithosois which occurred on rocky areas with a mean soil depth of about 10
cm, in plots 13 and 15.
Group IV : Soil with a high water table (up to 40 cm below the surface), gleyed, and
included in the gleysol type. The soil occurred mostly scattered on lower sites in
plots 6, 9 and 10.
Group V : Alluvial, showing an alteration of the unconsolidated accumulating materials,
and occurring at the foot of the steep slopes and riversides. The soil was found in plots 11
and 12.
19

Table 2. 6. Soils on the nineteen SO in x SO in plots at Kintap.
Plot No. Group Soil type
1 1 A Ultisols2 I A Ultisols3 I A Ultisols4 I A UltisolsS I A Ultisols6 IIB. IV Ultisols. Gleysols7 llA Ultisols8 1 A. IIA Ultisols9 1 A, IV Ultisols, Gleysols10 IV GleysolsII I A, V Ultisols. Alluvials12 1 A, V Ultisols, Alluvial13 IIA, III Ultisols, Lithosol14 1 A, IIA UltisolsIS III Lithosols16 IIA Ultisols17 IIA Ultisols18 IIA Ultisols19 I A, IB Ultisols
Soil chemistry and texture
Two surface (0 - 10 cm deep) samples were collected by a trowel from the centre of each
subplot included in each soil group. The samples were analyzed by the staff in the Soil
Laboratory of the Horticultural Research Institute, Banjarbaru, South Kalimantan, and the
methods of analysis are given in Appendix 1.
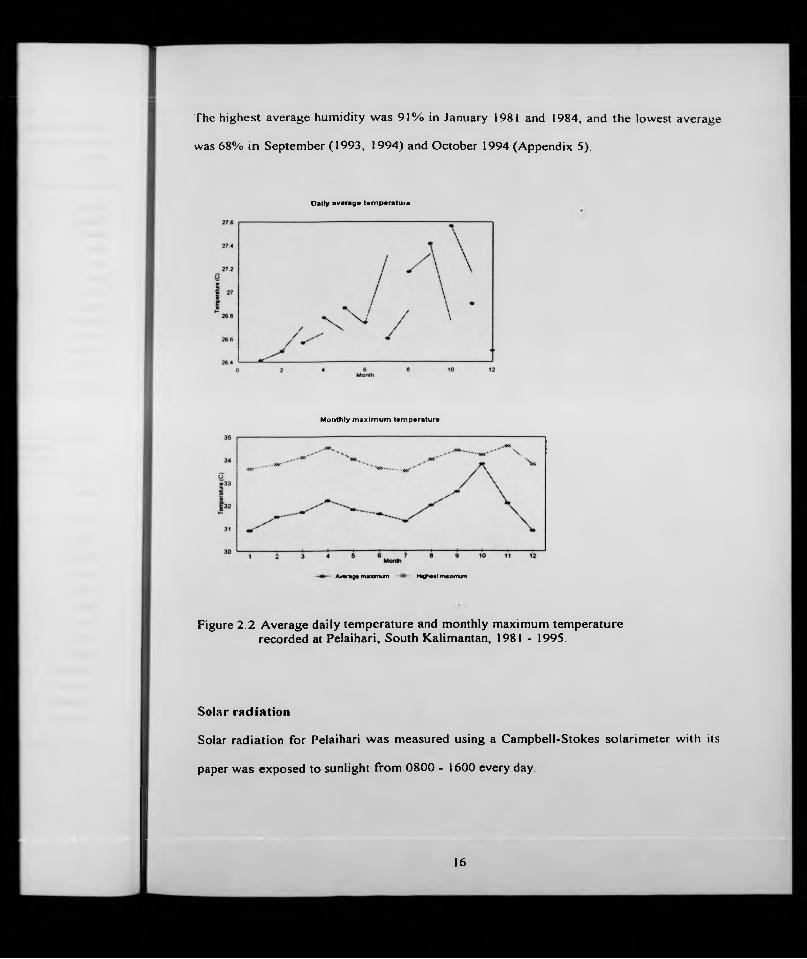
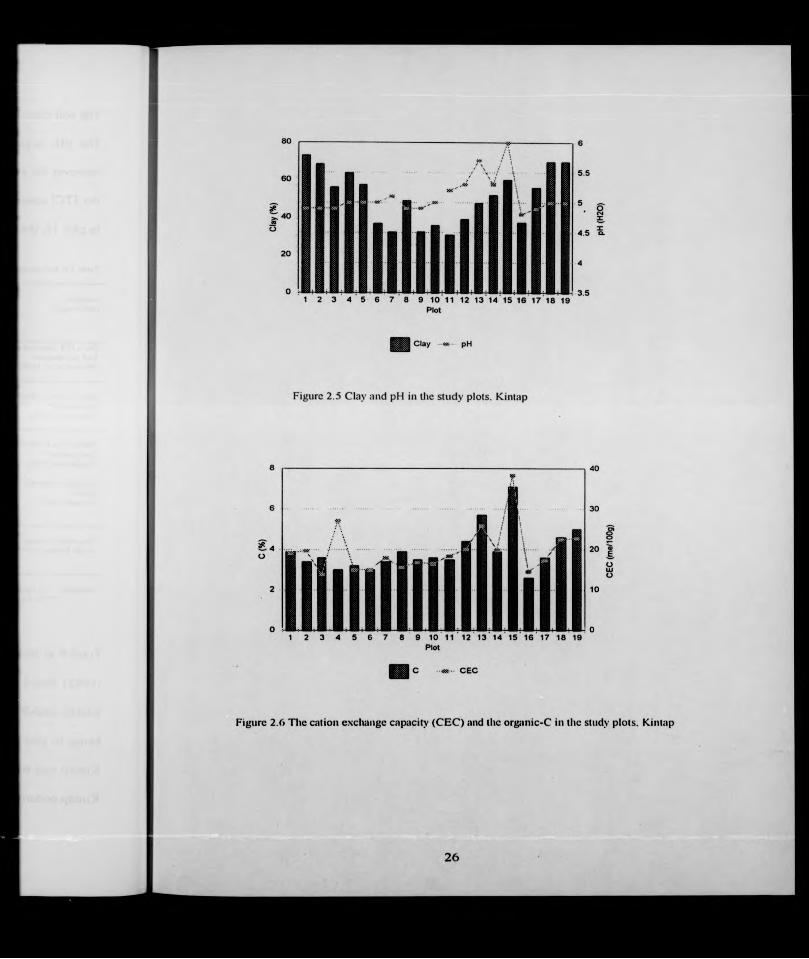
Soil analytical data are given in Table 2.7 (individual values for the replicates are included
in Appendix 8) and Figs 2.5 - 2.8. Most plots had high clay with the highest concentration
20

(80%) occurring in plot 19 in soils of group lA. Forest blocks A (plots 1 - 5) and F (plots
18 and 19) had generally higher clay than Block B, In Block C a high clay content
occurred in plots 14 and 15. Relatively sandy soil occurred in plot 1 1 B (soil group V)
where the samples had about 60% sand (Table 2.7). The soil pH ranged from 4.8 to 6 1
Block C had a higher pH than Blocks A,D,E, and F. The highest pH was in the soils with a
high CEC, and high exchangeable Ca, Mg and K, found in plots 13 and 15 (Figs. 2.5. 2.6
and 2.7). Calcium was high in plots 13 and 15 which also had a relatively high percentage
of organic carbon (Figs 2.6 and 2.7). The CEC generally followed the organic C content
(Fig. 2.6). Available phosphorus was low, ranging from 0.1 to 6.0 ng g"', with the highest
occurring in plot 6 of the podzolic type of group IIB and the lowest in plot 17. The highest
total phosphorus was in plot 15 with 503 pg g'', this plot also had the highest CEC of 38 8
m-equivs/100 g (Figs 2.6 and 2.8). The CEC curve followed the pattern of pH and organic
C curves (Figs 2 5, 2.6 and 2.7). The exchangeable cations were lower in Blocks A, D
(plot 16) and E (plot 17) (Fig. 2.7). Among the blocks. Block C had the highest element
concentrations, particularly in plots 13 and 15.
21


The soil chemical properties in some locations in Kalimantan are shown in Table 18
The pH, organic C and CEC in Kintap were higher than in the other locations,
however the available phosphorus was lower. The total phosphorus was the same as in
the ITCl concession and Barito Ulu. The highest total phosphorus in Kintap occurred
in plot 15, the rocky plot with the lithosol (Tables 2.6 and 2.7).
Table 2.K Soil chem ical propertie.s in som e locations in Kalimantan
Location(Reference)
pH(HjO /K CI)
Organic C(%)
CEC(m -equivs100 g ')
Sum o f exchangeable cations (m - equivi/lOOg)
Availahle-P(h b b ‘)
Total-P(MB b ‘)
Ihe 11 C l concession. East KalimanUin* (Bremen er o/. 1990)
-i.5 -5 .5 (H ,0 )
1 .4 3 -6 .1 4 7.52 - 1S.89 0 .5 6 - 10.15 1 .5 - 3 6 4 50 - 340
Bukit Soehano. East Kalimantan* (O h U cra /. 1992)
5.K -5 .0 (H ,0 )
1 .43 -4 .5 5.99 - 19.99 0.70 - 1.66 50.9 - 80.2 3 2 7 0 - KK90
Barito Ulu, Central Kalimantan** (Prajadinata 1996)
50 years re-g rou lh forestPrimary forest
3.0 -3 .2 (KCI)
3.1 -3 .3 (KCI)
-
8 .2 7 - 10.71
9.42 - 9.96
0.54 - 0 .74
0.46 - 0.52
30 - 40
This study, Kintap. South Kalimantan** 4 .K - 6 .I 2.3 -7.1 1 2 .89 -38 .28 0.49 - 20.82 0.1 1 - 5 99 9 2 -503
Remarks: * A horizon su rfa c e sam ples (0 • 2) • (0 - 10) cm • • 0 • 10 cm s u r fa c e samples
Total-P at Bukit Soeharto was higher than the other locations (Table 2.8) Ohta et at.
(1992) found that soil total-P was correlated with the total-C at Bukit Soeharto. At
Kintap total-P was also generally correlated with total-C with the highest values of both
being in plot 15 (Figs. 2.6 and 2.8). The range in the sum of exchangeable bases at
Kintap was wider than elsewhere and the highest exchangeable cation concentration at
Kintap occurred in plots 13 and 15.
25

r
Plot
I'
K----|Vjy
Figure 2.7 E.Nchitngeable bases in the study plots, Kintap
0
N.300 ra o
1 2 3 4 5 6 7 8 9 10 11 12 13 14 15 16 17 18 19Plot
Avallable-P * Total-P
Figure 2.x The uvuiluble pliospluiru.s (pg g '') ami total phosphorus (pg g ') in the study plots, Kintap
27

CHAPTER 3 SELECTION, HISTORY AND FLORISTIC COMPOSITION OF THE STUDY SITES
INTRODUCTION
The main study plots
Areas of 500 m x 500 m were chosen in each of three Blocks A, B and C, which were
selected from the Hutan Kintap concession (Figures 1.1 and 3.1). Block A was logged
about 2 weeks before the plots were set up. Block B was logged in 1979 and had received
no subsequent treatment, and Block C was logged in 1979 but had received silvicultural
treatment (Table 3.1). The Blocks were notionally gridded into 100 50 m x 50 m plots
Five of these plots were randomly selected within each Block, carefully positioned using
a compass and measuring tapes, and marked with string. They were numbered as follows
plots 1 - 5 were in Block A, 6 - 10 in Block B and 11 - 15 in Block C.
The subsidiary plots
Four Blocks of 50 m x 100 m each had been set up by FINNIDA in another area as a
permanent study site in October 1985. The Blocks were part of the Timber Stand
Improvement (TSl) programme. They were unreplicated and had the following
treatments: (1) lightly thinned forest after logging in 1979 (Block D), (2) heavily thinned
forest after logging in 1979 (Block E), and (3) primary forest control (Block F). Within
each of these plots a new single 50 m x 50 m plot was located randomly along the longer
axis of the original plot and marked out with string. The new 50 m x 50 m plots were
numbered as follows: plot 16 (in Block D); plot 17 (in Block E); plots 18 and 19 (both in
Block F). Brief details of the experimental treatments are given in Table 3.1.
26


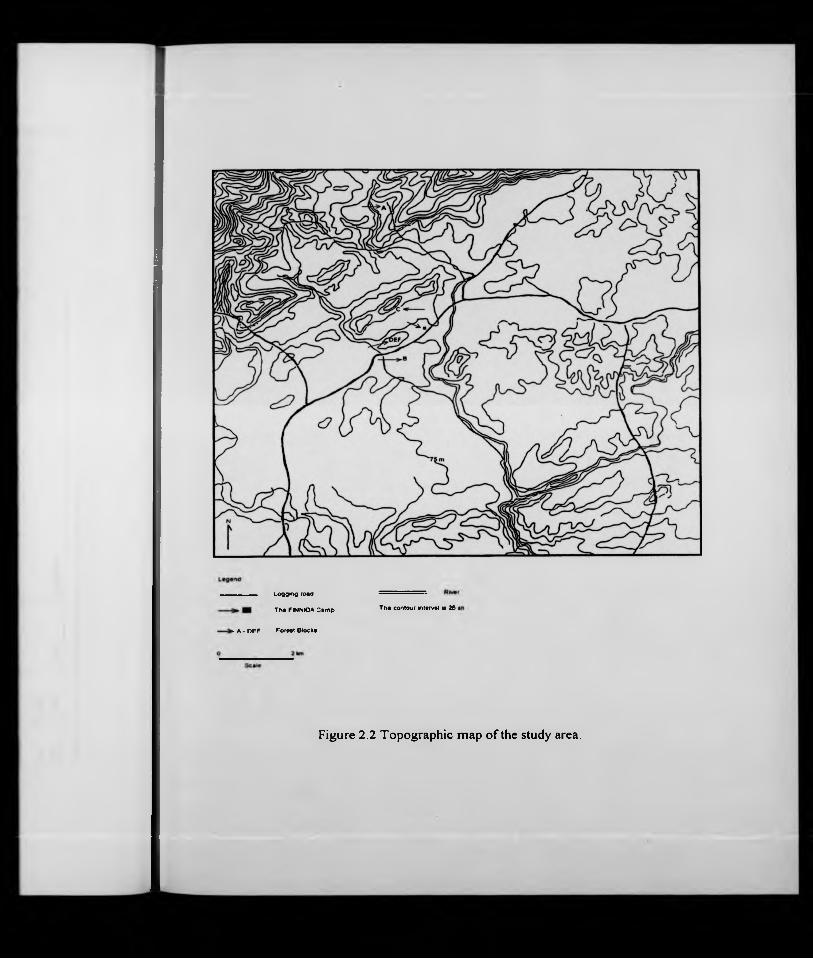
Lofl9^ g road
T l i* FINNICA Camp Tha coTitour mtarval la 26 r
> A • D€F Forast Blocks
Figure 2.2 Topographic map of the study area.

Topography
The plots varied from flat to very steep sloping, with the altitude ranging from 20 m to about
200 m above sea level. Descriptions of each plot are given in Table 3.2.
Table 3.2. Topography of the 50 m x 50 in study plots at Kintap.
Plot No Altitude (in) Slope
1 125 Slightly sloping (< 10°)2 130 Slightly sloping3 190 Partly flat and partly slightly sloping4 145 Sleep slope(>3()° )5 155 Mostly steep slopes and some slightly slopingf) 70 Mostly flat and some parts slightly sloping7 90 Slightly sloping to steep slopes in the middle
8 20 Slightly sloping9 25 Slightly sloping
10 20 Slightly sloping11 35 Partly flat and partly slightly sloping up to 30"12 25 Mostly flat witli a creek rumting inside tlie plot,
small pan slightly sloping
13 45 Mostly steep with small flat area in tlie middle
14 40 Mostly flat with a creek rumiing inside the plot
15 40 Steeply sloping some parts up to 60"16 90 Slightly to steeply sloping17 80 Mostly slightly sloping and with a small pan
steep sloping
18 80 Piinly slightly sloping and partly steep19 70 Mostly flat with a small pan slightly sloping
29

Floristic composition
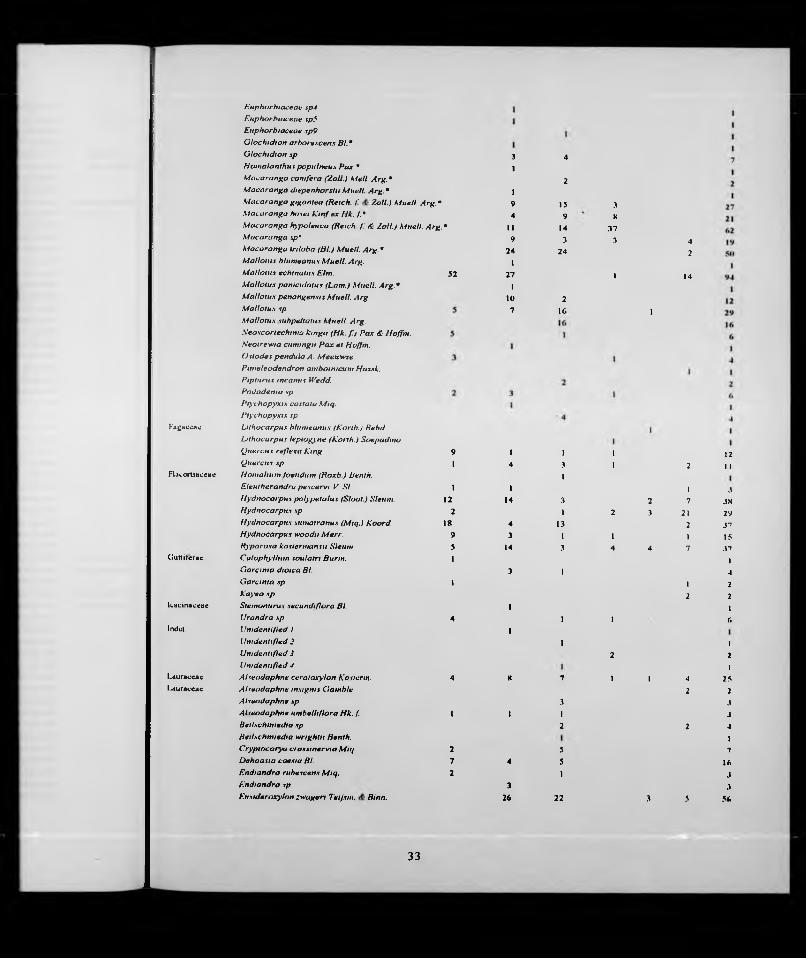
There were at least 305 tree species (> 10 cm dbh) from 49 families in all 19 plots (4.75 ha)
The total number of individuals was 2371, and 95 species were represented by one individual
tree each. The highest number of individuals was for a dipterocarp Shared johorensis with 132
trees (Table 3.3). The Dipterocarpaceae was represented by 21 species of 481 trees (Tables 3 3,
3.4 and 3.5). In all forest Blocks except Block A pioneer species occurred. The pioneers were
represented by 17 species with a total of 172 trees. The most abundant pioneer species were
Macaranga hypoleuca and M triloba (Euphorbiaceae) (Table 3.3). The contribution of the 15
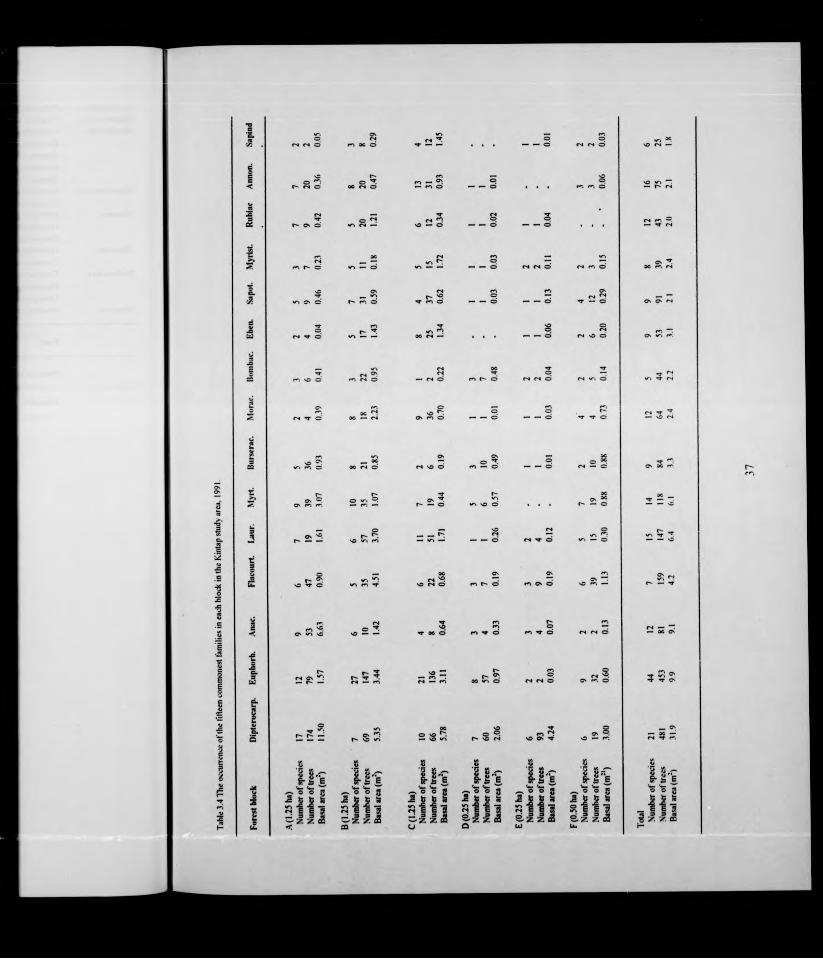
commonest families to the number of species, density and basal area in each Block is shown in
Table 3.4 The Dipterocarpaceae had the highest basal area in every Block with a total of 31 9
(30.1% of the total) in all plots (Tables 3.4 and 3.5). The second highest contribution
differed among Blocks. In Block A the second highest was the Anacardiaceae, in Blocks B, E
and F the Flacourtiaceae and Blocks C and D the Euphorbiaceae
The most frequent dipterocarps (present in all blocks) were Hoped xangal. Shared
lohoremis and S. parvistipulata (Table 3.5). {Shorea parvistipulata was formerly
identified as Shorea fallax in the study area. Both species are hardly distinguishable
from non-fertile herbarium specimens, however since S. fallax has not been recognized
in South Kalimantan (Ashton 1982), the species was identified as 5'. parvistipulata).
The numbers of species, density and basal area varied among plots and forest blocks. In
forest Block A the number of species ranged from 47 to 56, and basal area from 4.8 m̂
to 8.4 m̂ per plot. The total basal area in the plots in this forest block was higher than in
the others, but the number of species (131) was less than forest blocks B (163) and C
(167) in 1.25 ha (Table 3.6).
30

Table 3.3 The tree species and their num bers of ind iv iduals in each Block. Kintap, South Kalim antan. 1991
Family S pec ies B lo c k
Actinidiaceae Saurauia nndiflora DC.Saurauta xp
Alangiaceae Alanf^iuni javam cun i (BI.)A langium .sp
Anacardiaceae B uchanam a arborescensiBl.) B l Buchanania sexsitifoUa Bl.D racontonielon dao (Blanco) Merr. «<• Rolfe G luta renghas L.G luta wallchn (Hook, f.) D ing H ou M angi/era sp M elanochyla eln ien Merr.M elanochyla pulvinervis (Bl.) D ing H ou M elanochyla sp P anxh ia pancijuga Engl.Sw tnionia sp
Annonaceae Cananga odorata (Lamk.) Hk. F. dr Thoms C ananum ¡m orale (L a m k j H k .f. dr Thoms.
M eiogyne m ontana M ttrephora sp O rophea spPolyalthia ceiehica Miq.Polyalthia g lauca Boeri.Polyalthia lateriflora King Polyalthia .spPolyalthia sum atrana K ing Saccopetalum hor.xfieldii Benn Saccopetalum koalsn K os term.Sageraea lanceolata M tq X ylop ia m alayana H k .f. et Th.X ylop ta spA lstonia angustilohaM iq.Ervatam ia m acrocarpa Has.sk.K ibatalia arborea G. D on D urio acutifolius (Mast.) Kosterm.D urio dulcis Beco.D u n a excelsus G nff.D u n o gri/Tithn (M ast.) Bakh.D urio oxleyanus Griff.D acryodes costata (Benn.) Lam D acryodes m acrocarpa (King) Lam D acryodes rostrata (Bl.) Lam Dacry>ode.\ rugosa (Bl.) Lam S a n tin a griffithii (Hook, f .) Engl.S a n tin a laevigata Bl.S a n tin o tom entosa Bl.Tnom a malaccen.se Hook. f.
Celastraceae B hesa pantcula ta Arn.K ookoona reflexa (Laws.) D ing H ou Lophopetalum javan icum (Zolt.) Turcz tx>phopetalum m ultinervium Ridi.
Apocynac«ae
tiomhacaccaeBomhacaceae
Burseraceae
B C D
11 12 2
11 513 2
1 11 1 1
F To ta l
31

L ophopetahon xp \ 4 2Cornacene M axtixia cuxpidata Bl. 2
M axtixia ro.strata Bl. 1M axtixio tnch o to m a Bl. X 1 5
Daiiscace«e O ctom eles .sumatrana KUq. • 1l>illeniaceae D illenta horneenxix Hoogt. 1
D tllem a excelxa (Jack) G ilg 4 4 4D itlenia grand iflora Wall, ex Hk. f . 2
Oipterocarpaceae D ipierocarpux candiferux M err. XD ipterocarpus graciltx Bl. 2 1D ipterocarpux haxseltii Bl. 4 3D ipterocarpus hum eratux S loot. 2H opea dryobalanoidex Miq. 5 1H opea ferrug inea Parijs 2H opea sangal K orth 4 2 1H opea tenuinervula Axhton IShorea fa gue tiana HennShorea hopeifolta (Henn) Syiii. S6 2Shorea johorensis Fox. 29 33 13Shorea laevix R idi. 11Shorea leproxula Miq. I 4Shorea niulti/lora (Burck) Sym. IShorea ovalis (Korth.) Bl. 1 6Shorea parvtfo lia D yer 12 7Shorea parvistipula ta Henn 6 23 20Shorea po lyandra A.thton I 1 6Fatica raxsak (Koerth.) Bl. 33Fatica uinhonata (Hk. f i B urck 2Fatica odorata (Grijf.) Syin. 2
Ehenaceae O ioxpyros beccarli Heirn. IDio.spyros b om eensts Hiern. 1D ioxpyrox buxifolia (Bl.) H iern. 1 1D iospyros curraniop.xix Bakh. 3 10 9D iospyrox densa Bakh. 1 3D iospyros inacrophylla Bl. 3 4D iospyrox andannca (Kurz.) Bakh. 1 4D iospyros paraoensis Bakh. 2Dio.spyros ulo M err. 2
Elaeocarpaceae Elaeocarpux p ierre i K. et F. 1EUeocarpaceae E laeocarpus xp 1
Elaeocarpux stipularix Bl. 2 2Er>1hroxylaceae E rythroxylum cuneatuin (Miq.) Kurz. 1Euphorbiaceae Antidesina ghaesem btla G aertn. 2
A porusa lunata (M tq.) Kurz. 1Aporn.\a xp 3 11 GBaccaurea deflexa sK^uell. Arg. 4 1Baccaurea racenio.sa (Reinw.f M uell. Arg 1Baccaurea .xp 1 12 XBlinneodendron kurzii (Hk. f .) J . J. Sm. 2Bhuììttodendron xp B n d e h a g lauca Bl.C laoxylon p o lo t M crr.C haetocarpux caxtanocarpux (H oxb.) Thw. Cletxranthiis m yna n th u s (H assk.) Kurz. C roton argyratìix Bl. •C roton xp Drypitti/x xpfìndopsunnum dtadcnum (M tq.i A iry ishaw ^ Euphorhtac^ait xp !
32
E u p h o rh ia c e a e sp4
E n p h o rh io c e a e \p 5
E u p h o rb ia c e a e xp9
G lo c h id io n a rh o re s c e n x B i •G lochidion spH om atanthnx populneux Pax. •M ocaranfia conifera (Zoll.) MeH. Arg.*M acaranf(a dw penhorstn MuelL Arg.*M acaranga gigantea (Retch, f. Zoll.) Muetl. Arg.* M acaranga hoset k ’tn fe x Hk. /.*M acaranga hypoleuca (Retch f. «<• ¿oil.) Muelt. A rg .* M acaranga xp*M acaranga triloba (Bl.) Muell. Arg.*M allotux bltimeanux M uell. A tg.M allotux echtnatux Elm.M allo tuxpanictila tus (Lam.) Muell. Arg.*M allotux penangenstx M uell. Arg.M allotux xpM allotux \ubpeltatux M uell. Arg.Neoxcortechtm a kingii (Hk. f.) Pax & Hoffin. Neotrewta ctimtngtt P ax e t Hoffm.O.stodes pendula A. M eeuw se Ptttieleodendron am botnicum Has.xk.Pipturux incanux Wedd.Podadenta xp Ptychopyxtx costata M tq.P tychopyxis .sp
Fagaceac Lithocarpux blum eanux (Korth.) Rehd.Ltthocarpus leptogyne (Korth.) Soepadm o Q uercux reflexa King Q uercux .sp
Flacortiaceac H otnalium foetidum (Roxb.) Benth.Eleutherandra pe.scervt K SI.H ydnocarpux polypeta lus (Sloot.) Sleum.H ydnocarpux xpHydnocarpti.s xumatranux (Mtq.) Koord.Hydnocarpu.s woodii M err.Ryparo.sa koxterman.su Sleum.
Guttiterae C alophyllum .soulath Burm.G arcinta dioica Bl.G arcinta xp Kayea .sp
icacinaceae Stem onurux xecundiflora Bl.U randra .sp
Indct U n id e n t if ie d I
U n id e n t if ie d 2
U n id e n t if ie d S
U n id e n t if ie d 4
[.auractfae A heodaphne ceratoxylon Kosterm.l^auraceae A lseodaphne in.signix G am ble
Alxeodaphne xp A lseodaphne um belliflora Hk. /.Beilxchmiedia .sp Beil.schmiedia wrightit Benth.Cryptocarya cra.s.sinervia Miq.Dehaa.sta caexia Bl.Endiandra ruhexcenx M tq.Endtandra xpEuxideroxylon zwagert Tetjxm. Binn.
52
31
4I
12
19 15 34 9 K
II 14 379 3 3 4
241
24 21
271
1 14
10 27 16 1
9 1 I 1 121 4 3
\1 2 1 1
I 1 1 312 14 3 2 7 JH
2 1 2 3 21 2918 4 13 2 37
9 3 1 1 I 155I
14 3 4 4 7 37
3 I14
1 1 2
12 2
41
I 116
12
12
4 8 7 1 1 41
25
2 23 3
1 1 1 32 2 4
2 517
7 4 5 162 1 3
3 J26 22 3 5 56
33

Lnsea pui\>a Viltae Ltlsea raxb u rg h ii Haxxk.Litsea xpPhoebe o p a c a Bl.
L«cvthiclace«e B a rn n g to m a xpB ertho ile tta exceixa H. e t B. P ianchon ia valida (BL) BL
Leguminose Aharetna tjendana Koxterm.Alhizzia x pCrudia a c u ta de IVitP ia lm m p r o c e m m (Steen.) S tayDialium x pIntxta xpO nnoxia tnacrtxiisca Baker O rtho /ob iu tn bubalmum Jack Parkia xp ecioxa Haxsk.Sindora bn iggem an it de fVit Sindora le tocarpoa B acker e x de Wit
Linaceae C teno lophon parvifoliux Oiiv.Ix)ganiaccac Fagraea cren u la ta M aingay e x ClarkeMda.stomataceae Kibexsia a z u re a DC.Melastomataceae Sdem ecylon coxtatum M iq.
K iem ecylon g lom eratum BL KLemecylon laevigatum BL M etnecylon .xp .U em ecylon sum atrenxe Bakh. P lernandra coerule.xcenx Ja c k
Mcliaceae Agiata a rg e n te a Bl.Agiata d o o k o o Ortff.Agiata eu stderoxylon k'oord. <<■ Val. Agiata g a r tg g o Mtq.Agiata xpAgiata to m en io sa Teijx. Binn. Aphanan iixtx .xp C hixocheton dtvergenx BL D yxoxylum acutangulum M tq D yxoxylum xp M elia xpS a n d o n cu m horneen.xe Miq.
Monimiaceae Ktbara c a r ta c e a (BL) TulaxneMoraceae Artocarpttx antxophyllux Mtq.
A riocarpux dadah Mtq.A rtocarpux elaxttcux Reinw. e x Bl. Artocarpux heterophyllux Laittk. Artocarpu.x in teger (Thunb.) M err. A rtocarpux ke inando Miq.A rtocarpux tnaingayi K ing ArUKorpux n itidux Tree.Ariocarpux rig idux Bl.A n o ca rp u x .xp Fteux .xpFiciix v a r ie g a ta Bl.
Myri^icaceae Myn.xttca a rg en te a Warb M ynxtica m a x im a Warb.Myri.xtica xpG ym nacran thera forbesii (K ing) Warh. Hor.tfieldia ir y a (Gaertn.) Warb.Knema c in e r e a Warh.Knema la t tfn i ta Warb.
2
21
IS1C
2 II 31
1
4
1
1
42 3
34

K nem a woodii Sinclair I 1Mvrsinaceae Ardi.sia lam ponga Aiiq. 1 1
A cm ena acum inatissim a A. P.DC. 1 ,Mvnaceae E ugenia g lom erata K. e t i ’. 5 2 7
E ugenia polycephala Miq. 2 2 4E ugenia .spi K I 1 6 16E ugenia s p io 1 I 2E ugenia s p i I 3 I 4E ugenia sp2 I 3 3 7E ugen ia .sp3 2 3 • I 2 KE ugenia sp4 5 9 1 15E ugenia sp5 K 3 5 2 6 24E ugenia sp6 2 2E ugenia s p “ 9 6 1 16E ugenia .spB I 1 1 3E ugenia sp9 2 2 5 9E ugenia striata K. e t V. 1 1
Olacaceae Ochano.xtachys am entácea Klast. 5 5 3 1 2 16Strombo.sia ja v a m c a Bl. 1 1Strom bosia ceylanica Gardn. 2 2
Polygalaceae Xanthophyllum excehum M iq 1 I 2Pulvgalaceae Xanthophyllum heteropleurum Chodat 4 1 1 1 *T
X anthophyllum sp 2 1 3Proteaceae H elicia robusta (Roxb.) R. Br. ex Wall. 2 2
H elicia sp 8 KRosaceae P runus arborea (Bl.) Kalkm an 1 1
Pygeum parsnflorum T. et B. 1 1Kuhiaceac A dina sp 1 I
Anthocephalu.s chinen.sis (Lauik.) A. Rich. ex Walp. 5 2 7Flectronia sp I 1G ardenia fór.stemana M iq 2 2G ardenia .sp 3 3 6ìxo ra blumei Z. e t M. I 2 3ìxo ra sp 3 7 4 14S a u d e a sp 1 11 2S a u d e a calycina Merr. 1 4 1 6P etunga nucrocarpa DC.R uhiac.xp l Tiittomus sp Trtcaiysia sp
Rutaceae E uodia alba H ock, f.*E uod ia speciosa Reich, f *
Sahiaceae M eliosm a nitida BÌ.Sapindaceae A rythera Uttorahs Bl.
E uphoria spL ansium dom esticum Correa N ephehum m utabile Bl.N ephehum sp f ‘om etta pinnaia For.xt.Spondia s pinnata (L. F .) Kurz.
Sapotaceac / ‘alaquium da.syphyllum (de I ’n e se ) Pierre e x D ubardPalaquittm ferox Bl.Palaqm um m acrocarpum Burck Paiaquium ohovatum Engl.Palaquium obtusifolium Burck.Paiaquium quercifolium (de I ríese) Burck Palaquium ro.vtratum (Miq.) Hurck Paiaquium .%pPa)*ena acum inata (Bl.) Pierre
13
24
35

SaxilragacetieStaphvieacaaeStcrculiaceae
Thyme laeaceae
Tiliaceae
Ulmaceae
Verhenaceae
Vioiaceae
Polyo.sma sp ITurpinia sphaerocarpa Has.sk. 1P terospennum jayanictun Junf^h. 1 IH en tiera javan ica (Bi.) /Co.uenn. 1H enttera .sp IScaphium inacropoduni J. Beinn. 2Sterculia rubigino.sa Kcnr 1A q u ila n a maìaccensi.s Lantk. IG onystylus velutm us A iry Shaw 1Khcrocos f io n d a Burr. 2 •Pentace po lyantha Ha.ssk.Sloanea .sp X 7 IG ironniera nervosa Planch.G ironniera subaequah.s Planch 4 7 4Callicarpa pentandra Roxh. I 1Teysinanniodendron snnplicitotium M err. 1Vitex quinata F.N. Will.R inorea bengalensts (W all.) fJ.K. 6
T u ta l 618 637 591 174 137 214 2371
N u m b er u f species 131 163 167 52 35 X2
Remarloi;
* ' p ioneer species
36

The higher number of species in Blocks B and C was partly due to the occurrence of
pioneers (particularly App) which were lacking in Block A (newly
logged-forest). In the unlogged forest there were few pioneers, i.e. Macaranga triloha
and Macaranga sp (Table 3.3). The presence of these pioneers in the unlogged forest
may be due to the disturbance caused by ironwood (Eusideroxylon zwageri) removal or
the fact that it was a relatively open patch, unlogged because it had no commercial
value.
Table 3.5 'llie occurrence o f dipterocarp species in the study area (total 4.75 ha) b y block (blocks D. E and F were in the s«tmc site and were com bined). Kintap, 1991.
No Species N Basal area (m^) Block A Block B Block C Block D t l
, D ipierocarpus caudiferu.t K 0.112 D. gracilis 3 0.11 - -
3 D. ha.fseitn 7 0.88 - + -4 D. hutneratus 2 0.34 -f . .
5 H opea dryobalanoides 6 0.36 - -
6 H. ferrug inea 2 0.03 • - ♦ -7 H. sangai 10 0.76 + + ♦K H tenuinervula I 0.01 f . . -
9 Shorea faguevana IK 2.04 - - - 4-10 S. hapeifoha 59 4.37 - -1 1 S. ¡ohorensts 131 5.96 ♦ ♦12 S. laevix 11 0.55 . - .13 S. leprosi! la 10 0.21 . -14 S. iniilti/lora I 0.01 ♦ - -
IS S. avails 3« 0.86 ♦ -16 S. parvifolia 54 2.01 + - *17 S. parvistipula ta 72 10.39 ♦18 S. polyandra 9 0.42 •f -19 Italica odorata 1 0.03 - - *20 1' rassak .16 2.36 - -21 uinhonaia 2 0.08 + ■ • ’
Total 481 31.87 17 7 10 10
The Shannon-Wiener diversity and equitability indices were calculated (Clifford &
Stephenson 1975):
H = log N - 1/W log «
where N = grand total of the individuals, s = number of species, n = number of
38


10 and the least in plot 17 (Table 3.6).
Trees of > 50 cm dbh were in higher number in Blocks A and F compared with forest
Blocks B and C, but there were more trees in the 10 - 19.9 cm size class in Blocks B
and C compared with Blocks A and F (Table 3.7, Fig. 3.3). For the data as a whole
3.5% of the trees had a dbh > 50 cm.
Nineteen pioneer species occurred in all the study plots of Blocks B - E (Table 3.8)
Block B had 15 pioneer species with 81 trees, which accounted for the basal area o f 1.9
m̂ (7.6%).
Table 3.7 N um ber o f trees > 10 cm dbh by size class in the plots at Kintap. South K alimantan. 1991
Block
(with the plot a rea in pareiithese.s)
P lot
1 0 -1 9 .9 20 - 29.9
d b h slzr-cluss (n il)
30 - 39 .9 40 - 49.9 > 50
A 1 49 IK 6 9(1.2S ha) 2 100 21 6 5 X
3 81 30 17 12 74 71 18 11 5 85 77 29 10 9 7
Tuliil 378 (61 .2V .) 116 (18.8V .) 50 (8.1V .) 40 (6.5V .) 34 (5 .5V .)
B 6 80 23 8 2 2(1.25 ha) 7 I 17 20 7 2
8 101 27 6 4 49 63 18 4 8 410 99 19 10 4 5
Tutul 460 (72 .2V .) 107 (16.8V .) 35 (5 .5V .) 20 (3.1V .) 15 (2 .4V .)
c 11 99 14 10 3 3(1 .2S ha) 12 K3 15 12 4 3
13 84 26 7 2 314 94 12 5 1 515 70 20 7 2 7
Tutul 43(1 (72.8V .) 87 (13 .7% ) 41 (6 .4 % ) 12 (1.9V .) 21 (3 .3 V .)
D(0.25 ha)
16 I3K 22 5 3 6
E(0.25 ha)
17 95 30 4 2 6
K IK 77 20 6 1 6(0.59 ha) 19 69 16 6 5 8
Tutul 3 7 9 (7 2 .2 % ) 88 (16.8V .) 21 (4 .0 % ) 11 (2 .1 % ) 26 (5.0*>/.)
(•m u tt tutul 1647 (6 0 .3 % ) 3 9 8 (1 4 .6 % ) 147 (5 .4 % ) 83 (3 .0 % ) 96 (3 .5 V .)
40


Table 3.8 The oceurrenee o l'p ioneer species in the plots in B locks B, C , D, and E, Kintap, South Kalimantan.
UUiik Nu Species D ensity Busul ureu (cm^)
B , C roton arg^^ ratux 1 2842 Euodia a lba 1 1293 O eunxia p^niandra 1 974 G lochidion arborexcenx 1 1435 G iochidion sp 3 25706 M acaranga diepenhorxtit 1 1337 M. gigantea 9 19158 M. hoxei 4 7249 M. hypoleucci 11 257310 M acaranga sp 9 233511 M. triloba 24 369412 M allotus blum eanus 1 12513 M. panicula tux 1 19114 M. penangensix 10 147015 N eonauclea calycina 4 2259
Tutul 81 1864 2 (1 .9 in’)
c I Cananga odixJrata 3 6722 C roton arg}’ratux 2 1703 E uodia a lba 2 3344 E. speciosa 1 2935 G eunsia pem andra 1 3506 G iochidion sp 4 16267 M acaranga conifera 2 2178 M. g igan tea 15 28259 M. hypoleuca 23 620110 M acaranga sp 3 55711 M. triloba 24 494812 M allotus penangensis 2 24613 M. suhpeltatus 16 2689
Total 98 21135 (2.1 in ’)
D and E 1 M acaranga gigantea 3 5902 M. hosei 8 10103 M. hypoleuco 37 69444 M acaranga sp 7 7555 M. triloba 2 208
T otal 57 9507 (0.9 in ’)
42

Table 3.9 Shannon diversity and ei|uitability by Block. Kintap, South KalimanUin
Block S huiinoii-W ieiier d iversity in d e x E quitiib llity
A 1.KU21 O.KSl 1
B 1.9627 0.KK72 •
C 1.9S00 0.K9U8
DEF 1.7194 0.K299
Block C
Figure 3.4 Species area curves of non-contiguous plots o f 0.25 ha in each difTerent forest block in the logged-o\ er forest, Kintap. South Kalimantan
Species area-curves of non-contiguous (except the contiguous plots 18 and 19 of Block
F) plots in Blocks A - DEF are shown in Fig. 3.4. The species-area curve followed the
Shannon-Wiener diversity index and equitability by Block (Table 3.9) where the highest
diversity and equitability occurred in Block C and the lowest in Blocks DEF. Higher
curves in Blocks B and C may be partly due to the occurrence of pioneer species (Table
3.8). In Blocks DEF the pioneers occurred especially in plot 16, whereas in plot 17 most
of the pioneers had been removed.
43

■m.— Block A Block B Block C Blocks OEF
Figure 3.5 Riink abundiuice cur\ e of the first twenty species in forest blocks A - DEF. Kintap
Rank-abundance for density of the first twenty species is shown in Figure 3.5 Blocks A and
DEF had a higher density in the first rank than Blocks B and C, and the lowest density in the
first rank was in Block C. The more horizontal curve of the rank abundance in Block C
suggested more evenness of species diversity in this Block as was also indicated by a high
diversity index and equitability. The higher density in the first rank in Blocks A, B and DEF
was due to the density of dipterocarp species, i.e. the density o f Shorea hopeifoha in Block A
and S. johorensis in Blocks B and DEF, whereas in Block C the density in the first rank was for
Macaranf^a Iriloha, the pioneer species (Table 3.10).
44

Table 3.10. R ank-abundance of species by Block, Kintap, South Kalimantan. 1991
B lo c k No S pec ies D en s ity R ank-abundance
1 Shores hopeifo lia 56 4.02 M allo tus echinatus 52 4.03 Valica rasak 35 3.64 Shores Johorensis 29 3 45 Gluta w allchii 27 3.36 D acryodes rostrata 19 2.97 H ydnocarpus sum atranus 18 2.98 M elanochyla pulvim ervis 14 2.69 H ydnocarpus po lypeta lus 12 2.5
10 Shores parvifo lia 12 2.511 Shores laevis 11 2.412 Eugenia sp7 9 2.213 Quercus re flexa 9 2.214 D acryodes rugosa 9 2.215 H ydnocarpus woodii 9 2.21 6 Eugenia sp5 8 2.117 Eugenia s p i 8 2.1' e Sloanea sp 6 2.11S H elicia sp 8 2.120 M astixia trichotom a 8 2.1
1 S hores Johorensis 33 3.52 M allo tus echinatus 27 3.33 E usideroxylon zw ageri 26 3.34 M acaranga triloba 24 3.25 Shores parvistipu la ta 23 3.16 D uho acutifo lius 19 2.97 L itsea sp 15 2.78 Ryparosa kosterm ansii 14 2.69 H ydnocarpus po lypeta lus 14 2.6
10 P alaqu ium dasyphyllum 13 2.611 Baccaurea sp 12 2.512 Aporusa sp 11 2 413 Barring ton ia sp 11 2.414 M acaranga hypoleuca 11 2.415 D iospyros curraniopsis 10 2.316 D acryodes rostra ta 10 2.317 P alaqu ium sp 10 2.318 M allo tus penangensis 10 2.319 Eugen ia sp4 9 2.220 M acaranga gigantea 9 2.2
1 M acaranga triloba 24 3.22 P alaqu ium sp 24 3.23 M acaranga hypoleuca 23 3.1
45

4 E usideroxy lon zw ageri 22 3.1
5 F icu s sp 22 3.1
6 S h o re a parvistipulata 20 3.0
7 M a llo tu s sp 16 2.8
8 M a llo tu s subpeltatus 16 2.8
9 M acaranga gigantea 15 2.7
10 S h o re a Johorensis 14 2.6
11 H ydnocarpus sum atranus 13 2 6
12 P o iya lth ia sp 12 2 5
13 A g la ia sp 11 2.4
14 D ysoxy lu m sp 10 2.3
15 D io sp yros curraniopsis 9 2.2
16 K n e m a cinerea 9 2.2
17 B accaurea sp 8 2.1
18 D ip te rocarpus caudiferus 8 2.1
19 P a la q u iu m obovatum 7 1.9
20 S h o re a poiyandra 7 1.9
OEF 1 S h o re a johorensis 55 4.0
2 M acaranga hypoleuca 37 3.6
3 S h o re a parvilolia 35 3.6
4 S ho re a ovalis 31 3.4
5 H ydnocarpus sp 26 3.3
6 S ho re a parvistipulata 23 3 1
7 S ho re a faguetiana 18 2 9
8 R ypa rosa kosterm ansii 15 2.7
9 M a llo tu s echinatus 15 2.7
10 D aca ryodes rostrata 14 2.6
11 A p o ru sa sp 10 2.3
12 H ydnocarpus polypetalus 9 2.2
13 E usideroxylon zw ageri 8 2.1
14 E u g en ia sp5 8 2.1
15 M acaranga hosei 8 2.1
16 D u rio acutifolius 7 1.9
17 B arring ton ia sp 7 1.9
18 M acaranga sp 7 1.9
19 A g la ia sp 6 1.8
20 E u g en ia sp8 6 1.8
46
CHAPTER 4 THE NEWLY LOGGED FOREST AT KINTAP
INTRODUCTION
The newly logged forest Block A (plots 1 - 5) is the farthest study area from the
FINNIDA camp and ranges from 125 - 190 m compared with the other Blocks which
range from 20 - 90 m (Table 3.2). The area was logged in August 1991, 15 days before
the Block was set up.
This chapter is aimed at describing the situation of a newly logged forest with its soil
disturbance, debris of boles and branches, cut stumps, canopy gaps, and trees uprooted,
bulldozed, and killed or damaged by falling trees.
MATERIALS AND METHODS
The five 50 m x 50 m plots in the newly logged forest (Block A) were recorded in
October 1991 for disturbance using the following criteria: (a) the percentage of area
occupied by roads or other badly compressed soils caused by tractor tracks; (b) the area
of bare, loose soil; (c) the area covered by large litter (debris of branches and logs
>10cm); (d) the area of fine litter (other debris of leaves and branches < 10 cm diameter),
(e) the area of open canopy (i.e. clear sky visible from 1.5 m above the ground); (0
uprooted, bulldozed trees; (g) trees killed by falling trees.
47

RESULTS
The extent of the logging damage to the primary forest can be seen in table 4 1 Skidding
roads and other bare soils occupied 19.3% and large and fine litter occupied 16.9 % of
the logged area. Stumps averaged three in 0.25 ha, which gives an indication of the rate
of felling of the dipterocarps. Uprooted/bulldozed trees were found to average 14 in
every 0.25 ha (56 ha'' ) with the dbh’s ranging from 10-66 cm, but mostly in the 10 - 20
cm class. Trees killed by the falling trees were five in 0.25 ha (20 ha'') with the
diameters ranging from 10 - 80 cm (mostly 10 - 19.9 cm), and they consisted of 13
different species in 1.25 ha. Bulldozed and killed trees altogether averaged 19 in 0.25 ha
(76 ha').
Individual numbers of trees of the residual stands in the newly logged forest ranged from
86 in plot 1 to 147 in plot 3 (Table 4.2). The total number of the individual trees was 618
in 1.25 ha or 494.4 ha''. Trees of diameter class 10 - 19.9 cm had the highest density
with 61.2% and the trees of diameter 50 cm and above had the least with 5.7% (Table
4.2).
Table 4.1 Damage in the live newly logged (50 m x 50 m) plota in Block A , KinUp. O ctober 1991.
Detail
1 2
Plot No
3 4 5
M eans
l.R oad (%) 18.7 10 10.4 10.8 18.8 13.7
2 C)lhcr bare soil (•/©) 8 2.2 1 10.2 6.6 5.6
3. D ebris ‘> IO cm (% )
a. Boles 6 1.7 0.9 4 .5 11.4 4.9
h. Brancltes 6.7 4.1 0.7 2 .8 3.6 3.6
4. O ther debris (% ) 12.1 0.9 3.3 7 .7 17.9 8.4
5.C ut stumps 5 3 6 2.8
O.Canopy gap (5*) 23.4 7.2 1 13 8 32 15.5
7.1 Iprooted / bulldozed 16 5 7 15 25 13.6
•(.Killed by lolled trees 2 1 4 4 15 5.2
48

Table 4.2. Tree (> 10 cm dbli) density in each newly logged plot in Block A. Kintap.
Plot No
10-19.9 20-29.9
Dbli class (cm)
30-39.9 40-49.9 >50
Total
1 49 18 6 9 4 86
2 100 21 6 5 8 140
3 81 30 17 12 7 147
4 71 18 11 5 8 113
5 77 29 10 8 8 132
Total 378 (61.2%) 116 (18.8%) 50 (8.1%) 39 (6.3%) 35 (5.7%) 618
DISCUSSION
The opening (road, other bare soils and soil covered with litter) of 36.2% of the forest
floor (Table 4 1) resulting from the felling and extraction of an estimated 12 trees per ha
in the newly logged area is within the 33 % and 40 % reported by Hutchinson (1980) and
Nicholson (1979). Kartawinata (1974) noted that felling 19.5 trees per ha caused the
damaged area (following log extraction) to be 0.39 ha (39 %). The damage to the soil
caused by skidding was so severe that on many old skidding roads plants did not grow at
all after 2 years, whereas on some others, shrubby species like Eupatonum palle.scens,
Lantcina catnara and many spiny climbers (mostly Rubiaceae) grew, particularly on the
areas exposed to sunlight (pers. observation). The skidding roads that remained bare
mostly occurred on slopes where erosion might have occurred.
49
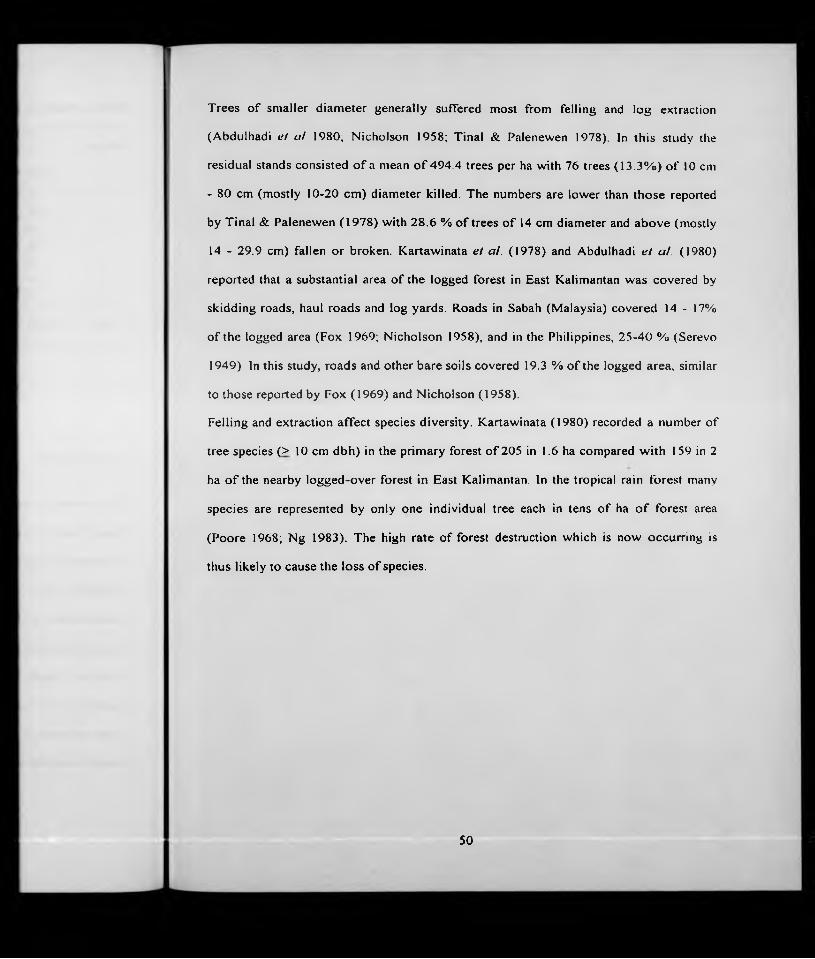
Trees of smaller diameter generally suffered most from felling and log extraction
(Abdulhadi et a! 1980; Nicholson 1958; Tinal & Palenewen 1978). In this study the
residual stands consisted of a mean of 494.4 trees per ha with 76 trees (13.3%) of 10 cm
- 80 cm (mostly 10-20 cm) diameter killed. The numbers are lower than those reported
by Tinal & Palenewen (1978) with 28.6 % of trees of 14 cm diameter and above (mostly
14 - 29.9 cm) fallen or broken. Kartawinata et al. (1978) and Abdulhadi et at. (1980)
reported that a substantial area of the logged forest in East Kalimantan was covered by
skidding roads, haul roads and log yards. Roads in Sabah (Malaysia) covered 14 - 17%
of the logged area (Fox 1969; Nicholson 1958), and in the Philippines, 25-40 % (Serevo
1949). In this study, roads and other bare soils covered 19.3 % of the logged area, similar
to those reported by Fox (1969) and Nicholson (1958).
Felling and extraction affect species diversity. Kartawinata (1980) recorded a number of
tree species (> 10 cm dbh) in the primary forest of 205 in 1.6 ha compared with 159 in 2
ha of the nearby logged-over forest in East Kalimantan. In the tropical rain forest many
species are represented by only one individual tree each in tens of ha of forest area
(Poore 1968; Ng 1983). The high rate of forest destruction which is now occurring is
thus likely to cause the loss of species.
50
CHAPTER 5 GROWTH, MORTALITY AND RECRUITMENT OF TREES AT KINTAP.
INTRODUCTION
The study on tree growth after logging at Kintap is aimed at clarifying patterns of
growth in the logged and unlogged Blocks. It may be expected that despite logging
damage, the growth rate of trees in the newly logged forest will be accelerated because
of reduced competition for light, nutrients or water. Mortality in the newly logged forest
however, may also be higher due to the persistent eftects of logging damage. Damage to
the forest and its rate o f recovery varies depending on the logging intensity. Estimated
recovery times of the logged over forest in East Kalimantan have varied from 5 - 4 0
years (Miller 1981).
MATERIALS AND METHODS
In the newly logged forest (Block A) the diameter of trees was measured in November
1991 and February 1996 (over 51 months), and in the twelve-years old logged forest
(Blocks B, C, D, E) and in the unlogged forest (Block F) in December 1991 and
February 1996 (over 50 months). The measurements were made using a steel tape at 10
cm below the nail of the tag (1.4 m above the ground), but occasionally at 30 cm above a
buttress or stilt root or other protrusion. Boles with lianas were measured with the meter
tape inserted under the liana, or occasionally over the liana if it could not be prised from
the bole. The bark was cleaned by hand before the measurement. A ladder was used to
measure boles with high buttresses.
51

Tree species were grouped based on the Korning & Balslev (1994) classification and on
their maximum height and diameter as recorded in Whitmore ei al. (1989) and in the
Flora Malesiana, i.e. canopy (maximum height > 30 m, maximum dbh > 70 cm),
subcanopy (maximum height 20 - 30 m, maximum dbh 25 - 70 cm) and understory
species (maximum height < 20 m, maximum dbh < 25 cm (30 cm). Mortality and
recruitment were recorded during tree measurement. The annual mortality rate was
estimated by the exponential rate measure (X) derived from the differential equation:
dN/dt = -A.N. The integral of the equation gives the standard exponential model
N, = No e^‘ (Shell & May 1996)
In N, = In No + In (e‘̂ ')
e‘̂ ‘ = exp (-Xt)
In Ni = In No + In [exp(-A.t)], since the exp and In are inverse functions, then
In Nt = In No - Xt
X = 1/t (In No - In N,)
>. = 1/t In (No/N,)
RESULTS
Block A (Newly logged-forest)
Basal area increment of trees varied among plots, ranging from 0.32 to 0.74 m̂ ,
equivalent to a basal area increment of the surviving trees of 10.2% (plot 5) to 17.8%
(plot 1). The difference in percentage increment among plots was significant 0.005)
(Table 5.1).
The growth rate was not simply related to size class and there was a tendency for lower
52
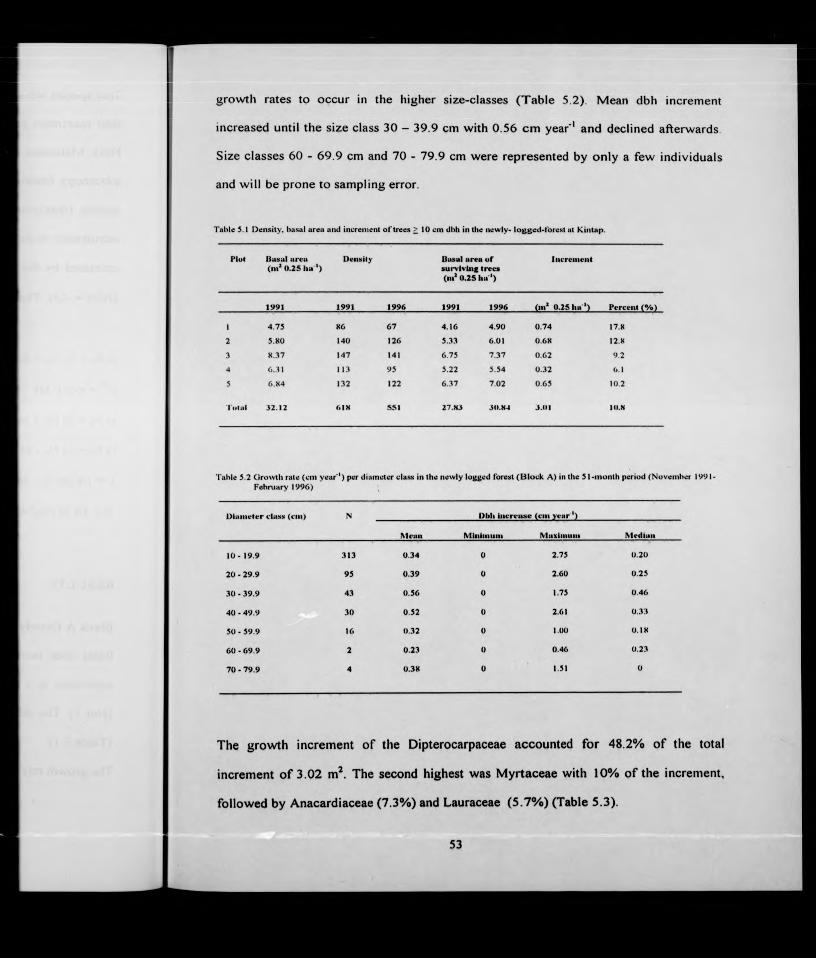
The dipterocarps were represented by 18 species in this Block with a total basal area of
10.56 in 1991, a high proportion of the total basal area of 32.1 even though many
of them had been removed by the logging. All the dipterocarps were of canopy species
with the mean dbh increment ranging from 0.20 cm year"' (Hopea dryohaUwoiJes) to
1.22 cm year'' {Shorea parvifolid). Shorea johoremis was second to S. parvifoUa with
1.05 cm year'' followed by S. laevis 0.40 and Vatica rassak 0.39 cm year'' (Table 5.5).
Shorea hopeifoUa had the highest density among the dipterocarps, followed by I 'atica
rassak and Shorea johorensis. The increment of S. hopeifolia however was relatively
low with 0.31 cm year''. Shorea johorensis and Shorea parvifolia are included in the
”red merantis” of Ashton (1982) and are commonly logged. The other ’’red merantis” in
this Block were Shorea leprosula which had an increment of 0.72 cm year'', and S.
avails with 0.23 cm year''
The proportion of dipterocarps and non dipterocarps for density, number of species,
basal area o f surviving trees and increment in each plot is given in Table 5.4. The
proportion of basal area and its increment for dipterocarps and non dipterocarps is
shown in figure 5.1. Plots 2 and 5 contributed the highest percentage increment of
dipterocarps. Both of the plots had the densest dipterocarps. Some families were present
in all plots including Dipterocarpaceae, Myrtaceae, Anacardiaceae, Flacourtiaceae,
Guttiferae and Burseraceae. The dipterocarps grew fastest in plot 2 where they had an
increment of 67.6% of the original basal area and least fast in plot 1 with 40.5%. Plot 2
included the relatively fast-growing dipterocarps Shorea Johorensis (27 trees) and S.
parvifolia (10 trees).
Canopy species had a mean dbh increment of 0.07 - 1.22 cm year''. The growth of
canopy species had a higher general mean than the subcanopy species and the latter had
a higher general mean than the understory species. Higher growth rate in the canopy
species were well shown by the dipterocarps (Table 5.5). The canopy species of non-
54

dipterocarps ranged from 0.07 - 0.82 cm year'', much lower than the dipterocarp dbh
increment of 0.20 - 1.22. The highest was for Quercus reflexa (Fagaceae) with 0.82 cm
year'', followed by Hydnocarpus wood'd (Flacourtiaceae), Lophopetahim javanicum
(Celastraceae) and Masdxia thchotoma (Cornaceae), each with 0.27 cm year'' (Table
5.5).
Table 5.3 Increment, density and tlie occurrence of 15 families in Block A, Kintap. South Kalimantan, plots 1 - 5.
Family Density(1996)
Increment (in 51 month.s)
Plot
m* (%) 1 2 3 4 5
Dipterocarpaceae 162 1.46 48.2 + + + + +Myrtaceae 35 0.30 9.9 + +Anacardiaceuc 42 0.22 7.2 + + +
Launiceac 17 0.17 5.6 + -Flacourtiaceae 42 0.12 3.9 f
Euphorbiaceae 67 0.11 3.5 + + +
Fagaceae 10 0.09 2.9 - -Dilleniaceae 5 0.07 2.3 + + ■ +
Bombacaceae 6 0.05 1.5 + - -Burseraccae 33 0.04 1.4 + + + +
Meliaceac 5 0.04 1.3 + + -Sapotaceac 6 0.04 1.2 - -f +
Comaceac 9 0.03 0.9 - +
Aiuionaceae 15 0.03 1.1 + -f + +
Myristicaccae 6 0.02 0.7 - + - -
Total 460 3.02
The dbh increment subcanopy species ranged from 0.15 - 0.77 cm year'', and those of
the understorey species from 0.14 - 0.59 cm year''. Some understory species had higher
mean diameter growth than subcanopy and subcanopy species had higher mean diameter
growth than canopy species. However in general canopy species showed higher mean
55
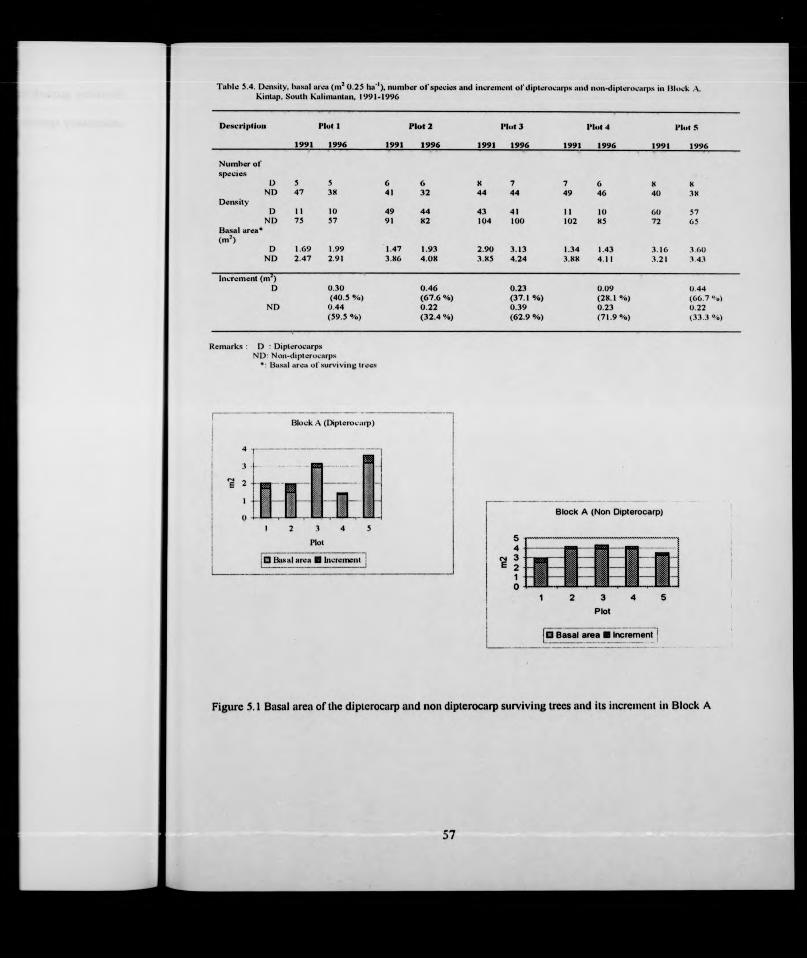

Table 5.5 CrrovMli (cm year'*) o f trees (>5 individuals) in Block A, Kintap, plots 1-5
Species(dipterocarps are asterisked)
N D bh U lerease
M ean MiiUiiiiini M axim uiii M edian
c u n o p V
D acryod€s costata 6 0.07 0 0.30 0.04
Dacry>od€s rostrata 17 0.13 0 0.43 0 10
D acryodes ruj(osa 6 0.11 0 0.53 0.10
Giuta walhchii 20 0.29 0 1.23 0.14
H op«a dryobaianoidtfs* 3 0.20 0.08 0.38 0 20
H ydnocarpus woodii 8 0.27 0.03 0.62 0.28
Lophop^talum javan icum 5 0.27 0 0.58 0.21
M astixia trichototna 7 0.27 0.06 0.46 0 28
M ^lanochyia puivinervis lU 0.23 0 0.72 0.17
Q uercus ruflexa 8 0.82 0.19 2.C9 0.60
S h a r ia hopei folia • 53 0.31 0 0.94 0.25
Shorea johorensis • 25 1.10 0.14 2.56 0.99
Shorea iaevis* 11 0.33 0 0.68 0.33
Shorea parvifotia* 12 1.22 0.32 2.53 1.27
italica rassak* 31 0.46 0 1.48 0 36
CfCiierul m ean U.40
S II b c a n » p y
O ehaasia cansía 6 0.43 0 1.35 0.32
Eujitinia sp i 6 0.77 0.23 1.54 0 73
Eugunia spS 6 0.58 0.09 1.16 0.61
E ugenia sp7 7 0.31 0.01 0.85 0 18
H ydnocarpus poiypetalus 10 0.13 0.02 0.30 0.13
H ydnocarpus sumatranus 11 0.15 0 0.29 0 16
G en e ra l iiieuii Ü.40
U n d c r i l o r c y
H elicia sp 6 0.35 0.17 0.82 0.26
M allotus echinatus 39 0.18 0.01 0.65 0.10
M einecyion laevigatum 6 0.14 0.02 0.38 0.12
Polyaithia sum atrana 5 0.34 0.09 0.67 0.33
Ryparosa kosterm ansu 3 0.39 0.10 1.72 0.24
G en era l m ean 0.32
58

Block B (forest logged in 1979)
Many trees died in plots 7 and 10 between 1991 and 1996 and this may have been
caused partly by the unusually strong wind on 25 January 1994. Most of plot 8 was
burned by a farmer and several trees in plot 9 were illegally cut by local people
Total basal area increment for plots 6 - 10 was 2.38 m̂ (0.46 m̂ ha’'year‘'), or 16.8% of
the total basal area of surviving trees (Table 5.6). This was higher than the percentage
increment in the newly logged forest of 10.8%. The basal area increment ranged from
0.33 - 0.60 m^ with the highest percentage occurring in plots 8 and 9 with 22% and
19.3% respectively. The difference in the percentage increments between plots however
was not significant. Growth rate was independent of diameter size classes as in Block A
and ranged from 0.44 to 0.68 cm year'' (Table 5.7).
The highest family percentage increment was for the Dipterocarpaceae with 0.46 m̂
(19.5 %) in 50 months equivalent to 0.09 m ̂ha"' year''. The increment was much lower
than that of the dipterocarps in Block A (0.27 m̂ ha'' year'').
Table 5.6 D ensity, b a sa l area and increm ent o f trees > 10 cm dhh in Block B at Kinlap. December 1991 - Februarv' 1996.
PlulUuaul u rv u (in’ 0 .2 S h a ') Deii.sity
Baaul u reu o f sui*vivliis trt-ra (in’ U.2S liu ') liivreiiieiit
1991 1991 1996 1991 1996 ni^ (% )
C 3.99 113 lOK 3.73 4.33 0.60 16.1
7 3.74 146 KX 1.84 2.17 0.33 17.9
K 6.56 142 4X 1.64 2.00 0.36 22.0
9 3.01 97 73 2.59 3.09 0.30 19.3
10 5.67 137 102 4.40 4.99 0.59 13.4
Total 2-1.97 637 •120 1-1.20 I6.5K 2.3)t 16.8
59

Table 5.7 G rowth rale (cm year ') |« r diam eter class in the tw elve-years old logged Ibrest (llloek » ) in the 5(J-iiionlh period (D ecem ber 1991- February 1990)
D iu ine ter cluiM
(cm )
N Dbli iiicrciiiv iit (cm y eu r ')
M ean M in im um M uxim um Mcdiuii
10 - 19 9 2K4 0.49 0 2.65 0.31
20 - 29.9 62 0.56 0.01 1.97 0.45
30 - 39.9 19 0.44 0 1.03 0.46
40 - 49 9 12 0.68 0 1 5K 0.71
50 - 59.9 - - - - -
6 0 .6 9 .9 5 0.48 0 0.84 0.52
70 - 79.9 ' 0 46 - - •
The Dipterocarpaceae had only seven species of 68 trees in the study plots in Block B at
the 1991 enumeration, with the total basal area of 1.98 This was much lower than
the total dipterocarp basal area in Block A of 10.94 m̂ . The Euphorbiaceae was second
in the percentage increment with 15.3 %, followed by the Lauraceae and Ebenaceae with
110 % and 5.5 % respectively. The Euphorbiaceae had the highest density with 82 trees,
followed by the Lauraceae (48), Dipterocarpaceae (35) and Myrtaceae (26) (Table 5.8).
The families present in all the plots included the Dipterocarpaceae, Euphorbiaceae,
Lauraceae, Myrtaceae, Moraceae, Sapotaceae, Flacourticaceae, Annonaceae and
Ebenaceae.
Table 5.9 shows the proportion of dipterocarp and non dipterocarp trees for density,
number of species and increment in each plot. The highest increment of the dipterocarps
was for plot 9 with 34% followed by plot 8 with 22.2%. The increment may be related
not only to the density. Plot 9 had the highest density and provided the highest
dipterocarp increment, however plot 8 was less dense than plots 6 and 10 but had a
greater increment. The higher increment in plot 8 may be related to more canopy
60
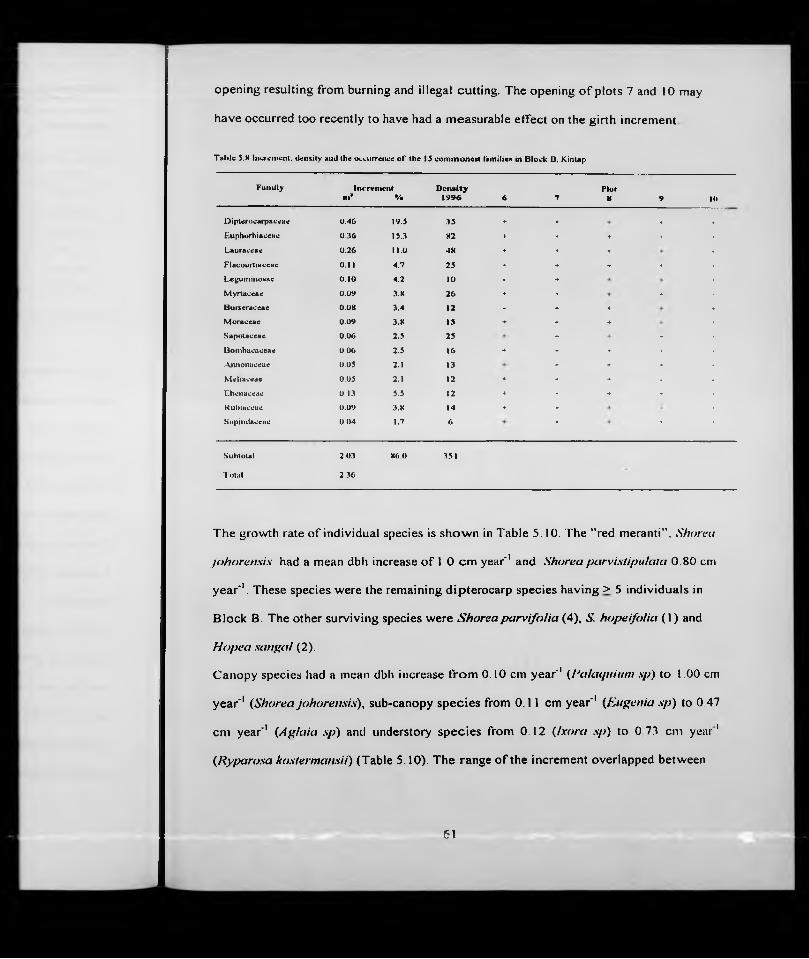
opening resulting from burning and illegal cutting. The opening of plots 7 and 10 may
have occurred too recently to have had a measurable effect on the girth increment
T able 5.H Increm ent, density and the occurrence o f the 15 com m onest families in B lock B. Kintap
Fuinily liu ’reniciit D en s ity PlotIII' % 1996 6 7 H 9 10
Dipterocarpaceutf 0.46 19.5 35 - ♦ 4
Euphurbiuccac 0.36 15.3 X2 > * ♦- •
Lauraceue 0.26 11.0 4X - 4- -
Flacourtiaccae O .ll 4.7 25 - - - ♦
L«gum inosae 0.10 4.2 10 - *■
M yrtaccac 0.09 3.« 26 + ¥ >
Burseraceae O.OK 3.4 12 - * +■ *
M oraceae 0.09 3.K 13 * ■f •f
Sapotaceae 0.06 2.5 25 - -
Bomhacaceac 0.06 2.5 16 - - - -
.Annonaceatf 0.05 2.1 13 - * -
M eliaccae 0.05 2.1 12 - - * -
Ebcnaceac 0.13 5.5 12 + * + ♦
Kubiaccac 0.09 3.K 14 + *■
Sapindaceac 0.04 1.7 6 ■f ’*■
Subtotal 2.03 X6.0 351
lo la l 2.36
The growth rate of individual species is shown in Table 5.10. The ’’red meranti”. Shoreu
johorensis had a mean dbh increase of 1.0 cm year’' and Shoreaparvistipulaia 0.80 cm
year’'. These species were the remaining dipterocarp species having > 5 individuals in
Block B. The other surviving species were ShoreaparvifoUa (4), X hopeifoUa (1) and
Hopea sanfio/ (2).
Canopy species had a mean dbh increase from 0.10 cm year’' {J‘a/aqiiium sp) to 1.00 cm
year’' (Shorea johoremis), sub-canopy species from 0.11 cm year’' {Eugenia sp) to 0.47
cm year’' {Aglaia sp) and understory species from 0.12 {Ixora sp) to 0 7.1 cm year '
{Ryparosa kostermansii) (Table 5.10). The range of the increment overlapped between
61

canopy, sub-canopy and iinderstorey species as in Block A. However the increment in
general also showed canopy species had a higher increment than sub-canopy species
Table 5.9 Densily. ba.sal area (ni*), number o f species and increm ent o l'd ipterocarps and non-dipterucarps in Block U. Kintap 1991-1996
IK 'seriptioii
1991
r io t 6
1996 1991
r io t 7
1996 1991
r io t H
1996 1991
rio t 9
1996 1991
r io t lo
1996
Number o fspecies
D 2 2 3 2 4 3 3 3 3 2ND 51 50 62 38 53 29 44 35 65 53
DensityD 9 7 7 3 21 4 20 13 1 1 8ND
Basal area*106 101 139 85 121 44 77 60 126 95
(m’)D 0.3K 0.49 0.04 0.06 0.26 0.34 0.71 0.88 0.14 0 21ND
Increm ent3.35 3.84 1.80 2.11 1.38 1.66 1.88 2.21 4.26 4.78
(m ')D
ND
O .U(18.3 %)0.49(8 1 .7 % )
0.02 (6.1 %) 0.31(93.9 %)
0.08 (22 .2 */*) 0 .28 (77.8 %)
0.1734.0 %) 0.33(66.0 % )
0.07 ( 1 1.9 %) 0.52(88.1 **0)
Kemarks : D ; Dipterocarp.sNL>: Non dipterocarps
*: Basal area o f surviving trees
r ' ' Block 8 (D pteroca rp )
6 7 8 9 10
PlotB lock B (Non O ipterocarp)
B Basal area a Incramsnt
Figure 5.2 Basal area of the surviving dipterocarp and non dipterocarp trees and its increment in Block B.
62

Table 5.10 G rowth ra te ol trecs (> 5 individuals) in B lock B at Kintap, plots 6 - 10.
Species(asteri.sked are dipterocarp.s)
N Dbli inc rease (cm y e a r ')
M ean M in M ax M ill
C u II u p y
A heodaphne ceratoxylon 6 O.JO 0.12 1.21 0.40D acryodes rostraia 7 0.2K 0.09 0.41 0.23Eu.syderoxyion zwaf^eri 23 0.41 0.06 1.06 0.31G ironm era subattquaalis 6 0.35 0.07 0.78 0.28Palaquium up 5 0.10 0 0.20 0.06Shorea johor^nsix • 17 1.00 0.07 2.02 0.91Shorea parvixtipulata* 11 O.KO 0.33 1.42 0.72
G eiicru l iiieuii 0.47
S u b c a n o p y
Af^iaia xp 6 0.47 0.2X 0.52 0.48Oio.spyrox currniopxis 5 0.35 0.(M) 0.68 0.42D u n o acHttfubos 12 0.29 0.03 1.03 0.24Euf(enia sp4 3 0.11 0.00 0.22 0.09HydnocarpHs poiypeta iux K 0.26 0.05 0.66 0.14
L ii\ea sp 13 0.32 0.00 0.84 0.24
Palaquium dasyphylium 11 0.29 0.02 0.80 0.24
G en e ra l m ean 0.30
G II d e r s t u r e y
Baccaurea sp 5 0.32 0.12 0.51 0.35
Barnnf(tonia sp 6 0.23 0.05 0.41 0.22
txora sp C 0.12 0.00 0.43 0 06
M acaronf(a tn /oha 16 0.35 0.02 0.85 0.35
M ailotus echinatus 13 0.21 0 0 44 0.20
M allotus sp 6 0.13 0.00 0.28 0.12Ryparosa kosterm ansh 6 0.73 O.OX 1.93 0 6 5
G en e ra l iiieaii 0.291
* D ipterocarp species
and, the latter had a higher increment than the understorey species. High growth of the
canopy species was contributed by Shorea pan’islipiilala and S. Johorensis. A canopy
non-dipterocarp species, Alseodaphne ceraloxylon had the highest dbh increase with
0.50 cm year’’, followed by Etisideroxylon zwa^uri with 0.41 cm year''. The ironwood
63

EusiJcroxylan zwciy;eri was the commonest species in Block B, followed by Sharea
johorcnsis and Macaranga triloba (Table 5.10).
Block F (unlogged forest)
The unlogged forest was represented by two contiguous 50 m x 50 m plots Illegal
cutting of one Shorea johorensis and one S. parvifoUa had occurred in plot 19. The total
growth increment of the two plots was 0.65 m^ equal to the increment of 0.31 m̂ ha '
year"' or 6.3 % of the total surviving trees’ basal area (Table 5.11). The growth
increment was less than in Block A of 10.8% and Block B of 16.8%.
Mean dbh increment by size class increased until the 30-39.9 cm class with 0 55 cm
year"' (Table 5 .12). Higher classes had too few individuals to be certain o f other trends.
Tabic 3.11 Density, basal area a n d i;rou lb o f tre c s in Block F, K intap.
1‘lnl D ensity Uusul iircu ( in ')
llusul ureu <»f su rv iv ing tre e s
(ni* 0.25 lin ')
liicm iieiiC
1991 1996 1991 1991 1996 (m ') Percent(•"»)
IK 110 lOK 5.30 5 13 5.4X 0.35 6.K
19 1U4 96 S.42 4.96 3.26 0.29 5.K
Tolul 214 2114 10.72 1U.U9 10.74 0.64 6 J
The Dipterocarpaceae contributed an increment of 0.19 m ,̂ or 39.1% of the total. This
was followed by the Euphorbiaceae with 12.7%, Flacourtiaceae 9.7% and Lauraceae
8.4% (Table 5.13). The Dipterocarpaceae also had the highest mean individual
increment with 121.7 cm .̂ followed by the Burseraceae (34.6 cm*) and Lauraceae (27.9
cm*).
64
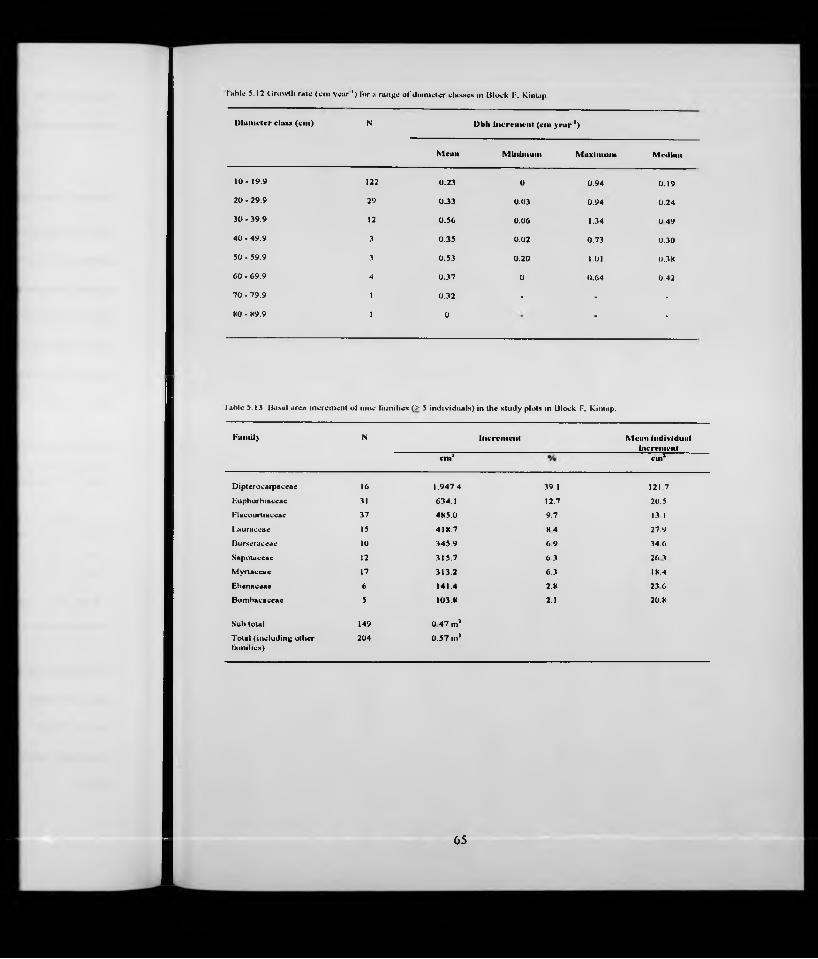
Tahltf 5,12 Cirowth rale (cm year ') liir a range o rd ian ie ler clas.ses in Block T. Kinlap
O iu ine ter class (cm ) N O bh In c rem en t (cm y e a r ')
M ean M in im um M axim uni M edian
1 0 - 19.9 122 0.23 0 0.94 0.19
2 0 -2 9 .9 29 0.33 0.03 0.94 0.24
30 - 39.9 12 0.56 0.06 1.34 0 49
4 0 -4 9 .9 3 0.35 0.02 0.73 0.30
50 - 59.9 3 0.53 0.20 I.OI 0.38
6 0 -6 9 .9 4 0.37 0 0.64 0.42
70 - 79.9 1 0.32 - - -
80 - 89.9 I 0 . .
Tahiti 3.13 Ba.sal area increnitint ot nine I'ainilicN (> 3 individuals) in tlie study plots in Block F, Kinlap.
Fam ily N liic ren ic iit M ean Individual inc rem ent
cm* cm*
Dipterocarpaceae 16 1,947.4 39.1 121.7
F.uphorhiactiae 31 634.1 12.7 20.5
Flacourtiaceac 37 483.0 9.7 13 1
[.auraccae 15 418.7 8 4 27.9
Burstiraceati 10 345.9 6.9 34.6
Sapoiactiae 12 315.7 6.3 26 3
M yrtaceae 17 313.2 6.3 lk.4
Ebcnactiue 6 141.4 2.8 23 6
Bomhacaceae 5 103.K 2.1 20.8
Suh total 149 0 47 m’
Total (including o ther Ihmilitis)
204 0.57 111’
65
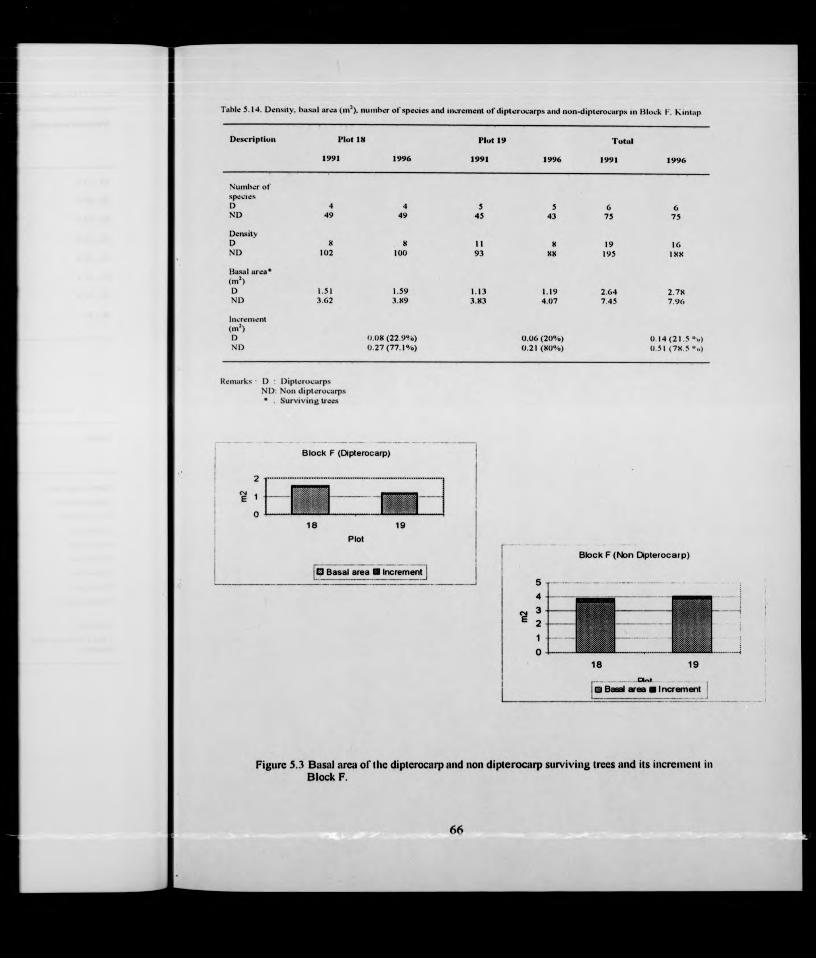


Another liberation treatment in Block E (plot 17) resulted in a higher percentage
increment (22.5%) than the untreated Block D (plot 16) of 18.4% (Table 5.16) The
mean individual dbh increment in plot 17 was 2.77 cm, significantly higher (j) 0.05)
than in plot 16 of 2.07 cm.
Mortality and rccruitiiiciit
Illegal cutting after logging occurred in Block B in plot 6 with 2 trees, plot 8 with 12,
and plot 9 with 4 trees. No illegal cutting occurred in plots 7 and 10, however both these
plots were seriously damaged by windstorms. There had been burning in plot 8 caused
by a farmer, resulting in 94 trees (> 10 cm dbh) dying in addition to the 12 trees
illegally cut. The windstorm also had damaged plot 11 of Block C. Mortality in this
Block therefore is studied in plots 12 to 15 (Table 5.16). The annual mortality varied
among Blocks and among plots in the same Block. It also varied among size classes and
among species groups. The annual mortality in Block A was 0.0270, with the highest in
plot 1 (0.0587) followed by plot 4 (0.0408) and plot 2 (0.0247) (Table 5.17). Plot 1 was
the most disturbed plot in this Block.
Mortality by size classes and species groups in Block A is given in Table 5.18. Mortality
was highest in dbh size-class 10 - 19.9 cm (57.4 %), followed by size class 20 - 29 9 cm
(22.1 %). Canopy species had the highest mortality followed by the understory (Table
5.18). The death of the canopy species mostly occurred in size class 10 - 19.9 cm,
followed by size class 20 - 29.9 and 40 - 49.9. Dead trees in size classes 30 - 39.9 and
above cm were all of canopy species.
In Block F (the unlogged forest) fewer trees died. There were only 2 dead trees in plot
18 and 8 trees (including 2 cut trees) in plot 19. Natural mortality in this Block
69

accounted for 4.7 % of the total density in 1991, with a rate of 0.0115. This is much less
than in Block A (the newly logged forest) of 0.0270
Table 5.17 M onalily and recruilm eni I'rom 1991 - 1996 in plol.s in Blocka A. H and F. Kintap
U lofk/P lot N (1991) M o iiu litvU ei'n iitiiie iit
Nuni her Buaal X N um ber Husul ureau rea (111*)(■»')
N u m b er Basal area
Block A
I 86 19 0.59 22.1 0.0587 17 0.24 25.4 4.902 14U 14 0.47 10 0.0247 12 0.15 9.5 2.503 147 6 1.62 4.1 0.0098 4 0.03 2.9 0.404 11.^ 18 1.09 15.9 0.0408 11 0.07 116 1.265 132 10 0.47 7.8 0.0185 11 0.10 9 1 42
Total 618 67 4.24 11 0.0270 55 0.59 10 1.9
Block B
6 115 7 0.26 16 0.17 14.8 3 97 146 58 1.90 21 0.28 23.9 12.9X 142 94 4.92 2 0.02 4.2 1.09 97 24 2.42 .39 0.51 53.4 16.510 137 35 1.27 29 0.38 28.4 7.6
Tuliil 637 218 10.77 107 1.36 25.S 8.2
Block F
18 n o 2 0.17 1.8 0.0044 .
19 104 8 0.42 7.7 0.0192 2 0 .0 2 2 1 0 4
T otal 214 10 0.59 4.7 0.01 IS 2 0.02 1.0 0.2
Kcmiirks:* Percent oi'individuttl numhcrK 1991
** Percent o f individual numbers and baaal area 1996
The mortality rate in Block C (excluding plot 11) ranged from 0.0059 (plot 13) to 0.03 14
(plot 15) (Table 5.16). The annual mortality ofthis Block was 0.0167, lower than in
Block A and slightly higher than in Block F.
Recruitment varied between sites and between plots within the same site. The plots in
Block B had the highest recruitment, followed by Block A, with 25.5 % and 10 % of the
total surviving individuals. These were much higher than in the plots in Block F with 2.1
% (Table 5.17). The difference however was not significant.
70


which died with a loss of 7.7 % of the basal area and had a recruitment of 2 trees (Table
5.17).
DISCUSSION
Growth increment per unit area in the newly logged forest Block A may depend on the
intensity of logging as well as the composition of trees. Plot 1 had a wide canopy gap
resulting from logging (Table 4.1) and this plot showed a higher growth increment,
whereas the higher increment in plot 2 was due to the abundance of Shorect johoransis
(Table 5.19), a relatively fast growing meranti with the mean dbh increment of 1.05 cm
year ' and a maximum of 2.56 cm year'' (Table 5.5). Plot 5 had wider canopy gaps,
however this plot consisted mainly of Shorea hopaifolia (Table 5,19) having a slow
growth of 0.31 cm year'' An individual highest maximum growth (2.69 cm year'') in
this block was shown by Ouercus reflexci (Fagaceae). The mean diameter growth of this
species was 0.82 cm year'' (Table 5.5).
Among blocks the percentage increment and the mean individual dbh increment of trees
varied among the newly logged forest (Block A), the 12 years old logged forest (Block
B) and the unlogged forest (Block F) (Table 5.20). The difference was significant
(p<0.05), and was shown by Block B against Block F in Tukey’s pairwise comparison
A higher percentage increment in Block B was due to the severe damage caused by the
illegal cutting and burning, resulting in the least basal area of surviving trees of 11.4
m^ha'', compared with 22.3 m^ha'* of Block A and 20.2 m^ha'' of Block F.
72

T able 5.19 Diplerocarp species and num ber o f individual trees (> 10 cm dbli) in the new ly-loeecd Ibrest Hlocfc A. 1991
N i» Species
2
Plot
3 4 5
1 l)ip(er<*carpt4s 22 D hasstfltii 4 .
3 D. hum eratus 1 . I4 H opea dryobatanoide.s 45 H. Manual 3 .
6 H. tenum ervula 17 Shorea hopei/olia . 22 31K S. johorenxi.i 2 27 .
9 S. iaevi.% . 7 31Ü S. leprosula _
11 S. multiflora 1 .
12 S. ovalix .
13 S. parvifoha 2 10 .
14 S. porvixtipulata . 1 315 S. polyandra 116 I'^atica rassak 7 6 I 1917 V. um honuta 2 . .
IX y. odorotu • I'
'I'liiiii I I •49 43 I I 59
Similar results by Miller (1981) indicated that annual diameter growth in heavily logged
forest was significantly higher than in primary forest. In the logged-over forest, the
canopy was more open and competition was less resulting in the acceleration of growth
Growth in the unlogged forest (Block F) was similar to that observed by Lieberman el
at. 1987) in Costa Rica and Korning & Balslev (1994) in Equador, however in the
logged-over forest Blocks A and B the maximum dbh increments were higher The
average increment in virgin and logged-forest reported by Miller (1978) was higher than
in this study (Table 5.20).
Liberation treatment resulted in higher increments in Blocks C and E (Table 5.16)
possibly due to reduced competition. This is in accordance with the result of liberation
thinning following logging reported by Primack e ta ! { \989).
73

Table 5.20. Tlie increment o f trees in Blocks A . B a n d F at KinUp.
B lock N T u tu I in c r e m e n t Ututul u rc u in e r v n ie n t ( in ’ liu '^ y eu r^ )
M c u ii i ii tl iv iilu a l tlh liin c r e m e n t( c m y e a r ')
1991 IVV6 iii^
B lock A CIK 551 3.01 lO.X 0 5 7 0.31
B lock B 6 3 7 420 2 .3 k 16.«* 0 .4 6 0 .3 9
B lock K 214 204 0 .6 4 6.3 0.31 0.25
Remarks; * signiricaiU (p<0.05)
Table 5.21 G row lb rates o f trees in several tropical forest sites
Site Dilli iiic rc iiic iit (linn y e a r ■)
M edian M ax im u m M inim um M ean
Licherman et ai. (I9K7) Selva B io log ica l Station Cojsta R ica
0.35 - 13 .4 1 0 95 - 14.6 0 - 7.3
Koming & BalN lcv(l994) Amazonian E quado r 0.5 - 11.6 1.2 - 20.0 0 - 2.4
M iller (19k 1) rrC l concession . East Kalimanutn.Indonesia V'irgin forest
2.0 - 7 0
IvOgged-forest (6 vears alWr logg ing )
4.1 - 16.0
1'his study Kintap. South Kalimantan
Unloggcd t'oresi (BltK'k F) 0 .0 - 5.2 1.4 - 10.5 0 - 1.5 0.4 - 2.6
Ncwlv logged lt>rcKt (BlockA)
0.2 - 9.3 2 .9 - 26.9 0 - 4 1 0.3 - 10.6
Twelve year-old logged-over tbreKt (B lock H)
0 - lO.I 2 .0 .2 2 .k 0 - 4.9 O.K - 10.9
The different increment per unit size as shown in Blocks A, B and F might not only
depend on the stand basal area but on other factors including site (Primack et a! 1989)
and species composition. The steeply sloping plot 4 in the newly logged forest (Table
3.2) had the least percentage increment (Table 5.1). Plot 5 was also steep but had 55
dipterocarp trees compared with plot 4 with 11 dipterocarps (Table 5.19).
74

Plot 2 had several individuals of Shorea johorensis, a relatively fast growing
dipterocarp. The increment in this plot was relatively high (12.8%), second to the most
disturbed plot 1 which had 17.8% (Table 5.1).
The growth rate of trees in Blocks A, B and F was independent of size class, however
there was a tendency for slower growth to occur in the higher size class (> 60 cm dbh)
(Tables 5.2, 5.7 and 5.12). The Dipterocarpaceae showed the highest growth rate in
every Block. Block A had no pioneer trees, unlike Blocks B and C. The second highest
growth rate in Block A was by the Myrtaceae, and in Blocks B and C the Euphorbiaceae
owing to the presence of fast growing pioneer Macarcwfia species in this family (Table
5.10).
Canopy species generally had a higher mean dbh increment than subcanopy species, and
the latter had a higher mean increment than the understory species.
Mortality and recruitment varied among and within the sites studied It seemed that a
bigger basal area loss promoted more recruitment as indicated by a bigger loss of basal
area in Block B (10.77 m )̂ which resulted in more recruitment than in Block A having
4.24 m ̂basal area loss (Table 5.17). Mortality of the canopy species was higher than the
subcanopy and understory species (Table 5.18).
In primary and old secondary forest, recruitment rate matches mortality (Swaine at a!.,
1987). Studies on mortality and recruitment in the logged-over forests indicated higher
mortality than recruitment. This is in accordance with Manokaran & Kochummen (1987)
and Lang & Knight (1983) that in certain periods of succession mortality exceeds
recruitment. High mortality in the newly logged forest reflects the medium-term effects
of the logging damage.
The total surviving tree basal area in the logged-over forest ranged from about 21 - 25
m̂ ha"', whereas the rate of basal area increment ranged from about 0.31 - 0.57 m̂
75

ha ‘year The least disturbed plot 3 of the newly logged forest had a total basal area of
8.4 (Table 5.1), equivalent to the basal area of 33.6 ha"' which is close to Dawkins
(1958, 1959) ‘pan tropical average’ basal area. It would take up to about 50 years for the
logged-over forest to return to the general total basal area (trees > 10 cm dbh) in the
lowland rain forest of 36 m̂ ha‘‘
76
CHAPTER 6 GROWTH AND SURVIVAL OF SEEDLINGS AND SAPLINGS IN THE LOGGED-OVER FOREST
INTRODUCTION
Growth response of seedlings and saplings following logging depends on canopy opening
and on the species composition. An area dominated by dipterocarps and or pioneer
seedlings and saplings may have higher growth rates in response to the canopy openings.
The species groups (canopy, sub canopy and understory species) may respond differently
to light intensity.
The study aimed to verify the pattern of growth and survival of seedlings and saplings in
the forest plots logged in 1979 or 1991, and compared it with the unlogged forest patches
MATERIALS AND METHODS
Seedling (< 2 m high) heights were measured in a 1 m x 1 m quadrat, randomly set up in
every 10 m x 10 m subplot in each plot of 50 m x 50 m. Sapling heights (> 2 m height - <
10 cm diameter) were measured in every quadrat of 5 m x 5 m randomly set up in a
randomly selected 10 m x 10 m subplot on every 10-m wide strip (arranged north-south) of
the 50 m X 50 m plot (Table 3.1). The total area of seedling quadrats was 25 m ̂ per plot,
and that of sapling quadrats was 125 m’ per plot. All seedlings and saplings were labelled
The enumeration of seedlings and saplings in the newly logged-forest Block A (plots 1 - 5)
was done on 17 December 1991, 20 June 1992, and 11 December 1992 (total 12 months),
and in the rest of the plots (plots 6 - 19) on 20 December 1991 and 18 September 1993
(total 20 months). Mortality was recorded at the same time as the measurements.
77

RESULTS
Seedlings
The numbers of individual seedlings in Block A (newly logged forest) varied between
plots, the highest being in plot 3 with 260 seedlings and the least in plot 5 with 143
seedlings in the first enumeration (Table 6.1). The total number of seedlings in all five plots
was 924 with the average of 185 per plot (in 25 m^), equivalent to a density of 73,920 ha‘‘
The individual mean increase in height growth varied among plots, both in the first and
second six months. The highest mean increase occurred in plot 1, followed by plot 5 and
plot 4, and the least increase occurred in plot 2 (Table 6.1). The difference in the increment
between plots tested by a one way ANOVA was highly significant {jr O.OOl), this was due
to the large difference between plot 1 and the others.
Mortality in the newly logged forest varied among plots with the highest in plot 3 with 36.5
% in the first six months (Table 6.1). The difference in mortality among plots in the newly
logged forest was significant {p < 0.05).
Table 6.1 Height increm ent (cm ) and m ortality (% ) o f seedlings in the new ly logged forest (site A).D ecem ber 1991 - D ecem ber 1992 ( 12 months).
Plot M ean increm ent N Mortality
First six m onths (June 1992)
Second si.\ m onths (Deccm bei 1992)
O verall Decem ber1991
June1992
December1992
June 1992 Decembei1992
Overall(y e a r ')
1 13.1 I2.<> 25 .I*** 150 131 124 12.7 5.3 17.32 2.4 1.5 3 .9 189 152 137 18.5 9.7 26.53 2.K 2.7 4.5 260 173 165 .33.5 4.6 .36 5*4 4.2 4.3 K.4 182 155 151 14.K 2.6 175 4.9 6.9 11.3 143 104 100 27.2 3.K 30.1
G ciierslM ean
5.5 5.5 1U.5 184.8 143 135.4 21.3 5.2 25.5
Remarks: * significant {p<0.0S)*** significant (p<0.00l)
78

Numbers of individual seedlings in the first enumeration (December 1991) varied between
Blocks with the average per plot ranging from 171 (Block C) to 303 (Block F) (Tables 6 1
and 6.2) equivalent to 68,240 to 121,200 ha"'
The mean height increment of seedlings varied among Blocks (Tables 6.1 and 6.2). Block
A had the highest general mean increment of 10.5 cm year'', followed by Block C of 5 4
and Block F, 4.5 cm year''. Growth of seedlings in Block B was low, even lower than the
growth in the unlogged Block F (Table 6.2). The difference of the increment among Blocks
A, B, C and F however was not significant.
The liberation treatment in Block C resulted in a higher {p<0.001) increment (5.4 cm
year ') than the untreated Block B (2.9 cm year''). Plots 16 (Block D) and 17 (Block E) had
been set up to determine the relative effects of intensive liberation (Block E) compared
with light liberation treatment (Block D) (Table 3.1). There was no significant difference
in the mean individual increment between the two plots (Table 6.2). The height increment
and mortality with initial seedling height in Blocks A, B and F are shown in table 6.3. The
increment generally increased with the initial height in every Block except in the unlogged-
forest Block F where the increment declined at the height class 120 - 149.9 cm (Fig. 6.1)
The average annual mortality varied little among Blocks A, B, C and F, ranging from
23.9% (Block B) to 26.6% (Block C) (Table 6.1 and 6.2). Mortality was higher in Block E
(22.2% year'') compared with Block D (16.3% year'').
79


51
46
(9 41
t 36
31
26
21
7 16WX 11
6
15-: 30-59,9 60-89,9 90-119,9 120-149,9 150-179,9
S ize c lass (cm)
> 180
Figure 6 . 1 The initial height size classes ( 1991) of the seedlings and the height increment in Blocks A, B and F.
Increment and mortality of dipterocarps are compared with non-dipterocarps in Table 6.4
There were differences in the average annual increment of dipterocarps between Blocks A,
B and F, with the highest increment in Block A. The difference in the average annual
increment of dipterocarps was highly significant (p<0.00J). The difference was shown
between Block A and the other two Blocks, there was no difference in the dipterocarp
seedling height increment between Block B and Block F, as indicated in the Tukey’s test.
Canopy, subcanopy and understorey species might respond differently to canopy openings.
Table 6.5 shows the increment and mortality of species in these categories by the Blocks A,
B, and F. The species category was primarily based on the species grouping by Korning &
Balslev (1994). The canopy, subcanopy and understory seedlings had the highest increment
in Block A where the understory seedling species had a higher increment than the canopy
and subcanopy seedlings. The understorey species had a much a higher increment in Block
A than in B and F. The difference was highly significant (j)' -0.001) suggesting that81

seedlings of the understory species responded more to the canopy opening than under the
shade in their earlier establishment.
The mortality of the three species categories differed little among the three Blocks (Table
6.5).
Table 6.4 Increm ent (cm year ') a n d mortality (»y. y ea r") ol seedline» o fd ip terocarp . and non dipterocarp» in Block» /t. B and F
Block D iptcrocaipa N on diptcrocarpKN, N, Increment M ortality Ni N , Increment M ortality
A I OK X9 I6.«*** 17.6 816 590 K.9 27.7
B 249 130 3.0 28.7 922 572 2.8 37.9
F 2ÜÜ 100 3.9 30.0 4M 254 4.7 38.2
Rcniiirks: ♦♦♦ signiric:iiit ( p ' 0 .0 0 / )
1 able 6.5 IncTemenl (c m year “) and m ortality (% year ') o l’seedling» o f canopy, subcanopy and under»torey »pecte» tn »tie» A, B and F.
Block
N, N,
C anopy
Incr. Mortl. N,
Sub canopy
N , Incr Morll. N. N ,
1 indcrslory
Incr. Mortl.
A 364 270 9 .2 25.8 213 143 7.0 32.9 270 201 M .2 -** 25.6
B 397 232 3.1 25.0 381 230 2.2 23.8 230 147 3.0 21.7
F 281 144 4 .5 29.3 162 86 4.M 28.1 lOX 71 4.6 20.6
Remarks: *'**signiricanl (p<O.OOI)
The pattern of growth and mortality of the six commonest species is shown in Table 6.6
All the species grew faster in Block A than in Block B, and in Block F the species grew
slightly faster than in Block B except Hopea sa/igal and Xanthophyllum he/eropleiinim.
The dipterocarp species Hopea sangal and Shoreaparvisl/pulaia had a higher increment in
Block A and showed no differences in the other Blocks. This indicates that both species
82
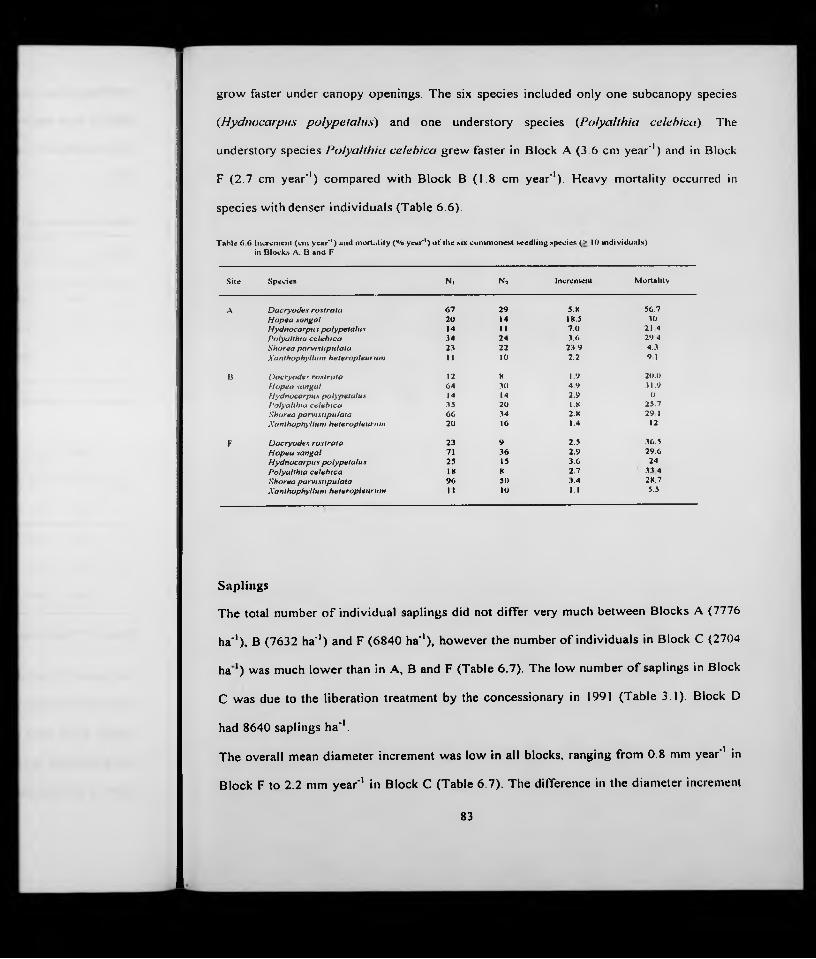
grow faster under canopy openings. The six species included only one subcanopy species
{Hydnocarpus polypelalus) and one understory species {Polyalthia celehica). The
understory species Polyalthia celehica grew faster in Block A (3.6 cm year’’) and in Block
F (2.7 cm year'') compared with Block B (1.8 cm year''). Heavy mortality occurred in
species with denser individuals (Table 6.6).
Table 6.6 Increm ent (cm year*') and m ortality (% year*') o f the nix com m onest seedling species (> 10 individuals) in Blocks A, B and F
Site Sp<ci«& N, N , Increment M ortality
A D acryodes rostrata 67 29 5.K 56.7H opea sangal 20 14 IK.5 30H ydnocarpus polypeta ius 14 II 7.0 2 1 4Polyalthia ce lebtca 34 24 3.6 29 4Shorea parvistipula ta 23 22 23 9 4.3Xanthophyliuni heteropleitn im I I 10 2.2 9 1
B D acryodes rostrata 12 K 1.9 20.0H opea san ta l 64 30 4.9 31.9H ydnocarpus polypetaius 14 14 2.9 0Polyalthta celehica 35 20 l.X 25.7Shorea parvistipula ta 66 34 2.K 29 1Xonthophyllum heteropleuniin 20 16 1.4 12
F D acryodes rostra ta 23 9 2.5 36.5H opea sangal 71 36 2.9 29.6H ydnocarpus po lypeta ius 25 15 3.6 24Polyalthia ce lehica IK K 2.7 33 4Shorea parvistipula ta 96 50 3.4 2K.7Xanthophylliw i heteropleunun I I 10 1.1 5.5
Saplings
The total number of individual saplings did not differ very much between Blocks A (7776
ha''), B (7632 ha'') and F (6840 ha‘‘), however the number of individuals in Block C (2704
h a ‘) was much lower than in A, B and F (Table 6.7). The low number of saplings in Block
C was due to the liberation treatment by the concessionary in 1991 (Table 3.1). Block D
had 8640 saplings ha*'.
The overall mean diameter increment was low in all blocks, ranging from 0.8 mm year'' in
Block F to 2.2 mm year'' in Block C (Table 6.7). The difference in the diameter increment
83
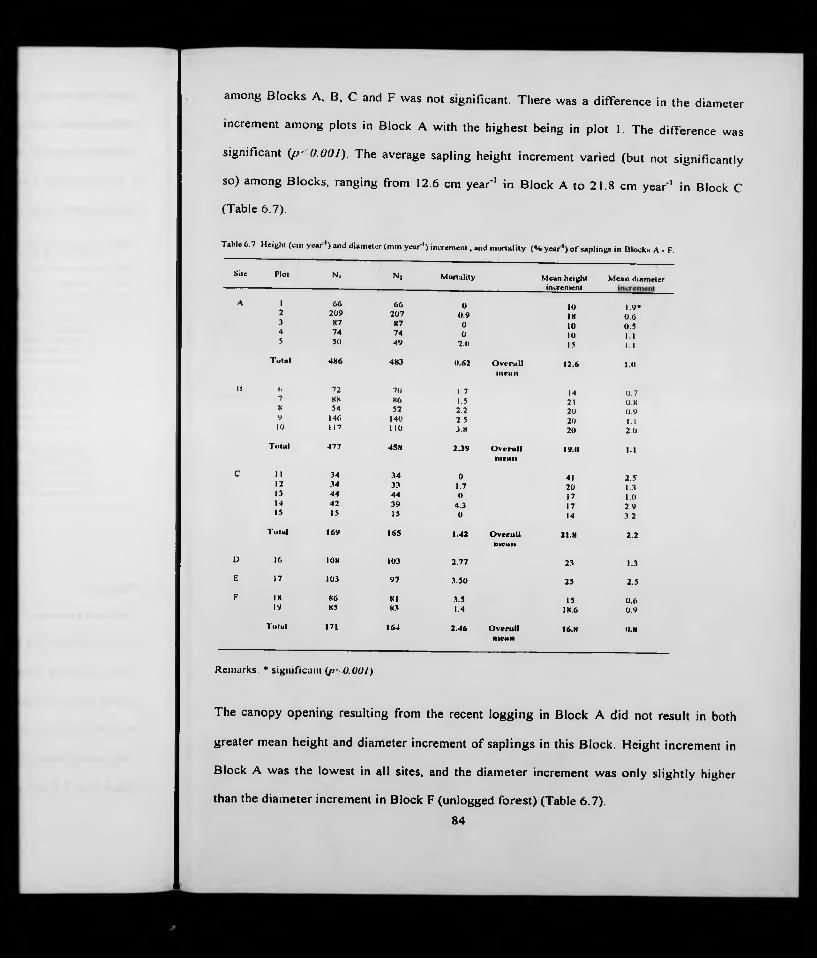
among Blocks A, B, C and F was not significant. There was a difference in the diameter
increment among plots in Block A with the highest being in plot 1. The difference was
significant (jXO.OOl). The average sapling height increment varied (but not significantly
so) among Blocks, ranging from 12.6 cm year'' in Block A to 21.8 cm year ' in Block C
(Table 6.7).
Table 6.7 Height (cm year ') and diam eter (m m year"') inc rem ent, and m ortality (% y e a r ') o f saplings in Blocks A - F.
Site Plot N, N , Mortality M ean height increnient
M ean diameter
A I 60 66 0 10 1.9*2 209 207 0.9 IK 0.63 87 87 0 10 0.54 74 74 0 10 1 15 50 49 2.0 15 1.1
T otal 4X6 4X3 0.62 O veruU 12.6 1.0niesni
It () 72 70 1.7 14 0.77 8K 86 1.5 21 0.8K 54 52 2.2 20 0.99 146 140 2.5 20 1.110 117 110 3.« 20 2.0
T otal 477 45X 2.39 O v e ra ll 19.0 i . in ie u a
c 11 34 34 0 41 2.512 34 33 1.7 20 1.313 44 44 0 17 1.014 42 39 4.3 17 2.915 IS 15 0 14 3.2
TotuI 169 165 1.42 O v e ra ll 21.8 2.2m enu
D 10 108 103 2.77 23 1.3
E 17 103 97 3.50 25 2.5
F IX 86 81 3.5 15 0.619 K5 83 1.4 1K.6 0.9
T o ta l 171 164 2.46 O v era ll 16.H O.Mm ean
Remarks: * sigiiiricanl (p<~O.OOJ)
The canopy opening resulting from the recent logging in Block A did not result in both
greater mean height and diameter increment of saplings in this Block. Height increment in
Block A was the lowest in all sites, and the diameter increment was only slightly higher
than the diameter increment in Block F (unlogged forest) (Table 6.7).84

The mean height increment in plot 17 (Block E) was similar to that in plot 16 (Block D)
however the mean diameter increment in plot 17 of 2.5 mm year"' was significantly
{p<0.001) higher than in plot 16 of 1.3 mm year'' (Table 6.7). The difference indicated a
significant effect of the liberation treatment on sapling diameter increment in plot 17.
Mortality of saplings was ranked Block E > D > F B > A .
The number of dipterocarp saplings varied among Blocks with the highest in Block B (61
saplings) and the least in Block C (8 saplings) (Table 6.8). The low number of dipterocarp
saplings in Block C indicated a faulty liberation treatment (from the concessionary’s
malpractice). Mean height and diameter increment of the dipterocarps did not differ
significantly among Blocks. The diameter growth increment of dipterocarps in Blocks A
and C was higher than non-dipterocarps, whereas in Blocks B, D, E and F it was lower
(Table 6.8) Non dipterocarps in Block B consisted partly of pioneer tree species which
showed higher growth than primary tree species (including dipterocarps) (Table 6.9). There
were twelve pioneer tree species in Block B, mostly Macaranga spp., with an average
height increment ranging from 2 to 53 cm year'' and a diameter increment from 0.3 mm
year'' {Euudia aromatica) to 6.1 mm year'' {Macaranga sp) (Table 6.11). The mortality of
the pioneers was low, with only one tree (out of 67) dying in 20 months (Table 6.9).
In Block B the average height increment of the pioneers (22 cm year'') (Table 6 9) was
slightly lower than that of the dipterocarps (25 cm year'') (Table 6.8), but the average
diameter increment of the pioneers of 2.7 mm year'' was much higher than that of
dipterocarps with 1.0 mm year''. The difference was significant (p<0.0Ul). The height
increment of the pioneer species did not differ much from the shade-bearing species in this
site, whereas the mean diameter increment of the pioneers of 2.7 mm year ' was
significantly (p<O.OOJ) higher than that of the shade-bearing species of 1.1 mm year '
(Table 6.9)
85

Table 6.K G row th increm ent o t'd iptcrocarp and non>dipterocarp aaplinga.
Block Dipterocarps Non>di pterocarps
N, N , H eight increment (cm year'*)
Diameter increment (mm year'*)
Mortality(% year*')
N, N , llcigin increment (cm year’*)
Diameter increment (mm year*')
M ortality (•o year ')
A 30 29 21 1.3 3.33 456 454 13 0.9 0 .44
B Cl cu 25 1.0 1.02 416 398 IK 1.4 2.5K
c 8 8 22 2.4 0 161 157 22 2.0 1.49
D 29 29 29 1.1 0 79 74 22 1.3 3.8
E 27 27 29 2.2 0 76 70 23 2.6 4 .7
F 10 10 17 0.3 0 161 154 17 0.8 2.61
1117 105 21.8 1.3 1.09 1196 1165 17.5 1.2 1.78
Table 6 .9 G rowth increm ent and niorlality o l'p ioneer and prim ary Ibrest species in Block B
Species N, N, M ean increment Mei)^U Diameter (cm year'*) (mm year'*)
M ortality (% year'* )
P ioneer species 67 66 22 2.7*** 0.89
Shade*beanngspecies
410 392 18 1. 1 2.63*
Remarks: •♦ •a ignifcant
The growth of the dipterocarp species in Block B is given in table 6.10. Shorea johorensts
had the highest diameter increment of 1.6 mm year ' followed by S. parvifoUa with 1.3 mm
year"'. Both the species are relatively fast growing dipterocarps, included in i ’/j«rt;a-section
Brachypterae ( Shorea “Red Meranti” group) (Ashton, 1982).
In the unlogged forest (Block F) the height increment of the dipterocarps was the same as
the non-dipterocarps, whereas the diameter increment of the dipterocarps was lower than
86

the non-dipterocarps (Table 6.8). This implies that the diameter growth of the dipterocarp
saplings in the virgin forest was very low.
T able 6 .1 0 Urovvtli iiic icn iciil an d in o rta litv o l 'd ip tc ro e a rp s in lilu c k B.
Species N, N , Diameter increment
(mm year*')
l iei|;lu increm ent (cm year’’)
Dipterocarpus hoxsultii 2 2 1.1 10H opea sa n ta l 10 10 0.7 37Shorea fa lta x 23 23 0.7 14Shorta johorensis 9 8 1.6 43Shorea parvi/olia 17 17 1.3 32
Pioneers in Block B had a higher average diameter (28.4 mm) and height (5.01 m) than
dipterocarps at the first and second enumeration (Table 6.12)
The mortality of saplings was low in all sites. The percentage mortality in Block B (2.39%
year"') did not differ very much from Block F (2.46% year'), both were much higher than
in Block A (0.62 % year') (Table 6.7). The difference in percentage mortality between
Blocks A, B and F however was not significant. The average mortality of dipterocarps per
Block (1.09 % year ') was not significantly lower than that of non-dipterocarps (1.78%
year') (Table 6.8). Pioneer tree saplings had less mortality than primary tree species in
Block B with 0.89 % year ' compared with 2.63 % year' (Table 6.9). The difference in
mortality between the pioneer and the primary species in Block B was highly significant
{ p<0.001). The mortality in Block B (Table 6.7) was wholly of primary species, except in
plot 10 where one pioneer sapling died.
Diameter increment increased with size class in sites A, B and F until the 40 mm class and
then declined at the 60 mm class, whereas mortality occurred particularly for saplings in
87

size class 40 - 59.9 mm and lower. None of the saplings in size class 60 - 79.9 mm and
above died (Table 6.13).
Table 6 .1 1 Growth increm enl and murtiilily o f pioneer tree xpeciex in Block B
N o Species (fam ily) N, N , Increment
Heigjit Diameter (cm year“') (m m year ')
Mortality
(®/o year ')
1 C ananeo oJorata (Annonaceue) 1 1 20 0.5 02 Euodia arom atica tRutaceae) 1 I 27 0.3 03 G eunsia pentandra (V erbenaceae) I 1 33 O.X 04 G lochidion sp (Euphorbiaceae) 3 2 16 1.1 15 H om alanthux popuincu.x (Euphorbiaceae) 2 2 2 1.5 06 M acaranga confetta (Euphorhiaceae) 3 3 13 i . i 07 M. diepenhorstii (Euphorbiaceae) 13 13 26 1.1 0X g igan tea (Euphorbiaccac) 10 10 16 1.0 09 M. hypoteuca (Euphorbiaccae) 2 2 5 I.I 0IÜ M acaranga sp (Euphorbiaceae) 2 2 53 6.1 011 A/, triloba (Euphorhiaceae) M 11 21 l.X 012 M allotus subpeltatus (Euphorbiaccac) IX IX 35 5.x 0
Tutiil 67 66
T able 6.12 C om parison o l'thc average lieighl and d iam eter between dipterocarps and pioneers in Block B in the first enum eration
Description Dipterocarps Pioneers
Height(m)
D iam eter(mm )
Height(m )
Diameter(mm )
M ean 4.04 20.1 5.01 2K.4
M inim um 2.03 5.7 2.04 5.*
M axim um 11.5 76.0 13.6 95.0
M edian 3.76 17.1 4.62 22.K
88

T ab le 6 .1 3 . D iam e te r in c re m e n t (m m y e a r ' ) a n d m o rta lity (% y e a r ') o f sap lings by s ize-cla .ss in l)lock.s A . B an d F.
Size«claüs
(mm)
B lock A Block B Block F
N, N , Incrc-mcnl
Morta-litv
N, N, Increment litv
N, N , Increment
Morta-lllV
10- IV.y 294 293 0.7 0.3 265 255 1.0 2.3 102 9X 0.7 2.4
20 - 39.9 137 136 O.X 0.7 132 124 1.4 3 .6 46 43 0.7 3.9
40 - 59.9 36 35 2.0 2.« 52 51 2.5 1.2 12 12 1.4 0
60 - 79.9 16 16 1.6 0 23 23 2.3 0 9 9 0.9 0
KO-9 9 .9 3 3 1.2 0 5 5 1.3 0 2 2 0.5 0
DISCUSSION
The seedling bank is important in forest regeneration after disturbance. The density of the
seedling stock varies with forest type, soil and topography. In this study seedling density
varied among Blocks and among plots of the same Block. The density of seedlings in the
newly logged forest (Block A) for instance may to some extent be related to topography
since the least density of seedlings occurred on steep slopes in plots 4 and 5 (Tables 3.1 and
6 . 1).
In Block A most seedlings could be derived from the existing seedlings before logging in
August 1990, whereas in other logged-over Blocks seedlings may be derived mostly from
the later recruits (seedlings germinated from the freshly dispersed seeds) after logging 12
years before.
89

The highest increment in plot 1 may be due to one or all of a lower density of trees > 10 cm
dbh (Table 5.1), relatively bigger canopy openings and relatively less disturbed plots (bare
soil in this plot was not very compacted). Plot 2 was also lightly disturbed, but had more
shade after regrowth following an earlier light logging in 1987 (Table 3.1).
The height increment of seedlings was ranked Block A > F > B (Table 6.14). The height
increment in Block A could be due to the canopy opening after recent logging, particularly
in plot 1. The lower increment in Block B than in Block F may due to a stage of forest
T ab le 6.14 D ensity, incremeni and mortality o f seedlings in Blocks A • F.
Block Dcruiily (ha’') . 1991 Increm ent (cm year*') M ortality (•/© year*)
A 73.920 10.5 25.5
a 93.6K0 2.9 23.9
c 6K.240 5.4 26.6
D 47.200 4.1 16.3
E K4.400 5 9 22.2
F 121.200 4.5 25.3
development in this Block after the 1979 logging in which the forest floor was more
shaded. The canopy opening resulting from the liberation treatment in Block C also caused
a significantly higher increment than the untreated Block B. The seedling height increment
increased with the initial height, in accordance with Nicholson (1958b).
The highest mortality in plot 3 of Block A may due to the least disturbance with the least
canopy opening (Table 3.1), having shade and humidity similar to that in the virgin forest
where the seedlings are vulnerable to pathogens (Connell 1989; Turner 1990). Mortality in
all the plots was much higher in the first six months (average 21.3%) compared with the
second six months (5.2%) (Table 6.1). This condition could be related to the humidity
90

December 1991 - July 1992 were wet while August - November 1992 had much less
rainfall (Table 2.1, Fig. 2.2 and Appendices 2 and 6).
The mortality of seedlings among Blocks differed little The least mortality in site D
(16.3%) could be related to the relatively lower density of seedlings (Tables 6.2 and 6.14).
Heavy mortality following the abundance of seedlings could be due to severe competition
Mortality declined with height class (Table 6.3) confirming Turner’s (1990) suggestion that
it was size dependent.
There may be variation among dipterocarp seedlings in their response to canopy opening
(Baur, 1964; Liew & Wong, 1973). Certain seedling species like Shorea mulUfInra keep
growing under the shade on the floor of virgin forest (Turner, 1990). In this study, the
dipterocarp species Hopea sangal and Shorea parvistipulala had much higher increments
than non-dipterocarps in the newly logged forest (Block A) (Table 6.6), whereas in Blocks
B and F the two groups differed little. Both species may need light for their establishment
since the canopy opening in Block A was more than in Blocks B and F.
The understorey species in this study showed more response to the canopy opening than the
canopy and sub-canopy species. The understory species is an important stage for the
pollinating insects to reach canopy-top trees during mass flowering.
Sapling stocking did not differ very much between Blocks except in Block C which had a
liberation treatment. The stocking (excluding Block C) ranged from about 6,800 - 8,600
ha''. In plot 2 of the newly logged-forest Block A the number of saplings was 209 (16,700
ha''). The high number of the saplings in this plot may due to the regrowth after logging in
this plot in 1987 (Table 3.1).
Dawkins (1958) found no increment of sapling growth after logging, whereas Nicholson
(1965) noted the uncertainty of sapling (advance regeneration) growth. The uncertainty of
sapling growth may due to the condition of the logged-over forest. In this study, saplings
91

did respond to canopy openings caused by logging even though the growth was slow Plot I
in Block A had the widest canopy openings, and had the highest sapling diameter growth
within the Block. It was also indicated by a higher diameter increment in the treated Block
C, compared with the other Blocks (Table 6.7). The lower increment of saplings in the
logged-over forest may be due to stronger competition with larger trees which respond
better to the canopy openings.
The growth of the pioneer saplings was higher than that of dipterocarp saplings. Pioneer
saplings were only present in the 12 years old logged-over forest, particularly in Block B,
whereas pioneer seedlings were already scarce, indicating that the role of pioneers was
diminishing at that age (Kuusipalo et al, 1996).
Low growth rates o f saplings in the logged-over forest may indicate a different pattern of
response to canopy openings from that in natural tree fall gaps. Competition of saplings
with larger trees in the natural tree fall gaps may be less than in the logged-over forest
resulting in vigorous gap growth of saplings formerly suppressed under the closed canopy
92

CHAPTER 7 SOIL SEED BANKS
INTRODUCTION
This study is aimed at determining seed bank size and composition in difTerent forest
Blocks at Kintap. The recently logged-over and liberation-thinning Blocks were expected to
have a bigger seed bank size than the unlogged forests owing to the new input when the
canopy was open. It was also expected that the seed bank would consist largely of pioneer
species which would be different from those occurring in mature forest.
MATERIALS AND METHODS
Sampling and shade house observations
Five soil samples of 30 cm by 30 cm and 5 cm deep were collected randomly in each of the
19 50 m X 50 m plots (Table 2.1) plus five samples randomly collected from a skidding
road in plot 1. The sampling was done in all the plots on 23 - 3 1 January 1992 and all the
samples were transferred to a shade house soon after collection. The shade house, situated
in an open area beside the FINNIDA, camp was 8 m long, 6 m wide and 3 m high,
constructed and covered with double layers of black shade cloth. The black shade cloth was
neutral and maintained the balance between red and far red light. Far-red light inhibits the
germination of secondary forest species, on the other hand red light promotes it (V^zquez-
Y^nes 1976, 1980). The intensity of light inside the shade house, measured by a camera
(Nikon F 401 S), was 25% of the outside light.
In the shade house each soil sample was spread on a 23 cm x 33 cm tray containing 5 cm
deep river sand. The river sand was taken from the bed of a c. 1 m deep stream about 50 m
93

from the camp. The number of trays was 20 in five replicates plus five with river sand only,
105 trays in all. The trays were blocked (21 trays placed on each of 5 tables) inside the
shade house. The trays were rerandomized on each table every two weeks. The samples
were sprayed with river water as necessary to keep the soil moist. The seedlings which
emerged were removed after 6 weeks and subsequently every week for 44 weeks. They
were identified in the Herbarium ofi the Forest Research Development and Nature
Conservation Department, Bogor.
RESULTS
Size of seed bank
The size of seed bank ranged from 40 m‘̂ on the skidding road to 1084 m' ̂ in plot 15, and
the density of seeds differed between plots within the same Block and between Blocks
(Table 7.1). Block C had the highest average density of seeds with 616 m' ̂ and site A had
the least density of 151 m"̂ . The difference in the average seed density among Blocks A, B,
C and F analysed by one-way ANOVA was highly significant (p<0.001). Block F (the
unlogged forest) had an average of 280 significantly higher than the average in Block
A {jXO.02).
The number of seeds varied greatly among the plots, ranging from 33 (73 m‘̂ ) in plot 5
(Block A) to 488 (1084 m‘̂ ) in plot 15 (Block C) (Table 7.1). The peak of seedling numbers
germinating occurred in week 14, and declined after that until week 28. In week 35 the
numbers of seedlings germinating increased, and declined again until week 44 (Table 7.2
and Fig. 7.1).
94
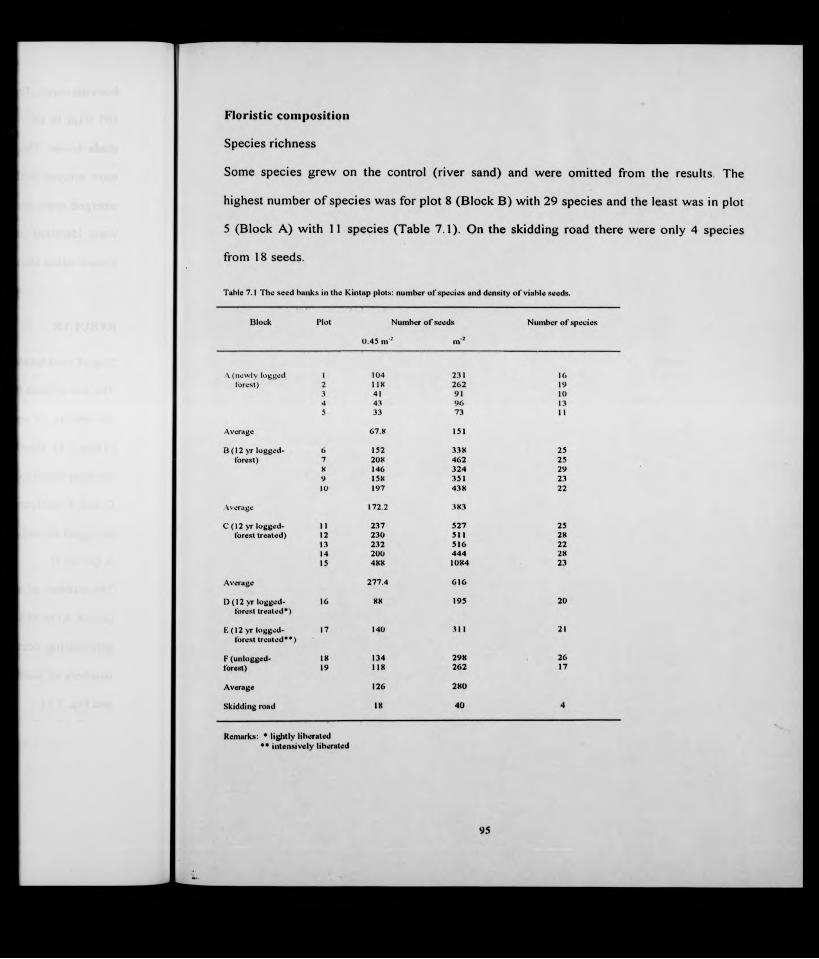

Table 7.2 N um ber ofseedling.s germ inating from the aeed bank alter 7 • 44 weeks
No Lite tbrm Species
1 14
Week
21 28 35 42 44
Total
1 Cira.ss Im perata cyhndrica 2 X X 3 212 Grass C entotheca latifoita 21 13 5 11 3 533 Forb U rena lobata 2 2 3 4 1 14 Forh PoUia thyrdifoha 1 15 Fori) P. sozzogenensts 41 15 16 2 17 X 1 1196 Forb H alopegia blumei 7 11 15 20 10 2 657 Forb Fim bm ttylis quinqueangulanx 1 2 3 6S Forb D rym aria cordata 15 17 10 54 30 3 1299 Forb Blum ea baham tfera 17 12 23 12 5 5 74lU Liana yitix adnata 2 2 4 X1 1 Liana R u b u x sp 2 6 1 912 Liana R. m oluccanux 1 I13 Shrub So lanum torvum 9 3 3 25 14 2 5614 Slirub Ficux fistu loxa 2 215 Shrub M eiaxtom a malabathricum 6X 215 104 276 163 14 X4016 Pioneer Trem a onen ta lix 10 33 11 19 16 5 2 9617 Pioneer P tychopixtx costata 12 2 2 16IX Pioneer Paraxponia parvifolia 1 2 6 919 Pioneer M allotux paniculatux 5 30 3 2 1 4120 Pioneer M acaranga triloba 2 221 Pioneer M acaranga sp 3 322 Pioneer M acaranga hoxni 5 1 2 X 1623 Pioneer H om alanthus populneux 10 X 1 1 2024 Pioneer G lochid ion sp 1 125 Pioneer G lochid ton kollinanianuni 129 65 23 17 12 3 5 25426 Pioneer F icus vasculosa 2 227 Pioneer F. variegata 15 28 39 20 7 1092K Pioneer F icus sp 23 3 2 1 2929 Pioneer F. m elanocarpa 1 1 2 430 Pioneer F. ainpelas 2 3 2 12 2 2131 Pioneer D uabanga nioluccana 18 14 28 14 3 7732 Pioneer C ananga odorata 3 1 5 933 Pioneer C alltcarpa cana 259 346 2 1 60X34 Shade bearing E ugen ia sp 1 4 2 1 X35 Shade bearing B uchanania sessilifoUa 8 22 5 3 3836 U nidentified (M J 1 137 U nidentified [67] 9 93X U nidentified [66] 1 139 U nidentified ¡6S] 1 •40 U nidentified [64] I 141 Unideiititled [63] 1 65 4 2 7242 Unidentified [60] 2 1 1 1 543 Unidentified [ O ] 1 144 Unidentified [33] 18 39 1 1 5945 Unidentified [49] 6 1 746 U nidentified [47] 8 7 4 1 1 2 2347 Unidentified [43] 56 13 29 18 1 164X U nidentified [26] 2 4 1 7
49 Unidentified [32] 3 5 1 9
50 Unidentified [19] 3 2 7 3 15
Total 4K3 748 622 3 7 8 544 273 37 3085
Percentage o f•p«cie» prenent 26 68 8Ü 70 62 26 20
96
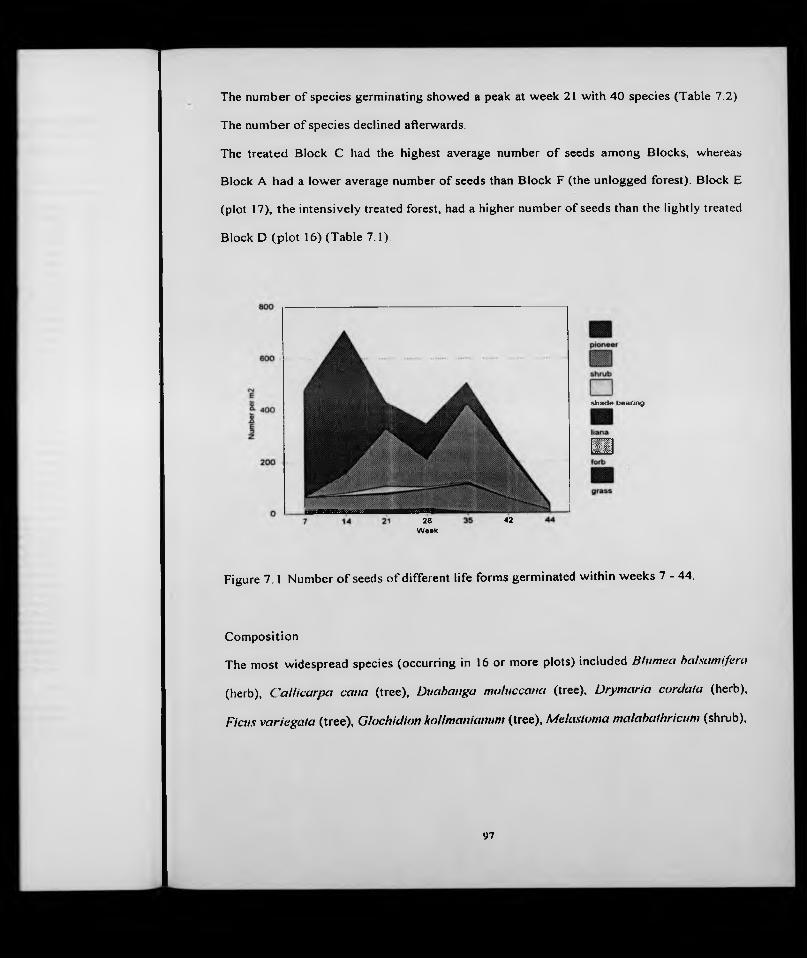
The number of species germinating showed a peak at week 21 with 40 species (Table 7.2).
The number of species declined afterwards.
The treated Block C had the highest average number of seeds among Blocks, whereas
Block A had a lower average number of seeds than Block F (the unlogged forest). Block E
(plot 17), the intensively treated forest, had a higher number of seeds than the lightly treated
Block D (plot 16) (Table 7.1).
28We«k
4 2
shade bearing
□
Figure 7.1 Number of seeds of different life forms germinated within weeks 7 - 44.
Composition
The most widespread species (occurring in 16 or more plots) included BIwnea halsumiferct
(herb), CaUicarpa cana (tree), Duahanga moiuccanci (tree), Drymaria cordata (herb).
Ficus variegaia (tree), Glochidion kollmcmianum (tree), Melasloma malahalhricum (shrub).
97

Table 7.3 Deivsily. trequency and the C over Value Index (CV I) ol'speuiea preaented ax xeed hanks in all plots the CVI is calculated as the sum ol'relative density (RD ) and relative frequency (R F ) (Cox 1967)
No Species D F RD RF CVI
1 B lu m e a h a ls a m ifè ra 74 16 2.40 4.09 6.492 B u c h a n a n ia s u tts il ifo lia 38 12 1.23 3.07 4.303 C a il ic a rp a ca na 608 16 19.71 4.09 23.804 ( 'a m in a o o J o ro ta 9 5 0.29 1.28 1.575 C e n to th c c a la lifo h a S3 14 1.72 4.58 5..306 D r y m a n a c o rd a ta 129 17 4.18 4.35 k.537 D n a h a n f ia m o lu c c a n a 77 17 2.5 4.35 6 848 i i i ta e n ia sp 8 5 0.26 I.2K 1.549 F\ f ix tu lo x a 2 1 0.06 0.26 0.3210 F . m e la n o c a rp a 4 4 0.13 1.02 1.1511 F. v a r ie g a ta 109 16 3.53 4.09 7.6312 F. v a xcu lo sa 2 2 0.06 0.51 0.5K13 F ic u s a tn p e la s 21 8 0.68 2.05 2.7314 F ic u s sp 29 8 0.94 2.05 2.99IS F im b n s ty U s q m n q u e a n ^ u la n s 6 4 0.19 1.02 1.2216 G lo c h id io n k o llm a n ia n u m 234 18 8.23 4.60 12.8417 G lo c h id io n sp 1 1 0.03 0.26 0.2918 H a lo p e g ia b ium e i 63 16 2.11 4.09 6.2019 H o m a la n th u s po p u ln e u s 20 10 0.65 2.56 3.2120 Im p e ra ta c y lin d r ic a 21 10 0.68 2.56 3.2421 M . t r i lo b a 2 1 0.06 0.26 0.3222 M a c a ra n ^ a hose i 16 6 0.52 1.53 2.0523 M a c a ra n g a sp 3 1 0.10 0.26 0.3524 éU a llo tus p a n ic u la tu s 41 13 1.33 3.32 4.6525 M e la s to in a m a la b a th n c u m 840 19 27.23 4.86 32.0926 P. th y rd ifo h a 1 1 0.03 0.26 0.2927 P a ra s fH jm a p a r v ifo l ia 9 2 0.29 0.51 0.8028 P o lh a sozzogenensis 119 18 3.86 4.60 8.4629 P ty c h o p y x is c o s ta ta 16 4 0.52 1.02 1.5430 R u bu s m o lu ccan u s 1 1 0.03 0.26 0.2931 R u h u s s p 9 4 0.29 1.02 . 1.3132 S o la n u m to rv u m 36 13 I.K2 3.84 5.6533 T re m a o r ie n ta lis 96 17 3.11 4.35 7.4634 U n id e n t if ie d [1 9 ] 15 7 0.49 1.79 2.2X35 U n id e n t if ie d (3 o J 7 3 0.23 0.77 0.9936 U n id e n t if ie d ( 4 3 ] 116 15 3.76 3.X4 7,6037 U n id e n t if ie d [ 4 7 ] 23 11 0.75 2.KI 3.5638 U n id e n t if ie d [ 4 9 ] 7 4 0.23 1.02 1.2539 U n id e n t if ie d [S 3 ] 39 12 1.91 3.07 4.9840 U n id e n t if ie d [S S ] 1 1 0.03 0.26 0.2941 U n id e n t if ie d [ 6 0 ] 3 3 0.16 0.77 0.9342 U n id e n t if ie d [ 6 3 ] 72 10 2.33 2.56 4.8943 U n id e n t if ie d [ 6 4 ] 1 I 0.03 0.26 0.2944 U n id e n t if ie d [6 S ] 1 I 0.03 0.26 0.2945 U n id e n t if ie d [ 6 6 ] 1 1 0.03 0.26 0.2946 U n id e n t if ie d [ 6 7 ] 9 6 0.29 1.53 I.K347 U n id e n t if ie d [6 H ] 1 1 0.03 0.26 0.2948 U n id e n t if ie d i:2 J 9 4 0.29 1.02 1.3149 U re n a lo b a ta 11 6 0.36 1.53 1.8930 I ' i t is a d n a ta 8 3 0.26 0.77 1.03
Follia sozzogemnsis (herb) and Trema orientalis (tree) (Table 7.3). The highest density
occurred for Meiastoma malahathrica (840 seeds), followed by Callicarpa cana (608),
Glochidion koUmamanum (254), Drymaria cordata (129), Follia sozzogenensis (119) and
Ficus variegata (109). Shade bearing species present in the seed bank were Buchanania
98

sessilifolia and Eugenia sp. The former species had 38 seeds occurring in 12 plots, and the
latter had eight seeds in 5 plots. Imperata cylindrica, the outstanding component of the
degraded Imperata grassland, was present in 10 plots with 21 seeds, including plots 18 and
19 of the unlogged forest (Table 7.3 and Appendix 9).
Life form
The identified species were in seven life forms (Table 7.4). The pioneer trees contributed
most to the viable seed bank with 1317 seeds (43 % of the total). This was followed by
shrubs with 29.1 % and herbs with 13.3 %. Callicarpa cana (Verbenaceae) and GlochiUion
I'ab le 7.4 Density per life form and weeks o f seed ling germination
Life form Week T ool
7 14 21 28 35 42 44
Crrass 21 15 13 19 6 - - 74
Forh 4^ 54 6 0 74 106 57 11 405
Lían» - 2 X 2 6 - - 18
Shrub ■ 77 220 107 301 177 - 898
Tree (pioneer) 413 552 1Ü5 1.36 83 20 8 1317
Tree (shade* (tearing)
- 9 26 7 4 - - 46
U nidentified 6 .39 190 33 38 19 2 327
koHmamanum (Euphorbiaceae) made up most of the pioneers with a density of 608 and
254. Commercial secondary trees, Trema orientalis (Ulmaceae) and Duahanga moluccana
(Sonneratiaceae) had also relatively high density and were frequent in the sites studied
(Tables 7.2 and 7.3). Melastoma malahathricum (Melastomataceae) was the most important
shrub and had 840 (93 %) of the total shrub seeds. Lianas consisted of three species with
99

few seeds (Table 7.4). There were very few shade-bearing trees in the seed banks, i.e
Buchanatiia sessiUfolia and Eugenia sp which had 38 and 8 seeds respectively.
T ab le 7.5 W eek s o t 'lh e in itia l a n d e x te n d e d p e r io d o f g e rm in a tio n o f t r e e s a n d n u m b er o f se ed s by B lock
No Species W eek o f first germ ination
Period o fgerm ination(w eeks)
A
N um ber o f seeds by Block
H C I) h
1 B uch u na ru a s e sn U fo tia 10 29 7 23 5 22 C a lh c a rp a cana 7 17 21 «7 436 3 10 513 C a na n ea o d o ra ta 10 34 4 4 1 - -4 D u a h a n ffa m o lu ccan a 12 42 10 19 39 1 6 25 E u ffttn ia sp 9 32 3 3 •6 F icus a m pc las 12 36 6 2 - 107 F. m e la n o c a rp u 12 2K 1 - 2S F ic u s sp 12 29 1 2 21 • 59 F. v a rie g a ta 12 42 11 40 35 5 7 1110 F. vascu losa 12 - 2 • * •II G lo c h id io n k o llm a n ia n u m 7 44 37 71 92 17 6 3112 G lo c h id io n sp IS 1 - •13 H o m a la n th u s p o p u ln e u s 17 44 6 2 X 1 3 •14 M a c a ra n g a hose i 7 26 4 9 2 • •15 M a c a ra n g a sp 7 - 3 • ■16 M . tr i lo b a 7 - • 2 •17 M a llo tu s p a n ic u la tu s 6 31 12 25 1 * 218 P a ra s p o n ia p a r v i/o l ia n 25 9 • •19 Pty>chopyxix cos ta ta 10 24 1 13 2 * '20 T rem a o r ie n ta lis 6 44 14 17 47 6 7 5
Total 104 2KX 761 39 47 1214 6 III * 128 in ’ 338 III ’ 87 I II ’ 104 I I I ’ 134 III ’
There were differences between tree species in their period of germination. In weeks 6 and
7 they included Callicarpa cana, Glochidion kollmanianum, Macaranga hosei, Macaranga
sp, M. triloba, Mallotuspaniculatus and Trema orientalis,. All Ficus seeds germinated in
week 12, and the last to germinate were Homalanihuspopulneus (week 17) and Glochidion
sp (week 17) (Table 7.5). Some species extended their germination until week 44, including
Glochidion kollmanianum, Homalanihus populneus, and Trema orientalis. Duahanga
moluccana germinated in week 12 and carried on until week 42. Gallicarpa cana
contributed most (46%) to the tree seed bank with 608 seeds (Appendix 9).
The tree seed bank was ranked Block C 338 m' ̂ > Block F 134 m^ > Block B 128 m^
(Table 7.5). The plots in Block A had the smallest tree seed bank with 46 m’’ (Table 7.5).
100
DISCUSSION
The density of seeds in the unlogged forest was 280 m‘̂ (Table 7.1), This was higher than
the 131 m' ̂ in the mature forests of Pasoh Forest Reserve (Putz & Appanah 1987), but
lower than the 592 in primary lowland forests in North Queensland (Hopkins &
Graham 1984). The size of the seed bank in primary forests in Kalimantan was recorded as
627 m'̂ by Santoso (1995) at Kuala Kayan and 175 m' ̂by Prajadinata (1996) at Barito Ulu.
The seed bank in Block A was lower than in the unlogged forest (Table 7.1) similar to the
observations of Putz & Appanah (1987) and Abdulhadi & Lamb (1987). This may due to
the timing of sampling. The timing of sampling in Block A (the newly logged-forest) was 4
months after logging, and it is likely that some seeds had already germinated and developed
into seedlings reducing the size of the seed bank
The contribution of the seed rain is likely to increase during succession, as was reported in
a study on the re-growth on an abandoned farm in Australia where the peak seed bank
occurred in the 20 years old re-growth (Abdulhadi & Lamb 1987). In the oldest re-growth
the proportion of long-lived seeds may be higher than of short-lived seeds, and the seed
bank size decreases as the short-lived seeds die, and the pioneer trees are out-competed by
later succession species.
Seed bank size after disturbance may also depend on the timing of sampling. Within a
month after disturbance many buried seeds may have germinated. Ng (1983) reported that
50% of seeds in the seed banks germinated within 6 weeks, resulting in a decrease of seed
bank size. The rate of accession of freshly dispersed seeds into the seed pools may be
related to the size of the disturbed area. Kramer (1926) and Brokaw (1980) found that the
101

density of pioneer tree species increased with gap size. In Pasoh Forest Reserve the gaps
caused by tree falls are generally small, hence the rate of accession of the freshly dispersed
seeds into the gaps may be slow. Furthermore there is a scarcity of pioneer tree species near
Pasoh and the number of seedlings germinated from the seed bank reaches up to seven
times that from the newly dispersed seeds (Putz & Appanah 1987). Dirzo et a! (1992)
reported that in young ( 1 - 2 years) large gaps (>400 m )̂ the rate of closure was more than
in small gaps due to the availability of light which allowed the surrounding vegetation to
grow more rapidly. He found that both number of species and density of seed banks did not
vary significantly with gap size and age. Unfortunately Dirzo et al. (1992) dealt with only
one life form, the understory herb community.
The liberation treatment had a significant effect {p<0.001) on the size of the seed bank in
Block C perhaps because the treatment allowed more freshly dispersed seeds to fall onto
the ground. Similarly the intensively treated Block E (plot 17) had a higher number of seeds
than the lightly treated Block D (plot 16). In terms of species diversity however there were
no differences between the treated and untreated logged-over forests (Table 7.1).
Pioneer tree species had a higher proportion (43%) than any other life form This was
similar to most other tropical rain forests such as Panama 90% (Putz 1983), Nigeria 43%
and 68% (Keay 1960) and Venezuela 90 - 96% (Uhl 1981). Liew (1973) reported that 61%
o f the soil seed bank consisted of pioneer tree species in Sabah, but a lower proportion
(29%) occurred in Pasoh Forest Reserve (Putz & Apannah 1987). Hopkins & Graham
(1984) reported that secondary or pioneer species accounted for 90% of the seed bank in all
samples from Queensland rain forests.
The most frequent pioneer trees at Kintap were Callicarpa cana, Diiahanga moluccana.
Ficus variegata, Glochidion kollmanianum and Trema orientaUs. Duahanga moliiccaua
and Trema orienlalis were present in the soil seed bank in Sabah and they took a similar
time to germinate (Liew 1973). Callicarpa cana and Trema orientalis were among the
l ()2

commonest species occurring in the soil seed banks at Barito Ulu, Central Kalimantan
(Prajadinata 1996). In the Kintap sample plots, Macaranga had only three species
{Macaranga hosei, M. triloba and Macaranga sp), all with a low density in spite of their
abundance as trees in the surrounding areas. There were at least seven species of
Macaranga occurring in the Kintap area, including M. canferta, M. diepenhorstii, M.
gigantca, M. hosei, M. hypoleuca, Macaranga sp and M. Iriloha. They were commonly
found along the logging roads and logged areas along with other pioneers such as
Anthocephalus chinensis and Oclometes snmatrana which were also absent in the seed
banks in this study. Anthocephalus chinensis and Macaranga hypoleuca were in the seed
bank in Sabah (Liew 1973).
The absence or scarcity of a number of pioneers in the seed banks, albeit their relative
abundance at particular sites, was a common feature in the Australian forests studied by
Hopkins & Graham (1983). This may be related to the seeds’ longevity, and hence on the
timing of sampling (Cheke et al. 1979). The pioneer seeds therefore may generally be
divided into long-lived seeds that are present in the seed banks under the closed canopy of
primary forests, and short-lived seeds of the pioneers capable of continuous input of fresh
seeds in the re-growth.
Melastoma malahaihricum was an important shrub species in this study and contributed
93% of all shrubs in the seed banks. This species was also dominant in most of the
regrowth in shifting cultivation sites in Barito Ulu (Prajadinata 1996) and present at Pasoh
Forest Reserve (Putz & Appanah 1987) and beneath lowland tropical rain forests North
Queensland (Hopkins & Graham 1983).
103

CHAPTER 8 SEED RAIN OF DIPTEROCARPS AND SOME NON- DIPTEROCARPS
INTRODUCTION
Abundant dipterocarp seed fall follows mast flowering and fruiting which occur at irregular
intervals, depending on the physiological readiness of the trees and the trigger of a sharp
increase in temperature or irradiation. Some non-dipterocarps may follow the pattern of
dipterocarp seed fall, and many non-dipterocarps may flower and fruit throughout the year
to provide food to frugivorous animals. Dipterocarp species may have a different pattern of
flowering and fruiting in a good seed year, particularly the time of first flowering and
fruiting and then their duration of the flowering and fruiting time.
The study on seed rain at Kintap was aimed at determining its’ monthly fluctuations in the
logged-over and unlogged forest from February 1992 - March 1993 and was related to the
composition of the dipterocarp trees occurring in the sites studied.
MATERIALS AND METHODS
Twelve seed traps of rectangular wooden trays 50 cm by 50 cm and 15 cm deep were put in
every plot (50 m x 50 m), each randomly placed in alternate 10 m x 10 m subplots A total
of 228 traps were placed in the 19 plots in Blocks A - F on 1 - 8 January 1992. The traps
had a fine 1 mm ̂mesh and had four legs of 15 cm at each corner. The first collection was
made on 6 February 1992, and after that, every month for 14 months. The fruits and seeds
were put in a plastic bag separately by species from each tray. Wet fruits and seeds were air-
dried. The number of the seeds collected every month was recorded, and all those of
dipterocarps and some o f non-dipterocarps were identified.
104

RESULTS
A total of 4534 seeds (excluding that from a Ficus fruit which had seeds too numerous to
count) was collected in the 14-month period. Most of the seeds and fruits were trapped in
February - April 1992 with 3739 seeds (about 83% of the total). The peak occurred in
March 1992 with 2055 seeds (45%) (Table 8.1 and Fig. 8.1). Seed fall per m̂ was ranked
Block C > E > A > D >B > F (Table 8.1). Block C included plots 13 (633 seeds) and 14
(222 seeds) in March 1992 (Table 8.1). In plot 13 the seeds were mostly from only two
different unidentified species (No. 045,312 seeds, and No. 173, 256 seeds), and in plot 14
mostly from two species (No. 173, 85 seeds, and No. 174, 128 seeds). The seeds from
plots 13 and 14 were small with a diameter of 2 - 3 mm.
A high proportion of dipterocarp seeds occurred in March and April 1992 with 349 and 322
seeds respectively. In May 1992 there were only two dipterocarp seeds trapped, one of
Shorea parvifolia and one of S. teprosula (Table 8.3 and Appendix 10). There were no
dipterocarp seeds trapped afterwards until March 1993.
The number of seeds trapped varied among Blocks and between plots within the same
Block, for both dipterocarps and non-dipterocarps. Block A had the highest number of
dipterocarp seeds trapped with 236 in 15 m̂ (15.7 m' )̂ (Table 8.2).
The total number of dipterocarp seeds trapped was 847 in 19 plots (14.9 m' )̂, belonging to
12 species and 3 genera, including 8 species of Shorea (Table 8.3). These Shorea are
included in section Richetioides (Meranii-Damar Hitam), i.e Shorea faguetiana, S.
hopeifoUa and S. polyandra, and sections Brachypterae, Mutica and Ovalis (Red-Meranti),
i.e. S. parvistipulata, S. Johoremis, S. leprosula, S. ovalis and S. parvifolia. Shorea
105


2 3 4 5 6 7 8 9 10 11 12 1 2 3 4Month
Dipterocarps Non-dipterocarps
Figure 8.1 Numbers of dipterocarp and non-dipterocarp seeds trapped during Febrary 1992 - March 1993, Kintap. South Kalimantan.
There were differences in time and plots of seed abundance between species. Shared
parvistipiilala had abundant seeds in April 1992, particularly in plots 9, 18 and 19, ,V.
johorensis seeds were abundant in March 1992, mainly in plots 9 and 17, and S. ovaHs in
April 1992 in plots 12 and 17. Shared pdr^nfoUd had a similar seed fall in February and
March 1992, mainly in plots 2 and 16. Haped sdngdl had seed fall trapped mostly in plot 2
with 68 seeds. The total fall of this species was 70 seeds, trapped in plots 2 and 10 in
February - April 1992 (Table 8.3).
Most of the dipterocarp species had been trapped since February 1992. Some species were
trapped in March 1992, including Dipteracdrpus humeraius, D. gracilis. Shared avdiis and
S. polyandra (Table 8.3).
Some identified non-dipterocarp seeds trapped included Duria acutifalius, Glutd wdHichii,
Quercus and Pentdspadan nialleyi (Table 8.3). Penidspddan matleyi had the highest
number of seeds trapped with 93 seeds, followed by Ghitd wallichii (74 seeds) and Quercus
108

(29 seeds). Non-dipterocarp seeds were trapped particularly during February - April 1992,
with a peak in March 1992.
T a b l e K.3 Numl>er o t 's e e d s trapped b y species o f d ip terocarps and non-dip terocarps. K in tap . S outh K alim antan . February • M a y 1992
Species February March April May Total
Dipterocarps D ip te ro c a rp u s f f r a c i l ix D . h a s x e itu
• 11
■ 11
D . h u m u ra tu x - 1 I • 2H o p u a xartna! 31 21 IK - 70S h o r t ta fa g u e iia n a • 29 21 - 50S. p a rv ts t ip u la ta 14 41 lOK ■ 163S. h o p n ifo U a 6 13 8 • 27S. jo h o re n x ix 65 116 59 - 240S. le p ro s u la 26 33 12 1 72S. f> va /is - 36 62 - 98S. p a r v i fo l ta 32 31) K 1 80S. p < j/y a n d ra ■ 19 24 • 43
I 'u tu l 174 349 322 2 847
Non-dipterocarpsC a r a l l ia b ra c h ia ta - 10 11 21D u r t o acutifoU ux 5 1 6G lu ta w a lhchn 5 64 5 74Q u e rc u x xp. 6 21 2 29L ith o c a r p u x h lu n ie a n u x I 2 4l* e n to \p a J o n m o tte y i 13 67 13 93
T o ta l 30 165 32 - 227
P alm sC a ta m u s cavs iux 1 1 • 2C. m a n a u ■ 2 2
T u tu I 1 3 - - 4
DISCUSSION
The mast fruiting in Kintap occurred early in 1992 following a gregarious flowering in
November - December 1991. A high average maximum temperature (up to 34.6*' C) and a
high average maximum irradiation (87-91 % of 8 hours exposure) had been recorded in
109

Pelaihari (about 60 km from the study site) in July - September 1991 (Figs. 8.2 and 8.3).
The irradiation in the rest of the months in 1991 was 32 - 77% (Figs. 8.2 and 8.3;
Appendices 3 and 7). Hence the flowering in November - December 1991 in Kintap which
resulted in abundant seeds trapped in February - April 1992 followed a high average
maximum temperature and irradiation in August - October 1991.
Figure 8.2 shows a sharp increase in the average maximum temperature from 32.1*’ C in July
to 33.6“ C and 34.6" C in September and October 1991. Figure 8.3 shows a sharp increase
in monthly average percentage irradiation from May to July 1991. A maximum intensity of
irradiation for Kepong was measured as sunshine hours where the increase of 2.8 - 4.4
hours stimulated gregarious flowering (Ng 1977). The increase in the average percentage
sunshine hours in the Tanah Laut district. South Kalimantan, from 47 % (3.8 hours) in May
to 91 % (7.3 hours) in July 1991 (Fig. 8.3) should stimulate the gregarious flowering In
1992 the increase of the average maximum sunshine hours from May to August was about
2.9 hours. This increase in the average monthly maximum irradiation however, did not
stimulate gregarious flowering in early 1993, and similarly the increase in the average
maximum temperature in July - October 1992 (Fig. 8.2) was likely to be insufficient to
stimulate a gregarious flowering.
IK)

-m- 1991 * 1 9 9 2
Figure 8.2 Monthly average daily maximum temperature recorded in Pelailiari, South Kalimantan. 1991 - 1992.
1991 1992
Figure 8.3 Monthly average maximum irradiation measured in Pclaihari, South Kalimanhin, 1991 - 1992.
The germination percentage of woody species (including dipterocarps) was 69 - 77% at 10 -
14 weeks after seed fall (Ng 1980). If the percentage germination was similar at Kintap,
111

there would be at least 10 seeds germinating from the average of 14.9 m'̂ , which is
equivalent to 100,000 ha'*.
The number of dipterocarp seeds trapped varied between plots, ranging from 1 (plot 15) to
117 (plot 17) (Appendix 10). The variation between plots may reflect differences in density
and species. Four species contributed most to the seed fall, i.e. Shorea johorensis, S.
parvistipulala, S. ovalix and S. parvifolia. The former species had seed fall in 12 plots, and
the second and the last in 11 plots out of the total 19 plots. The third species, Shorea ova!is,
had seed fall in 5 plots but had more seeds (98 seeds) than S. parvifolia (80 seeds). Shorea
parvifolia had the smallest seeds of the four and may have a greater seed dispersal distance
The inventory of trees of > 10 cm dbh in November 1991 showed 21 dipterocarp species in
total: Dipterocarpus (4 species), Hopea (4 species), Shorea (10 species) and Vatica (3
species) (Table 8.4). The seed fall was of 12 species, mostly Shorea (8 species), and none of
Vatica. Hopea sangal was the only species of the genus which provided seed fall, mainly in
plot 2 (Appendix 10). It appears that even during a gregarious flowering many individual
trees and some species may not flower.
The number of dipterocarp seeds trapped in February - May 1992 was 847 (only 2 seeds
trapped in May 1992). an average of 14.9 m*̂ (Table 8.1). This figure is quite high.
112

Table 8.4. Dipterocarp composition in 19 50 m x 50 in p lo ts (-4 .7 5 lia) KinUp. South Kalimantan, November 1991
No Species Diam eter class (cm)
1 0 - 19 2 0 -3 9 40 - 59 6 0 -7 9 X O-99 >100 N
I D ip te ro c a rp u ts c a u d ifitru x X 82 D . g ra c il ix 1 2 33 D . h asse ltii 2 1 4 74 D . hum eratu.s 1 1 25 H o p e a d ryoba lano ide .s 3 2 1 66 H . fe r ru g in e a 2 27 H . s a n g a l 5 2 2 9X H . te n u m e rv u la 1 19 S. h o p e ifo lia 25 21 12 I 5910 S. jo h o re n s is 96 27 6 2 1 13211 S. la ev ix 4 6 1 1112 S. le p ro s i! la 9 1 1013 S. m u lt if lo ra 1 114 S. a v a ils 34 4 I 3915 S. p a rv i/o t ia 36 16 1 1 5416 S. p a rv is ip u la ta 34 15 X 10 4 1 7217 S. p o ly a n d ra 5 2 1 8IX S ho re a /a g u e tia n a X 5 3 2 1819 y. rassak 16 17 1 2 3620 y. u m honata 1 1 221 y a tic a o d o ra ta ‘ '
T otal 2 9 2 123 42 16 6 2 481
The highest number of seeds trapped in plot 17 may reflect that it had 29 trees of diameter
> 20 cm (Appendix 12). Shorea johorensis had 14 trees > 20 cm dbh, and had 85 seeds out
of the total of 117 dipterocarp seeds collected from this plot. In plot 2, Shorea Johorensis
had 27 trees, but only three were > 20 cm dbh (Appendix 12), and this plot contributed only
four seeds trapped in March 1992 (Appendix 10). Plot 15 had the least number of seeds
trapped (1) and had 2 species of dipterocarp; Dipierocarpus hasseltii (one) and Shoma
polyaiidra (three) all with a diameter < 20 cm dbh (Appendix 12). The single seed trapped
was of Dipterocarpus hasseltii which may have fallen from outside the plot (Appendix 10).
113

In Febaiary - May 1992 there were 3017 non-dipterocarp seeds trapped (52,9 m'^) (Table
8.2). This includes the seeds produced by species which flower throughout the year, but the
highest proportion seems to be from the species which took part in the gregarious
flowering. The identified non-dipterocarps had seed fall only until April 1992 with the peak
in March 1992 (Table 8.3; Appendix 11), none of the species had seed fall after this until
March 1993. This is similar to the dipterocarps and suggests that many non-dipterocarps
have the same response as dipterocarps to an increase of temperature and irradiation
114

CHAPTER 9 CONCLUDING REMARKS
The conclusions are made in the light of the aims o f the thesis as set out in the
Introduction.
(a) The physical environment at Kintap has been described and all relevant
information collated. The rainfall at the FfNNlDA camp was relatively high and
reached 3980 mm in 1993. There was a pronounced dry and sunny season from
August to October. Temperatures recorded at Pelahari (60 km west of Kintap)
were relatively constant with daily averages from 26.4" C in January to 27.6" C in
October. The average relative humidity ranged from 76% to 87%.The soil types
at Kintap were mainly Ultisols and had a relatively high pH (4.8 - 6.0) among
the investigated Blocks and were relatively rich in nutrients
(b) There were at least 305 species of trees (>10 cm dbh) in the 4.75 ha of non
contiguous blocks in the study area. The Dipterocarpaceae were dominant overall
with Hopea sangal, Shorea johorensis, and S. parvistipulata as the most
frequent. The second most dominant family varied: Anacardiaceae in Block A,
Flacourtiaceae in Blocks B, E, and F, and Euphorbiaceae in in Blocks C and D.
In a total of 1.25 ha (five 50 m x 50 m plots in each Block) Block C had 167
species. Block B 163, and Block A 131 species. The higher numbers in Blocks B
and C reflect the presence of pioneers. The most valuable non-dipterocarp, the
ironwood, Eusideroxyhm zwageri was codominant in Blocks B and C. The
evidence from the Kintap plots suggests that even fairly heavy logging damage
IIS
might not appreciably reduce tree species diversity at least within the confines of
the present investigations.
(c) Logging activities caused much unharvested loss of mainly small trees and, in the
most closely investigated Block A, ranged from 6 to 40 trees in each 0.25 ha plot
killed by felled trees or uprooted by bulldozers. There is clearly much scope for
research into minimal-impact logging procedures. The control unlogged Block F
lacked commercial species initially and if experiments in rain forest silviculture
are to be continued then close cooperation between the loggers and scientists will
need to be maintained. Otherwise there will be the result, as at Kintap, that
atypical economically worthless stands (such as Block F) are reserved as
controls.
(d) The growth of the trees (basal area increment plus recruitment) in the remaining
stands of the logged-over forest ranged from 0.64 m̂ ha‘‘ year"' (the unlogged-
forest patches Block F) to 4.12 m̂ ha'* year'* (the treated twelve years old
logged-over forest Block C) (Table 9.1). The results indicate very slow growth of
the unlogged forest and the accelerated growth of the treated logged-over forest.
The liberation treatment in the 12-years old logged-over forest Block C however
did not result in significant differences in tree growth compared with the
untreated 12-years old logged-over forest Block B. It must be pointed out
however that Block B had experienced illegal cutting, burning, and a violent
storm, resulting in the thinning of most of the plots in this Block. The intensively
liberated 12-years old logged-over forest Block E (plot 17) had a significantly116

higher growth increment compared with the lightly treated Block D (plot 16). The
growth rates of trees in the unlogged-forests Block F (average 0.4 - 2.6 mm
year’’) was much lower compared with the newly logged-forests Block A (0.3 -
10.6 mm year"') and with the 12-years logged-forests Block B (0.8 - 10.9 mm
year*').
The growth of the remaining stands depends to some extent on site characteristics
like topography and on the composition of the trees. The Dipterocarpaceae
showed the highest growth increment in the study areas (Tables 5.3, 5.8, 5 13)
The highest growth rate of the dipterocarps was shown by Sharea johorensis (1.05
cm year"') and S. parvifoUa (1.22 cm year’’). In general canopy species grew
faster than subcanopy species, and the latter generally grew faster than the
understory species.
The soil properties may be related with the growth rate of trees and saplings. This
was indicated by Block C where growth rate of trees and saplings was the highest
(not significant) in all Blocks. Block B which had higher average exchangeable
cations than Block A had also higher growth rate of saplings and trees than Block
A.
Mortality and recruitment varied among and within the sites studied. Mortality
rate was highest in the newly logged-forest compared with the 12-years old
logged-over forest (Table 9.1). This indicates the short-term effects of the logging
in which the damaged trees tended to die within the first few years. There was a
correlation between the number of trees dying and the number of recruits
[p- O.Ol). A bigger basal area loss may promote more recruitment. The bigger loss
117

of basal area in Block B resulted in more recruitment than in Block A which had a
lower basal area loss (Table 5.17).
(e) Seedling density ha‘‘ (dipterocarps in parentheses) ranged from 47000 (8600) in
Block A to 121000 (40000) in Block F.The density of dipterocarp seedlings may
be partly related to parent tree density, seed rain, and other factors. Block F had
the highest tree density and had the highest seed rain and seedling numbers.
However a higher dipterocarp seed rain in Block A did not result in a higher
number of seedlings than in Block B. Other factors such a topography may
control the density. The steeply sloping plots 4 and 5 in Block A had the least
density of seedlings (Tables 3.1 and 6.1). The 12-years old logged forest Blocks
B and C had the highest diversity of the pioneer tree seed bank possibly as a
result of ironwood removal after the main logging activity
The higher increment (10.5 cm year'*) of seedlings in the newly-logged
forest Block A may be related to the greater degree of canopy opening following
the logging. The liberation treatment (removal of pioneer trees) in Block C was
accompanied by a higher increment (5.4 cm year'') of both dipterocarp and non-
dipterocarp seedlings compared with the untreated Block B (2.9 cm year''). Even
the understory species showed a strong response to increased light (Table 6.5)
The species with the highest density of seedlings showed the highest seedling
mortality (Table 6.4). The sapling stock varied from 6800 ha'' to 8600 ha''
Diameter growth ranged from 0.8 mm (Block F) to 2.2 mm year-1 in Block C.
The growth may be partly related to canopy opening but the newly-logged Block
118

A did not have both higher diameter and height growth of saplings compared
with the other Blocks.
Soil properties did not correlate with number and growth rate of seedlings. Block
C had the highest average pH, exchangeable cations and available-P, however
number and growth rate of seedlings were less than in Block A. Block B had
higher average exchangeable cations than Block A but lower than Block C. This
Block had a higher number but lower growth rate of seedlings than in Block C
(f) The highest average seed bank size occurred in Block C with 616 m'̂ and the
least in Block A with 151 m' .̂ The unlogged-forest Block F had an average of
280 m' ̂ There were at least 50 species (15 unidentified species) occurring in the
seed banks in the Kintap study site. The highest number was for the shrub
Melastoma malahairicum of 840 with 98 m' ,̂ the pioneer trees Callicarpa cana
of 71 m' ,̂ and Glochidioit koHmanianum of 30 m'̂ . Shade bearing trees had very
few seeds. The large seed bank in Block C may be resulted from the liberation
thinning which allowed more freshly dispersed seeds to fall onto the ground
Block C has the most nutrient-rich soils but it is not certain how these might
cause a larger seed bank.. Some pioneer species {Anthacephalus chinemis,
Oclomeles sumatrcma and Macaranga si>p.) which were frequently found along
the logging road and logged area did not occur in the seed banks.
The seed rain observation occurred during a mast fruiting in early 1992. The
number of seeds trapped from all plots from February 1992 - March 1993 was
4534 seeds. Most of the seeds were trapped in February - April 1992 with 3739
seeds (83%) with the peak in March 1992 of 2055 (45%). Dipterocarps119

contributed 847 seeds from 12 species, mostly Shoreci Johorensis, S.
parvistipiilata, S. avails and S. parvifoUa. Some species had very scanty seed fall
like Dipterocaipus gracilis, D. hassallii and D. humcratus.
Even during a gregarious flowering many individual trees and some species may
not flower. The mast fruiting occurring in February - April 1992 followed a
gregarious flowering in November - December 1991 as a response to a high
average maximum temperature and irradiation in August - October 1991
Most of non-dipterocarps had the same response as dipterocarps to an increase in
temperature and irradiation.
(g) The conclusions are drawn against the unfortunate backdrop that the Hutan
Kintap concessionaries have largely destroyed most of the Kintap forest through
excessive and illegal logging and even the sale of non-dipterocarps for local
consumption. They have been able to disregard Government Forestry
Regulations because of inadequate control by the provincial Forestry Officers in
Banjarbaru, South Kalimantan
The plots studied in this thesis, and from which generalisations about
management of the concession were to be made, were usually much less
damaged than anything now left in the bulk of the concession. The
concessionaries took care in the plots they knew were to be researched!
The conclusions from the plots may apply to varying extents to sites elsewhere
but they are likely to be site-specific in view of the unusual combination of high
rainfall and nutrient-rich soils at Kintap. Furthermore many of the Kintap
treatments were unreplicated and some were damaged in such a way as to
120
confound interpretations. There was good regeneration of trees including
dipterocarps in nearly all the plots at Kintap and hence a reasonable expectation
that if the forests were well managed then they would recover commercially
within a time scale of 30-50 years. Sufficient seed stocks and seed fall during
mast years would ensure the regeneration near mother trees. Where mother trees
have been destroyed over wide areas as in the bulk of the concession then few
seeds will be available for regeneration. In these circumstances some means of
enrichment planting must be considered if any production is to be restored This
will inevitably result in a reduced biodiversity however. The mast fruiting might
be predicted by monitoring rainfall, temperature and radiation and time since the
last mast event. Preparations could then be made for seed collections for the
establishment of dipterocarps. Enrichment planting seems the best strategy for
most of the Kintap concession and is particularly suitable since most dipterocarps
prefer partial shade to full full sunlight initially (Nicholson 1960, Revilla 1976,
Mauricio 1987 and Adjerse/a/. 1995).
The conclusions are drawn against the unfortunate backdrop that the Hutan
Kintap concessionaries have largely destroyed their forest through excessive and
illegal logging and even the sale of non-dipterocarps for local consumption.
121

REFERENCES
Abdulhadi, R. A., Kartawinata, K. & Sukardjo, S. (1981) Effects of mechanized logging in the lowland dipterocarp forest at Lempake, East Kalimantan. Malaysian Forester, 44, 407 - 418.
Abdulhadi, R. A. & Lamb, D. (1987) Soil seed stores in a rainforest succession. Proceedings o f the Ecological Society o f Australia, 15, 81 - 87.
Adjers, G., Hadengganan, S., Kuusipalo, J. Nuryanto, K. & Vesa, L. (1995a)Enrichment planting of dipterocarps in logged-over forests; effects of width, direction and maintenance method of planting line on selected Shorea species. Forest Ecology and Management, 73, 259 - 270.
Adjers, G., Hadengganan, S., Kuusipalo, J., Nuryanto, K. & Vesa, L. (1995b) Production o f Dipterocarp Planting Stock from Seed and Wildings: Experiments on Selected Shorea in Kalimantan. Indonse.sia. Enso Forest Development. Banjarbam, Indonesia.
Anonymous (1994) Slatistik Kehutanan Propinsi Kalimantan Selatan, 1993/1994. Kanwil Kehutanan, Banjarbaru, Kalimantan Selatan, Indonesia.
Appanah, S. & Chan, H.T. (1981) Thrips: The pollinators of some dipterocarps. Malaysian Forester, 44, 234-252.
Ashton, P S . (1978) The Biological and Ecological Basis fo r the Utilization o f Dipterocarps. Proceedings of Eighth World Forestry Congress, Jakarta.
Ashton, P. S. (1982) Dipterocarpaceae. Flora h4alesiana. Series I, 9, 237 - 552.
Augspurger, C. K. (1984) Seedling survival of tropical tree species: interactions of dispersal distance, light-gaps and pathogens. Ecology, 65, 1705 - 1712.
Baillie, 1. C.. Ashton, P. S., Cort, M. N., Anderson, J. A. R., Fitzpatrick E. A. &Tinsley, J. (1987) Site characteristics and the distribution of tree species in mixed dipterocarp forest on Tertiary sediments in central Sarawak, Malaysia. .Journal o f Tropical Ecology, 3, 201 - 220.
Black, C. A., Evans, D. D., White, J. H., Ensminger, L. E. & Clark, F. E. (1965) Methods o f Soil Analysis. American Society of Agronomy. Madison, Wisconsin.
Bremen, H. Van, Iriansyah, M. & Andriesse, W. {\990) Detailed Soil Survey and Phy.sical Land Evaluation in a Tropical Rain Forest, Indonesia. Tropenbos Technical Series. The Tropenbos Foundation. The Netherlands.
Brokaw, N. V. L. (1980) Gap Phase Regeneration in a Neotropical Fore.st.Ph.D thesis. University of Chicago, Chicago, Illinois.
122
Brokaw, N. V. L. (1985) Treefalls, Regrowth, and Community Structure in Tropical Forests (eds S.T.A. Pickett & P. S. White) The Ecology o f Natural Disturbance and Patch Dynamics pp. 31 -41. Academic Press, London.
Brokaw, N. V. L. (1985) Gap phase regeneration in a tropical forest. Ecology, 66,682 - 687.
Brower, J. E. & Zar, J. H. (1977) Field Laboratory and Methods fo r General Ecology. W. C. Brown, Iowa.
Burgess, P. F. (1971) The effect of logging on hill dipterocarp forests. Malayan Nature Journal, 24, 231 - 111.
Burgess, P. F. (1972) Studies on regeneration of the hill forests of the Malay Peninsula. Malaysian Forester, 35, 103 - 122.
Burgess, P. F. (1975) Silviculture in the hill forests of the Malay Peninsula. Research Pamphlet 66. Forest Research Institute, Kepong.
Canham, C. D. (1988) Growth and canopy architecture of shade-tolerant trees: Response to canopy gaps. Ecology, 6, 786 - 795.
Canham, D. C. & Marks, P. L. (1985) The response of woody plants to disturbance;patterns of establishment and growth (eds S. T. A. Pickett & P. S. White) The Ecology o f Natural Disturbance and Patch Dynamic.'!, pp 197 - 216. Academic Press. London.
Canham, C. D. (1989) Different response to gaps among shade tolerance tree species. Ecology, 70, 548 - 550.
Cheke, A. S., Nanakaron, W. & Yankoses, C. (1979) Dormancy and dispersal of seeds of secondary forest species under the canopy of a primary tropical rainforest in northern Thailand. Biotropica, 11, 88 - 95.
Clifford, S. & Stephenson, W. (^\91S) An Introduction to Numerical Classification. Academic Press, London.
Connell, J. H. (1978) Diversity in tropical rain forests and coral reefs. Highdiversity of trees and corals is maintained only in an equilibrium state. Science, 199, 1302- 1310.
Connell, J. H. (1989) Some processes affecting the species composition in forest gaps. Ecology, 70, 560 - 562.
Cox, G. W. { \ 9 6 1 ) Lahoratoty Manual o f General Ecology 7* edition . Dubuque. W.C. Brown. Iowa.
Dawkins, H. C. (1958) The management of natural tropical high forest with special reference to Uganda. Commonwealth Forestry Institute. Paper 34.
123

Dawkins, H. C. (1959) The volume increment of natural tropical high forest and limitations on its improvement. Empire Forestry Review, 38, 175 - 180
Denslow, J. S. & Gomez-Diaz, A. E. (1990) Seed rain to tree-fall gaps in aNeotropical rain forest. Canadian Journal o f Forest Research, 20, 642 - 618.
Dent, F. J. (1980) Major production systems and soil-related qualities in humidtropical Asia Soil-Related Constraint to Food Productian in the Tropics. International Rice Research Institute, Los Banos. Philippines.
Dirzo, R., Horvitz, C. C., Quevedo, H. & Lopez, M. A. (1992) The effects of gap size and age on the understory herb community of a tropical Mexican rainforest. Journal o f Ecology, 80, 809 - 822.
Djamaludin (1991) The Implementation o f Indonesian Selective Cutting and Areas.Replanting (TPTI) Silviculture System fo r Timber Improvement in the logged- over Areas. Biotrop Special Publication No. 41, 95 - 110. SEAMED BITROP. Bogor, Indonesia.
Ewel, J. & Condo, L. F. (1980) Potential Ecological Impact o f Increased Intensity o f Tropical Forest Utilization. BIOTROP Special Publication No. 11. Bogor, Indonesia.
Fox, J. E. D. (1968) Logging damage and influence of climber cutting prior to logging in the lowland dipterocarp forest of Sabah. Malaysian Forester, 31, 326 - 347.
Fox, J. E. D. (1968) Selective logging in the Philippine dipterocarp forests. Philippine Lumberman, 14, 24.
Fox, J. E. D. (1969a) The soil damage factor in present day logging in Sabah. Sabah Society Journal, 15, 43 - 52.
Fox, J. E. D. (1969b) Production in regenerating forest, (ed B. C. Stone). NaturalResources in Malaysia and Singapore. Proceeding of the Second Symposium on Scientific and Technological Research in Malaysia and Singapore (1967). University of Malaya, Kuala Lumpur, pp. 32-41.
Guevara, S. & Gomez-Popma A. (1972) Seeds from the surface soils in the tropical region of Vera Cruz, Mexico. Journal o f the Arnold Arboretum, 53, 312 - 335.
Grubb, P. J. (1977) The maintenance of species richness in plant communities: the importance of the regeneration niche. Biological Reviews, 52, 107- 145.
Hadengganan, S., Nuryanto , K., Rusmana, E. & Adjers, G. {\992) Production o fplanting stock ofShorea spp. wildings; residts from fo u r trials conducted in Kintap, South Kalimantan, Indonesia. Technical Report No. 34, Reforestation
124
and Tropical Forest Management Project (ATA-267), FINNIDA in cooperation with Ministry of Forestry, Indonesdia.
Hall, J. B. & Swaine, M. D. (1980) Seed stocks in Ghanaian forest soils. Biotropica,12, 256-263.
Harper, J. L. (1977) Population Biology o f Plants. Academic Press, New York.
Hesse, D. R. {\91\)A Textbook o f Soil Chemical Analysis. William Clowes and Sons. London.
Hopkins M. S. & Graham, A. W. (1983) The species composition of soil seed banks beneath lowland tropical rainforest in North Queensland, Australia. Biotropica, 15, 90 - 99.
Hopkins, M. S. & Graham, A. W. (1984) Viable soil seed banks in disturbed lowland tropical rainforest sites in North Queensland. Australian .Journal o f Ecology,9, 71 - 79.
Jongman, R. H. G., ter Braak, C. J. F. & Tongeren, O. F. R. (1987) Data Analysis in Community Landscape Ecology. Pudoc, Wageningen, the Netherlands.
Jordan, C. F. {\9%S) Nutrient Cycling in Tropical Forest Ecosystems. John Wiley, London.
Kartawinata, K. (1974) Report on the State o f Knowledge o f Tropical Forest Ecosystems in Indone.sia. Indonesian National MAB, LIPI, Jakarta.
Kartawinata, K., Riswan, S. & Soedjito, H. (1980) The floristic changes afterdisturbances in lowland dipterocarp forest in East Kalimantan, Indonesia. Tropica! Ecology and Development (ed J. E. Furtado), pp 47-54. International Society of Tropical Ecology, Kuala Lumpur.
Kartawinata, K., Abdulhadi, R. & Partomihardjo, T. (1981) Composition and structure of a lowland dipterocarp forest at Wanariset, East Kalimantan. Malaysian Forester, 44, 397 - 406.
Kartawinata, K. (1981) The environmental consequences of tree removal from the forests in Indonesia. Where have all the Flowers Gone. Deforestation in the Third world (fid R. Goodland), pp 191 - 129. Studies in Third World Societies13, Williamsburg.
Keay, R. W. S. (1960) Seeds in forest soils. Nigerian Forest Information Bulletin 4 NS.
Kellman, M. C. (1969) Some environmental components of shifting cultivation in upland Mindanao. .Journal o f Tropical Geography, 28, 40 - 56.
Korning, J. & Balslev, H. (1994) Growth rates and mortality patterns of tropical
123

lowland tree species and the relation to forest structure in Amazonian Equador..Jotirnal o f Tropical Ecology, 10, 151 - 166.
Kramer, F. (1926) Ondezoek naarde natuurlijke verjonging in den uitkap in Preanger geberge-bosch. Medclmgen Proefstation Boor Het Boschwezen Bogor 14.
Krebs, C. J. Ecology and Experimental Analysis o f Distribution andAbundance. Harper & Ram, New York.
Kuusipalo, J., Jafarsidik, Y., Adjers, G. & Tuomela, K. (1996) Population dynamics of tree seedlings in a mixed dipterocarp rainforest before and after logging and crown liberation. Forest Ecology and Management, 81, 85 - 94.
Lamont, B. (1985) Dispersal of winged fruits oiNuytsiafloribunda (Loranthaceae) Australian Journal o f Ecology, 10, 187- 193.
Lamprecht, H. (1989) Silviculture in the Tropics. Tropical Forest Eco.sy.stems and their Tree species in Possibilities and Methods fo r their Long-term Utilization. GTZ, Eschborn, Germany.
Lang, G. E. & Knight, D. H. (1983) Tree growth, mortality, recruitment, and canopy gap formation during a 10-years period in a tropical moist forest. Ecology,64, 1075 - 1080.
Lieberman, D. & Lieberman, M. (1987) Forest tree growth and dynamics at La Selva, Costa Rica (1969 - 1982). Journal o f Tropical Ecology, 3, 347 - 358.
Lieberman, D., Lieberman, M., Peralta, R. & Hartshorn, G. S. (1985) Mortality patterns and stand turnover rates in a wet tropical forest of Costa Rica.Journal of Ecology, 73, 915-924.
Liew. T. C. (1973) Occurrence of seeds in virgin forest top soil with particularreference to secondary species in Sabah. The Malaysian Forester, 36, 185 - 193.
Liew, T. C. &. Wong, F. O. (1973) Density, recruitment, mortality and growth ofDipterocarp seedlings in virgin and logged-over forests in Sabah. Malaysian Forester, 36, 3-15.
Liew, T. C. (1974) A note on a soil erosion study at Tawau Hills Forest Reserve. Malayan Nature Journal, 27, 20 - 26.
Manokaran, M. & Kochummen, K. M. (1987) Recruitment, growth and mortality oftree species in a lowland dipterocarp forest in Peninsular Malaysia. Journal o f Tropical Ecology, 3,315 - 330.
Martinez-Ramoz, M., Alvarez_Buylla, E., Sarukhan, J. & Pinero, D. (1988) Treefall age determination and gap dynamics in a tropical forest. .Journal o f Ecology, 76,700-716.
126

Mauricio, F P. (1987) Enrichment planting improves logged-over dipterocarp forests: The Philippine experience. Proceedings o f the Third Round Table Conference o f Dipterocarps. (ed A. J. G. H. Kostermans), pp. 39 - 56. MAB, UNESCO, Indonesia.
Medway, Lord (1972) Phenology of a tropical rain forests in Malaya. Biological Journal o f the Linnean Society, 4, 117 - 146.
Meijer, W. (1970) Regeneration of tropical lowland forest in Sabah, Malaysia, forty years after logging. The Malaysian Forester, 33, 204 - 229.
Miller, T. B. (1981) Growth and yield of logged-over mixed dipterocarp forest in East Kalimantan. Malaysian Forester, 44, 419 - 424.
Ng, F, S. P. (1977) Gregarious flowering of dipterocarps in Kepong, 1976. The Malaysian Forester, 40, 126- 136
Ng, F. S. P. (1980) Germination ecology of Malaysian woody plants. The Malaysian Forester, 43, 406 - 437.
Ng, F. S. P. (1983) Ecological principles of tropical lowland rain forest conservation (eds. S. L. Sutton, T. C. Whitmore & A. C. Chadwick) Tropica! Rain Forest: Ecology and Management, pp. 359 - 375. Blackwell, Oxford.
Nicholson, D. I. (1958a) An analysis of logging damage in tropical rain forest. North Borneo. Malayan Forester, 21, 235 - 295.
Nicholson, D. 1. (1958b) Natural regeneration of logged tropical rain forest. North Borneo. Malayan Forester, 21, 235 - 245.
Nicholson, D. I. (1960) Light requirements of dipterocarp seedlings. Malctysian Forester, 23, 344 - 356.
Nicholson, D. I. (1965) A review of natural regeneration in the dipterocarp forests of Sabah. Malayan Forester, 28, 4 - 26.
Nicholson, D. I. (1979) The Effect o f Logging and Treatment on the M ixed Dipterocarp Forests o f Southeast Asia. FAO, Rome.
Ohta, S., Effendi, S. Tanaka, N. & Miura, S. (1992) Characteristics o f Major SoilGroups under Lowland Dipterocarp Fore.sts in Blast Kalimantan, Indone.sia. The Tropical Rain Forest Project JTA-9(a)-137. Japan International Cooperation Agency (JICA).
Okali, D. U. U. & Ola-Adam, B. A. (1987) Tree population changes in treated rain forest at Omo Forest Reserve, South-western Nigeria. Journal o f Tropica! Ecology, 3, 291 -313.
127
Pielou, E. C. (1984) The Interpretation o f Ecological Data. John Wiley & Sons.
Poore, M. E. D. (1968) Studies in Malayan rain forest 1. The forest on Triassic sediments in Jengka forest reserve. Journal o f Ecology, 56, 143 - 196.
Popma, J. & Bongers, F. (1988) The effect of canopy gaps on growth and morphology of seedlings of rain forest species. Oecologia, 75, 625 - 632.
Popma, J., Bongers, F., Martinez-Ramoz, M. and Veneklaas, E. (1988)Species distribution in treefall gaps in Neotropical rain forest; a gap definition and its consequences. Journal o f Tropica! Ecology, 4, 77 - 88.
Poulson, T. L. & Platt, W. J. (1989) Gap light regimes influence canopy tree diversity Ecology, 70, 553 - 555.
Prajadinata, S. (1996) Studies on the Tree Regrowth on Shifting Cultivation SitesNear Muara John, Central Kalimantan, Indonesia. M.Sc. thesis. University of Stirling.
Primack, R. B., Ashton, P. S., Chai, P. & Lee, H. S. (1985) Growth rates andpopulation structure of Moraceae trees in Sarawak, East Kalimantan. Ecology, 66, 577- 588.
Primack, R. B., Chai, E. O. K, & Lee, H. S. (1989) Relative performance of dipterocarp trees in natural forest, managed forest, logged forest and plantations throughout Sarawak, East Malaysia. Growth and Yield in Mixed/hJoist Forests (eds W. R. Wan Mohammad, H. T. Chan & S. Apanah), pp 161 - 175. Forest Research Institute Malaysia. Kepong.
Putz, F. E. (1983) Treefall pits and mounds, buried seeds, and the importance of soil disturbance to pioneer trees on Barro Colorado Island, Panama. Ecology, 64, 1069 - 1074.
Putz, F. E. & Appanah, S. (1987) Buried seeds, newly dispersed seeds, and dynamics of a lowland forest in Malaysia. Biotropica, 19, 326 - 333.
Revilla, A. V. Jr. (1976) An introduction to dipterocarps. Philippine Lumberman, 4, 7 - 14.
Richards, P. W. (1996) Tropical Rain Forest. 2"̂ edition.Cambridge University Press.
Ridley, H. N. (1930) The Dispersal o f Plants throughout the World. Reeve, Ashfold, Kent.
Sanchez, P. A. (1976) Properties and Management o f Soils in the Tropics. John Wiley, London.
Santoso, A. (1995) Bank hiji dalam tanah hutan tropikapamah di Kuala Kayan, Kalimantan Tengah. Thesis (Drs). University Pakuan, Bogor.
Saulei, S. M. & Swaine, M. D. (1988) Rainforest seed dynamics during succession at
128

Gogol, Papua New Guinea. Journal o f Ecology, 76, 1 133 - 1152.
Serevo, T. S. (1949) Some observations on the efiects of different methods of logging on residual stands and on natural reproduction. Philippines Journal o f Forests, 6, 363 - 381
Shell, D. & May, R. M. (1996) Mortality and recruitment rate evaluations in heterogenous tropical forests. Journal o f Ecology, 84, 91 - 100.
Sheldon, J. C. & Burrows, F. M. (1973) The dispersal effectiveness of the achene- pappus units of selected Compositae in steady winds with convection. New Phytologist, 12, 665 - 675.
Sikumbang, N. & Heryanto, R. (1986) Report on the Geology o f the Banjarmasin Quadrangle, South Kalimantan. Geological Research and Development Centre. Bandung. Indonesia
Swaine, M. D., Hall, J. B. & Alexander, 1. J. (1987a) Tree population dynamics at Kade, Ghana (1968 - 1982). Journal o f Tropical Ecology, 3, 331 - 345.
Swaine, M. D., Lieberman, D. & Putz, F. E. (1987b) The dynamics of tree populations in tropical forest: a review. .Journal o f Tropical Ecology, 3, 359 - 366.
Swaine, M. D. & Whitmore, T. C. (1988) On the definition o f ecological species groups in tropical rain forests. Vegetatio, 75, 81 - 86.
Tinal, U. K. & Palenewen, J. L. (1978) Mechanical logging damage after selective cutting in Dipterocarp forest at Beloro, East Kalimantan. Sympo.sium on the Long Term Effects o f Logging in South Asia (ed R. S. Suprapto). BIOTROP, Bogor, Indonesia.
Turner, I. M. (1990) The seedling survivorship and growth o f three Shorea species in a Malaysian tropical rain forest. .Journal o f Tropical Ecology, 6, 469 - 478.
Turner, 1. M. (1990) Tree Seedling Growth and Survival in a Malaysian Rain Forest Hiotropica, 22, 146 - 154.
Uhl, C., Clark, K., Dezzo, N. & Maquirino (1988) Vegetation dynamics in Amazonian treefall gaps. Ecology, 69, 751 - 763.
Vasquez-Yanes, C. &. Segovia, A. O (1984) Ecophysiology of seed germination in the tropical humid forests of the world: a review (eds E. Medina, H. A. Mooney & C. Vasquez-Yanes). Phy.siological Ecology o f Plants o f the Wet Tropics. Dr. W. Junk Publishers.
Vasquez-Yanes, C. (1976) Seed dormancy and germination in secondary vegetationtropical plants: the role of light. Components o f Phy.siological Ecology, I, 30 - 34.
129
Vasquez-Yanes, C. (1980) Light quality and seed germination in Cecropia ohtusifoUa and Piper aduncum from a tropical rainforest in Mexico. Rhyton, 38, 33 - 35
Whitmore, T. C. (1978) Gaps in the forest canopy. Tropical Trees as Living Systems (eds P. B. Tomlinson and M. H. Zimmerman). Cambridge University Press Cambridge.
Whitmore, T. C. (1983) Secondary succession from seed in tropical rain forests.Commonwealth Agricultural Bureaux, Forestry Abstracts, 44, 767 - 779.
Whitmore, T. C. (1984) Tropical Rain Forests o f the Far East 2""̂ edition . Clarendon Press. Oxford.
Whitmore, T. C. (1986) Forest dynamics and questions of scale. Rain ForestRegeneration and Management. Report of a workshop (ed. M. Hadley), pp. 13 - 15 Biology International, Special Issue 18
Whitnore, T. C. & Tantra, 1 G. M. (1986) Tree Flora o f Indonesia. Check List fo r Sumatra. Forest Research and Development Centre. Bogor.
Whitmore, T. C., Tantra, I G. M. & Sutisna, U. (1989) Tree Flora o f Indonesia. Check List fo r Kalimantan. Forest Research and Development Centre. Bogor
Whitmore, T. C. (1989) Canopy gaps and two major groups of forest trees. Ecology, 70, 536 - 538.
Willson, M. F. & Crome, F. H. J. (1989) Patterns of seed rain at the edge of a tropical Queensland rainforest. Journal o f Tropical Ecology, 5, 301 - 308
Wyatt-Smith, J. (1949) Regrowth in cleared areas. Malayan Fore.ster, 12, 83 - 86
Wycherly, P. R. (1973) The phenology of plants in the humid tropics. Micronesia, 9, 75 - 96.
Young, A. (1976) Tropical Soils and Soil Survey. Cambridge University Press. Cambridge.
130


Appendix 1. Procedures of the soil analysis in the Laboratory of the Horticultural Research Institute, Banjarbaru, South Kalimantan.
• pH was measured in a 1 : 2.5 mixture of soil and distilled water
• Cation exchange capacity (CEC) and exchangeable cations were measured on 5-g
sub-samples which had been extracted at pH 7 with 1 M ammonium acetate
solution; potassium and sodium were measured by flame photometry; calcium and
magnesium by atomic absorption spectrophotometry (AAS); cation exchange
capacity (CEC) was measured as follows: the extracted soil was washed with
alcohol and then distilled with NaOH to release ammonium ions. The ammonium
ions were captured in boric acid solution to be treated with sulphuric acid (Kjeldahl
method).
• Available phosphorus was measured colorimetrically (using a spectrophotometer at
693 nm) after extracting 2 g of soil in 14 ml Bray I solution (Black et al. 1965).
• Total phosphorus was extracted from 2 g of soil with 10 ml 25% HCl solution and
the phosphorus in the extract measured by colorimetry using a spectrophotometer at
693 nm.
• Organic carbon was measured by the Walkey-Black dichromate method on 0.5 g of
soil (Hesse 1971).
• Texture was measured using the pipette method (Black ei al. 1965). Ten-g
subsamples were analysed from each plot to determine sand, clay and silt fractions.

Appendix 2. Precipitation (P) and number of rain days (Nrd) recorded at Pelaihari, South Kalimantan. 1979 -
1995Year Month Total
10 11 12
1979 467 179 251 108 334 155 135 189 134 107 156 418 263315 8 15 9 13 9 8 6 9 7 11 15 125
1980 480 389 232 440 61 205 19 34 5 68 450 477 286022 14 14 18 9 10 3 5 7 6 17 21 146
1981 490 292 138 350 270 121 140 0 241 135 962 612 375115 lO 6 9 11 3 9 0 7 8 17 18 113
1982 770 320 308 310 135 188 7 0 6 23 68 341 247618 13 19 13 3 4 1 0 2 3 7 18 101
198.1 407 320 269 258 188 93 192 54 23 180 880 655 351914 14 12 11 14 8 14 4 6 11 18 14 140
1984 454 261 655 402 241 132 213 33 227 133 154 694 359921 22 19 22 20 10 10 3 9 5 12 21 174
1985 521 489 425 144 173 112 100 120 25 98 365 377 294915 13 16 12 14 4 4 6 6 5 13 11 119
1986 312 179 276 120 106 100 142 0 22 206 179 194 183619 15 25 15 8 12 11 0 5 14 17 17 158
1987 470 303 362 161 400 147 64 6 0 29 217 489 264824 17 23 9 l.s 7 3 1 (> 4 11 16 1 to
1988 398 396 438 105 109 100 160 314 331 229 243 550 337321 21 22 13 15 8 11 18 16 12 18 23 198
1989 533 429 330 213 263 145 241 35 104 231 450 643 3617
21 21 16 19 15 11 7 5 7 17 17 20 176
1990 198 309 204 160 268 27 62 14 3 40 185 1470
15 19 19 15 19 5 10 4 2 10 10 128
1991 508 255 173 231 257 67 3 38 0 45 245 374 2196
27 15 14 16 11 3 2 3 0 4 17 21 133
1992 206 433 334 307 247 169 217 26 83 276 282 525 3105
20 15 16 18 14 9 18 2 6 14 19 21 172
1993 352 332 221 192 198 160 37 0 2 130 168 453 224517 20 21 11 18 18 5 0 1 5 15 20 151
1994 267 281 310 157 135 698 82 40 12 143 226 2351
20 17 23 15 8 15 3 3 1 15 14 134
1995 446 325 288 235 267 290 226 198 81 137 565 568 3626
17 15 10 17 12 14 10 11 6 6 15 22 1.55
crage 428 323 307 229 215 171 120 65 80 122 336 475 2871
19 16 17 14 13 9 8 4 6 8 15 18 146


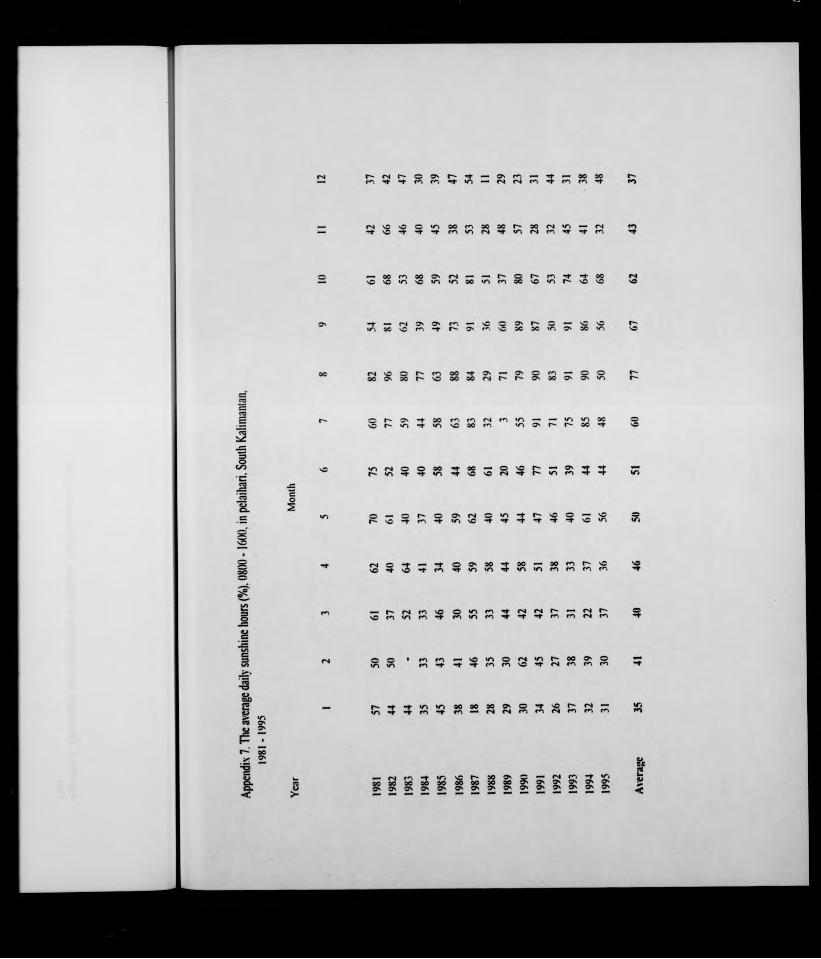


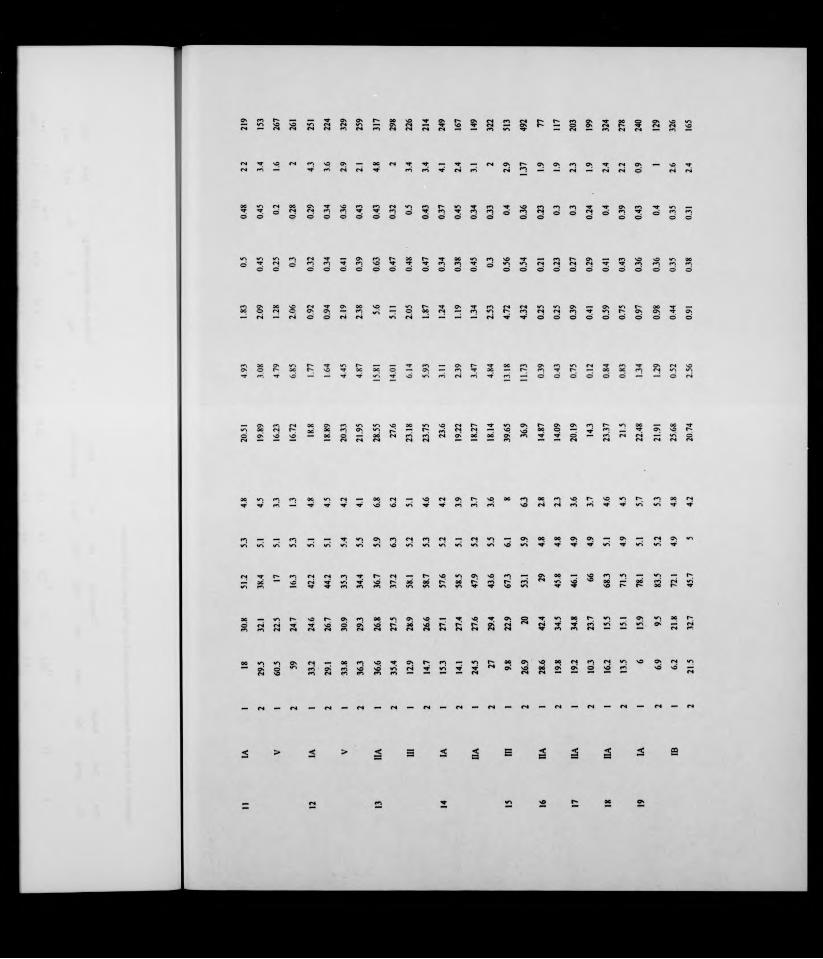


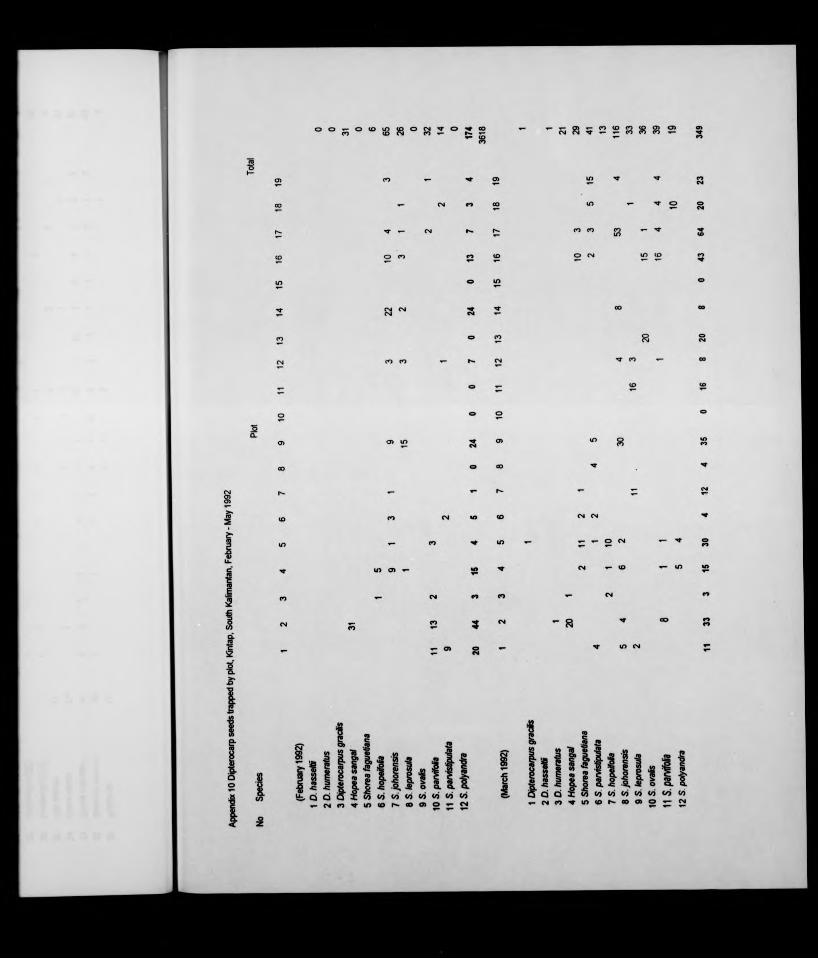


Plot 6
Plot 7
Plot 8
Plot 9
Plot 11
Plot 12
Plot 13
1 Shores johorensis2 Shorea parvifolia
1 Shorea johorensis2 Shorea parvifolia3 Shorea parvistipulata
1 Shorea hopeifolia2 Shorea Johorensis3 Shorea parvifolia4 Shorea parvistipulata
1 Dipterocarpus gracilis2 Shorea Johorensis3 Shorea parvifoliaA Shorea parvistipulata
1 H opea sangal2 Shorea Johorensis3 Shorea polyandra
1 H opea dryobalanoides2 H opea ferruginea3 H opea sangal4 Shorea Johorensis5 Shorea ovalis6 Shorea parvistipulata7 Shorea polyandra
1 Shorea Johorensis2 Shorea ovalis3 Shorea parvistipulata4 Shorea polyandra
1 Shorea Johorensis
3 3 12
3 5 1 0
42
1
6 1 0 0
210 2
14 1
14 4 2 0
11 1
1 18 2 4 1
9 6 4 2
1 17 1
1
8 3 0 0
1212
21 12
• 4 0 0
6 1 13
11
9 2 0 2
3 1
3 0 1 0
21
11
12
Plot 141 Dipterocerpus caudiferus2 D ipterocarpus hasseltH

Plot IS
Plot 16
Plot 17
Plot 18
3 Shorea leprosula 44 Shorea ovalis 15 Shorea parvistipulata 9 3
23 4
1 Dipterocarpus hasseltS 12 Shorea polyandra 3
4 0
1 Shorea faguetìana 5 3
2 Shorea Johorensis 7
3 Shorea leprosula 5
4 Shorea ovalis 185 Shorea parvifolia 13 3
6 Shorea parvistipulata 2
7 Vatica odorala 1
49 8
1 Hopes sangal 22 Shorea faguetìana 3 2
3 Shorea Johorensis 29 14
4 Shorea ovalis 11 2
5 Shorea parvifolia 12 5
6 Shorea parvistipulata 8 1
65 24
1 Shorea faguetìana2 Shorea hopeifotìa 1
13 Shorea Johorensis4 Shorea parvistipulata 2 1
94
Plot 191 Shoraa johorensis2 Shoraa ovalis3 Shoraa parvifolia4 Shoraa parvislipulata5 Vatica rassak
Sub total
11
481