1 What Makes a Function Linear Lesson 1.3. 2 What Is A Line? Check out this list of definitions or...
17
1 What Makes a Function Linear Lesson 1.3
-
Upload
yahir-luttrell -
Category
Documents
-
view
213 -
download
0
Transcript of 1 What Makes a Function Linear Lesson 1.3. 2 What Is A Line? Check out this list of definitions or...

1
What Makes a Function Linear
Lesson 1.3

2
What Is A Line?
Check out this list of definitions or explanations to the questionDefine Line
Today we look at what makes a function linear.

3
Rate of Change
Consider example y = 3x + 5We note the rate of change is constantThis means it is a linear function It graphs as a straight line
y=3x + 5

4
Plotting Points on the Calculator
Use Data Matrix on Calculator
Choose APPS, then 6 Data/Matrixthen NEW

5
Starting Up
Choose DATA Give it a variable
name for savingin memory

6
Entering Data
Enter numeric values in the cells Enter a formula at the top
Using column nameCursor must be here
Enter formula here

7
Viewing Data
Note the results of the formula We can do further calculations We can also plot these points

8
Plotting Data
Choose F2 for Plot SetupScreen
Then F1 for Define
Choose line type
Specify the columns for the X and Y values

9
Plotting Data
Goto the Y= Screen to turn off any functions there
Then specify ZoomDataThis fits the window to the limits of the data

10
Plotting Data
Note the graph includes the points we had in the data matrix
It is a line-graph, the points are represented by boxes

11
Another Example
Consider the following table of values Note the value of
for any two pairs of values
C1x
C2y
3 6
4 9
5 12
6 15
y
x
2x 6y 3x 9y 3
y
x

12
Example From Text
See Example 2, pg. 19 Formula used for depreciation
Value of equipment = original value – $4000 * number of years
To generalize:
Dependent Qty = startValue + rateOfChange * independentQuantity
y m x b
$20,000
13
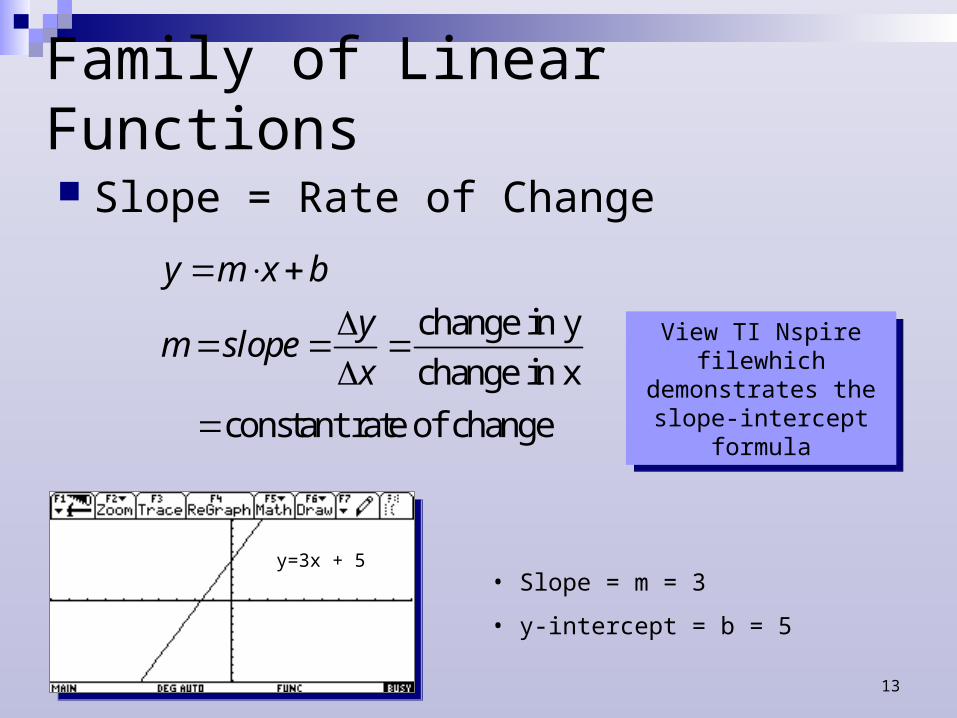
Family of Linear Functions
Slope = Rate of Change
change in y
change in x
constant rate of change
y m x b
ym slope
x
y=3x + 5• Slope = m = 3
• y-intercept = b = 5
View TI Nspire filewhich demonstrates
the slope-intercept formula
View TI Nspire filewhich demonstrates
the slope-intercept formula

14
Family of Linear Functions
Calculating slope with two ordered pairs
•
•(X1, Y1)
(X2, Y2)
xy
1 2
1 2
y yslope
x x
Given two ordered pairs, (7,5) and (-3,12). What is the slope of the line
through these two points?
5 12 70.7
7 ( 3) 10

15
Warning
Not all functions which appear linear will actually be linear!!
Consider the set of ordered pairsGraph themDecide whether graph
is linearCheck slope for different
pairs
t P
0 67.38
1 69.13
2 70.93
3 72.77
4 74.67
5 76.61
6 78.60

16
Results
Graph appearsstraight
But …rate of change is not a constant
66
68
70
72
74
76
78
80
0 2 4 6 8
t P slope
0 67.38
1 69.13 1.75
2 70.93 1.8
3 72.77 1.84
4 74.67 1.9
5 76.61 1.94
6 78.6 1.99

17
Assignment
Lesson 1.3 Page 24 Exercises
1 – 5, 7, 9, 13, 15, 19, 21, 23