1 Western Interconnection 2006 Congestion Assessment Study Prepared by the Western Congestion...
62
1 Western Interconnection 2006 Congestion Assessment Study Prepared by the Western Congestion Analysis Task Force May 08, 2006
-
Upload
anna-marshall -
Category
Documents
-
view
216 -
download
1
Transcript of 1 Western Interconnection 2006 Congestion Assessment Study Prepared by the Western Congestion...

1
Western Interconnection 2006 Congestion Assessment
Study
Prepared by the
Western Congestion Analysis Task Force
May 08, 2006

2
Western Interconnection2006 Congestion Study
- DOE Task 3 -
1. 2008 Modeling Study2. 2015 Modeling Study
– 2015 Planned Resource Development (IRPs and RPS)
3. W.I. Historical Path Usage Studies – 1999 thru 2005– Physical congestion– Commercial congestion

3
WCATF Modeling Studies ABB Gridview Model
• Model uses WECC 2005 L&R load forecast, modified with NPCC data for the NW, RMATS load forecasts for the Rocky Mtn area and the latest CEC load forecast for California
• Hourly load shapes were developed using FERC 714• Incremental transmission was added to a WECC 2008 case to represent 2015 network
topology• WECC path ratings were used, modified as necessary to more closely represent operating
experience. Path nomograms were modeled.• Gridview has the ability to model losses, wheeling rates and forced outages, however these
were not modeled in the 2015 study. (this will be pursued in the future) – Losses were included in the load projections. Loss sensitivity was investigated in the 2008 study.
• Resources– Modeled unit commitment with actual data if known; generic data if unknown– Incremental resources reflect utility IRPs and state RPS standards– Unit forced outage rates are modeled, using EIA data– Modeled Startup costs, ramp rates and variable O&M costs, gas prices of $5, $7 and $9.– Hydro and Wind are hard wired into the model, using data obtained for the major western river
systems and from the National Renewable Energy Lab.

4
WECC Transmission Paths Definition & Rating
• All WECC Cataloged Paths are modeled, representing potentially constrained W.I. Paths, including Unscheduled (Loop) Flow Qualified Paths and OTC Policy Group paths. They represent all the significant paths in the W.I.
• A Path may represent a single line or combination of parallel lines from one area or a combination of areas to another area or combination of areas
• A Path may be between Control Areas or internal to a Control Area.
• Paths are defined based upon extensive planning studies and operating experience. They are well documented through a formal process.

5
WECC Transmission Paths (Cont.)
• Ratings are established thru an open process described in the WECC “Procedures for Regional Planning Project Review and Rating Transmission Facilities” document.
• Ratings are documented in the WECC Path Rating Catalog
• Ratings include both non- simultaneous and simultaneous limits, including development of nomograms
• All ratings are established applying NERC/WECC reliability criteria; the path must be able to withstand an outage while operating at rated capacity
• Ratings in the West are determined by the more restrictive of applicable steady state or contingency limits. These include transient, voltage stability and thermal limits.
• 67 existing WECC paths are currently rated

6
WECC Transmission Paths (Cont.)• The WECC Operating Transfer Capability (OTC) Policy
Committee reviews seasonal operating ratings for selected critical paths.
• Bottom Line:– TO MAINTAIN RELIABLE OPERATION, WESTERN PATH
RATINGS ARE OFTEN BASED UPON STABILITY LIMITS WHICH MAY BE MORE LIMITING THAN THE THERMAL LIMITS THAT TYPICALLY LIMIT EASTERN PATHS. THIS IS PRIMARILY BECAUSE OF LONG TRANSMISSION DISTANCES IN THE WEST.
• All production cost modeling in the West (SSG-WI, RMATS, STEP & CDEAC studies) recognize OTC limits on all WECC paths and on all “internal” lines, but not the “day to day” operational limits that are based upon prevailing system conditions.

7
Understanding Western Path Flows
Thermal rating
(N-0 = 10,500 MW)
(N-1 = 6000 MW)
Contingency Rating
(N-1, N-2 = 4,800 MW)
WECC/NERC Criteria
Measurement of Transfer Capacity Example - California Oregon Intertie (COI)
U75 – % of time flow exceeds 75% of OTC (3,600 MW for COI)
U90 - % of time flow exceeds 90% of OTC (4,320 MW for COI)
U(Limit) - % of time flow reaches 100% of OTC (4,800 MW for COI)
WECC
Path Ratings U75, U90 and U(Limit)
% o
f T
ime
% of OTC75% 90% 100%

8
Reno-Alturas
COI
NW to Idaho
West of MCNary
Cross Cascades South
Cross Cascades North
North of John Day
North of Hanford
West ofHatwai
Northwest to Canada
PDCI
Monroe-Echo Lake
Paul-Raver
Paul-Allston
Allston-Keeler
Montana to NW
West of Broadview
West of Colstrip
Midway-Los Banos
Idaho-Sierra
Borah West
Idaho-Montana
Bridger West
Path C
Southwest of Four CornersNorthern-Southern
California
IPP DC
Intermountain-Mona
TOT 1A
TOT 2A
Bonanza West
TOT 2C
TOT 3
TOT 4A
TOT 4B
TOT 5
SDG&E-Comision Federal de Electicidad
WOR
EOR
Cholla-Pinnacle Peak
Montana Southease
Western InterconnectTransmission PathsAlberta to BC
NOTE: For clarity, not all WECC Rated Paths are shown.

9
WECC Paths Refer to WECC Path Rating Catalog for Path Details
Path # Path Name Path # Path Name
1 Alberta – British Columbia 39 TOT 5 2 Alberta - Saskatchewan 40 TOT 7 3 Northwest - Canada 41 Sylmar to SCE 4 West of Cascades - North 42 IID - SCE 5 West of Cascades - South 43 North of San Onofre 6 West of Hatwai 44 South of San Onofre 8 Montana to Northwest 45 SDG&E - CFE 9 West of Broadview 46 West of Colorado River
10 West of Colstrip 47 Southern New Mexico 11 West of Crossover 48 Northern New Mexico 14 Idaho to Northwest 49 East of Colorado River 15 Midway – Los Banos 50 Cholla – Pinnacle Peak 16 Idaho - Sierra 51 Southern Navajo 17 Borah - West 52 Silver Peak – Control 55kV 18 Idaho - Northwest 54 Coronado West 19 Bridger West 55 Brownlee East 20 Path C 58 Eldorado – Mead 230 kV 21 Arizona to California 59 WALC Blythe 161 kV Sub 22 SW of Four Corners 60 Inyo – Control 115 kV Tie 23 Four Corners 345/500 kV Tx. 61 Lugo – Victorville 500 kV line 24 PG&E - Sierra 62 Eldorado – McCullough 500 kV line 25 Pacificorp – PG&E 115 kV 63 Perkins-Mead-Marketplace 500 kV line 26 Northern – Southern California 64 Marketplace - Adelanto 27 IPP DC Line 65 Pacific DC Intertie 28 Intermountain – Mona 345 kV 66 COI 29 Intermountain – Gonder 230 kV 71 South of Allston 30 TOT 1A 73 North of John Day 31 TOT 2A 75 Midpoint – Summer Lake 32 Pavant – Gonder 230 kV 76 Alturas Project 33 Bonanza West 77 Crystal - Allen 35 TOT 2C 78 TOT 2B1 36 TOT 3 79 TOT 2B2 37 TOT 4A 80 Montana Southeast 38 TOT 4B
NOTE: There are 67 WECC Rated Paths. Not all numbers are used.

10
Part 1
2008 Modeling Study

11
Region Name Area Name Status Bio Coal Gas Hydro Wind
AZNMNV ARIZONA Add 430 1,974 2,404 NEVADA Add 1,126 1,126 NEW MEXI Add 614 614
Retire (149) (149)WAPA L.C Add 173 173
AZNMNV Total 430 3,738 4,168 CAISO IMPERIAL Add 275 275
LADWP Add 1,610 1,610 PG&E_BAY Add 100 923 50 1,073
Retire (497) (497)PG&E_VLY Add 1,047 1,047
Retire (294) (294)SANDIEGO Add 1,193 1,193
Retire (395) (395)SOCALIF Add 1,762 1,762
Retire (1,580) (1,580)CAISO Total 375 (1,580) 5,349 50 4,194 CANADA ALBERTA Add 450 354 804
Retire (134) 0 (134)CANADA Total 316 354 670 NWPP NW_EAST Add 1,583 1,215 2,798
NW_WEST Add 434 434 NWPP Total 2,017 1,215 3,232 RMPP COL E Add 569 569
IDAHO Add 170 170 KGB Add 65 65 MONTANA Add 12 119 376 8 247 762 UT N Add 547 547
Retire (116) (116)UT S Add 503 503
RMPP Total 12 119 1,879 8 482 2,500 Total 387 (715) 13,337 8 1,747 14,764
Grand Total
Fuel Type
Incremental/Decremental Units in WECC, 2004-2008SSG-WI DatabaseCapacity in MWs

12
Resources (Capacity) MW by Fuel Type 2008 Load
REGION AREANameplate
Capacity MW
Discounted Capacity (per
2015 Case protocol) Coal Nat. Gas Oil
Hydro + Pumped Wind Other
ANNUAL ENERGY MWh
SUMMER PEAK MW (Jul-Aug)
WINTER PEAK MW (Dec-Jan)
CALIF ("CAISO") IMPERIAL 1,558 1,542 0 307 32 176 21 1,022 2,435,562 901 420CALIF ("CAISO") LADWP 6,022 5,932 0 4,899 0 1,003 120 0 27,608,019 5,736 4,644CALIF ("CAISO") MEXICO-C 3,313 3,313 0 2,175 439 0 0 699 8,941,612 2,229 1,662CALIF ("CAISO") PG&E_BAY 7,305 6,924 20 5,726 860 0 508 192 44,493,246 7,998 6,887CALIF ("CAISO") PG&E_VLY 24,568 23,633 50 11,723 174 8,579 1,247 2,796 88,948,052 17,240 13,103CALIF ("CAISO") SANDIEGO 4,609 4,609 0 4,561 48 0 0 0 19,113,488 4,631 3,582CALIF ("CAISO") SOCALIF 19,709 18,606 108 14,080 50 1,315 1,472 2,685 105,863,402 23,372 17,891AZNMNV ARIZONA 23,097 23,097 7,779 10,808 140 233 0 4,137 74,240,648 18,683 12,050AZNMNV NEVADA 7,582 7,582 605 6,800 177 0 0 0 20,863,359 6,008 3,115AZNMNV NEW MEXI 4,472 4,280 2,037 2,161 20 14 240 0 17,778,053 3,906 3,416AZNMNV WAPA L.C 5,939 5,939 0 2,197 0 3,742 0 0 2,357,343 208 201CANADA ALBERTA 11,944 11,859 5,380 4,904 0 1,493 106 62 59,916,102 8,217 8,570CANADA B.C.HYDR 11,995 11,995 0 1,639 0 10,356 0 0 56,876,741 7,199 9,187NWPP NW_EAST 34,274 29,984 0 3,628 24 27,639 1,693 1,290 72,335,959 10,955 12,017NWPP NW_WEST 11,574 10,965 1,966 4,148 74 5,067 89 230 104,868,308 15,508 17,378RMPP B HILL 1,020 1,020 522 317 42 139 0 0 5,669,651 851 835RMPP BHB 0 0 0 0 0 0 0 0 3,441,377 425 474RMPP BONZ 468 468 468 0 0 0 0 0 1,045,306 197 147RMPP COL E 8,866 8,688 3,517 4,287 120 744 198 0 52,116,113 8,878 7,920RMPP COL W 2,294 2,294 1,904 104 0 286 0 0 5,829,865 871 913RMPP IDAHO 2,393 2,035 0 135 0 2,088 170 0 15,010,623 3,025 2,311RMPP IPP 1,847 1,847 1,847 0 0 0 0 0 0 1 1RMPP JB 2,128 2,128 2,128 0 0 0 0 0 0 1 1RMPP KGB 324 272 15 0 0 244 65 0 6,118,633 1,275 965RMPP LRS 1,628 1,628 1,107 300 0 221 0 0 3,757,124 531 520RMPP MONTANA 3,911 3,714 2,511 376 0 700 247 77 8,992,483 1,611 1,620RMPP SIERRA 1,878 1,835 565 1,206 0 0 53 53 10,271,004 1,737 1,439RMPP SW WYO 264 181 0 0 0 160 104 0 3,401,463 481 400RMPP UT N 2,458 2,458 929 1,445 0 84 0 0 33,841,556 6,256 4,295RMPP UT S 2,911 2,911 2,274 613 0 0 0 24 4,993,398 967 672RMPP WYO 775 775 775 0 0 0 0 0 2,283,714 338 289RMPP YLW TL 288 288 0 0 0 288 0 0 8,784 1 1
Total Capacity 211,411 202,799 36,506 88,538 2,200 64,569 6,331 13,267 863,420,989 160,237 136,926
Specific Capacity Credits (All other resources are counted at 100% of their noted capacity)7.5% Capacity Credit for BC Hydro Wind Resources
89.4%20% Capacity Credit for Wind - General
25% Capacity Credit for California Wind Resources
10% Capacity Credit for Colorado Wind Resources
10,356 BCHydro existing resource in Peace, Columbia and Coastal river systems are modeled at "dependable" capacity per Mary Johannis, so no "discount: is applied here.
Hydro Credit in NW (OR, WA, ID) (Based on Low Water availability being 4,000MW less than the 37,368MW average availability prior to adding 2015 incremental
2008 MODEL - - LOAD AND RESOURCES SUMMARY

13
Path Name
Limit in Pos. Dir.
(MW)
Limit in Neg. Dir.
(MW) Path Name
Limit in Pos. Dir.
(MW)
Limit in Neg. Dir.
(MW) Path Name
Limit in Pos. Dir.
(MW)
Limit in Neg. Dir.
(MW) ALBERTA - BRITISH COLUMBIA 700 -720 PAVANT INTRMTN - GONDER 230 KV 440 -235 Z1-Imperial Valley - Ramona 1212ALBERTA - SASKATCHEWAN 150 -150 PERKINS - MEAD - MARKETPLACE 500 1400 Z1-Imperial Valley to Miguel 2200ALTURAS PROJECT 300 -300 PG&E - SPP 160 -150 Z1-Miguel Bank No. 1 1120 -1120BILLINGS - YELLOWTAIL 400 -400 SILVER PEAK - CONTROL 55 KV 17 -17 Z1-Miguel Bank No. 2 1120 -1120BONANZA WEST 785 SOUTH OF SAN ONOFRE 2500 Z1-North of Miguel 2000BORAH WEST 2557 SOUTHERN NEW MEXICO (NM1) 1048 -1048 Z1-PV to Devers 2280BRIDGER WEST 2200 SOUTHWEST OF FOUR CORNERS 2325 Z2- SDGE Import Limit 2850BROWNLEE EAST 1850 SYLMAR - SCE 1600 -1600 Z2: South of Lugo 6100 -6100CHOLLA - PINNACLE PEAK 1200 TOT 1A 650 Z20-Imperial Valley - Miguel 2 2252 -2252CORONADO - SILVER KING - KYRENE 1100 TOT 2A 690 Z2-EOR 7550EAGLE MTN 230_161 KV - BLYTHE 16 72 -218 Tot 2a 2b 2c Nomogram 1570 -1600 Z2-SCIT 16700 -16700ELDORADO - MCCULLOUGH 500 KV 2598 -2598 TOT 2B 780 -850 Z2-WOR 10623ELDORADO - MEAD 230 KV LINES 1140 -1140 TOT 2B1 560 -600 Z3- Eldorado - Lugo 1386 -1386FOUR CORNERS 345_500 840 -840 TOT 2B2 265 -300 Z3-Market Place - Adelanto 1636 -1636IDAHO - MONTANA 337 -337 TOT 2C 300 -300 Z3-Mccullgh - Victorville 1385 -1385IDAHO - NORTHWEST 2400 -1200 TOT 3 1450 Z3-Mohave - Lugo 1386 -1386IDAHO - SIERRA 500 -360 TOT 4A 810 Z4- Jojoba - Kyrene 1732 -1732IID - SCE 600 TOT 4B 680 Z4- Moenkopi - El Dorado 1645 -1645INTERMOUNTAIN - GONDER 230 KV 220 TOT 5 1675 Z4-Navajo - Crystal 1411 -1411INTERMOUNTAIN - MONA 345 KV 1400 -1200 TOT 7 890 Z4-Peacock - Mead 508 -508INYO - CONTROL 115 KV TIE 56 -56 WEST OF BROADVIEW 2573 Z4-Perkins - Big Sandy 1238 -1238IPP DC LINE 1920 -1400 WEST OF CASCADES - NORTH 10500 -10500 Z5-Navajo - Moenkopi 1411LUGO - VICTORVILLE 500 KV LINE 2400 -900 WEST OF CASCADES - SOUTH 7000 -7000 Z5-Navajo - Table Mesa 985MARKETPLACE - ADELANTO 1200 -1200 WEST OF COLSTRIP 2598 Z5-South of Navajo 2264MIDPOINT - SUMMER LAKE 1500 -600 WEST OF CROSSOVER 2598 Z6- Path 26 3700 -3000MONTANA - NORTHWEST 2200 -1350 WEST OF HATWAI 4277 Z6-COI 4700 -3675NORTH OF JOHN DAY 8600 -8600 WOR - IID230 600 -600 Z6-East of PV 6620NORTH OF SAN ONOFRE 2440 WOR - N.Gila 1861 Z6-MIDWAY - LOS BANOS 5400NORTHERN NEW MEXICO (NM2) 1800 WOR -n- El Dor to Lugo 2754 Z7- Miguel - Tijuana 912 -912NORTHWEST - CANADA 2000 -3150 WOR -n- Mc-Vic 2592 Z7-Imperial Valley - La Rosita 797 -797PACI vs PDCI 7300 Z1- Devers Bank No. 1 1120 -1120 Z7-Path 45 408 -800PACIFIC DC INTERTIE (PDCI) 3000 -2100 Z1- El Centro Bank 225 -225PACIFICORP_PG&E 115 KV INTERCON. 80 -45 Z1- Hassayampa - N. Gila 1861PATH C 775 -850 Z1- N. Gila - Imperial Valley 1861
2008 Modeling StudyPath Limits used in 2008 Study

14
Notes for Reviewing the 2008 Study Results
• Yellow Paths in the Tables are WECC Rated Paths• White Paths in the Tables are other monitored lines, mostly located within
WECC Rated Paths• Study Metrics – U75, U90, U(Limit), Congestion Rent, Shadow Price
averaged over 8760 hours, Shadow Price averaged over the “binding (or limit)” hours
• Metrics used to Identify Congestion Areas – Binding Hours Shadow Price, U75 and U90
• The following Paths may be considered by their owners to be “dedicated” facilities, planned and designed to integrate or deliver specified resources to load: (These were designed to be high usage paths and may not be considered congested)
– Path 27 – Intermountain Power Project (IPP) DC Line– Path 19 – West of Bridger

15
Definitions
• U(Limit) = Annual Hours operating at the Path’s Limit
• U75 & U90 = Hours of the year a path operates above 75% or 90% of the Path Limit. Note that in the historical path studies, U75 is sometimes the maximum seasonal value over the years studied.
• Congestion Rent = Average Hourly Shadow Price times Path Flow on that Hour, summed for the year
• Average Shadow Price = Average of the hourly Shadow Prices, averaged over 8760 Hours
• Binding Hour Average Shadow Price = Average Shadow Price, averaged over the number of hours the path is at its limit.

16
2008
Path Usage StudyResults
$5, $7 (reference) and $9 Gas Price

17
Page 1 of 2
Path Name
U(Limit) Congestion Hours (Hrs)
U90 Hours (Hrs)
U75 Hours (Hrs)
U(Limit) Congestion Hours (Hrs)
U90 Hours (Hrs)
U75 Hours (Hrs)
U(Limit) Congestion Hours (Hrs)
U90 Hours (Hrs)
U75 Hours (Hrs)
Nav - Crystl 7,428 8,231 8,760 6,997 8,091 8,680 6,461 7,815 8,382 Bonz - Mona 7,198 7,880 8,513 7,045 7,793 8,504 7,018 7,765 8,493 ALB BC 7,650 7,769 7,938 7,493 7,633 7,801 7,277 7,414 7,613 Cry - McC 7,180 7,494 7,916 7,366 7,601 7,882 7,069 7,310 7,577 Pea - Mead 7,006 7,109 7,338 7,072 7,152 7,411 6936 7054 7388HA RB PS 7,460 7,581 7,728 6,912 7,046 7,216 6,546 6,673 6,873 TOT 2C - 7,522 7,678 - 6,970 7,159 - 6,616 6,821 PAC PG&E 6,653 6,660 6,704 6,605 6,618 6,684 6,418 6,433 6,498 BR West 3,633 6,240 7,884 3,763 6,341 7,905 3,967 6,397 7,921 IID - SCE 2,620 4,666 6,905 3,725 5,734 7,390 4,861 6,585 7,735 MT NW 3,761 5,787 7,718 3,624 5,678 7,688 4,029 6,002 7,984 INT GOND 4,821 5,375 6,255 4,348 5,015 6,073 4,315 5,070 6,058 SW 4C 1,194 4,249 7,541 1,860 4,923 7,555 2,308 5,046 7,473 COR SK KY 1,383 5,244 7,030 1,234 4,610 7,009 1,130 4,218 6,979 EOR 1,395 5,868 8,192 949 4,593 8,058 356 2,835 7,639 Ship San J 2,945 4,571 6,804 3,018 4,572 6,652 2945 4510 6553PDCI 3,585 4,090 4,612 3,592 4,097 4,696 3,608 4,172 4,814 INYO CONT - 3,803 4,717 - 3,705 4,616 - 3,361 4,361 Malin - RM 2,645 3,806 5,258 2,389 3,550 5,072 2203 3275 4836IPP DC LINE 2,164 3,600 5,486 2,365 3,539 5,285 2,519 3,678 5,316 COI - 3,335 4,945 - 3,093 4,773 - 2,859 4,513 LUGO - VIC - 3,468 6,104 - 3,006 5,509 - 2,526 4,935 ALTURAS - 2,848 3,822 - 2,984 4,009 - 2,777 3,879 TOT 2A 841 1,722 3,330 1,925 2,851 4,144 2,530 3,375 4,631 W BROAD 92 3,158 7,710 7 2,807 7,486 86 3,101 7,847 El Dor Lugo 509 2,716 6,048 479 2,476 5,794 317 2,051 5,259 BONZ W - 2,252 7,982 - 2,178 7,904 - 2,183 7,898 CH PPK - 1,585 6,917 - 1,893 6,830 - 2,037 6,684 Hasy N Gila 1,190 2,975 6,547 588 1,862 5,195 177 945 3838SDG&E to CFE 702 1,097 1,895 794 1,091 1,641 1,005 1,270 1,842 PVINTR GOND - 1,063 5,157 - 974 4,778 - 815 4,848 Z2-WOR - 1,125 5,091 - 968 4,725 - 587 4,093 PATH C 609 907 1,515 652 959 1,587 639 972 1,566 TOT 1A 707 873 4,234 709 904 4,296 700 877 4,251 MARKETPLACE - ADELANTO 80 839 4,154 82 808 3,964 44 664 3,516
$5 Gas $7 gas $9 Gas
2008 - Modeled Path Usage U75, U90 and U(Limit) - - $5, $7 and $9 HH Gas Price - Med Hydro, Average Losses
Ordered by $7 U90 A dash in the table = 0 hours

18
page 2 of 2
Path Name
U(Limit) Congestion Hours (Hrs)
U90 Hours (Hrs)
U75 Hours (Hrs)
U(Limit) Congestion Hours (Hrs)
U90 Hours (Hrs)
U75 Hours (Hrs)
U(Limit) Congestion Hours (Hrs)
U90 Hours (Hrs)
U75 Hours (Hrs)
IDAHO - SIERRA 338 908 2,046 286 690 1,679 342 802 1,804 FOUR CORNERS 345_500 624 626 2,710 624 624 3,175 624 624 3,224 BILLINGS - YELLOWTAIL - 386 1,558 - 623 1,868 - 468 1,633 NORTH OF SAN ONOFRE 27 469 2,255 33 613 2,973 40 499 3,089 MIDPOINT - SUMMER LAKE - 491 1,863 - 587 2,181 - 573 2,128 Moenkopi - El Dorado (EOR) - 675 7,855 - 459 7,674 - 216 7,248 TOT 4B 38 385 1,517 58 459 1,817 40 429 1,530 WEST OF CROSSOVER - 313 7,498 - 447 7,483 - 289 7,477 N. Gila - Imperial Valley WOR) - 564 4,110 - 415 2,915 - 165 1,872 NORTHWEST - CANADA 87 320 689 169 399 775 221 461 906 SOUTHERN NEW MEXICO (NM1) 19 256 1,670 35 364 2,184 44 608 3,046 BORAH WEST - 185 3,655 - 230 3,813 - 246 3,760 PG&E - SPP 42 303 4,365 21 215 4,160 26 187 4,294 PV to Devers (EOR) - 194 2,419 - 98 2,034 - 31 1,567 INTERMOUNTAIN - MONA 345 KV - 77 426 - 89 510 - 111 518 TOT 4A 6 62 258 5 66 258 8 97 285 BROWNLEE EAST - 73 467 - 64 416 - 63 408 Mohave - Lugo (WOR) - 15 4,106 - 19 3,833 - 4 3,187 TOT 2B2 - - 359 - 7 752 - 5 1,030 IDAHO - NORTHWEST 1 6 520 - 6 596 - 7 586 TOT 3 3 26 318 - 3 219 - - 200 WEST OF COLSTRIP - - 6,600 - - 6,600 - - 6,600 SILVER PEAK - CONTROL 55 KV - - 4,081 - - 4,249 - - 4,326 PERKINS - MEAD - MARKETPLACE 500 - - 1,495 - - 1,108 - - 537 NORTHERN NEW MEXICO (NM2) - - 71 - - 85 - - 99 TOT 7 - - 9 - - 6 - - 2 ALBERTA - SASKATCHEWAN - - - - - - - - - CENTENNIAL - - - - - - - - - EAGLE MTN 230_161 KV - BLYTHE 16 - - - - - - - - - ELDORADO - MCCULLOUGH 500 KV - - - - - - - - - ELDORADO - MEAD 230 KV LINES - - - - - - - - - IDAHO - MONTANA - - - - - - - - - NORTH OF JOHN DAY - - - - - - - - - SOUTH OF SAN ONOFRE - - - - - - - - - SYLMAR - SCE - - - - - - - - - TOT 2B1 - - - - - - - - - TOT 5 - - - - - - - - - WEST OF CASCADES - NORTH - - - - - - - - - WEST OF CASCADES - SOUTH - - - - - - - - - WEST OF HATWAI - - - - - - - - -
$5 Gas $7 gas $9 Gas

19
Page 1 of 2
Path Name
U(Limit) Congestion
Hours Ranking
U90 Hours Ranking
U75 Hours Ranking
U(Limit) Congestion
Hours Ranking
U90 Hours Ranking
U75 Hours Ranking
U(Limit) Congestion
Hours Ranking
U90 Hours Ranking
U75 Hours Ranking
Navajo - Crystal (EOR) 3 1 1 5 1 1 6 1 2 Bonanza - Mona (Bonanza West) 4 2 2 4 2 2 3 2 1 ALBERTA - BRITISH COLUMBIA 1 3 5 1 3 7 1 3 9 Crystal - McCullough (EOR) 5 6 6 2 4 6 2 4 10 Peacock - Mead (EOR) 6 7 15 3 5 13 4 5 13HA PS - Red Butte (TOT 2C) 2 4 9 6 6 15 5 6 16 TOT 2C - 5 12 - 7 16 - 7 17 PACIFICORP_PG&E 115 KV INTERCON. 7 8 20 7 8 19 7 9 21 BRIDGER WEST 10 9 7 9 9 4 11 10 4 IID - SCE 15 14 18 10 10 14 8 8 7 MONTANA - NORTHWEST 9 11 10 11 11 8 10 11 3 INTERMOUNTAIN - GONDER 230 KV 8 12 24 8 12 23 9 12 22 SOUTHWEST OF FOUR CORNERS 19 17 13 18 13 10 16 13 12 CORONADO - SILVER KING - KYRENE 18 13 16 19 14 17 19 15 15 EOR 17 10 3 20 15 3 24 24 8 Shiprock - San Juan 12 15 19 13 16 20 13 14 20PACIFIC DC INTERTIE (PDCI) 11 18 33 12 17 32 12 16 29 INYO - CONTROL 115 KV TIE - 20 32 - 19 33 - 19 32 Malin - RM 1 & 2 (COI) 13 19 28 14 20 28 17 20 28IPP DC LINE 16 21 27 15 21 26 15 17 24 COI - 23 31 - 22 30 - 23 31 LUGO - VICTORVILLE 500 KV LINE - 22 25 - 23 25 - 26 26 ALTURAS PROJECT - 26 40 - 24 38 - 25 37 TOT 2A 21 29 42 17 25 37 14 18 30 WEST OF BROADVIEW 28 24 11 34 26 11 29 22 6 El Dor to Lugo (WOR) 26 27 26 26 27 24 26 28 25 BONANZA WEST - 28 4 - 28 5 - 27 5 CHOLLA - PINNACLE PEAK - 30 17 - 29 18 - 29 18 Hassy - N. Gila (EOR) 20 25 23 25 30 27 28 32 38SDG&E to CFE 23 32 47 21 31 51 20 30 47 PAVANT INTRMTN - GONDER 230 KV - 33 29 - 32 29 - 34 27 Z2-WOR - 31 30 - 33 31 - 39 36 PATH C 25 35 52 23 34 52 22 31 51 TOT 1A 22 36 35 22 35 34 21 33 35 MARKETPLACE - ADELANTO 30 37 36 29 36 39 30 36 40
$5 Gas $7 gas $9 Gas
2008 - Modeled Path Usage Metric RankingU75, U90 and U(Limit) - - $5, $7 and $9 HH Gas Price - Med. Hydro, Average Losses
Ordered by $7 U90 A dash in the table indicates the path was unranked since the Hours = 0
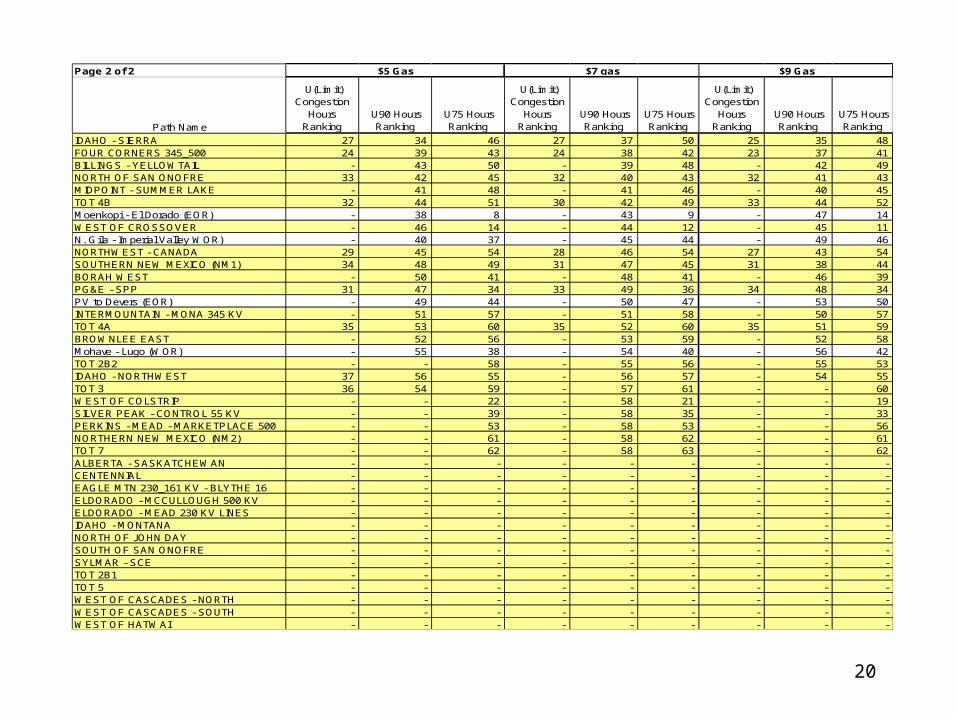
20
Page 2 of 2
Path Name
U(Limit) Congestion
Hours Ranking
U90 Hours Ranking
U75 Hours Ranking
U(Limit) Congestion
Hours Ranking
U90 Hours Ranking
U75 Hours Ranking
U(Limit) Congestion
Hours Ranking
U90 Hours Ranking
U75 Hours Ranking
IDAHO - SIERRA 27 34 46 27 37 50 25 35 48 FOUR CORNERS 345_500 24 39 43 24 38 42 23 37 41 BILLINGS - YELLOWTAIL - 43 50 - 39 48 - 42 49 NORTH OF SAN ONOFRE 33 42 45 32 40 43 32 41 43 MIDPOINT - SUMMER LAKE - 41 48 - 41 46 - 40 45 TOT 4B 32 44 51 30 42 49 33 44 52 Moenkopi - El Dorado (EOR) - 38 8 - 43 9 - 47 14 WEST OF CROSSOVER - 46 14 - 44 12 - 45 11 N. Gila - Imperial Valley WOR) - 40 37 - 45 44 - 49 46 NORTHWEST - CANADA 29 45 54 28 46 54 27 43 54 SOUTHERN NEW MEXICO (NM1) 34 48 49 31 47 45 31 38 44 BORAH WEST - 50 41 - 48 41 - 46 39 PG&E - SPP 31 47 34 33 49 36 34 48 34 PV to Devers (EOR) - 49 44 - 50 47 - 53 50 INTERMOUNTAIN - MONA 345 KV - 51 57 - 51 58 - 50 57 TOT 4A 35 53 60 35 52 60 35 51 59 BROWNLEE EAST - 52 56 - 53 59 - 52 58 Mohave - Lugo (WOR) - 55 38 - 54 40 - 56 42 TOT 2B2 - - 58 - 55 56 - 55 53 IDAHO - NORTHWEST 37 56 55 - 56 57 - 54 55 TOT 3 36 54 59 - 57 61 - - 60 WEST OF COLSTRIP - - 22 - 58 21 - - 19 SILVER PEAK - CONTROL 55 KV - - 39 - 58 35 - - 33 PERKINS - MEAD - MARKETPLACE 500 - - 53 - 58 53 - - 56 NORTHERN NEW MEXICO (NM2) - - 61 - 58 62 - - 61 TOT 7 - - 62 - 58 63 - - 62 ALBERTA - SASKATCHEWAN - - - - - - - - - CENTENNIAL - - - - - - - - - EAGLE MTN 230_161 KV - BLYTHE 16 - - - - - - - - - ELDORADO - MCCULLOUGH 500 KV - - - - - - - - - ELDORADO - MEAD 230 KV LINES - - - - - - - - - IDAHO - MONTANA - - - - - - - - - NORTH OF JOHN DAY - - - - - - - - - SOUTH OF SAN ONOFRE - - - - - - - - - SYLMAR - SCE - - - - - - - - - TOT 2B1 - - - - - - - - - TOT 5 - - - - - - - - - WEST OF CASCADES - NORTH - - - - - - - - - WEST OF CASCADES - SOUTH - - - - - - - - - WEST OF HATWAI - - - - - - - - -
$5 Gas $7 gas $9 Gas

21
2008 Model StudyU90, U75 and U(Limit) - $7 HH Gas, Medium Hydro, Ave. Losses
Ordered by U90, $7 Gas
-
1,000
2,000
3,000
4,000
5,000
6,000
7,000
8,000
9,000
10,000N
av
- C
rys
tl
Bo
nz
- M
on
a
AL
B B
C
Cry
- M
cC
Pe
a -
Me
ad
HA
RB
PS
TO
T 2
C
PA
C P
G&
E
BR
We
st
IID -
SC
E
MT
NW
INT
GO
ND
SW
4C
CO
R S
K K
Y
EO
R
Sh
ip S
an
J
PD
CI
INY
O C
ON
T
Ma
lin -
RM
IPP
DC
LIN
E
CO
I
LU
GO
- V
IC
AL
TU
RA
S
TO
T 2
A
W B
RO
AD
El D
or
Lu
go
BO
NZ
W
CH
PP
K
Ha
sy
N G
ila
SD
G&
E t
o C
FE
PV
INT
R G
ON
D
Z2
-WO
R
PA
TH
C
TO
T 1
A
Path Name
Ho
urs
U90
U75
U(Lim)

22
2008 Modeling StudyU90 at $5, $7 and $9 HH Gas, Medium Hydro, Average Losses
Ordered by U90 $7 Gas
-
1,000
2,000
3,000
4,000
5,000
6,000
7,000
8,000
9,000
10,000
Na
v -
Cry
stl
Bo
nz
- M
on
a
AL
B B
C
Cry
- M
cC
Pe
a -
Me
ad
HA
RB
PS
TO
T 2
C
PA
C P
G&
E
BR
We
st
IID -
SC
E
MT
NW
INT
GO
ND
SW
4C
CO
R S
K K
Y
EO
R
Sh
ip S
an
J
PD
CI
INY
O C
ON
T
Ma
lin -
RM
IPP
DC
LIN
E
CO
I
LU
GO
- V
IC
AL
TU
RA
S
TO
T 2
A
W B
RO
AD
El D
or
Lu
go
BO
NZ
W
CH
PP
K
Ha
sy
N G
ila
SD
G&
E t
o C
FE
PV
INT
R G
ON
D
Z2
-WO
R
PA
TH
C
TO
T 1
A
Path Name
Ho
urs
$7 Gas
$5 Gas
$9 Gas

23
2008 Modeling StudyU(Limit) - $5, $7 and $9 Gas, Medium Hydro, Ave. Losses
Ordered by U90 $7 Gas
-
1,000
2,000
3,000
4,000
5,000
6,000
7,000
8,000
9,000
10,000
Na
v -
Cry
stl
Bo
nz
- M
on
a
AL
B B
C
Cry
- M
cC
Pe
a -
Me
ad
HA
RB
PS
TO
T 2
C
PA
C P
G&
E
BR
We
st
IID -
SC
E
MT
NW
INT
GO
ND
SW
4C
CO
R S
K K
Y
EO
R
Sh
ip S
an
J
PD
CI
INY
O C
ON
T
Ma
lin -
RM
IPP
DC
LIN
E
CO
I
LU
GO
- V
IC
AL
TU
RA
S
TO
T 2
A
W B
RO
AD
El D
or
Lu
go
BO
NZ
W
CH
PP
K
Ha
sy
N G
ila
SD
G&
E t
o C
FE
PV
INT
R G
ON
D
Z2
-WO
R
PA
TH
C
TO
T 1
A
Path Name
Ho
urs
$7 Gas
$5 Gas
$9 Gas

24
2008 Modeling StudyU75 - $5, $7 and $9 Gas, Medium Hydro, Ave. Losses
Ordered by U90, $7 Gas
-
1,000
2,000
3,000
4,000
5,000
6,000
7,000
8,000
9,000
10,000
Na
v -
Cry
stl
Bo
nz
- M
on
a
AL
B B
C
Cry
- M
cC
Pe
a -
Me
ad
HA
RB
PS
TO
T 2
C
PA
C P
G&
E
BR
We
st
IID -
SC
E
MT
NW
INT
GO
ND
SW
4C
CO
R S
K K
Y
EO
R
Sh
ip S
an
J
PD
CI
INY
O C
ON
T
Ma
lin -
RM
IPP
DC
LIN
E
CO
I
LU
GO
- V
IC
AL
TU
RA
S
TO
T 2
A
W B
RO
AD
El D
or
Lu
go
BO
NZ
W
CH
PP
K
Ha
sy
N G
ila
SD
G&
E t
o C
FE
PV
INT
R G
ON
D
Z2
-WO
R
PA
TH
C
TO
T 1
A
Path Name
Ho
urs
$7 Gas
$5 Gas
$9 Gas

25
2008 Model StudyU75 - $5, $7 and $9 Gas - - Medium Hydro, Ave Losses
Ordered by U75, $7 Gas
-
1,000
2,000
3,000
4,000
5,000
6,000
7,000
8,000
9,000
10,000
Na
v -
Cry
stl
Bo
nz
- M
on
a
EO
R
BR
We
st
BO
NZ
W
Cry
- M
cC
AL
B B
C
MT
NW
Mo
en
- E
l D
SW
4C
W B
RO
AD
W O
F C
RO
SS
Pe
a -
Me
ad
IID -
SC
E
HA
RB
PS
TO
T 2
C
CO
R S
K K
Y
CH
PP
K
PA
C P
G&
E
Sh
ip S
an
J
W O
F C
OL
S
INT
GO
ND
El D
or
Lu
go
LU
GO
- V
IC
IPP
DC
LIN
E
Ha
sy
N G
ila
Ma
lin -
RM
PV
INT
R G
ON
D
CO
I
Z2
-WO
R
PD
CI
INY
O C
ON
T
TO
T 1
A
SIL
PK
- C
ON
PG
&E
- S
PP
TO
T 2
A
Path Name
Ho
urs $7 Gas
$5 Gas
$9 Gas

26
2008 Path Shadow Prices
Results

27
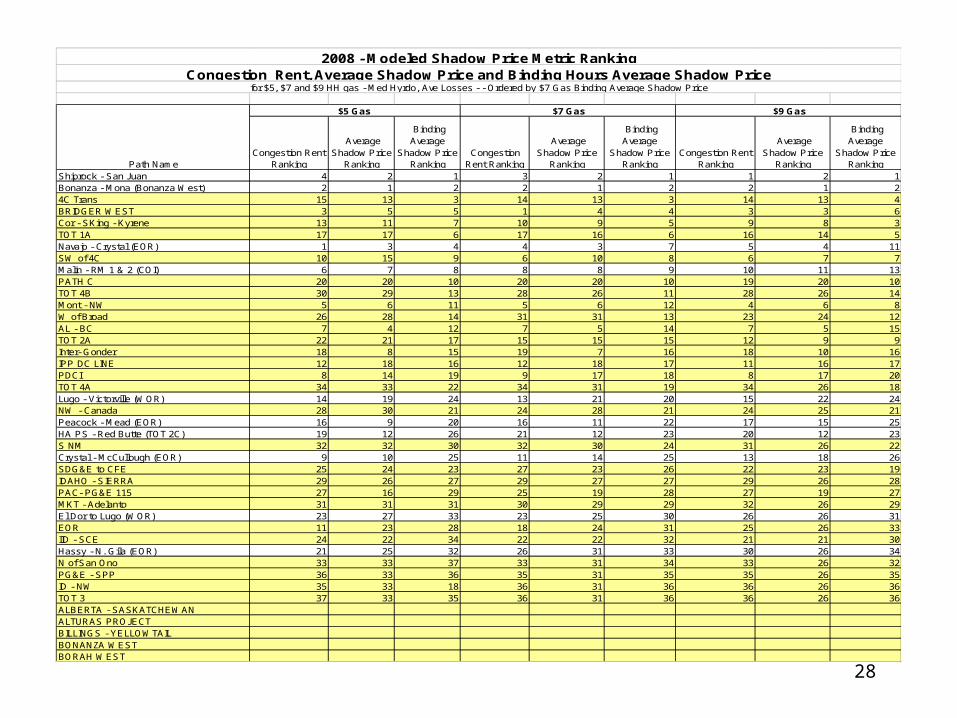
Congestion Rent (k$/yr)
Average Shadow
Price ($/MW)
Binding Average Shadow
Price ($/MW) Congestion Rent (k$/yr)
Average Shadow
Price ($/MW)
Binding Average
Shadow Price ($/MW)
Congestion Rent (k$/yr)
Average Shadow
Price ($/MW)
Binding Average
Shadow Price ($/MW)
Shiprock - San Juan 76,189.97 12.7 38.0 129,963.36 21.7 63.2 175,350.41 29.3 87.4 Bonanze - Mona (Bonanza West) 107,145.85 19.8 24.1 131,555.28 24.3 30.2 159,709.73 29.4 36.9 4C Trans 9,064.17 1.2 17.3 10,898.85 1.5 20.8 11,105.78 1.5 21.2 BRIDGER WEST 96,626.08 5.0 12.1 134,152.81 6.9 16.2 156,967.43 8.1 18.0 Cor - Sking - Kyrene 13,949.27 1.4 9.2 21,445.63 2.2 15.8 31,425.74 3.3 25.3 TOT 1A 5,530.90 1.0 12.0 7,019.06 1.2 15.2 8,444.83 1.5 18.6 Navajo - Crystal (EOR) 140,908.70 11.4 13.4 116,844.42 9.4 11.8 89,182.88 7.2 9.8 SW of 4C 22,402.87 1.1 8.1 43,389.05 2.1 10.0 70,111.43 3.4 13.1 Malin - RM 1 & 2 (COI) 35,022.26 2.7 8.9 31,846.99 2.4 9.0 29,295.25 2.3 9.0 PATH C 3,324.91 0.5 6.9 4,518.17 0.6 8.8 5,074.11 0.7 10.0 TOT 4B 155.17 0.0 6.0 323.17 0.1 8.2 233.55 0.0 8.6 Mont - NW 53,230.99 2.8 6.4 63,815.86 3.3 8.0 89,353.26 4.6 10.1 W of Broad 1,095.70 0.0 4.6 123.56 0.0 6.9 2,030.99 0.1 9.2 AL - BC 34,070.17 5.5 6.4 35,227.22 5.7 6.7 36,591.23 6.0 7.2 TOT 2A 2,065.56 0.3 3.6 7,848.89 1.3 5.9 17,524.90 2.9 10.0 Inter- Gonder 4,083.24 2.1 3.8 4,676.19 2.4 4.9 5,369.55 2.8 5.7 IPP DC LINE 14,878.02 0.9 3.6 18,623.10 1.1 4.1 21,670.00 1.3 4.5 PDCI 29,356.02 1.1 2.7 30,951.55 1.2 2.9 33,589.62 1.3 3.1 TOT 4A 11.18 0.0 2.3 10.13 0.0 2.5 28.32 0.0 4.4 Lugo - Victorville (WOR) 12,364.42 0.6 2.1 12,160.90 0.6 2.3 10,465.25 0.5 2.4 NW - Canada 419.66 0.0 2.4 722.96 0.0 2.1 1,239.27 0.1 2.8 Peacock - Mead (EOR) 8,397.42 2.0 2.5 7,255.19 1.7 2.1 5,782.45 1.4 1.7 HA PS - Red Butte (TOT 2C) 3,332.36 1.3 1.6 4,002.12 1.6 2.0 4,554.29 1.8 2.4 S NM 26.99 0.0 1.4 72.86 0.0 2.0 122.17 0.0 2.6 Crystal - McCullough (EOR) 24,786.21 1.6 2.0 20,737.79 1.4 1.6 15,974.52 1.1 1.3 SDG&E to CFE 1,109.89 0.2 2.1 482.24 0.1 1.4 2,411.61 0.5 3.9 IDAHO - SIERRA 252.04 0.1 1.5 192.87 0.0 1.3 215.12 0.0 1.3 PAC- PG&E 115 760.87 1.1 1.4 701.47 1.0 1.3 664.51 0.9 1.3 MKT - Adelanto 110.59 0.0 1.2 126.78 0.0 1.3 56.71 0.0 1.1 El Dor to Lugo (WOR) 1,325.02 0.1 0.9 1,325.43 0.1 1.0 672.14 0.0 0.8 EOR 15,432.41 0.2 1.5 6,095.96 0.1 0.9 1,123.50 0.0 0.4 IID - SCE 1,297.60 0.2 0.8 1,809.29 0.3 0.8 2,812.40 0.5 1.0 Hassy - N. Gila (EOR) 2,232.26 0.1 1.0 637.24 - 0.6 141.51 - 0.4 N of San Ono 23.46 0.0 0.4 29.54 0.0 0.4 56.24 0.0 0.6 PG&E - SPP 2.52 0.0 0.4 0.84 0.0 0.2 1.03 0.0 0.2 ID - NW 3.73 0.0 3.1 - - - - - - TOT 3 2.03 0.0 0.5 - - - - - - ALBERTA - SASKATCHEWAN - - - - - - - - - ALTURAS PROJECT - - - - - - - - - BILLINGS - YELLOWTAIL - - - - - - - - - BONANZA WEST - - - - - - - - -
$5 Gas $7 Gas $9 Gas
2008 - Modeled Path Shadow PricesCongestion Rent, Average Shadow Price and Binding Hours Average Shadow Price
Path Name
for $5, $7 and $9 HH gas - Med. Hydro, Ave Losses - - Ordered by $7 Gas Binding Average Shadow Price - - A dash in the table = 0 value
28
Congestion Rent Ranking
Average Shadow Price
Ranking
Binding Average
Shadow Price Ranking
Congestion Rent Ranking
Average Shadow Price
Ranking
Binding Average
Shadow Price Ranking
Congestion Rent Ranking
Average Shadow Price
Ranking
Binding Average
Shadow Price Ranking
Shiprock - San Juan 4 2 1 3 2 1 1 2 1Bonanza - Mona (Bonanza West) 2 1 2 2 1 2 2 1 24C Trans 15 13 3 14 13 3 14 13 4BRIDGER WEST 3 5 5 1 4 4 3 3 6Cor - SKing - Kyrene 13 11 7 10 9 5 9 8 3TOT 1A 17 17 6 17 16 6 16 14 5Navajo - Crystal (EOR) 1 3 4 4 3 7 5 4 11SW of 4C 10 15 9 6 10 8 6 7 7Malin - RM 1 & 2 (COI) 6 7 8 8 8 9 10 11 13PATH C 20 20 10 20 20 10 19 20 10TOT 4B 30 29 13 28 26 11 28 26 14Mont - NW 5 6 11 5 6 12 4 6 8W of Broad 26 28 14 31 31 13 23 24 12AL - BC 7 4 12 7 5 14 7 5 15TOT 2A 22 21 17 15 15 15 12 9 9Inter- Gonder 18 8 15 19 7 16 18 10 16IPP DC LINE 12 18 16 12 18 17 11 16 17PDCI 8 14 19 9 17 18 8 17 20TOT 4A 34 33 22 34 31 19 34 26 18Lugo - Victorville (WOR) 14 19 24 13 21 20 15 22 24NW - Canada 28 30 21 24 28 21 24 25 21Peacock - Mead (EOR) 16 9 20 16 11 22 17 15 25HA PS - Red Butte (TOT 2C) 19 12 26 21 12 23 20 12 23S NM 32 32 30 32 30 24 31 26 22Crystal - McCullough (EOR) 9 10 25 11 14 25 13 18 26SDG&E to CFE 25 24 23 27 23 26 22 23 19IDAHO - SIERRA 29 26 27 29 27 27 29 26 28PAC- PG&E 115 27 16 29 25 19 28 27 19 27MKT - Adelanto 31 31 31 30 29 29 32 26 29El Dor to Lugo (WOR) 23 27 33 23 25 30 26 26 31EOR 11 23 28 18 24 31 25 26 33IID - SCE 24 22 34 22 22 32 21 21 30Hassy - N. Gila (EOR) 21 25 32 26 31 33 30 26 34N of San Ono 33 33 37 33 31 34 33 26 32PG&E - SPP 36 33 36 35 31 35 35 26 35ID - NW 35 33 18 36 31 36 36 26 36TOT 3 37 33 35 36 31 36 36 26 36ALBERTA - SASKATCHEWANALTURAS PROJECTBILLINGS - YELLOWTAILBONANZA WESTBORAH WEST
$5 Gas $7 Gas $9 Gas
2008 - Modeled Shadow Price Metric RankingCongestion Rent, Average Shadow Price and Binding Hours Average Shadow Price
Path Name
for $5, $7 and $9 HH gas - Med Hyrdo, Ave Losses - - Ordered by $7 Gas Binding Average Shadow Price

29
2008 Model StudyBinding Average Hours Shadow Price and Average Shadow Price
$7 gas, Medium Hydro, Average Losses
-
5.0
10.0
15.0
20.0
25.0
30.0
35.0
40.0S
hip
San J
uan
Bonz M
ona
4C
Tra
ns
BR
IDG
ER
W
Cor
SK
Ky
TO
T 1
A
Nav C
ryst
SW
of 4C
Malin
RM
PA
TH
C
TO
T 4
B
Mont -
NW
W o
f B
road
AL -
BC
TO
T 2
A
Inte
r- G
onder
IPP
DC
LIN
E
PD
CI
TO
T 4
A
Lugo V
ict
NW
- C
anada
Peacock M
ead
HA
RB
PS
S N
M
Cry
st M
cC
SD
G&
E to C
FE
ID S
ierr
a
PA
C-
PG
&E
MK
T -
Adela
nto
El D
or
to L
ugo
EO
R
IID
- S
CE
Path Name
Sh
ad
ow
Pri
ce -
$/M
W
B SP
Ave SP
$63

30
2008 Modeling StudyBinding Hours Shadow Price - $5, $7 and $9 Gas
Medium Hydro and Average Losses
-
5.0
10.0
15.0
20.0
25.0
30.0
35.0
40.0S
hip
San
Jua
n
Bon
z M
ona
4C T
rans
BR
IDG
ER
W
Cor
SK
Ky
TO
T 1
A
Nav
Cry
st
SW
of
4C
Mal
in R
M
PA
TH
C
TO
T 4
B
Mon
t -
NW
W o
f B
road
AL
- B
C
TO
T 2
A
Inte
r- G
onde
r
IPP
DC
LIN
E
PD
CI
TO
T 4
A
Lugo
Vic
t
NW
- C
anad
a
Pea
cock
Mea
d
HA
RB
PS
S N
M
Cry
st M
cC
SD
G&
E t
o C
FE
ID S
ierr
a
PA
C-
PG
&E
MK
T -
Ade
lant
o
El D
or t
o Lu
go
EO
R
IID
- S
CE
Path Name
Sh
ado
w P
rice
- $
/ M
W
$7 Gas
$5 Gas
$9 Gas
$88
$63

31
2008Alternative Ranking
MethodsCongested Areas/Paths

32
Evaluation of Alternative Ranking Methodologies
• Five alternative Congestion Ranking Methods were applied to the W.I. 2008 Study results:– U90– U75– Shadow Price (binding hours)– Average of 9 metrics– Average of 9 metrics (modified method)
• Conclusion - - Ranking methodology results vary considerably, therefore identified W.I. Congestion Areas are grouped geographically and not ranked

33
Five Alternative Ranking Methods1. U90
• A usage based ranking• Paths were ranked using U90 at $7 gas
2. U75• A usage based ranking• Paths were ranked using U75 at $7 gas
3. Shadow Price• An economic based ranking• Paths were ranked using “binding hours shadow price” at $7 gas
4. Averaging Method• A combined usage and economic based ranking• Paths were ranked by (1) calculating the path’s subranking for each of 9 categories (U90, U75, shadow
price - - $5, $7, and $9 gas) and (2) calculating the average of these 9 subrankings. This value was then used to rank the paths.
5. Averaging Method (modified)• A combined usage and economic based ranking• Same as Method 4, however it was only applied to paths that ranked in the “top ten” in at least one of the 9
subranking categories.• This method defines a congestion grouping and assures that all paths that ranked high in at least one
category are included.

34
U90 Ranking
U75 Ranking
Shadow Price Ranking
Average Ranking
Modified Average Ranking
Navajo - Crystal (EOR) 1 1 7 2 2Bonanza - Mona (Bonanza West) 2 2 2 1 1ALBERTA - BRITISH COLUMBIA 3 7 14 4 4Crystal - McCullough (EOR) 4 6 25 9 9Peacock - Mead (EOR) 5 13 22 10 10Harry Allen PS - Red Butte (TOT 2C) 6 15 23 11 11TOT 2C 7 16 18 17PACIFICORP_PG&E 115 KV INTERCON. 8 19 28 16 15BRIDGER WEST 9 4 4 3 3IID - SCE 10 14 32 15 14MONTANA - NORTHWEST 11 8 12 5 5INTERMOUNTAIN - GONDER 230 KV 12 23 16 13SOUTHWEST OF FOUR CORNERS 13 10 8 6 6CORONADO - SILVER KING - KYRENE 14 17 5 7 7EOR 15 3 31 14 13Shiprock - San Juan 16 20 1 8 8PACIFIC DC INTERTIE (PDCI) 17 32 18 20INYO - CONTROL 115 KV TIE 19 33 28Malin Round Mountain 1 & 2 20 28 9 17 16IPP DC LINE 21 26 17 19COI 22 30 30LUGO - VICTORVILLE 500 KV LINE 23 25 20 27ALTURAS PROJECT 24 38 34TOT 2A 25 37 15 22 19WEST OF BROADVIEW 26 11 13 12 12El Dorado to Lugo (WOR) 27 24 30 25BONANZA WEST 28 5 21 18CHOLLA - PINNACLE PEAK 29 18 26Hassayampa - N. Gila (EOR) 30 27 33 31SDG&E to CFE 31 51 26 35PAVANT INTRMTN - GONDER 230 KV 32 29 WOR 33 31 36Path C 34 52 10 33 23TOT 1A 35 34 6 23 20Four Corners Transformer 38 42 3 24 21TOT 4B 42 49 11 38Moenkopi - El Dorado 43 9 29 22
$5, $7 and $9 gas price
5. Modified Average - Same as "Average" except that all paths must rank in the top 10 in at least one of the 9 categories
1. U90 - Ranked by calculated U90 at $7 gas price
2. U75 - Ranked by calculated U75 at $7 gas price
3. Shadow Price - Ranked by "Binding Hours Average Shadow Price" at $7 gas
4. Average Ranking - Ranked according to the Average of the 9 individual rankings (U90, U75, and Shadow Price for
PATH
Path Congestion Rankings for Five Alternative Ranking MethodologiesApplied to the W.I. 2008 Modeling Study
Usage plus EconomicUsage Economic

35
Congestion Area Congested Lines/Paths in
Congestion AreaImpacted WECC
Path Path Number
Desert SW AZ to S. Cal and S. Nev Navajo - Crystal EOR 49
EOR EOR 49Crystal - McCullough EOR 49Moenkopi - El Dorado EOR 49Peacock - Mead EOR 49
N and E Arizona 4 Corners Transformer 4 Corn TX 23Coronado - Silver King - Kyrene Cor - SK - Ky 54SW of 4 Corners SW of 4 C 22
Rock Mountain Area WY to Utah/Idaho Bridger West Bridger West 19
Path C Path C 20
Montana to NW Montana to NW MT to NW 8West of Broadview W of Broad. 9
CO to Utah Bonanza Mona Bonanza W. 33Bonanza West Bonanza W. 33TOT 1A TOT 1A 30
CO to NM TOT 2A TOT 2A 31Ship Rock - San Juan TOT 2A 31
Utah to S. Nevada Red Butte - Harry Allen PS TOT 2C 35TOT 2C TOT 2C 35
Utah to Central Nevada Intermountain - Gonder Inter - Gondr 29
NW and Canada NW to California PAC - PG&E 115 kV PS PAC - PG&E 25
Malin - Round Mtn. 1 & 2 (COI) COI 66
Canada Alberta to BC ALB to BC 1
California Southern California IID to SCE IID to SCE 42
NOTE: In the "Modified Average" method, all paths must rank in the top 10 in at least one of the nine ranking categories (U75, U90, Binding Hrs Shadow Price, for $5, $7 and $9 gas.
2008 Study - Summary of ResultsIdentified Congestion Areas using the "Modified Average" Method
Average of U75, U90 and Binding Average Shadow Price rankings for $5, $7 and $9 gas Areas and Paths are grouped geographically and are not listed in rank order

36
2008Loss Comparison Study
Average vs. Incremental Transmission Losses

37
2008 Study - Loss Comparison• Task 3 Studies used Average losses to be comparable to the Eastern
Interconnection studies.• A loss comparison study was run as part of the 2008 W.I. study. For
comparison, transmission line losses were modeled as both Average Losses (included as a fixed amount in the load) and as Incremental Losses (line losses vary as the square of the line flow.
• Results are preliminary and need further analysis• Preliminary results indicate the way line losses are modeled can
have a significant impact on congestion.• Modeling incremental line losses generally reduces congestion,
often by a significant amount.• A comparison is made between modeled path flows with average
and incremental losses and observed historical flows

38
2008 Model Study - - Loss ComparisonAverage Losses vs. Incremental Loss Calculation
U90, $5 Gas, Medium Hydro
-
1,000
2,000
3,000
4,000
5,000
6,000
7,000
8,000
9,000
Na
v -
Cry
st
AL
B t
o B
C
TO
T 2
C
Pe
a -
Me
ad
Bri
de
r W
Z2
-EO
R
MT
to
NW
Inte
r -
Go
nd
er
CO
R S
K K
Y
IID -
SC
E
WO
R -
IID
23
0
SW
4 C
orn
Lu
go
Vic
tor
Z6
-CO
I
W o
f B
roa
d
PV
We
st
Bo
nz
W
TO
T 2
A
Ch
olla
PP
k
Z2
-WO
R
Z7
-Pa
th 4
5
Pa
v In
term
Go
nd
Id t
o S
ierr
a
PA
TH
C
TO
T 1
A
MK
T A
de
lan
to
Mo
en
El D
or
4 C
or
TX
Mid
Sla
ke
N S
an
On
o
Bill
- Y
Ta
il
TO
T 4
B
NW
to
CA
N
Path Name
Ho
urs
> 9
0%
of
Path
OT
C
Ave. Losses
Incr Losses

39
2008 Model Study - - Loss Comparison Binding Hrs Average Shadow Price - - - $5 Gas, Medium Hydro
Average Losses vs. Incremental Losses
-
5.0
10.0
15.0
20.0
25.0
Path Name
$ p
er M
W
Ave losses
Incr. losses

40
2008 Model Study - Loss ComparisonAverage Loss vs. Incremental Loss Calculation
Hours at Limit - - $5 Gas, Medium Hydro - - Ordered by U90
-
1,000
2,000
3,000
4,000
5,000
6,000
7,000
8,000
9,000N
av -
Cry
st
AL
B t
o B
C
TO
T 2
C
Pea
- M
ead
Bri
der
W
Z2-
EO
R
MT
to
NW
Inte
r -
Go
nd
er
CO
R S
K K
Y
IID -
SC
E
WO
R -
IID
230
SW
4 C
orn
Lu
go
Vic
tor
Z6-
CO
I
W o
f B
road
PV
Wes
t
Bo
nz
W
TO
T 2
A
Ch
olla
PP
k
Z2-
WO
R
Z7-
Pat
h 4
5
Pav
Inte
rm G
on
d
Id t
o S
ierr
a
PA
TH
C
TO
T 1
A
MK
T A
del
anto
Mo
en E
l Do
r
4 C
or
TX
Mid
Sla
ke
N S
an O
no
Bill
- Y
Tai
l
TO
T 4
B
NW
to
CA
N
Path Name
Ho
urs
at
Pat
h O
TC
Lim
it
Ave Losses
Incr Losses

41
Loss Comparison - U75 Historical - 1999 thru 2005 and Modeled - 2008
0
10
20
30
40
50
60
70
80
90
100
Path Name
U75 -
% T
ime >
75%
Path
OT
C
2008 Ave
Hist Max
2008 Inc
Hist Ave
2008 Ave - Loss Calc turned off (Ave Losses)2008 Inc - Loss Calc turned on (Incremental Losses)Hist Max - Highest Seasonal U75 from 1999 to 2005Hist Ave - Average U75 - all Seasons, all years

42
Part 2
2015 Modeling Study

43
SSG-WI Path LimitsWECC Catalogue Operating Limits & Adjustments Made by SSG-WI
(xxx - Rating used in 2015 SSG-WI study, (xxx) – current WECC rating if different)
Interface NameForward Limit
(MW)Reverse
Limit (MW) Interface NameForward Limit
(MW)Reverse
Limit (MW) Interface NameForward Limit
(MW)Reverse
Limit (MW)
ALBERTA - BRITISH COLUMBIA 700 (1000) -720 Jojoba - Kyrene 1732 -1732 PV West 3600
ALBERTA - SASKATCHEWAN 150 -150 LUGO - VICTORVILLE 500 KV LINE 2400 -900 SCIT 17700 (13700) -17700
ALTURAS PROJECT 300 -300 Market Place - Adelanto 1636 (1200) -1636 SDGE Import Limit 4000
BONANZA WEST 785 Mccullgh - Victorville 1385 -1385 SILVER PEAK - CONTROL 55 KV 17 -17
BORAH WEST 2557 (2307) MIDPOINT - SUMMER LAKE 1500 600 (400) South of Alston 3050 (1620)
BRIDGER WEST 2200 MIDWAY - LOS BANOS 5400 (3900) South of Lugo 6100 (2264) -6100
BROWNLEE EAST 1850 (1750) Miguel - Tijuana 912 -912 South of Navajo 2264
CHOLLA - PINNACLE PEAK 2700 (1200) Miguel Bank No. 1 1120 -1120 SOUTH OF SAN ONOFRE 2500 (2200)
COI 4700 (4800) -3675 Miguel Bank No. 2 1120 -1120 SOUTHERN NEW MEXICO (NM1) 1048 -1048
Combined 4a 4b 1096 Moenkopi - El Dorado 1900 -1645 SOUTHWEST OF FOUR CORNERS 5325 (2325)
CORONADO - SILVER KING - KYRENE 1600 (1100) Mohave - Lugo 1386 -1386 SYLMAR - SCE 1600 (1200) -1600
Crystal - H Allen 500 kV PS 1300 MONTANA - NORTHWEST 2950 (2200) -1350 TOT 1A 800 -800
Crystal - H Allen230 kV PS 950 MONTANA SOUTHEAST 600 -600 TOT 2A 690 -690
Devers - San Bernardino 1(Post Outage) 317 N. Gila - Imperial Valley 1905 Tot 2a 2b 2c Nomogram 1570 -1600
Devers - San Bernardino 2 (Post Outage) 458 Navajo - Crystal 1900 -1900 TOT 2B 780 -850
Devers - Vista 1 (Post Outage) 458 Navajo - Moenkopi 1411 TOT 2B1 560 -600
Devers - Vista 2 (Post Outage) 494 NORTH OF JOHN DAY 8600 (8400) -8600 TOT 2B2 265 -300
Devers Bank No. 1 1120 -1120 North of Miguel 2000 TOT 2C 300 -300
Devers Bank No. 1 (Post Outage) 1230 NORTH OF SAN ONOFRE 2440 TOT 3 1450 (1605) -1800
EAGLE MTN 230_161 KV - BLYTHE 16 72 -218 NORTHERN NEW MEXICO (NM2) 1800 TOT 4A 810 -810
East of PV 6970 NORTHWEST - CANADA 2000 -3150 TOT 4B 680 -680
Eldorado - Lugo 1386 -1386 NW to Canada East BC 400 -400 TOT 5 1675 -1675
ELDORADO - MCCULLOUGH 500 KV 2598 -2598 NW to Canada West BC 2000 -2850 TOT 7 890
ELDORADO - MEAD 230 KV LINES 1140 -1140 PACIFIC DC INTERTIE (PDCI) 2800 (3100) -2100 WEST OF BROADVIEW 3323 (2573)
EOR 10255 (7550) PACIFICORP_PG&E 115 KV INTERCON. 100 -45 WEST OF CASCADES - NORTH 10500 (9800) -10500
Hassayampa - N. Gila 1905 Path 26 4000 (3400) -3000 WEST OF CASCADES - SOUTH 7000 -7000
IDAHO - MONTANA 337 -337 Path 45 408 -800 WEST OF COLSTRIP 3348 (2598)
IDAHO - NORTHWEST 2400 -1200 PATH C 1075 (1000) -850 WEST OF CROSSOVER 3348 (2598)
IDAHO - SIERRA 500 -360 PAVANT INTRMTN - GONDER 230 KV 440 -235 WEST OF HATWAI 4277(2800)
IID - SCE 1500 Peacock - Mead 508 -508 WOR 11823 (10118)
Imperial Valley - La Rosita 797 -797 Perkins - Big Sandy 1238 -1238 WOR - IID230 600 -600
Imperial Valley to Miguel 2200 PERKINS - MEAD - MARKETPLACE 500 1400 (1300) WOR - N.Gila 1861
INTERMOUNTAIN - GONDER 230 KV 200 PG&E - SPP 160 -150 WOR -n- El Dor to Lugo 2754
INTERMOUNTAIN - MONA 345 KV 1400 -1200 PGE-Bay 50000 WOR -n- Mc-Vic 2592
INYO - CONTROL 115 KV TIE 56 -56 PV to Devers 4676 WYOMING TO UTAH 1700
IPP DC LINE 1920 -1400

44
2015
Resource Assumptions Modeled Utility Integrated Resource Plans (IRP)
and State Renewable Portfolio Standards (RPS)

45
Key Caveats
• Transmission congestion found in modeling is primarily driven by gas prices, hydro conditions and assumptions about location of generation resources in 2015
• Actual 2015 generation additions will evolve from those assumed in the study based on LSE preferences and state policies

46
2015 Resources By Area and Fuel Type
2015 Resources Resources (Capacity) MW by Fuel Type
REGION AREA Capacity (1) MWDiscounted
Capacity (2) MW Coal Nat. Gas Oil Hydro Wind DR/DSMBiomass (3)
(thermal) Solar Geo Nuclear Other (4)CALIF ("CAISO") IMPERIAL 2,108 2,092 0 357 32 176 21 0 405 0 1,117 0 0CALIF ("CAISO") LADWP (5) 8,983 8,121 0 6,645 0 1,003 1,150 0 0 185 0 0 0CALIF ("CAISO") MEXICO-C 4,717 4,717 0 3,793 139 0 0 0 0 0 785 0 0CALIF ("CAISO") PG&E_BAY 7,655 7,274 20 6,076 860 0 508 0 112 0 0 0 80CALIF ("CAISO") PG&E_VLY 28,680 27,722 50 14,055 174 8,592 1,278 0 611 280 1,286 2,190 165CALIF ("CAISO") SANDIEGO 4,923 4,801 0 4,372 48 40 163 0 0 300 0 0 0CALIF ("CAISO") SOCALIF 25,766 22,251 108 15,911 50 1,304 4,687 0 538 660 284 2,150 74AZNMNV ARIZONA 30,697 30,697 11,179 15,008 140 233 0 0 0 0 0 4,137 0AZNMNV NEVADA (5) 7,582 7,582 605 6,800 0 0 0 0 0 0 177AZNMNV NEW MEXI 5,619 5,427 2,037 3,264 0 14 240 64 0 0 0 0AZNMNV WAPA L.C 6,389 6,389 400 2,197 0 3,742 0 0 0 50 0 0 0CANADA ALBERTA 14,482 13,077 6,767 5,049 0 849 1,756 0 62 0 0 0 0CANADA B.C.HYDR 16,058 13,913 0 3,051 0 12,110 897 0 0 0 0 0 0NWPP NW_EAST 36,991 31,402 0 4,351 24 27,899 3,283 144 130 0 0 1,160 0NWPP NW_WEST 12,508 11,778 1,966 4,548 74 5,067 239 384 230 0 0 0 0RMPP B HILL 1,120 1,120 622 317 42 139 0 0 0 0 0 0 0RMPP BHB 0 0 0 0 0 0 0 0 0 0 0 0 0RMPP BONZ 468 468 468 0 0 0 0 0 0 0 0 0 0RMPP COL E 13,979 13,227 6,667 5,569 120 780 835 0 0 8 0 0 0RMPP COL W 2,294 2,294 1,904 104 0 286 0 0 0 0 0 0 0RMPP IDAHO 2,575 2,217 0 165 0 2,088 170 152 0 0 0 0 0RMPP IPP 1,847 1,847 1,847 0 0 0 0 0 0 0 0 0 0RMPP JB 2,628 2,628 2,628 0 0 0 0 0 0 0 0 0 0RMPP KGB 1,476 952 515 62 0 244 655 0 0 0 0 0 0RMPP LRS 1,628 1,628 1,107 300 0 221 0 0 0 0 0 0 0RMPP MONTANA 5,579 5,062 3,779 376 0 700 647 0 12 0 0 0 65RMPP SIERRA 4,137 3,656 1,268 1,720 0 0 601 0 23 0 524 0 0RMPP SW WYO 964 321 0 0 0 160 804 0 0 0 0 0 0RMPP UT N 2,438 2,438 929 1,381 0 84 0 44 0 0 0 0 0RMPP UT S 3,486 3,486 2,849 613 0 0 0 0 0 0 24 0 0RMPP WYO 775 775 775 0 0 0 0 0 0 0 0 0 0RMPP YLW TL 288 288 0 0 0 288 0 0 0 0 0 0 0
Total Capacity 258,838 239,648 48,490 106,084 1,703 66,017 17,933 724 2,187 1,483 4,021 9,637 561
(2) Discounted capacity reflects the the capacity contribution to peak load.
Assumed Discounts: BC Hydro (25% for hydro, 7.5% for wind), NW hydro credit 89.4%, California wind 25%, Colorado wind 10%, all other wind 20% (3) Biomass (thermal): includes units using wood as fuel and "urban residuals".(4) Other: Petroleum coke, waste heat(5) LADWP includes 1,446MW of gas generation submitted by NV, but in the LADWP topology bubble because of dual allocation of the Crystal bus.
The 1,446MW was moved from the NV side of the substation to the LADWP side because of bus overloading on the NV side.
(1) Capacity represents installed capacity net of station service (capacity net to the grid).

47
SSG-Wi 2015 IRP-RPS Reference CaseDifference with 2008 "Existing" Base Case
Includes submitted changes to the 2008 case, whether addition/subtraction of MW in pre-2008 years, or upgrades to older unitsSum of PSSEMaxCap(MW) Fuel
RegionArea Name
Comment Bio Coal DSM Gas
Geothermal Hydro Oil Solar Wind
Nameplate Total
Discounted Total
AZNMNV ARIZONA Added 3,400 2,700 1,500 7,600 6,400 ARIZONA Total 3,400 2,700 1,500 7,600 6,400 NEVADA Added 1,446 1,446 1,446 NEVADA Total 1,446 1,446 1,446 NEW MEXIAdded 64 1,406 1,470 1,470
Retired (149) (20) (169) (169) NEW MEXI Total 64 1,257 (20) 1,301 1,301 WAPA L.CAdded 400 50 450 450 WAPA L.C Total 400 50 450 450
AZNMNV Total 64 3,800 5,403 (20) 50 1,500 10,797 9,597 CAISO IMPERIAL Added 75 50 425 550 550
IMPERIAL Total 75 50 425 550 550 LADWP Added 300 185 1,030 1,515 743 LADWP Total 300 185 1,030 1,515 743 MEXICO-CAdded 1,619 86 1,704 1,704
Retired (300) (300) (300) MEXICO-C Total 1,619 86 (300) 1,404 1,404 PG&E_BAYAdded 565 565 565
Retired (215) (215) (215) PG&E_BAY Total 350 350 350 PG&E_VLYAdded 190 2,666 410 280 900 4,446 3,771
Retired (334) (334) (334) PG&E_VLY Total 190 2,332 410 280 900 4,112 3,437 SANDIEGOAdded 500 40 300 163 1,003 881
Retired (689) (689) (689) SANDIEGO Total (189) 40 300 163 314 192 SOCALIF Added 290 1,768 500 3,500 6,058 3,433
Retired (1,580) (1,580) (1,580) SOCALIF Total 290 (1,580) 1,768 500 3,500 4,478 1,853
CAISO Total 555 (1,580) 6,229 921 40 (300) 1,265 5,593 12,723 8,528

48
Sum of PSSEMaxCap(MW) Fuel
RegionArea Name
Comment Bio Coal DSM Gas
Geothermal Hydro Oil Solar Wind
Nameplate Total
Discounted Total
CANADA ALBERTA Added 1,420 1,164 1,670 4,254 2,918 modified (13) (13) (13) Retired (434) (359) (317) (1,110) (1,110)
ALBERTA Total 973 805 (317) 1,670 3,131 1,795 B.C.HYDRAdded 1,173 1,754 897 3,823 2,994 B.C.HYDR Total 1,173 1,754 897 3,823 2,994
CANADA Total 973 1,978 1,437 2,567 6,954 4,788 NWPP NW_EASTAdded 144 723 260 1,590 2,717 1,445
NW_EAST Total 144 723 260 1,590 2,717 1,445 NW_WESTAdded 384 790 150 1,324 1,204 NW_WEST Total 384 790 150 1,324 1,204
NWPP Total 528 1,513 260 1,740 4,041 2,649 RMPP B HILL Added 100 100 100
B HILL Total 100 100 100 COL E Added 3,150 1,282 8 835 5,275 4,524 COL E Total 3,150 1,282 8 835 5,275 4,524 IDAHO Added 152 30 182 182 IDAHO Total 152 30 182 182 JB Added 500 500 500 JB Total 500 500 500 KGB Added 500 62 590 1,152 680 KGB Total 500 62 590 1,152 680 MONTANAAdded 1,268 400 1,668 1,348 MONTANA Total 1,268 400 1,668 1,348 SIERRA Added 703 514 441 601 2,259 1,778 SIERRA Total 703 514 441 601 2,259 1,778 UT N Added 44 44 44
Retired (128) (128) (128) UT N Total (128) 44 (84) (84) UT S Added 575 575 575 UT S Total 575 575 575 SW Wyo Added 700 700 140
RMPP Total 6,796 152 1,760 441 44 8 3,126 12,327 9,723 Total Net Change to 2008 Case 619 9,989 680 16,883 1,362 1,781 (320) 1,323 14,526 46,841 35,285 Total Additions Only 619 12,016 680 18,757 1,362 2,098 - 1,323 14,526 51,380 39,843

49
2015
Study ResultsPath Usage
Path Economics

50
Key Caveats• High Flow Rankings do not necessarily imply Congested
Paths. Some paths in the West have high flows because the path’s primary function is to transmit generation to a specific load area. The IPP DC Line and Bridger West paths are typical examples.
• Results are highly dependent upon gas prices, hydro conditions and location of future resources.

51
SSG-WI 2015 Reference Case - Modeling Results - Path Usage
% Time Flow > 75 & 90% OTC and % Time Equal to Path Limit
0
20
40
60
80
100
12022
-Wof
4C
8-M
T-N
W
9-W
ofB
rv
35-T
OT
2C
25-P
AC
-PG
E
65-D
CI
33-B
Z-W
WY
-UT
27-I
PP
66-C
OI
31-T
OT
2A
19-B
RG
W
1-A
L-B
C
48-N
NM
Has
-NG
il
TO
T2S
um
17-B
OR
-W
30-T
OT
1A
NW
-CE
ast
37-T
OT
4A
79-T
OT
2B2
40-T
OT
7
20-P
athC
16-I
D-S
38-T
OT
4B
55-B
RL-
W
3-N
W-C
A
HA
-RB
45-S
D-C
FE
32-P
V-G
Path Name
% o
f Tim
e
%T>75% OTC
%T>90% OTC
%T@Limit
25% of Time
50% of Time
Ranked by % of Time flow exceeds 75% of OTC
2 48
101
35
6
7
9Shadow Price (Annual Average) Rankings - Top 12 @ $5 gas
12
11

52

53

54
Two Methods of Calculating Congestion Costs(2015 Annual Summary)
Method I: Congestion Rent - - In the shadow price X MW flow columns, congestion cost for each congested path is defined as the hourly shadow price for each congested hour times the flow on the path for that hour, with the results summed for the year.
Method II: Annual Average Shadow Price - - The production cost decrease if 1 MW limit of the constraint is relaxed. It represents the average of the absolute value of the 8760 hourly shadow prices.
Interface Name
$5G $7G $9G $5G $7G $9G $5G $7G $9G $5G $7G $9G
ALBERTA - BRITISH COLUMBIA 34,199 52,048 69,270 10 11 10 5.57 8.49 11.29 7 7 7BONANZA WEST 128,592 193,862 260,621 3 3 3 18.93 28.19 37.90 1 1 1BORAH WEST 32,490 53,503 79,154 11 10 8 1.43 2.39 3.53 18 16 14BRIDGER WEST 36,955 56,449 73,984 9 9 9 1.93 2.93 3.84 16 12 12BROWNLEE EAST 847 950 1,041 29 30 29 0.05 0.06 0.06 30 30 29COI 93,035 77,532 68,445 5 8 11 2.25 1.88 1.66 12 19 21HA-Red Butte PS 5,030 6,865 9,252 19 20 20 2.04 2.61 3.52 13 14 15Hassayampa - N. Gila 4,988 3,371 812 20 25 30 0.45 0.20 0.05 25 28 30IDAHO - SIERRA 1,976 4,049 6,136 25 23 22 0.62 1.28 1.95 22 21 19IPP DC LINE 117,109 172,445 227,726 4 4 4 6.86 10.25 13.54 5 6 6MONTANA - NORTHWEST 209,839 334,400 491,453 2 2 2 8.22 12.94 19.02 4 4 4NORTHWEST - CANADA 1,060 1,525 2,224 28 29 26 0.06 0.09 0.13 29 29 28NW to Canada East BC 7,110 9,461 12,600 17 17 19 1.98 2.69 3.59 15 13 13PACIFIC DC INTERTIE (PDCI) 86,728 103,170 117,562 6 6 6 3.47 4.21 4.79 10 10 11PACIFICORP_PG&E 115 KV INTERCON. 2,016 1,867 1,788 24 27 28 2.68 2.53 2.44 11 15 18Path 45 3,914 5,725 5,905 23 22 23 0.78 0.82 0.86 21 23 24PATH C 4,610 6,365 8,802 22 21 21 0.61 0.86 1.19 23 22 23PAVANT INTRMTN - GONDER 230 KV 14,015 23,201 31,702 13 12 13 6.76 11.27 15.40 6 5 5SOUTHERN NEW MEXICO (NM1) 9,462 18,665 28,457 16 15 14 1.02 2.03 3.10 19 18 17SOUTHWEST OF FOUR CORNERS 717,209 1,117,571 1,504,644 1 1 1 15.60 23.96 32.26 2 2 2TOT 1A 6,846 9,158 12,985 18 18 17 0.96 1.31 1.85 20 20 20TOT 2A 76,727 129,341 177,936 7 5 5 12.25 21.40 29.44 3 3 3Tot 2a 2b 2c Nomogram 1,357 3,414 4,815 27 24 24 0.09 0.25 0.35 28 27 26TOT 2B2 4,929 9,095 12,684 21 19 18 2.01 3.92 5.46 14 11 10TOT 2C 13,531 20,724 27,313 14 14 15 4.99 7.89 10.39 8 8 8TOT 4A 10,252 15,543 24,952 15 16 16 1.57 2.19 3.52 17 17 16TOT 4B 567 1,547 2,056 30 28 27 0.10 0.26 0.35 27 26 27TOT 7 1,902 3,070 3,752 26 26 25 0.20 0.39 0.48 26 25 25WEST OF BROADVIEW 14,280 21,085 39,050 12 13 12 0.52 0.72 1.34 24 24 22WYOMING TO UTAH 57,250 81,758 107,017 8 7 7 3.87 5.49 7.19 9 9 9
Shadow Price ($/MW)
Rank
Method I
(Annual Average)
Method II
Rank($000)
(Shadow Price X MW Flow)

55
Part 3
Historical Path Usage Study
1999 thru 2005

56
Physical Usage• Physical Usage analysis uses hourly data archived at WECC
for actual hourly MW flow and hourly path limits (OTC)
– OTC limits are often based on stability limits which may be more limiting than the thermal based transfer limits used in the East
– Two measures• 1. Percent of time flows exceeded 75% of OTC based on the
maximum utilization in any season from 1999 to 2004
• 2. Percent of time flows exceeded 90% of OTC in the highest period from Spring 2004 through Summer 2005
– Illustrative path• The duration of flows on SW of Four Corners Path
• The maximum seasonal flows on SW of Four Corners Path

57
Physical Usage
• Seasons are defined in WECC as follows:– Spring: April and May– Summer: June thru October– Winter: November thru March

58
BUCKLEY
SUNDANCE
FT. PECK
PEACE CANYON
MICA
VANCOUVER
SEATTLE
PRINCE RUPERT
AREA
AREA
COLSTRIP
BOISE
PORTLANDAREA
MALIN
TABLE MTN
ROUND MTN
SALT LAKECITY AREA
MEXICO
EL PASOAREA
DEVERS
LUGO
SAN FRANCISCO
MIDPOINT
AREA
LOS ANGELESAREA
ALBUQUERQUEAREA
NAVAJO
DENVERAREA
MOJAVE
HOOVER
PHOENIXAREA
LANGDON
HOT SPRINGS
HELLSCANYON
CHIEF JOSEPH
BURNS
PINTO
FOURCORNERS
SHASTA
LANGDON
CANADA
UNITED STATES
66
65
14
8
30
27
15
49
31
6
19
22
34
47
16
3
35
18
5
4 6
17
20
23
24
26
32
36
45
46
5051 4
8
48
All Seasons 1999 thru 2005 (Based on Heaviest Loading Year)
Actual Flow > 75% of OTC greater than 50% of time
Actual Flow > 75% of OTC between 25% and 50 % of time
Actual Flow > 75% of OTC between 0% and 25% of time

59
Path RankingMaximum Seasonal U75 Values from 1999 through 2005
U75 - % of Time Path Actual Flow exceeds 75% of Path OTC
0
10
20
30
40
50
60
70
80
90
100
19 50 22 47 30 36 3 8 48 35 17 66 65 15 31 1 26 45 49 18 20 34 51 14
WECC Path Number
% T
ime P
ath
Flo
w E
xceed
s 7
5%
of
OT
C
W
Sp
Su
Represents the highest Seasonal Loading for each Path, from 1999 thru 2005
50% of Time
25% of Time
Bridger West (Generation Integration)
Cholla - Pinnacle Pk
SW of 4C
S. New Mex.
TOT 1A (CO to Utah)
TOT 3 (WY to CO)

60
U90 - Maximum Seasonal Values from Spring 2004 through Summer 2005 % of Time Path Actual Flow Exceeds 90% of Path OTC
0
5
10
15
20
25
19 3 1 65 66 30 22 36 45 15 35 18 31 48 26 20 14 17 47 8 50 49 34 51
Path Number
U90
- %
Tim
e >
90%
of P
ath
OTC
90%
Ranking is based upon the Maximum 90% value for the five seasons between Spring 2004 and Summer 2005
Bridger West (Generation
NW to Canada (StoN)
Pacific DC Intertie
COI
TOT 1a (CO to Utah
SW of 4Corners
U90 is the percentage of time the physical flow exceeds 90% of the path OTC
Alberta to BC

61
Southwest of Four Corners - Path 22Actual Flow - MWs
Spring 2004 thru Summer 2005
0
20
40
60
80
100
120
0 0.1 0.2 0.3 0.4 0.5 0.6 0.7 0.8 0.9 1
Path Flow - Per Unit of OTC
% T
ime
> P
ath
Flo
w L
evel
Spr 2004
Sum 2004
W 04-05
Spr 2005
Sum 2005
All Seasons
OTC as posted (2325 MW)Flow - E to W

62
Southwest of Four Corners - Path 22Actual Flows
Historical % of Time Seasonal Flow exceed 75% of Path OTC
0
10
20
30
40
50
60
70
W 98-99
W 00-01
W 01-02
W 04-05
Spr99
Spr01
Spr02
Spr04
Spr05
Su 99 Su 00 Su 01 Su 04 Su 05
Seasons
% T
ime
Flo
w E
xcee
ds
75%
of
OT
C
W 98-99
W 00-01
W 01-02
W 04-05
Spr 99
Spr 01
Spr 02
Spr 04
Spr 05
Su 99
Su 00
Su 01
Su 04
Su 05