1 WEEKLY g REPORT - Centers for Disease Control …stacks.cdc.gov/view/cdc/912/cdc_912_DS1.pdf · 1...
12
CENTER FOR DISEASE CONTROL = Vol. 19, No. 30 1 WEEKLY g REPORT = For = Week Ending == August 1, 1970 U.S. DEPARTMENT OF HEALTH, EDUCATION, AND WELFARE / PUBLIC HEALTH SERVICE ¥ health services and mental health administration □ ATE OF RELEASE: AUGUST 7, 1970 - ATLANTA, GEORGIA 30333 EPIDEMIOLOGIC NOTES AND REPORTS HUMAN RABIES - Arizona and South Dakota Two unrelated fatal cases of human rabies were re cently reported to the CDC: one from Arizona and one from South Dakota. Case 1: At 1 a.m. on June 29 near McNary, in the Mogollon Rim area of Arizona, a skunk entered the tent and sleeping °ag of an 11-year-old boy and bit him four times on the r‘ght shoulder and left hand. The skunk was captured and on July l was found to be rabid by the fluorescent antibody (FRA) test. On July 2 the boy was begun on the 14-dose Series of duck embryo rabies vaccine. He also received one dose of tetanus toxoid initially. On July 22 he developed stiff neck, sore throat, fend malaise. He was admitted with these complaints to the Tucson Medical Center on July 26. One day after admis- Sl°n, paresthesia developed in his left hand. In the hos- CONTENTS Epidemiologic Notes and Reports Human Rabies — Arizona and South D a k o ta ............................ 293 Fatal Shipboard Malaria — Virginia ............................................294 Salmonellosis — Clarksville, Tennessee .................................. 295 International Notes Quarantine Measures ...............................................................296 Surveillance Summary » Leptospirosis — 1969 . . ■ .............................................................. 297 Current Trends Plague — United States . ................................................................... 298 m s ™ ______ i _____________________________ -> p p r •>oy pital his temperature fluctuated between 98 and 105°F.,and progressive weSl^ess of the left arm, fatigue, dysphagia. dysarthria, and focal rhythmic motor activity developed. On July 29 he lapsed into coma, and in the early morning of July 30 he died. (Continued on page 294.) TABLE I. CASES OF SPECIFIED NOTIFIABLE DISEASES: UNITED STATES (Cumulative totals include revised and delayed reports through previous weeks) DISEASE 30th WEEK ENDED August 1, 1970 July 26. 1969 MEDIAN 1965 - 1969 CUMULATIVE, FIRST 30 WEEKS 1970 1969 MEDIAN 1965 - 1969 septic meningitis.................... “fucellosis................................. diphtheria ............................ ^cephalitis, primary: Arthropod-borne & unspecified ncephalitis, post-infectious . . Hepatitis, serum ....................... Hepatitis, infectious.................. Malaria......................................... Measles (rubeola)....................... eningococcal infections, total . Civilian Military ............... .............. Mumps Poli, 0[nyelitis. total Paralytic ................................................... “Ubella (German m easles) ............................... jetanus ................................................................... Tularemia..................................................... typhoid fever ....................................................... ¿yphus, tick-borne (Rky. Mt. spotted fever) Habies in animals .............................................. 159 4 2 44 7 118 1,280 64 393 40 35 5 799 2 2 251 3 5 5 25 55 105 7 3 22 5 100 843 51 259 34 33 1 780 1 1 422 5 6 7 31 76 87 5 2 34 16 697 28 286 34 34 1 1 1 5 4 7 16 77 1,485 120 192 682 281 4,090 32,185 1,990 38,231 1,683 1,509 174 71,745 17 17 47,793 64 76 148 200 1,832 1,098 130 84 577 190 2.967 26,692 1,548 19,308 2,166 1.968 198 64.586 6 6 46,987 79 86 156 258 2,158 TABLE II. NOTIFIABLE DISEASES OF LOW FREQUENCY 1,098 130 88 782 470 23,441 1,149 56,338 2,127 1,952 175 29 25 92 96 194 153 2,532 Anthrax: ? otulism:' !Prosy; La.-l, Tex.-2 pfWospirosis: * . ............ lague: e*ayed Reports: Leptospirosis: Iowa 1 Cum. 1 5 77 21 6 Psittacosis: Mich.-l, Minn.-l ............ Rabies in Man: ........................................... Rubella congenital syndrome: Cal.-l Trichinosis: .............................................. Typhus, murine: T ex .-l ......................... Cum. 21 43 59 24
-
Upload
nguyenphuc -
Category
Documents
-
view
215 -
download
0
Transcript of 1 WEEKLY g REPORT - Centers for Disease Control …stacks.cdc.gov/view/cdc/912/cdc_912_DS1.pdf · 1...
CENTER FOR D ISEASE CON TRO L= Vol. 19, No. 30
1 WEEKLYg REPORT= For
= Week Ending= = August 1, 1970
U.S. DEPARTMENT OF HEALTH, EDUCATION, AND WELFARE / PUBLIC HEALTH SERVICE ¥ he a l t h s e r v ic e s a n d m e n ta l h e a l t h a d m in is t ra t io n
□ A T E O F R E L E A S E : A U G U ST 7 , 1970 - A T L A N T A , G E O R G IA 30333
E P ID E M IO L O G IC N O T E S A N D R E P O R T S
HUMAN R A B IE S - Arizona and South Dakota
Two unrelated fatal cases of human rabies were re
cently reported to the CDC: one from Arizona and one from
South Dakota.
Case 1: At 1 a.m. on June 29 near McNary, in the Mogollon
Rim area of Arizona, a skunk entered the tent and sleeping
°ag of an 11-year-old boy and bit him four times on the
r‘ght shoulder and left hand. The skunk was captured and
on July l was found to be rabid by the fluorescent antibody
(FRA) test. On July 2 the boy was begun on the 14-dose
Series of duck embryo rabies vaccine. He also received one
dose of tetanus toxoid initially.
On July 22 he developed stiff neck, sore throat, fend
malaise. He was admitted with these complaints to the
Tucson Medical Center on July 26. One day after admis-
Sl°n, paresthesia developed in his left hand. In the hos-
CONTENTS
Epidem io log ic Notes and Reports
Human R ab ies — Arizona and South D a k o t a ............................ 293
Fata l Shipboard M alaria — V irg in ia ............................................294
Sa lm one llosis — C la rksv ille , T e n n e s s e e .................................. 295
In ternational Notes
Quarantine Measures ...............................................................296
Surveillance Summary »
Leptosp iros is — 1969 . . ■.............................................................. 297
Current Trends
P lague — United States . ...................................................................298
m s ™ ______ i _____________________________
-> p p r •> o ypital his temperature fluctuated between 98 and 105°F.,and
progressive weSl^ess of the left arm, fatigue, dysphagia.
dysarthria, and focal rhythmic motor activity developed.
On July 29 he lapsed into coma, and in the early morning
of July 30 he died.
(Continued on page 294.)
T A B L E I. C ASES OF S P E C IF IE D N O T IF IA B L E D ISEASES: U N IT ED ST A T ES(Cumulative totals include revised and delayed reports through previous weeks)
DISEASE30th WEEK ENDED
August 1, 1970 July 26. 1969MEDIAN
1965 - 1969
CUMULATIVE, FIRST 30 WEEKS
1970 1969 MEDIAN 1965 - 1969
septic meningitis....................“ fucellosis.................................diphtheria ............................^cephalitis, primary: Arthropod-borne & unspecified ncephalitis, post-infectious . .
Hepatitis, serum .......................Hepatitis, infectious..................Malaria.........................................Measles (rubeola).......................
eningococcal infections, total . CivilianM il ita ry .............................
Mumps Poli,0[nyelitis. totalParalytic...................................................
“ Ubella (German m e a s l e s ) ...............................j e t a n u s ...................................................................Tularemia.....................................................typhoid fever .......................................................¿yphus, tick-borne (Rky. Mt. spotted fever) Habies in animals ..............................................
1594 2
447
1181,280
64393
4035
5799
22
251355
2555
10573
225
100
84351
25934331
78011
42256 7
3176
8752
3416
69728
28634341
11
547
1677
1,485120
192682281
4,09032,185
1,99038,231
1,6831,509
17471,745
1717
47,7936476
148200
1,832
1,09813084
577190
2.967 26,692
1,54819,308
2,1661.968
19864.586
66
46,9877986
156258
2,158T A B L E II. N O T IF IA B L E D ISEA SES OF LOW F R E Q U E N C Y
1,09813088
782470
23,4411,149
56,3382,1271,952
17529259296
194153
2,532
Anthrax:?otulism:'
! Prosy; L a .- l, Tex.-2pfWospirosis: * .............lague:
e*ayed Reports: L ep tosp irosis: Iowa 1
Cum.15
77 21
6
P s itta c o s is : M ich.-l, M in n .- l............R abies in M an:...........................................R ubella congenital syndrome: C a l.- lT r ic h in o s i s : ..............................................Typhus, murine: T e x . - l .........................
Cum.21
435924
294 Morbidity and Mortality Weekly Report AUGUST 1, 1970
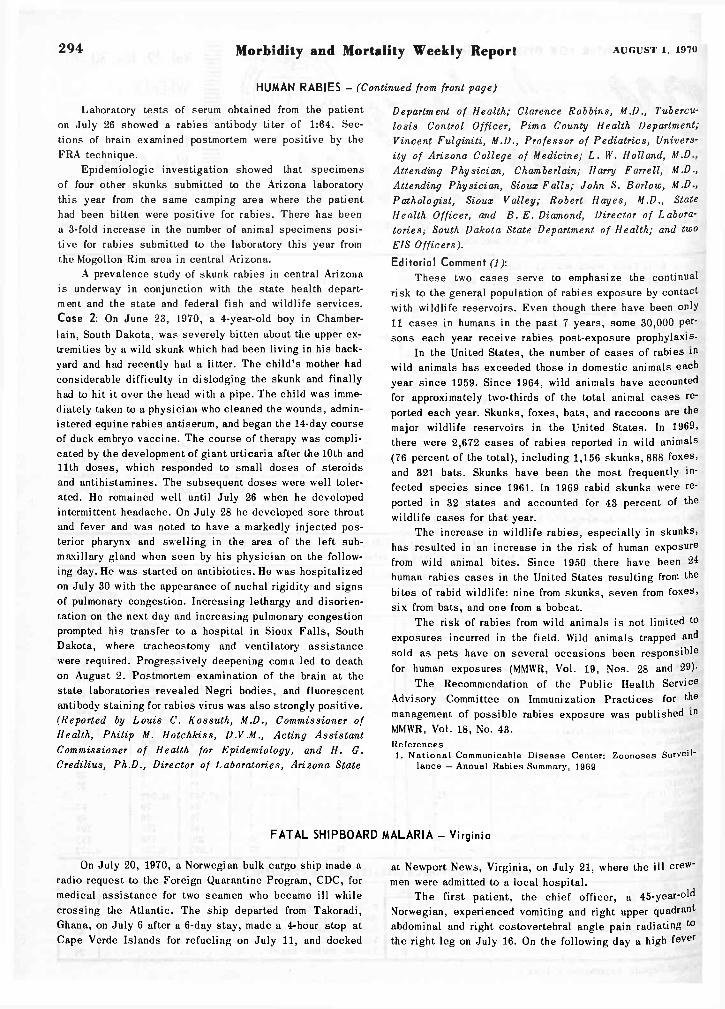
HUMAN R A B IES - (Continued from front page)
Laboratory tests of serum obtained from the patient
on July 26 showed a rabies antibody titer of 1:64. Sec
tions of brain examined postmortem were positive by the
FRA technique.
Epidemiologic investigation showed that specimens
of four other skunks submitted to the Arizona laboratory
this year from the same camping area where the patient
had been bitten were positive for rabies. There has been
a 3-fold increase in the number of animal specimens posi
tive for rabies submitted to the laboratory this year from
the Mogollon Rim area in central Arizona.
A prevalence study of skunk rabies in central Arizona
is underway in conjunction with the state health depart
ment and the state and federal fish and wildlife services.
Case 2: On June 23, 1970, a 4-year-old boy in Chamber-
lain, South Dakota, was severely bitten about the upper ex
tremities by a wild skunk which had been living in his back
yard and had recently had a litter. The child’s mother had
considerable difficulty in dislodging the skunk and finally
had to hit it over the head with a pipe. The child was imme
diately taken to a physician who cleaned the wounds, admin
istered equine rabies antiserum, and began the 14-day course
of duck embryo vaccine. The course of therapy was compli
cated by the development of giant urticaria after the 10th and
11th doses, which responded to small doses of steroids
and antihistamines. The subsequent doses were well toler
ated. He remained well until July 26 when he developed
intermittent headache. On July 28 he developed sore throat
and fever and was noted to have a markedly injected pos
terior pharynx and swelling in the area of the left sub-
maxillary gland when seen by his physician on the follow
ing day. He was started on antibiotics. He was hospitalized
on July 30 with the appearance of nuchal rigidity and signs
of pulmonary congestion. Increasing lethargy and disorien
tation on the next day and increasing pulmonary congestion
prompted his transfer to a hospital in Sioux Falls, South
Dakota, where tracheostomy and ventilatory assistance
were required. Progressively deepening coma led to death
on August 2. Postmortem examination of the brain at the
state laboratories revealed Negri bodies, and fluorescent
antibody staining for rabies virus was also strongly positive.
(Reported by Louis C. Kossuth, M.D., Commissioner of
Health, Philip M. Hotchkiss, D.V.M., Acting Assistant
Commissioner of Health for Epidemiology, and H. G.
Credilius, Ph.D., Director of Laboratories, Arizona State
Department of Health; Clarence Robbins, M.D., Tubercu
losis Control Officer, Pima County Health Department;
Vincent Fulginiti, M.D., Professor of Pediatrics, Univers
ity of Arizona College of Medicine; L. W. Holland, M.D
Attending Physician, Chamberlain; Harry Farrell, M.D.,
Attending Physician, Sioux Falls; John S. Barlow, M.D.,
Pathologist, Sioux Valley; Robert Hayes, M.D., State
Health Officer, and B. E. Diamond, Director of Labora
tories; South Dakota State Department of Health; and two
EIS Officers).
Editorial Comment (7):These two cases serve to emphasize the continual
risk to the general population of rabies exposure by contact
with wildlife reservoirs. Even though there have been only
11 cases in humans in the past 7 years, some 30,000 per
sons each year receive rabies post-exposure prophylaxis.
In the United States, the number of cases of rabies in
wild animals has exceeded those in domestic animals each
year since 1959. Since 1964, wild animals have a c c o u n t e d
for approximately two-thirds of the total animal cases re
ported each year. Skunks, foxes, bats, and raccoons are the
major wildlife reservoirs in the United States. In 1969,
there were 2,672 cases of rabies reported in wild animals
(76 percent of the total), including 1,156 skunks, 888 foxes,
and 321 bats. Skunks have been the most frequently in-
fected species since 1961. In 1969 rabid skunks were re
ported in 32 states and accounted for 43 percent of the
wildlife cases for that year.
The increase in wildlife rabies, especially in skunks,
has resulted in an increase in the risk of human exposure
from wild animal bites. Since 1950 there have been 24
human rabies cases in the United States resulting from the
bites of rabid wildlife: nine from skunks, seven from foxes,
six from bats, and one from a bobcat.
The risk of rabies from wild animals is not limited to
exposures incurred in the field. Wild animals trapped and
sold as pets have on several occasions been responsible
for human exposures (MMWR, Vol. 19, Nos. 28 and 29)-
The Recommendation of the Public Health Service
Advisory Committee on Immunization Practices for the
management of possible rabies exposure was published in
MMWR, Vol. 18, No. 43.
References
1. N a t io n a l Communicable D isease Center: Zoonoses Surveil"
lance — Annual Rabies Summary, 1969
F A T A L SH IPBO ARD M A LA R IA - Virginia
On July 20, 1970, a Norwegian bulk cargo ship made a
radio request to the Foreign Quarantine Program, CDC, for
medical assistance for two seamen who became ill while
crossing the Atlantic. The ship departed from Takoradi,
Ghana, on July 6 after a 6-day stay, made a 4-hour stop at
Cape Verde Islands for refueling on July 11, and docked
at Newport News, Virginia, on July 21, where the ill crew
men were admitted to a local hospital.
The first patient, the chief officer, a 4 5 - y e a r - o l d
Norwegian, experienced vomiting and right upper quadrant
abdominal and right costovertebral angle pain radiating 10
the right leg on July 16. On the following day a high fever

AUGUST 1, 1970 Morbidity and Mortality Weekly Report 295
began, and he was treated with aspirin and opium tablets.
On July 19 his fever subsided and he felt better, but he
fainted when he attempted to return to his duties. On July
20 the fever resumed, and he complained of back pain.
On admission to the hospital he complained of weak
ness, nausea, diarrhea, headaches, fever, and right upper
quadrant pain. His temperature was 105°F., and he ap
peared slightly dehydrated and icteric. Hepatosplenomegaly
was not observed. The initial impression was acute in
fectious hepatitis, and intravenous fluid therapy was be
gun. On July 22 while examining a routine peripheral blood
smear, a medical technologist observed that approximately
75 percent of the red cells contained trophozoites of Plas
modium falciparum. Some cells contained as many as four
ring forms, and an occasional cell with schizonts was
seen. Therapy was begun with intravenous quinine hydro
chloride and intravenous corticosteroids. On the following
day he became stuporous, then comatose, uremic, and
oliguric. Pulmonary edema developed, and small ecchymotic
Patches were seen in the posterior pharynx. Quinine was
discontinued; he was given intramuscular chloroquine
hydrochloride, digitalis, and diuretics, and peritoneal di
alysis was initiated. In spite of these measures, the patient
died early on July 24.
On the same day as the first patient, a 29-year-old
Spanish seaman experienced onset of a similar illness,
characterized by headache, back pain, fever, and nausea,
At the time of admission to the hospital his temperature
Was 104°F., and he complained of right upper quadrant
tenderness. He also was diagnosed initially as having
infectious hepatitis and received the same therapy as the
first patient. On July 22 he became disoriented, hypo
tensive, uremic, and oliguric. His peripheral smear also
Was found to contain red cells heavily parasitized with
SALM O N ELLO SIS -
On July 6, 1970, an outbreak of febrile gastroenteritis
Was reported to health officials in Clarksville, Montgomery
County, Tennessee. At least 303 persons were known to
have developed symptoms of acute febrile gastroenteritis
including diarrhea (87 percent), abdominal cramps (70 per-
Cent), temperature above 101°F. (68 percent), nausea (53
Pwcent), vomiting (53 percent), chills (38 percent), head
ache (36 percent), and bloody diarrhea (4 percent). Fifty-
four persons were hospitalized. There were 12 secondary
cases including three nurses who had cared for the hos
pitalized persons. There were no deaths. Salmonella thomp-
s»n was cultured from the stools of 17 of the hospitalized
Patients.
Questioning of a group of hospitalized patients re
galed that all had consumed barbecued pork prepared by a
local restaurant on the July Fourth weekend. Of 189 in
dividuals interviewed who were exposed to barbecued pork,
had eaten the meat; 80 percent of these became ill.
^he mean incubation period was 40 hours (Figure 1).
Rectal cultures were obtained from 151 of the 189
Persons interviewed. Of these 106 (70 percent) were posi-
P. falciparum. Therapy was begun with quinine, corti
costeroids, mannitol, diuretics, and aramine. On July 23
he became comatose, and chloroquine was substituted for
quinine. On July 24 the percentage of parasitized red blood
cells had fallen from 50 to 10 percent. His hemoglobin
fell to 3.6 gm percent, albumin 1.6 g percent, and sodium
119mEq/L. Edema and a rigid, tender abdomen were noted.
On July 28 the patient became alert, and his parasitemia
had decreased to less than 1 percent of the red blood cells.
The ship proceeded from Newport News to New Orleans,
Louisiana, before the diagnosis of falciparum malaria had
been established. The ship was boarded by public health
personnel in New Orleans, but no further illnesses were
encountered. Thick smears on all remaining crew members
were negative for malaria parasites.
(Reported by Ralph Price, M .D., and Grover Thompkins,
M.D., Physicians, Newport News, Virginia; H. E. Gillespie,
M.D., Director, Bureau of Epidemiology, Virginia State
Department of Health; Charles T. Caraway, D.V.M., Chief,
Section of Epidemiology, Louisiana State Department of
Health; the Foreign Quarantine Program, CDC; and two
EIS Officers.)
Editorial Comment: 'Ghana was the only African country visited by this
ship in the past 5 months. The time period from this visit
to the onset of both illnesses is within the usual range of
7 to 27 days for incubation of falciparum malaria.
This is the second malaria fatality reported in 1970
in the United States. Both were in Norwegian seamen whose
ships had visited ports in West Africa and then sailed to
the east coast of the United States. No malarial chemo-
suppressives had been taken by crew members of either
ship.
Clarksville, Tennessee
tive for S. thompson. Only four isolates were recovered
from asymptomatic individuals. Blood for serologic study
was also obtained. Titers of agglutinating antibodies were
determined using an antigen prepared from an isolate of
S. thompson recovered from one of the hospitalized pa
tients. Seropositivity correlated directly with bacteriologic
results. Agglutinating antibodies were present in signifi
cantly higher titer in persons who consumed the meat and
became clinically ill than in those persons who ate the
meat and did not report illness.
The barbecued pork was further implicated as the
vehicle of infection in that only family members who con
sumed barbecue became ill; members who did not consume
the meat remained well. One individual reported that two of
his dogs died after eating leftover barbecue, but the third
animal, not fed barbecue, remained well. Finally, high
coliform counts were determined in the meat by the state
laboratory, and S. thompson was recovered from the meat.
Improper facilities and procedures for storage of both
raw and cooked meat and inadequate environmental sanita-
(Continued on page 296)

296 Morbidity and Mortality Weekly Report AUGUST 1, 1970
SALM O NELLO SIS — (Continued from page 295)
Figure 1C A S E S OF S A L M O N E L L O S I S B Y D A T E O F O N SE T , C L A R K S V I L L E , T E N N E S S E E , J U L Y 4 - J U L Y 15, 1970
O N SE T BY 12 HOUR P ER IO D S
JU LY
tion were found during investigation of the implicated
restaurant. Two of the four restaurant employees cultured
were bacteriologically positive for S. thompson, the other
two were both bacteriologically and serologically negative;
all four had consumed at least one sandwich of barbecue
on the July Fourth weekend. An estimated 4,000 persons
had access to contaminated meat.
The most likely explanation for the outbreak is that
inadequate sanitary practices in handling the barbecued
pork permitted the survival, dissemination, and replication
of contaminating salmonellae. It is not yet unclear how the
restaurant originally became contaminated. Investigations
of the three meat plants which supply the restaurant are
currently underway by U.S. Department of Agriculture
officials.
(Reported by Eugene W. Fowinkle, Commissioner, William
H . Armes, Jr., M.D., Deputy Commissioner of Health, and
J . Howard Barrick, Ph.D., Director, Laboratories, Tennes
see Department of Public Health; Edward Cutter, M.D-,
Director, and James Powell, Sanitarian, Montgomery County
Health Department; James A. Edgett, D.V.M., Epidemiolo
gist, Consumer Protection Program, USDA, Beltsville>
Maryland; W. Curlette, Regional Office, Food and Drug
Administration, Atlanta; and a team from CDC.)
IN T E R N A T IO N A L NO TES
Q U ARANTINE MEASURES
Recently a booklet, Vaccination Certificate Require
ments for International Travel, was published as a supple
ment to the Morbidity and Mortality Weekly Report, Vol. 19,
No. 21, for the week ending May 30, 1970. This booklet,
designed primarily for the use of health departments and
physicians, contains immunization requirements of individ
ual countries.
The Foreign Quarantine Program, CDC, has prepared
a new booklet entitled Health Information for International
Travel (PHS Publication No. 2045) which provides de
tailed information on required and recommended immunize
tions for travel to most countries. PHS Publication No-
2045 replaces the booklet Immunization Information f°r
International Travel (PHS Publication No. 384) and >s
available from the Superintendent of Documents, Govern
ment Printing Office, Washington, D.C. 20402, at 10 cents
per copy or $6.50 per 100 copies.
(Reported by the Foreign Quarantine Program, CDC.)

a u g u s t i , 1970 Morbidity and Mortality Weekly Report 297
S U R V E I L L A N C E SU M M A R Y
LEPTO SP IRO S IS - 1969
In 1969, 22 states reported a total of 100 cases (five
fatal) of leptospirosis in humans. This was an increase of
41 percent over the 71 cases recorded in 17 states during
1968 (Figure 2). California, Florida, Iowa, and Ohio ac
counted for 51 of the 100 cases. Individual case reports
were received on 69 of the 100 patients.
Figure 2HUM AN L E P T O S P I R O S I S - U N IT E D S T A T E S , 1947-1969
150 140 130 120 HO 100 90
u 802 70
60 50 40 30
1947 48 49 50 *51 52 53 '54 '55 '56 '57 '58 59 '60 61 '62 '63 '64 '65 66 "67 '68 69 YEAR
♦PROVISIONAL DATASOURCE MORBIDITY AND MORTALITY WEEKLY REPORT
The month of onset was known in 58 cases; almost
half of these cases occurred in June, July, and August.
Of 62 patients on whom sex and age data were received,
51 were males (Table 1). In 49 patients on whom clinical
mamfestations were recorded, fever (57 percent), headache
(41 percent), and jaundice (41 percent) were the predomi
nant symptoms (Table 2). In 43 cases where a possible
source was noted, the most commonly implicated source of
■nfection was water and involved 19 cases (Table 3); dogs
Were associated with eight of the cases.
Table 2C lin ical Manifestations of 49 Patients with Leptosp iros is
United States, 1969
SymptomNumber
of Cases
Percent
of Total
Fever 28 57.1Headache 20 40.8J aundice 20 40.8Chills 14 28.6Elevated BUN 13 26.5Albuminuria 13 26.5
Elevated CSF Cell Count 12 24.5Hemcituria 11 22.4
Nausea or Vomiting 11 22.4Stiff Neck 9 18.4
Lethargy or Malaise 9 18.4
Anuria 9 18.4
Elevated CSF Protein 8 16.3
Myalgia 8 16.3
Sweating 5 10.2
Conjunctivitis 5 10.2
Table 3Most Probable Sources of Infection in 69 C a se s of
Leptosp iros is in Humans — United States, 1969
Most Probable Source Number of Cases
Rodents 3Dogs 8Cattle 3Swine 4Cattle or Swine 2Other 2Water 19Sewage 2Unknown 26
Total 69
Table 1Age and Sex of 62 Patients with Leptosp iros is
United States, 1969
Age Group
__(Years)
SexTotal
Percent
of TotalMale Female0-9 2 3 5 8.1
10-19 9 2 11 17.720-29 13 1 14 22.630-39 7 0 7 11.340-49
11 3 14 22.60-59 3 0 3 4.860+ 6 2 8 12.9
-Jotal 51 11 62 100.0
In 24 of the 69 reports received, Leptospira canicola
was serologically implicated as the infecting serotype.
Serotype icterohaemorrhagiae followed with 10 cases (14
percent, and grippotyphosa and pomona were implicated in
eight cases and seven cases, respectively.
(Reported by the Office of Veterinary Public Health Serv
ice, Epidemiology Program, CDC.)
A copy of the report from which these data were derived is
ava ilab le on request from the
Center for D isease Control
A ttn: C h ie f, O ffice of Veterinary P ub lic H ealth Service,
Epidem iology Program
A tlan ta , Georgia 30333
298 Morbidity and Mortality Weekly Report AUGUST 1, 1970
C U R R E N T T R E N D S
P LA G U E - United States
For 1970 through July 28, six cases of bubonic plague
— all wild rodent associated — have been reported in the
United States (Table 4) (MMWR, Vol. 19, Nos. 20, 21, 23,
25, 27, and 28). The last urban rodent associated cases
were in 1924 when an outbreak occurred in Los Angeles.
Since 1924, 72 cases of plague have been reported. Only
one patient was known to have been exposed in an urban
area, and he acquired infection in Denver, Colorado, from
an introduced species of wild rodent, an Eastern Fox squirrel
(MMWR, Vol. 17, Nos. 27-29).
Of the 25 human cases reported from 1924 through
1949, 20 were from the Pacific states. Of the 46 cases
reported since 1950, 80 percent occurred in the Rocky
Mountain states, with 28 cases reported from New Mexico.
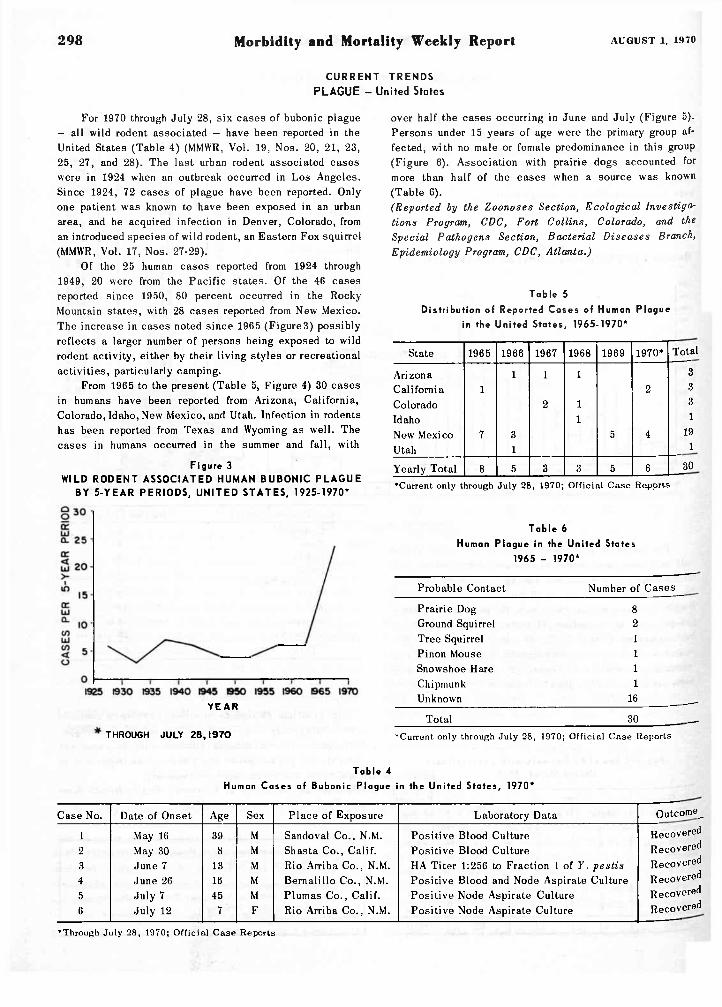
The increase in cases noted since 1965 (Figure3) possibly
reflects a larger number of persons being exposed to wild
rodent activity, either by their living styles or recreational
activities, particularly camping.
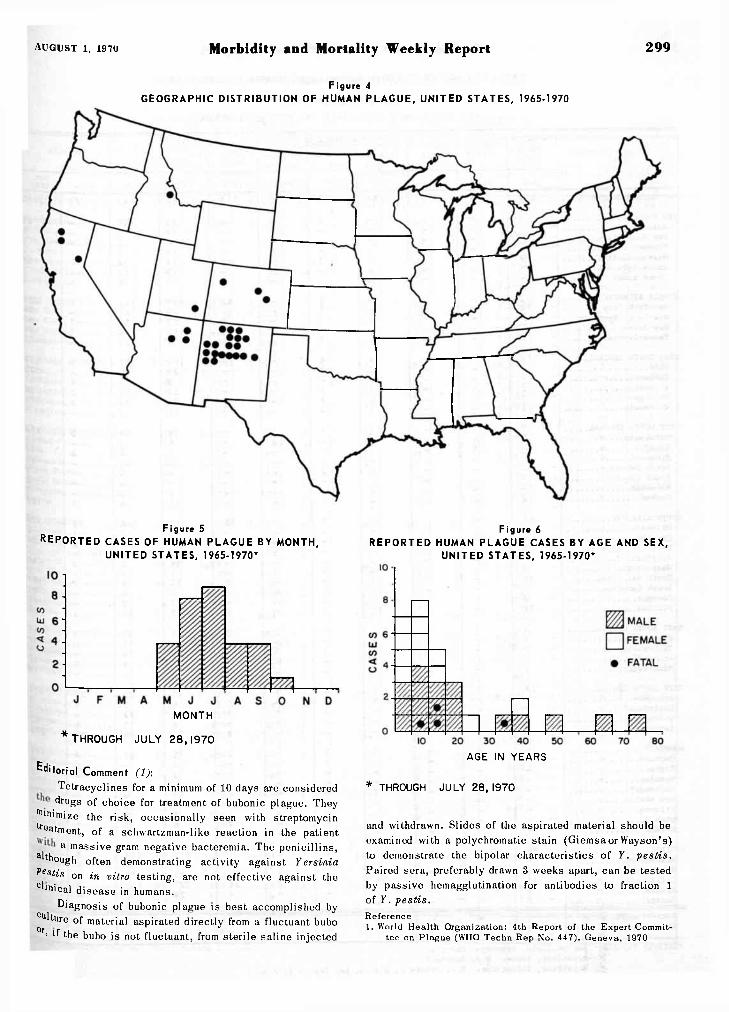
From 1965 to the present (Table 5, Figure 4) 30 cases
in humans have been reported from Arizona, California,
Colorado, Idaho, New Mexico, and Utah. Infection in rodents
has been reported from Texas and Wyoming as well. The
cases in humans occurred in the summer and fall, with
Figure 3W ILD R O D E N T A S S O C IA T E D H U M AN B U B O N IC P L A G U E
BY 5 - Y E A R P E R IO D S , U N IT E D S T A T E S , 1925-1970*
Y E A R
THROUGH JULY 2 8 ,1 9 7 0
over half the cases occurring in June and July (Figure 5).
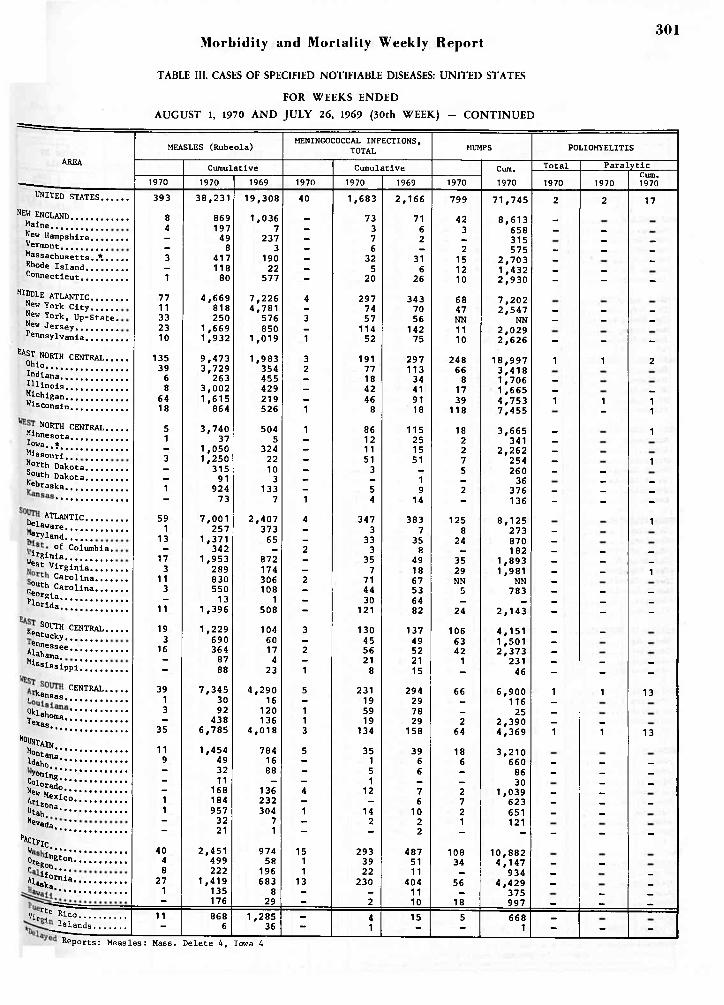
Persons under 15 years of age were the primary group af
fected, with no male or female predominance in this group
(Figure 6). Association with prairie dogs accounted for
more than half of the cases when a source was known
(Table 6).
(Reported by the Zoonoses Section, Ecological Investigor
tions Program, CDC, Fort Collins, Colorado, and the
Special Pathogens Section, Bacterial Diseases Branch,
Epidemiology Program, CDC, Atlanta.)
Table 5
Distribution of Reported C a se s of Human Plague
in the United States, 1965-1970*
State 1965 1966 1967 1968 1969 1970* Total
Arizona 1 1 1 3
California 1 2 3
Colorado 2 1 3
Id aho 1 1
New Mexico 7 3 5 4 19
Utah 1 1
Yearly Total 8 5 3 3 5 6 30
•Current only through Ju ly 28, 1970; O ffic ia l C ase Repprts
Table 6
Human Plague in the United States
1965 - 1970*
Probable Contact Number of Cases
Prairie Dog 8
Ground Squirrel 2
Tree Squirrel 1
Pinon Mouse 1
Snowshoe Hare 1
Chipmunk 1
Unknown 16 ___
Total 30 _
•Current only through Ju ly 28, 1970; O ff ic ia l C ase Reports
Table 4
Human C a se s of Bubonic Plague in the United States, 1970*
Case No. Date of Onset Age Sex Place of Exposure Laboratory Data
1 May 16 39 M Sandoval Co., N.M. Positive Blood Culture
2 May 30 8 M Shasta Co., Calif. Positive Blood Culture
3 June 7 13 M Rio Arriba Co., N.M. HA Titer 1:256 to Fraction 1 of Y. pestis
4 June 26 16 M Bernalillo Co., N.M. Positive Blood and Node Aspirate Culture
5 July 7 45 M Plumas Co., Calif. Positive Node Aspirate Culture
6 July 12 7 F Rio Arriba Co., N.M. Positive Node Aspirate Culture
Outcome^
Recovered
Recovered
Recovered
Recovered
Recovered
Recovered
♦Through Ju ly 28, 1970; O ff ic ia l Case Reports
AUGUST 1, 197U Morbidity and Mortality Weekly Report 299
Figure 4G E O G R A P H IC D I S T R IB U T IO N OF H U M A N P L A G U E , U N IT E D S T A T E S , 1965-1970
Figure 5R E P O R T E D C A S E S O F H U M AN P L A G U E B Y MONTH,
U N IT E D S T A T E S , 1965-1970*
MONTH
* THROUGH JULY 28,1970
Editorial Comment (1):
Tetracyclines for a minimum of 10 days are considered
drugs of choice for treatment of bubonic plague. They
n” nimize the risk, occasionally seen with streptomycin
treatment, of a schwartzman-like reaction in the patient
a massive gram negative bacteremia. The penicillins,
although often demonstrating activity against Yersinia
Vestis on in vitro testing, are not effective against the
c'>nical disease in humans.
Diagnosis of bubonic plague is best accomplished by
Culture of material aspirated directly from a fluctuant bubo
0r’ >f the bubo is not fluctuant, from sterile saline injected
Figure 6R E P O R T E D H U M AN P L A G U E C A S E S B Y A G E A N D SEX ,
U N IT E D S T A T E S , 1965-1970*
AGE IN YEARS
* THROUGH JULY 28, 1970
and withdrawn. Slides of the aspirated material should be
examined with a polychromatic stain (Giemsaor Wayson’s)
to demonstrate the bipolar characteristics of Y. pestis.
Paired sera, preferably drawn 3 weeks apart, can be tested
by passive hemagglutination for antibodies to fraction 1
of Y. pestis.
Reference
1. World H ealth O rgan ization : 4th Report of the Expert Commit
tee on P lague (WHO Techn Rep No. 447). Geneva, 1970
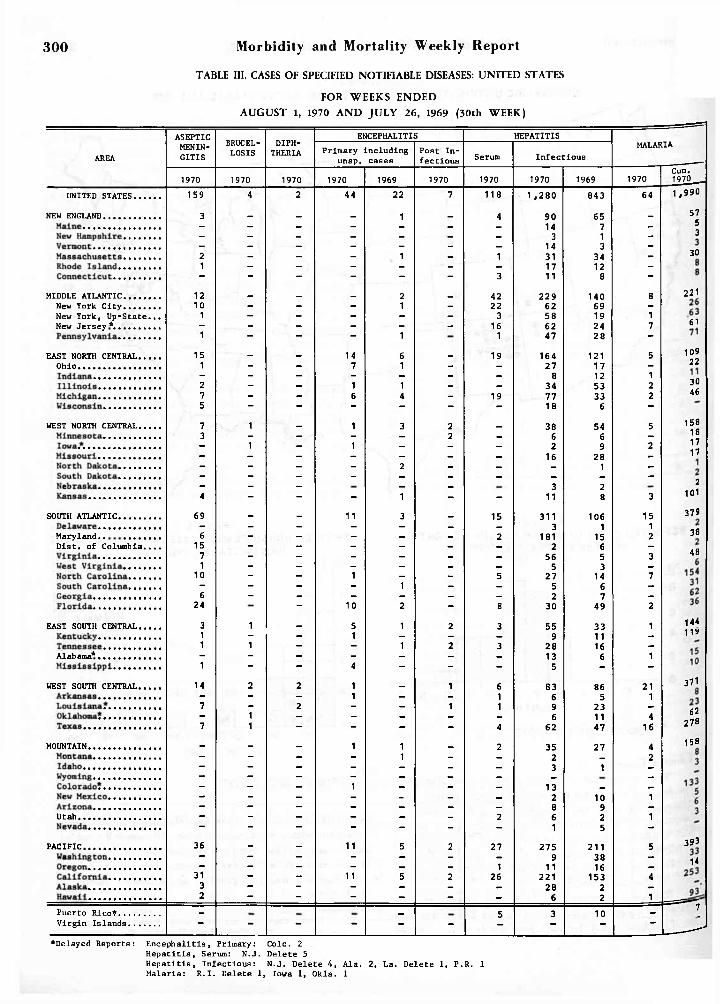
TABLE III. CASHS OF SPECIFIED NOTIFIABLE DISEASES: UNITED STATES
FOR WEEKS ENDED
300 Morbidity and Mortality Weekly Report
AUGUST 1, 1970 AN D JU LY 26, 1969 (30th WEEK)
AREA
ASEPTICMENINGITIS
BRUCELLOSIS
DIPHTHERIA
ENCEPHALITIS HEPATITISMALARIA
Primary including unsp. cases
Post In fectious Serum In fectious
1970 1970 1970 1970 1969 1970 1970 1970 1969 1970 I-»a
VO C
b
i9 r
UNITED STATES........... 159 4 2 44 22 7 118 1 ,280 843 64 1,990
NEW ENGLAND....................... 3 _ _ _ 1 _ 4 90 65 _ 57
- - - - - - - 14 7 - 5
- - - - - - - 3 1 - 3
— - — — - - — 14 3 —
2 - - - 1 - 1 31 34 - 30
1 - - - - - - 17 12 -
- “ - - - - 3 11 8 -
MIDDLE ATLANTIC................ 12 _ _ _ 2 _ 42 229 140 8 221
New York C ity ................. 10 - - - 1 - 22 62 69 -
New York, Up-State... 1 - - - - - 3 58 19 1New Jersey*.................... - - - - - - 16 62 24 7 61
1 — — — 1 1 47 28 —
EAST NORTH CENTRAL......... 15 — _ 14 6 _ 19 164 121 5 109
Ohio................................. 1 - - 7 1 - - 27 17 - 22
— - — — — — — 8 12 12 - - 1 1 - - 34 53 2 30
7 - - 6 4 - 19 77 33 2 46
5 “ — — - - - 18 6 —
WEST NORTH CENTRAL........ 7 1 _ 1 3 2 _ 38 54 5 158
3 — — — — 2 — 6 6 — 18
- 1 - 1 - - - 2 9 2 17
- - - - - — _ 16 28 - 17
- - - - 2 - — _ 1 —
— — — — — _ _ _ _ —— — _ _ _ 3 2
2
4 - - - 1 - - 11 8 3 101
SOUTH ATLANTIC................. 69 _ _ 11 3 _ 15 311 106 15379
- - - - - - _ 3 1 1Maryland........................ 6 - - - - - 2 181 15 2
38
D is t. of Co lum bia.... 15 — — — — — — 2 6 —
7 - - - - - - 56 5 348
1 - - - - - - 5 3 -10 — — 1 — — 5 27 14 7- - - - 1 - - 5 6 -
6 - - - - - - 2 7 -24 “ 10 2 - 8 30 49 2
EAST SOUTH CENTRAL........ 3 1 _ 5 1 2 3 55 33 1 144
1 - - 1 - - - 9 11 - 11*
1 1 — — 1 2 3 28 16 —
Alabama*......................... - - - - - - - 13 6 11 — — 4 - - - 5 - -
WEST SOUTH CENTRAL......... 14 2 2 1 _ 1 6 83 86 21 371
- - - 1 - - 1 6 5 17 — 2 — — 1 1 9 23 _
- 1 - - _ _ _ 6 11 462
7 1 - - - - 4 62 47 16278
MOUNTAIN............................. - - _ 1 1 _ 2 35 27 4158
— — — — 1 _ _ 2 _ 2- - - - - _ — 3 1 _
- - - - - - - - -— — — 1 — — — 13 _ —
- - - - - - _ 2 10 1- - - - — - — 8 9 —
Utah................................. — — — — — — 2 6 2 1- - - - - - - 1 5 -
PACIFIC................................... 36 - - 11 5 2 27 275 211 5393
- - - - - - - 9 38 -14
— — - — — — 1 11 16 —31 — — 11 5 2 26 221 153 4
3 - - - - - - 28 2 -2 - - - - - - 6 2 1
Puerto Rico5!'................. - _ 5 3 10 —
r- \
L
Virgin Is lands ............ — — — — - - - — - — ____ -J*Delayed Reports: Encephalitis , Primary: Colo. 2
H epatitis , Serum: N .J. Delete 5H epa titis , In fec tious : N .J. Delete 4, A la. 2, La. Delete 1, P.R. 1 Malaria: R .I . Delete 1, Iowa 1, Okla. 1
Morbidity and Mortality Weekly Report301
TABLE III. CASES OF SPECIFIED NOTIFIABLE DISEASES: UNITED STATES
FOR WEEKS ENDED
AUGUST 1, 1970 A N D JU LY 26, 1969 (30th WEEK) - CONTINUED
MEASLES (Rubeola)MENINGOCOCCAL INFECTIONS,
TOTAL MUMPS POLIOMYELITIS
Cumulative Cumulative Cum.
1970
Total P araly tic
1970 1970Cum.19701970 1970 1969 1970 1970 1969 1970
393 38,231 19,308 40 1 ,683 2 ,166 799 71 ,745 2 2 17
8 869 1,036 _ 73 71 42 8 ,613 __
4 197 7 - 3 6 3 658 __ _- 49 237 - 7 2 - 315 _ __- 8 3 - 6 - 2 575 — _ _3 417 190 - 32 31 15 2 ,703 _ _- 118 22 - 5 6 12 1 ,432 _ _1 80 577 - 20 26 10 2 ,930 » - -
77 4,669 7,226 4 297 343 68 7 ,20211 818 4,781 - 74 70 47 2 ,547 _ _ _33 250 576 3 57 56 NN NN _ _ _23 1 ,669 850 - 114 142 11 2 ,02910 1 ,932 1,019 1 52 75 10 2 ,626 « - -
135 9 ,473 1,983 3 191 297 248 18 ,997 1 1 239 3,729 354 2 77 113 66 3 ,4186 263 455 - 18 34 8 1,706 _8 3 ,002 429 - 42 41 17 1 ,665 _ _
64 1 ,615 219 - 46 91 39 4 ,753 1 1 118 864 526 1 8 18 118 7 ,455 - 1
5 3 ,740 504 1 86 115 18 3,665 _ 11 37 5 - 12 25 2 341 _- 1 ,050 324 - 11 15 2 2 ,262 _3 1 ,250 22 - 51 51 7 254 _ 1— 315 10 - 3 — 5 260 _ _— 91 3 — — 1 _ 36 __ __1 924 133 - 5 9 2 376 — _ _
— 73 7 1 4 14 - 136 « - -
59 7,001 2 ,407 4 347 383 125 8 ,125 11 257 373 - 3 7 8 273 _
13 1,371 65 - 33 35 24 870 _- 342 - 2 3 8 — 182 _ _ _
17 1 ,953 872 — 35 49 35 1 ,893 _ __ _3 289 174 - 7 18 29 1 ,981 _ _ 1
11 830 306 2 71 67 NN NN _3 550 108 - 44 53 5 783 _ _ _- 13 1 _ 30 64 _ _ _ _ _
11 1 ,396 508 - 121 82 24 2 ,143 - - -
19 1 ,229 104 3 130 137 106 4,151 _ _
3 690 60 — 45 49 63 1 ,501 _16 364 17 2 56 52 42 2 ,373 _- 87 4 - 21 21 1 231 — _ _
- 88 23 1 8 15 - 46 - - -
39 7 ,345 4 ,290 5 231 294 66 6 ,900 1 1 131 30 16 — 19 29 — 116 _3 92 120 1 59 78 _ 25 _- 438 136 1 19 29 2 2,390 _ «
35 6 ,785 4 ,018 3 134 158 64 4 ,369 1 1 13
11 1,454 784 5 35 39 18 3 ,2109 49 16 - 1 6 6 660 _ _ _- 32 88 — 5 6 - 86 _ _ _- 11 — — 1 — — 30 _ _— 168 136 4 12 7 2 1 ,039 * _1 184 232 — — 6 7 623 _ _ _1 957 304 1 14 10 2 651 _ _— 32 7 — 2 2 1 121- 21 1 — - 2 - - » - -
40 2,451 974 15 293 487 108 10 ,8824 499 58 1 39 51 34 4 ,147 _ _8 222 196 1 22 11 _ 934 _ —|
27 1,419 683 13 230 404 56 4 ,429 _ _1 135 8 - - 11 _ 375 _ __— 176 29 — 2 10 18 997 _ __ _
11 868 1 ,285 _ 4 15 5 668 _~ 6 36 — 1 - - 1 - - -
area
UNITED states. .
NEW ENGLAND...............Maine............New Hampshire....Vermont.........Massachusetts. .* .Rhode Island....Connecticut.....
MIDDLE ATLANTIC...........New York C ity ...........New York, Up-State.New Jersey.................
Pennsylvania......
East north CENTRAL...Ohio..................
Indiana...........Illinois...........Michigan.........[Wisconsin.......
NORTH CENTRAL.Minnesota.......I°wa..*.Missouri...2°rth Dakota!! ! ! ! S°uth Dakota........
Nebraska....
ATLANTIC...........Delaware...ljaryland...........
of Columbia.,IrB inia..................."est V irg in ia .........
C a ro lin a .... r°uth C a ro lin a ....pfr*ia..........F1° r id a . . .
SOUTH central.Kentucky........ennessee......
^abama.M t« s l s S i P P ¿ ; ; ; ; ; ;
central. , kansas..
J lahoma........ie*as.
Mo<!NTain .
îî^tana! ‘«aho., pitting.C o l,N, °rado.• !? Mexicô[
: í " - -Neva d a . . '"
pACjyV<
IC.
°teiln8ton-P ®6on____
AUlf0rnia-aska.
Vlr'í0 1111:0--Islands.
Reports: Measles: Mass. Delete 4, Iowa A
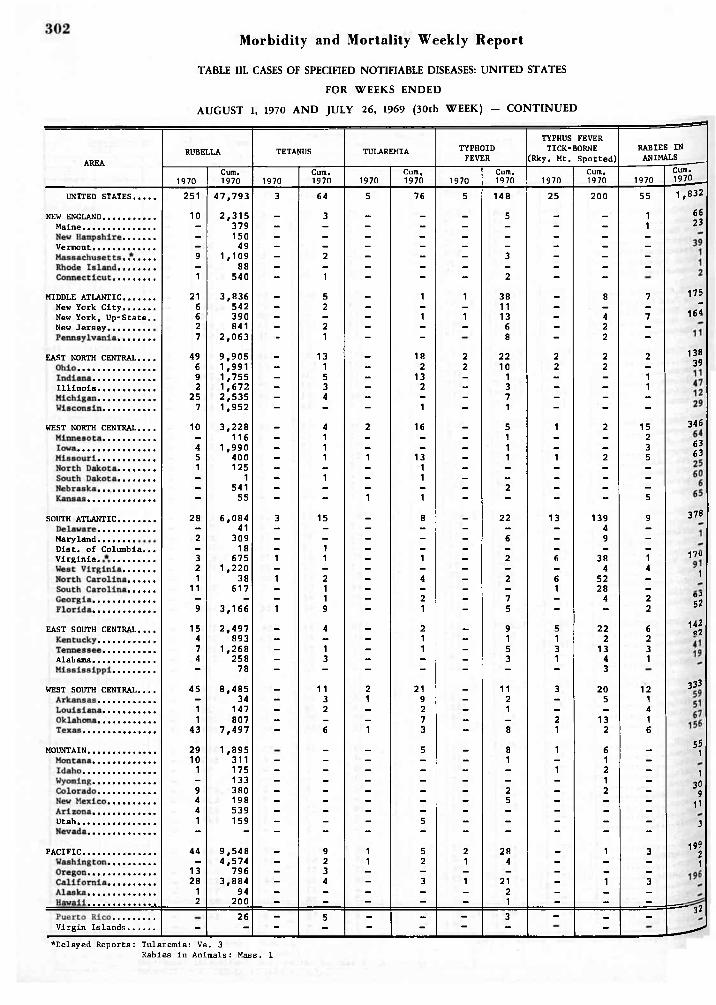
TABLE III. CASES OF SPECIFIED NOTIFIABLE DISEASES: UNITED STATES
FOR WEEKS ENDED
Morbidity and Mortality Weekly Report
AUGUST 1, 1970 A N D JULY 26, 1969 (30th WEEK) - CONTINUED
AREA
RUBELLA TETANUS TULAREMIA TYPHOIDFEVER
TYPHUS FEVER TICK-BORNE
(Rky. Mt. Spotted)
RABIES IN ANIMALS
1970Cum.1970 1970
Cum.1970 1970
Cum,1970 1970
Cum.1970 1970
Cum.1970 1970
Cum.1970
UNITED STATES........ 251 47 ,793 3 64 5 76 5 148 25 200 55 1,832
NEW ENGLAND..................... 10 2 ,315 _ 3 _ _ _ 5 _ — 1 66
Maine............................. - 379 - — - - — — - - 1 23
— 150 - — — - — - - - -
Vermont......................... — 49 — — — — — — — — —9 1,109 — 2 - - - 3 - — -- 88 - - - - — — - - -
1 540 - 1 - - - 2 - -
MIDDLE ATLANTIC............. 21 3,836 _ 5 — 1 1 38 _ 8 7 175
New York C ity ............. 6 542 — 2 — — — 11 — — — 7New York, Up-State.. 6 390 - - — 1 1 13 - 4 7 164
New Jersey................. 2 841 — 2 - - - 6 — 2 -7 2 ,063 - 1 - - 8 — 2 —
EAST NORTH CENTRAL.... 49 9 ,905 _ 13 — 18 2 22 2 2 2 138
6 1,991 - 1 - 2 2 10 2 2 - 39
9 1,755 — 5 - 13 - 1 - — 1I l l i n o i s ....................... 2 1 ,672 - 3 - 2 - 3 - — 1
25 2,535 - 4 - - - 7 - - -7 1,952 - - — 1 - 1 - — -
WEST NORTH CENTRAL.... 10 3,228 — 4 2 16 — 5 1 2 15 346
— 116 — 1 — — — 1 — — 24 1,990 - 1 - - — 1 - — 3 63
5 400 - 1 1 13 - 1 1 2 5 63
1 125 - - - 1 - — — - —— 1 — 1 - 1 - - — — —— 541 — — — — — 2 — — —
- 55 - - 1 1 - - - - 5
SOUTH ATLANTIC............... 28 6 ,084 3 15 _ 8 _ 22 13 139 9 378
- 41 — - - - — - - 4 —
Maryland............... 2 309 - - - - - 6 - 9 -D is t. of Columbia... — 18 — 1 — — — — — — —V irg in ia . ................. 3 675 1 1 - 1 - 2 6 38 1 17U
2 1,220 - — - - - — — 4 4 11 38 1 2 — 4 — 2 6 52 —
11 617 — 1 — — — — 1 28 —- - - 1 - 2 - 7 - 4 2
0-5529 3,166 1 9 - 1 “ 5 - - 2
EAST SOUTH CENTRAL.... 15 2 ,497 _ 4 _ 2 _ 9 5 22 614202
4 893 - - - 1 - 1 1 2 27 1,268 — 1 — 1 — 5 3 13 3
Alabama......................... 4 258 - 3 - - — 3 1 4 1— 78 — - - — — — — 3
WEST SOUTH CENTRAL.... 45 8,485 _ 11 2 21 _ 11 3 20 12333
— 34 - 3 1 9 — 2 - 5 11 147 - 2 - 2 — 1 - — 41 807 - - - 7 - — 2 13 1
43 7 ,497 - 6 1 3 - 8 1 2 6
MOUNTAIN........................... 29 1 ,895 _ _ 5 _ 8 1 6 _ 551
10 311 - - — - - 1 — 1 —
1 175 — — — — - - 1 2 — 1- 133 - - - - - - - 1 -
309 380 — — — — — 2 — 2 — 94 198 - - — — — 5 - — —
114 539 - - - - - — - - —
Utah............................... 1 159 - - - 5 - - - - — 3- - — - - — - - - — -
PACIFIC............................. 44 9 ,548 _ 9 1 5 2 28 _ 1 3199
2- 4 ,574 — 2 1 2 1 4 — — - 1
13 796 - 3 - - - - — — —28 3,884 — 4 — 3 1 21 — 1 3
1 94 — - - - - 2 - - —2 200 — — — — — 1 — — —
26 - 5 - _ - 3 - _ -— 32
V irgin Is lands ........... - — — - — - — - - __>
*Delayed Reports: Tularemia: Va. 3Rabies in Animals: Mass. 1
M orbid ity and M ortality Weekly Report
303
Week No.
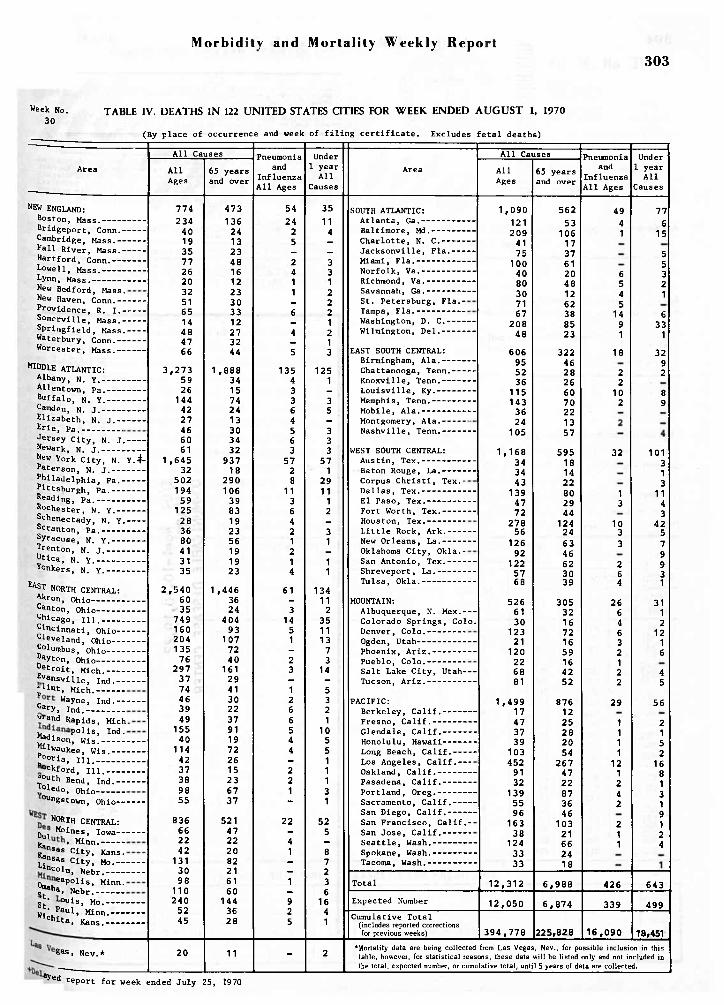
30TABLE IV. DEATHS IN 122 UNITED STATES CITIES FOR WEEK ENDED AUGUST 1, 1970
(By place of occurrence and week of f i l i n g c e r t if ic a te . Excludes fe ta l deaths)
Area
A ll Causes Pneumonia and
Influenza A ll Ages
Under 1 year
A ll Causes
A llAges
65 years and over
774 473 54 35
234 136 24 1140 24 2 419 13 5 -
35 23 - -
77 48 2 326 16 4 320 12 1 132 23 1 251 30 - 265 33 6 214 12 - 148 27 4 247 32 - 166 44 5 3
3 ,273 1 ,888 135 12559 34 4 126 15 3 -
144 74 3 342 24 6 527 13 4 -
46 30 5 360 34 6 361 32 3 3
1 ,645 937 57 5732 18 2 1
502 290 8 29194 106 11 1159 39 3 1
125 83 6 228 19 4 -36 23 2 380 56 1 141 19 2 -
31 19 1 135 23 4 1
2 ,540 1 ,446 61 13460 36 - 1135 24 3 2
749 404 14 35160 93 5 11204 107 1 13135 72 - 776 40 2 3
297 161 3 1437 29 - —74 41 1 546 30 2 339 22 6 249 37 6 1
155 91 5 1040 19 4 5
114 72 4 542 26 - 137 15 2 138 23 2 198 67 1 355 37 - 1
836 521 22 5266 47 _ 522 22 4 _42 20 1 8
131 82 - 730 21 - 298 61 1 3
110 60 _ 6240 144 9 16
52 36 2 445 28 5 1
20 11 - 2
Area
A ll Causes
A llAges
65 years and over
Pneumonia and
Influenza A ll Ages
Under 1 year
A ll Causes
NEW ENGLAND:
Boston, Mass.----- Brldgeport, Conn.- Cambridge, Mass.-- Pall River, Mass.- Hartford, Conn.—Lowe11 , Mass.----
Lynn, Mass.------New Bedford, Mass.New Haven, Conn.-- Providence, R. I .- Somerville, Mass.-Springfie ld , Mass.--- 1Waterbury, Conn.-- Worcester, Mass.--
MIDDLE ATLANTIC:Albany, N. Y .---Allentown, Pa.--Buffalo, N. Y .—Camden, N. J . ---Elizabeth, N. J.-Erie, pa .-------Jersey C ity , N. J . ---Newark, N. J .- ............... |New York C ity , N. Y.4-Paterson, N. J . ------Philadelphia, Pa.----Pittsburgh, Pa.------Reading, pa . ---------
Rochester, N. Y .-----Schenectady, N. Y .---Scranton, Pa.----Syracuse, N. Y .--Renton, N. J . ---Utica, N. Y .______Yonkers, N. Y .____
E a ST N ORTH C E N T R A L :
Akron, Ohio------Canton, Ohio...........Chicago, m . .........
C incinnati, Ohio-- Cleveland, Ohio— Columbus, Ohio---S *«™ , Ohio...........“e tro it , Mich.---Evansville, In d .~; 11« , Mich............
Wayne, In d .~®ary. In d ................«and Rapids, Mich M a j P o l i s , Ind.^ i s o n , W is..........Milwaukee, W is.—^eoria, n i . ......ookford, m . ----
; ° « h Bend, l nd .~T°ledo, Ohio...........
oungstown, Ohio--
N0RTH CENTRAL:Dul Moines. Iowa--Ka » Minn..........
" sas C i t y , Kans. J^nsas C i t y , Mo.-
"eoln, Nebr.---
< w eapolls> Minn. !£*ha> Nebr............
st! »°ui s > M° — --W i; ja u l* Minn.—
ch ita , Kans.- —
SOUTH ATLANTIC:A tlanta , Ga.--------Baltimore, Md.------Charlotte, N. C .----Jacksonv ille , F la .--Miami, F la .---------Norfolk, Va.--------Richmond, Va.-------Savannah, Ga.-------St. Petersburg, Fla.-Tampa, F la .---------Washington, D. C .---Wilmington, D e l.----
EAST SOUTH CENTRAL:Birmingham, A la .----Chattanooga, Tenn.--Knoxville, Tenn.----L ou isv ille , Ky.-----Memphis, Tenn.------Mobile, A la .--------Montgomery, A la .----Nashville , Tenn.----
jWEST SOUTH CENTRAL:Austin, Tex.--------Baton Rouge, La.----Corpus C h r is t i, Tex.-Dallas , Tex.--------El Paso, Tex.-------Fort Worth, Tex.----Houston, Tex.-------L it t le Rock, Ark.---New Orleans, L a .----Oklahoma C ity , Okla.-San Antonio, Tex.---Shreveport, L a .-----Tulsa, Okla .--------
MOUNTAIN:Albuquerque, N. Mex.--Colorado Springs, Colo.Denver, Colo .-------Ogden, Utah---------Phoenix, A r iz .------Pueblo, Colo.-------Salt Lake C ity , Utah--Tucson, A r iz .-------
PACIFIC:Berkeley, C a l i f .-----Fresno, C a l i f .-------Glendale, C a l i f .-----Honolulu, Hawaii-----Long Beach, C a l i f .---Los Angeles, C a l i f .--Oakland, C a l i f .--- --Pasadena, C a l i f .-----Portland, Oreg.------Sacramento, C a l i f .---San Diego, C a l i f .----San Francisco, C a l i f .-San Jose, C a l i f .-----Seattle , Wash.--- ---Spokane, Wash.-------Tacoma, Wash.--------
1 ,090
121 209
41 75
100 40 80 307167
20848
60695 52 36
11514336 24
105
1,168343443
1394772
27856
12692
1225768
5266130
123 21120226881
1 ,499 17 4737 39
103452
9132
1395596
16338
12433 33
562
53 106
1737 61 20 48 12
6238 8523
32246282660702213 57
5951814 22 8029 44
12424
6346 623039
3053216721659164252
8761225 28 2054
26747 22 87 36 46
10321662418
Total 12 ,312 6 ,988
Expected Number 12 ,050 6 ,874
49
41
6545
1491
18
22
10
2
32
13
103
3
264
266463 2 1 2 2
29111
1
12124 2211
426
339
Cumulative Total (includes reported corrections for previous weeks)
77|
615
55 3 2 16
331
3292
89
101313
114 3
425
7 9 93 1
3112121645
56
2152
168
13 1 9 1 24
643
499
394,778 225,828 16 ,090 18,451
8as, Nev.*♦Mortality data are being collected from Las Vegas, Nev., for possible inclusion in this table, however, for statistical reasons, these data will be listed only and not included in the total, expected number, or cumulative total, until 5 years of data are collected.
ayed report for week ended Ju ly 25, 1970

304 Morbidity and Mortality Weekly Report AUGUST 1, 1970
T H E M O R B I D I T Y A N D M O R T A L I T Y W E E K L Y R E P O R T , W I T H A C I R C U L A
T I O N O F 2 1 , 0 0 0 I S P U B L I S H E D A T T H E C E N T E R F O R D I S E A S E C O N T R O L ,
A T L A N T A , G E O R G I A .
D I R E C T O R , C E N T E R F O R D I S E A S E C O N T R O L D A V I D J . S E N C E R , M . D .
D I R E C T O R , E P I D E M I O L O G Y P R O G R A M P H I L I P S. B R A C H M A N , M . D .
E D I T O R P R O T E M A L A N R. H I N M A N , M . D .
M A N A G I N G E D I T O R P R I S C I L L A B . H O L M A N
I N A D D I T I O N T O T H E E S T A B L I S H E D P R O C E D U R E S F O R R E P O R T I N G
M O R B I D I T Y A N D M O R T A L I T Y , T H E C E N T E R F O R D I S E A S E C O N T R O L
W E L C O M E S A C C O U N T S O F I N T E R E S T I N G O U T B R E A K S O R C A S E I N V E S T I
G A T I O N S W H I C H A R E O F C U R R E N T I N T E R E S T T O H E A L T H O F F I C I A L S
A N D W H I C H A R E D I R E C T L Y R E L A T E D T O T H E C E N T E R F O R D I S E A S E
C O N T R O L . S U C H C O M M U N I C A T I O N S S H O U L D B E A D D R E S S E D T O :
C E N T E R F O R D I S E A S E C O N T R O L
A T T N : T H E E D I T O R
M O R B I D I T Y A N D M O R T A L I T Y W E E K L Y R E P O R T
A T L A N T A , G E O R G I A 3 03 3 3
N O T E : T H E D A T A I N T H I S R E P O R T A R E P R O V I S I O N A L A N D A R E B A S E D
O N W E E K L Y T E L E G R A M S T O T H E C D C B Y T H E I N D I V I D U A L S T A T E
H E A L T H D E P A R T M E N T S . T H E R E P O R T I N G W E E K C O N C L U D E S A T C L O S E
O F B U S I N E S S O N F R I D A Y ; C O M P I L E D D A T A O N A N A T I O N A L B A S I S A R E
O F F I C I A L L Y R E L E A S E D T O T H E P U B L I C O N T H E S U C C E E D I N G F R I D A Y -
oT1
o>rCDcU)zmt/>CO
> OPS> H z m H X> n' OO 3J3s30 V) O PI55
° O w O u> Z
x ü C
5 Ê «H C o i o mW I U5 m $
O H S 3 1 5 T, w Z z m h
l b * z m i > m ; rZ i
a3
m a c o
-i5zVz a£PIrnj>xin