1 Water Resources: Quantity and Quality - Wiley-VCH · Water Resources: Quantity and Quality ......
30
1 Water Resources: Quantity and Quality Water pollution, together with loss of biodiversity, climate change, energy and socio- economic issues, is one of the main threats and challenges humanity faces today. Human activities and human-related substances and wastes introduced into rivers, lakes, groundwater aquifers and the oceans modify the environmental water quality and make huge quantities of water unsuitable for various uses. This is the case not only for human-related uses such as drinking, bathing, agricultural irrigation and industrial production but also for terrestrial and aquatic ecosystems for which clean, fresh water is a prerequisite for life. Water pollution is a serious problem for human health and the environment. The extent of the problem has been confirmed by many reports from UN organisations and related statistics. For example the Global Environment Outlook report (2000) produced by the United Nations Environment Programme (UNEP) included the following statistics: . Already one person in five has no access to safe drinking water. . Polluted water affects the health of 1.2 billion people every year, and contributes to the death of 15 million children less than 5 years of age every year. . Three million people die every year from diarrhoeal diseases (such as cholera and dysentery) caused by contaminated water. . Vector-borne diseases, such as malaria, kill another 1.5–2.7 million people per year, with inadequate water management a key cause of such diseases. Water pollution contributes to the so-called global water crisis, because it reduces the available amount of freshwater resources for both people and ecosystems. Freshwater scarcity is already a reality in many parts of the world, not only in developing countries like India, China and many African countries, but also in countries and regions traditionally considered as water rich, such as the USA and Europe. The United Nations (UN) predicts that two-thirds of the worlds population will live in water-scarce regions by 2025. The increase in water demand, together with the increase in population in many parts of the world, but mainly the over use of water in areas like agriculture, together with water pollution and climate change are the main driving forces behind this phenomenon. Risk Analysis of Water Pollution: Second, Revised and Expanded Edition. Jacques Ganoulis Copyright Ó 2009 WILEY-VCH Verlag GmbH & Co. KGaA, Weinheim ISBN: 978-3-527-32173-5 j1
Transcript of 1 Water Resources: Quantity and Quality - Wiley-VCH · Water Resources: Quantity and Quality ......

1Water Resources: Quantity and Quality
Water pollution, together with loss of biodiversity, climate change, energy and socio-economic issues, is one of the main threats and challenges humanity faces today.Human activities and human-related substances and wastes introduced into rivers,lakes, groundwater aquifers and the oceans modify the environmental water qualityand make huge quantities of water unsuitable for various uses. This is the case notonly for human-related uses such as drinking, bathing, agricultural irrigation andindustrial production but also for terrestrial and aquatic ecosystems for which clean,fresh water is a prerequisite for life.Water pollution is a serious problem for human health and the environment. The
extent of the problem has been confirmed by many reports from UN organisationsand related statistics. For example the Global Environment Outlook report (2000)produced by the United Nations� Environment Programme (UNEP) included thefollowing statistics:
. Already one person in five has no access to safe drinking water.
. Polluted water affects the health of 1.2 billion people every year, and contributes tothe death of 15 million children less than 5 years of age every year.
. Three million people die every year from diarrhoeal diseases (such as cholera anddysentery) caused by contaminated water.
. Vector-borne diseases, such asmalaria, kill another 1.5–2.7million people per year,with inadequate water management a key cause of such diseases.
Water pollution contributes to the so-called global �water crisis�, because it reducesthe available amount of freshwater resources for both people and ecosystems.Freshwater scarcity is already a reality in many parts of the world, not only indeveloping countries like India, China and many African countries, but also incountries and regions traditionally considered as water rich, such as the USA andEurope. The United Nations (UN) predicts that two-thirds of the world�s populationwill live inwater-scarce regions by 2025. The increase inwater demand, together withthe increase in population inmany parts of theworld, butmainly the over use ofwaterin areas like agriculture, together with water pollution and climate change are themain driving forces behind this phenomenon.
Risk Analysis of Water Pollution: Second, Revised and Expanded Edition. Jacques GanoulisCopyright � 2009 WILEY-VCH Verlag GmbH & Co. KGaA, WeinheimISBN: 978-3-527-32173-5
j1

The quality of water resources and aquatic ecosystem preservation are very muchrelated to the design and operation of hydraulic engineering structures, such as dams,reservoirs and river levees.Until now thedesignof these structureshas paid far greaterattention to cost, benefit and safety than to issues of environmental impact. Technicalprojects such as wastewater treatment plants, management of waste disposal andremediation of contaminated sites, which aim to treat wastewaters and thereforeimprove water quality, also produce various environmental hazards and risks.To face real situations of water resources pollution, the efficient application of an
environmental impact assessment, including data acquisition, risk analysis andexamination of institutional aspects of water resources management, is of crucialimportance. In this book the term �water resources� covers fresh surface water andgroundwater, as well as coastal water resources.Many new techniques for risk assessment and management have been developed
recently both in the USA and Europe (Duckstein and Plate, 1987; Ganoulis, 1991c;Haimes et al., 1992;Morel and Linkov, 2006; Hlavinek et al., 2008). These techniquesaim to quantify the risks arising from the various uses of water, for example urbanwater supply, irrigation and industrial processes. However, few of these develop-ments have filtered into academic curricula, and even fewer into engineeringpractice. The main objective of this book is to present, in a unified framework,methods and techniques of risk and reliability analysis for evaluating the impact onenvironmental water quality from different water uses, wastewater disposal andwater resources management planning.Risk and reliability analysis has also been used in fields other than engineering, for
example in social, economic and health sciences. Risks have been analysed withinthese disciplines in relation to public policy, administration, financing or publichealth. Public risk perception, social behaviour and attitudes under risk, risk costsand exposure assessment are some of the major topics of study.In this book environmental risk and reliability analysis is discussed, as applicable
specifically towater pollution in the natural environment. Risk and reliability analysismay also provide a general methodology for the assessment of the safety of water-related engineering projects. In water pollution problems, risk is related to variousuncertainties in the fate of pollutants. Thus, risk and reliability assessment of waterpollution is a useful tool to quantify these uncertainties and evaluate their effect onwater resources. In this respect, the important technical aspects are themanagementof hydrosystems (rivers, lakes, aquifers and coastal areas) taking into account waterquality and environmental impacts, the design of environmental amenities, themanagement of waste disposal, the optimum operation of wastewater treatmentplants and the remediation of contaminated sites.
Important features covered in this book are:
. Uncertainty Analysis of Water Quantity and Quality.
. Stochastic Simulation of Hydrosystems: model selection, water quantity andquality assessment and changes in water quality due to possible climate changein coastal waters, risk of groundwater and river pollution.
. Application of Fuzzy Set Theory in Engineering Risk Analysis.
2j 1 Water Resources: Quantity and Quality

. Decision Theory under Uncertainty: risk management, risk–cost trade-offs.
. Case Studies.
Environmental water pollution could lead to public health hazards (risk to humanhealth), deterioration of water quality and damage to ecosystems (environmentalrisk) or may cause economic consequences (economic risk). In this sense, environ-mental risk and reliability analysis is an interdisciplinary field, involving engineers,chemists, biologists, toxicologists, economists and social scientists. Although there isa strong interaction between these disciplines and for specific applications only teamwork is appropriate, this book focuses mainly on the technical and engineeringaspects of environmental risk.In this introductory chapter the role of engineering risk and reliability analysis in
water pollution problems is further clarified. After stressing the importance of bothnatural water resources and water quality, environmental risk assessment andmanagement are explained and the organisation of material presented in thefollowing chapters is summarised.
1.1Water Pollution and Risk Analysis
Risk and reliability have different meanings and are variously applied in differentdisciplines such as engineering, statistics, economics, medicine and social sciences.The situation is sometimes confusing because terminologies and notions aretransferred from one discipline to another without modification or adjustment.This confusion is further amplified as scientists themselves can have differentperceptions of risks and use different tools to analyse them.Risk has different definitions in engineering, economic, social and health sciences.
Risk analysis ismainly based on the quantification of various uncertainties whichmayoccur in the evolution of different processes. The use of modelling techniques toquantify such uncertainties is an essential part of risk analysis. Furthermore, becausepreventive and remedial actions should be based on predictions of how processesmight develop under uncertainty in the future, probabilistic approaches are moreappropriate for this purpose than deterministic methods. Probabilities, and morerecently the fuzzy set theory, are suitable tools for quantifying uncertainties whichmay induce a risk of failure.Water quantity and quality problems are very much inter-related and should be
studied within an integrated framework. Furthermore, water quality is related to theintegrity of ecosystems and these should be analysed together. This unified approachhas been adopted in this book. After reviewing the importance of water resources andthe need for good water quality for sustainable economic development, the manage-ment of water resources is analysed. The latter is based on both the design anddecisionmaking processes, in which various uncertainties may exist. The concept ofquantification of these uncertainties and how onemay proceed from the assessmentto the management of risks are presented in the following pages and discussed indetail in Chapters 2 and 3.
1.1 Water Pollution and Risk Analysis j3

1.1.1A Systemic View of Water Resources
The total volume of water on Earth is estimated at 1360 million cubic kilometers or1338� 106 km3 (Gleick, 1996 andUSGS). This numberwas derived froma long-termassessment of the average amount ofwater stored in thehydrosphere, that is, that partof the Earth covered by water and ice, the atmosphere and the biosphere (all livingorganisms on Earth). About 70% of the Earth�s surface is covered by oceans. The saltwater in the seas and oceans represents 97%of the total water onEarth, the remaining3% being fresh water.Freshwater is distributed in different components (glaciers, rivers, lakes, ground-
water, atmosphere andbiosphere) as shown inTable 1.1. From this table it can be seenthat the greatest part (68.7%) of total freshwater is trapped in polar glaciers and icesheets, and is therefore not directly accessible for use. Only 0.3% of the freshwater onEarth is surface water, in the form of lakes (87%) and rivers (2%).
Water exists in three states: liquid, solid (ice and snow) and gas (water vapour). Dueto the energy supplied by the sun, water is permanently being transformed from onestate to another, and is in constant motion between oceans, land, atmosphere andbiosphere. As shown in Figure 1.1, water in motion constitutes the hydrologic cyclethrough the following hydrological processes, which take place in a permanentmanner (UNESCO glossary):
. Evaporation: emission of water vapour by a free surface at a temperature belowboiling point.
. Transpiration: transfer of water vapour from vegetation to the atmosphere.
. Interception: process by which precipitation is caught and held by vegetation(canopy and litter structures) and which may then be lost by evaporation withoutreaching the ground.
. Condensation: the change in water phase from a vapour state into a liquid state.
. Precipitation: liquidorsolidproductsof thecondensationofwatervapour fallingfromclouds or deposited from the air onto the ground. For example rain, sleet, snow, hail.
. Runoff: that part of precipitation that appears in surface streams.
. Infiltration: flow of water through the soil surface into a porous medium.
. Groundwater flow: movement of water in an aquifer.
Table 1.1 Distribution of freshwater on Earth.
Source of freshwater (estimate) Percentage of the total freshwater
Glaciers and permanent snow cover 68.7%Groundwater 30.1%Freshwater lakes 0.26%Rivers 0.006%Atmosphere 0.004%Biosphere 0.003%
4j 1 Water Resources: Quantity and Quality

For water resources management in a given hydrological area or at the catchmentscale it is necessary to quantify the available water resources for a given time scale.Thewater balance or thewater budget of a region is the quantification of the individualcomponents of the water cycle during a certain time interval.What is important for the development of water resources is not the amount of
precipitation in an area but rather the so-called efficient precipitation. This is theamount of runoff water remaining when evapotranspiration is subtracted from thetotal precipitation. This amount represents the potential water resource and includesthe overland flow and water infiltrating the soil. For the EU themean annual volumeof precipitation water is estimated at 1375 km3/year (97 cm/year) and the efficientprecipitation at 678 km3/year (48 cm/year) (Bodelle and Margat, 1980).
1.1.1.1 Examples of Application
Annual Water Budget of Romania (Table 1.2).
Annual Water Budget of Bulgaria (Table 1.3).
Figure 1.1 The hydrological cycle.
Table 1.2 Annual water budget of Romania (National Instituteof Meteorology and Hydrology, Regional Office, Timisoara).
Precipitation 850mm/yearRunoff 300mm/yearEvaporation 550mm/year
Table 1.3 Annual water budget of Bulgaria (Geography of Bulgaria,monograph, Bulgarian Academy of Sciences, 1989).
Precipitation 690mm/yearRunoff 176mm/yearEvaporation 514mm/year
1.1 Water Pollution and Risk Analysis j5

In today�s complex economy water resources play a key role. In addition to the factthat fresh water is essential to all kinds of life, it is also used in agriculture andindustrial processes. Fresh water is used in settlements to meet domesticdemands (Figure 1.2) and also in municipal waste water systems, industrialwastewater treatment plants in agriculture, and for the dissolution and removal ofdirt and waste.A sufficient supply of fresh water has become a necessary condition to ensure
economic growth and development. Since it takes 1000 tons of water to produce 1 tonof grain, importing grain is the most efficient way to import water. Countries are, ineffect, using grain or other agricultural products to balance their water resourcesbudget.As demand for water for different uses increases and pollution deteriorates water
quality, economic development is put under stress and conflicts result betweendifferent �direct� and �indirect� users (Figure 1.2). The problem is further exacerbatedin regions where long-term droughts have decreased the available amount of water,while the needs for water have increased. At the same time, preservation of goodwater quality in rivers, lakes, aquifers and coastal waters is necessary to protect publichealth and ecosystems.The importance ofwater resources and problems ofwater quantity and qualitymay
be better perceived by analysing the economic importance of water and the new
Figure 1.2 Direct and indirect uses of water resources by man and ecosystems.
6j 1 Water Resources: Quantity and Quality

opportunities in the water market. In the EU it has been estimated (Williams andMusco, 1992) that the costs of running municipal water supply and wastewatersystems alone are 14 billion Euros per year. For the implementation of themunicipalwastewater and drinking water directives in the EU, including its new members,several hundred billion Euros will be needed in the near future. To face the problemsof future water demand and to combat growing pollution it is expected that thealready huge market for water will be expanded further with new technologies, newinvestments and new management methods.When considering management issues of water-related problems it becomes
apparent that besides scientific and technical components there are also social,economic and institutional components involved (Figure 1.3).If water resources are defined as a system (Figure 1.3), apart from the natural water
subsystem, man-made water subsystems (channels, distribution systems, artificiallakes, etc.), as well as the administrative system, should also be included. These threesubsystems are interconnected and are subject to various social, political andeconomic constraints (Figure 1.3). Inputs to the system are data, investment, scienceand technology and outputs are water uses, environmental protection, new technol-ogies, and so on.
1.1.2The New Paradigm of Water Quality
In water resources management water quality plays an increasingly important role,just as important as that of water quantity. In fact, as pollution of surface, coastal andgroundwater increases, it has become essential to adopt an integrated approachencompassing both water quantity and quality (Figure 1.4).
Figure 1.3 Description of a water resources system.
1.1 Water Pollution and Risk Analysis j7
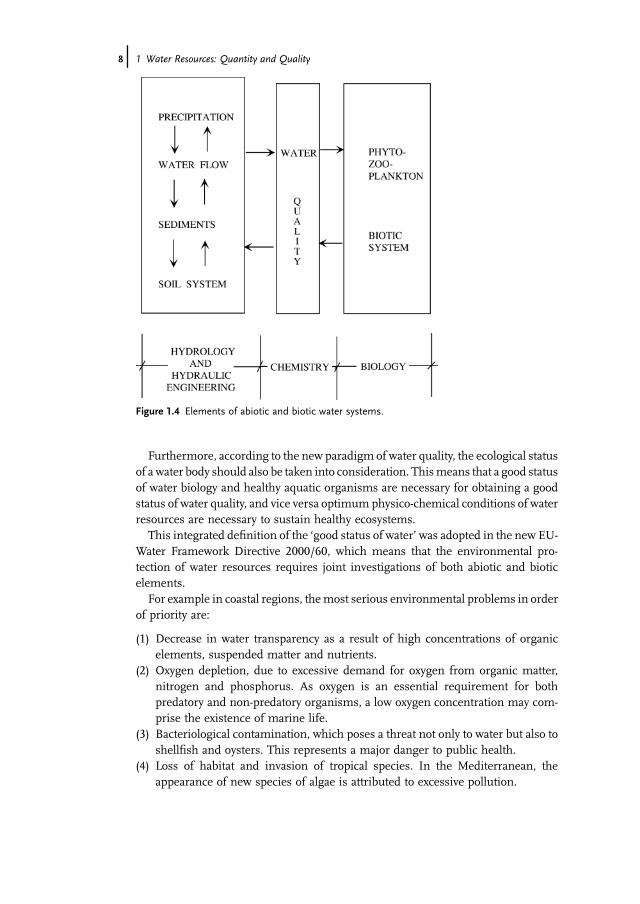
Furthermore, according to the new paradigm of water quality, the ecological statusof a water body should also be taken into consideration. Thismeans that a good statusof water biology and healthy aquatic organisms are necessary for obtaining a goodstatus of water quality, and vice versa optimum physico-chemical conditions of waterresources are necessary to sustain healthy ecosystems.This integrated definition of the �good status of water� was adopted in the new EU-
Water Framework Directive 2000/60, which means that the environmental pro-tection of water resources requires joint investigations of both abiotic and bioticelements.For example in coastal regions, themost serious environmental problems in order
of priority are:
(1) Decrease in water transparency as a result of high concentrations of organicelements, suspended matter and nutrients.
(2) Oxygen depletion, due to excessive demand for oxygen from organic matter,nitrogen and phosphorus. As oxygen is an essential requirement for bothpredatory and non-predatory organisms, a low oxygen concentration may com-prise the existence of marine life.
(3) Bacteriological contamination, which poses a threat not only to water but also toshellfish and oysters. This represents a major danger to public health.
(4) Loss of habitat and invasion of tropical species. In the Mediterranean, theappearance of new species of algae is attributed to excessive pollution.
Figure 1.4 Elements of abiotic and biotic water systems.
8j 1 Water Resources: Quantity and Quality

(5) Eutrophication phenomena due to the increase of nutrients, such as nitrogen andphosphorus.
The social causes of these problems are mainly due to the increase in coastalpopulations and also intensive agricultural, industrial and harbour activities incoastal areas. Preserving water quality in this integrated manner safeguards humanwell-being and health and at the same timemaintains diversity in the biota. In coastalarea, fishing and other aquacultures are traditional and very important economicactivities, employing and feeding large populations, especially on islands. Tourismforms an important part of the economy in many European countries and is directlyrelated to the quality of marine resources. The importance of these aspects isdiscussed below.
1.1.2.1 Human Well-being and HealthAlthough water quality has a direct impact on the actual health of urban populations,there are also extremely important indirect impacts through the food chain. Catchesof fish and oyster farming in polluted coastal areas may introduce bacterial or toxicmetal contamination into the human food chain, causing epidemiological occur-rences. Even in cases where contamination remains tolerable, the presence ofpollutants may cause abnormal growth of certain algae in the water body, causingoxygen depletion (eutrophication). Fish feeding on these algae may suffer adversechanges in flavour or odour, and become unsuitable for human consumption. Inaddition, decaying algae produce H2S and other odorous substances which mayaffect the well-being of the population living along the water body. The importantinterplay betweenwater quality andhuman settlements on the coast is exemplified bythe total absence of permanent habitation around the Dead Sea. The quality of waterthere is so poor that not only does it not attract people, but it actually turns them away.
1.1.2.2 Ecological Impacts and BiodiversityA rich variety of organisms inhabit the world�s fresh, coastal and oceanic waters.Generally, these may be divided into producers (e.g. phytoplanktonic diatoms,flagellates, etc.) and consumers of organicmatter (e.g. zooplankton, nekton, benthos,etc.). In addition, there are also different types of bacteria, in concentrations rangingfromone per litre tomore than 108 permillilitre. Generally, bacteria do not contributesignificantly to nutrient recycling in the water column but mainly in the sediments(Odum, 1971).Areas containing water play an important role in trapping solar energy and in the
transformation of biological matter. Species diversity in the water column is directlyrelated to water quality. Studies by Copeland andBechtel (1971) have shown a paucityof biodiversity in areas close to effluent outfalls, with the effect diminishing withdistance. Also, water toxicity was found to be inversely related to species diversity inthe water body.
1.1 Water Pollution and Risk Analysis j9

Copeland (1966) has reported that in pollutedwaters the levels of various industrialwastes found in fish increase, even when the effluent has not yet reached toxic levels.This is because the reduction in the concentration of dissolved oxygen, caused by thedischarge of biological matter around the outfall, forces fish to pump more waterthrough their gills and thus absorb greater quantities of pollutants. This may thenhave a knock-on effect on the rest of the biota through the food chain.
1.1.2.3 Fishing and Oyster FarmingWater quality is very important for fishing and the aqua culture industry, especiallyshellfish farming. It is well known that organisms living in water accumulatepollutants from the surrounding water in their flesh and pass them into the foodchain. This is particularly so formussels, oysters and other stationarymarine animalsgrowing in polluted waters. For this reason, for some time now legislation hasstipulated the allowable quality of water for oyster farming.
1.1.2.4 TourismRegions having a pleasant climate and a rich cultural heritage usually attract tourists.The Mediterranean countries, for example enjoy substantial tourist influxes. It isestimated that as much as one-third of the world tourist traffic concentrates there(Golfi et al., 1993). The coastal strip has become a major attraction for touristrecreation, in the form of bathing, sport fishing and water sports. As a result,tourism has become a major contributor to the local economy.The tourist economy in these areas, however, is jeopardised by inadequate water
infrastructure, such as municipal water supplies and efficient wastewater treatmentfacilities. This frequently results in deterioration of the quality of coastal water, whichwas one of the primary factors attracting tourists in the first place. An example of theproblems which may result from unsatisfactory water resources management wasthe damage to the tourist industry on theNorthAdriatic coast in the late 1980s, due tothe occurrence of severe seasonal algal blooms, caused by abnormally high eutro-phication and warm ambient temperatures.If it were not for the substantial amounts of man-made pollution discharged into
water bodies in modern times, nature itself would be able to provide a continuousrecycling of biological matter in natural waters.Groundwater contamination is the most critical among the various types of
pollution that can occur in the water cycle, because of the long time scales involvedand the irreversible character of the damage caused. Due to the very slowmovementof groundwater, pollutants can reside for a very long time in the aquifer, and even ifthe pollutant sources are no longer active the groundwater can remain polluted forcenturies. At the same time, because of the complex interaction between pollutants,soil and groundwater, the remediation of contaminated subsurface is a very delicateoperation. Usually it is necessary to totally remove and clean the contaminated soil orfor biological techniques to be applied over a long period of time.For surface water resources, in addition to the inherent biological loading from
natural recycling of carbonaceous matter, further inputs from the land may arise inthe form of
10j 1 Water Resources: Quantity and Quality

. large amounts of sediments, resulting from increased soil erosion due to thesubstantial deforestation inhistorical times, especially inMediterranean countries;
. inorganic and organic pollutants, mainly nitric or phosphoric fertilisers, pesticidesor herbicides used in farming. These result in a substantial contribution andare estimated to account for most of the overall water pollution (USEPA, 1984;ASIWPCA, 1985);
. organic, microbial or toxic man-made pollutants such as heavy metals or greasesdischarged from sewers.
Of these loads, heavy metals and toxic constituents tend to be chemically inactiveand are removed mainly by mechanical or physical processes (e.g. sedimentation,adsorption onto solid particles or surfaces immersed in the water, etc.), whereasorganic and other inorganic substances decay via numerous and very complicatedchemical and biological processes.All pollution loads, whether natural or man-made, are subject to the influence of
water circulation currents. This results in advection and turbulent dispersion in thewater body, following the laws of conservation ofmass for each constituent substancein the system.Advection occurs by turbulent mass transport within the water, while additional
diffusion and turbulent dispersion of pollutants takes place. In addition, thepollutants are subject to different types of decay, such as
. chemical, as a result of the oxidising effect of oxygen dissolved in the water, and bymutual neutralisation between acidic and alkaline pollutants;
. biological, arising from metabolism by microbes, phyto- or zooplankton.
Overall, all these processes are extremely complicated and with the exception ofwater advection and circulation, not understood in any great detail. Therefore, muchof the following discussion is based predominantly on empirical findings fromexperiments.According to Rafailidis et al. (1994) of particular interest to engineers in the field of
surface water resources are the concentrations
. The Carbonaceous Biochemical Oxygen Demand (CBOD). This is an indicator of theoverall �loading� of the aquatic system due to the oxidation requirements of organicpollutants. It also includes the respiration demand of marine microbes whichmetabolise organic and fix inorganic matter (e.g. nitrates, inorganic phosphorus,etc.).
. The Dissolved Oxygen content (DO). This parameter is more critical because itshowswhether there is sufficient oxygen in thewater formarine life to survive. Theactual DOcontent reflects the equilibriumbetween re-aeration at the surface addedto photosynthetic oxygen generated by chlorophyll in the water body, minus thebiological and any chemical oxygen demand. Generally, most marine fauna willswim away from waters in which DO has fallen to less than about 5mg/l.Nevertheless, some types of worms have been found to survive in virtually anoxicsediments in river deltas or heavily polluted areas around effluent outfalls.
1.1 Water Pollution and Risk Analysis j11
. The concentration of nutrients (ammonia, nitrates, phosphates, inorganic nitrogen orphosphorus) is linked directly to non-point source runoff from agricultural water-sheds as a consequence of soil fertilisation, insecticide or pesticide spraying, and soon. Nutrients are metabolised by marine microorganisms and the inorganicelements are fixed to more complex compounds. Algae play a very important rolein these processes, enhancingwater denitrification (release ofN2 to the atmosphere)or nitrification (capture of N2 from air).
. Ammoniac compounds are antagonistic to nitrates, as both compete for algaluptake. On the other hand, the simultaneous presence of phosphorus enhancesalgal growth, leading to eutrophication, that is, abnormal growth of algae andmarine flora. This is particularly troublesome in enclosed waters (e.g. lakesand lagoons) but also occurs in coastal areas suffering from large pollution inflowsand suppressed natural circulation and flushing.
. The coliform bacteria concentration. Although these microorganisms are not patho-genic and exist naturally in human intestines, their presence indicates pollutiondue to urban sewage effluents. However, doubts have been voiced about thesuitability of this parameter as an indicator of pathogenic potential in coastal waters(Sobsey and Olson, 1983). This is because pathogenic viruses have lower decayrates than coliforms, and can also cause infection at smaller doses. Furthermore,whereas coliforms are of human origin, some opportunistic pathogens (e.g.Pseudomonas Aeruginosa, Legionella Pneumophila) also often originate from non-fecal sources and can grow naturally in various waters (Bowie et al., 1985). Upondischarge into the water body environmental conditions such as temperature andsunlight determine the eventual fate of coliform bacteria through a multitude ofprocesses (e.g. photo-oxidation, sedimentation, pH, predators, algae, bacterio-phages, etc.).
. Apart from the above pollutants, sediments in the water column may also causeenvironmental problems as they bury benthic flora, or choke the gills of marineinvertebrates. In fact, coastal areas at the deltas of large rivers typically sufferfrom anoxic conditions (Nelsen, 1994) due to oxygen demand from the largesediment and that required for the transport of biological matter. This is inaddition to the polluting effects of any other organic or inorganic nutrientscarried by the river.
In summary, CBOD in surface waters indicates the overall organic pollution of thewater, DO shows whether marine life may be sustained there, and nutrient concen-tration gives the potential for eutrophication. Coliform counts indicate the danger ofdisease for humans using the water for bathing or recreation.
1.1.2.5 Algal and Chlorophyllic PhotosynthesisPhytoplankton exists inmany different forms (e.g. diatoms, green algae, blue-greenalgae, dinoflagellates, etc.) and form an important part of the water ecosystemdetermining eventual water quality. Algae are primarily responsible for theuptake of nutrients, which are then recycled through algal respiration and decay.
12j 1 Water Resources: Quantity and Quality

Photosynthesis by algae in the euphotic zone produces oxygen; this is reversed atnight due to respiration.On the other hand, algae which settle in deeper, oligophotic waters contribute to
oxygen depletion there. Algae either take up dissolved CO2 or produce CO2 as a by-product of respiration, thus changing water pH and the subsequent chemical inter-actions in the water. Their presence increases water turbidity, reducing the euphoticdepth in the column. On the other hand, phytoplankton constitutes the foundation ofthe food chain of higher species, virtually supporting the marine animal biota.Because of the variety of different algae, it is customary to consider algal concentra-
tionsintermsofchlorophyll-aconcentrations.Algalgrowthisafunctionoftemperature,solar insolation and nutrients (phosphorus, nitrogen, carbon and silicon for diatoms).Other essential nutrients such as iron, manganese, sulphur, zinc, copper, cobalt,molybdenumandvitaminB12may alsobe important, especially inoligotrophicwaters.
1.1.2.6 Zooplankton GrowthZooplankton are part of the same biomass pool as phytoplankton. Zooplanktondynamics depend on growth, reproduction, respiration, excretion and non-predatorymortality. In contrast to phytoplankton, zooplanktonic organisms are mobile, sosettling does not occur. Furthermore, zooplankton migrate vertically following thediurnal cycle, adding another complication to the analysis.Growth, consumption, respiration and non-predatory mortality are direct func-
tions of temperature. Zooplanktonic animals are typically filter feeders. Therefore,zooplankton growth may be simply considered as being proportional to the availablefood concentration. Predation is also related to the rates of consumption by higherpredators.
1.1.2.7 BacteriaColiform growth and decay depend mainly upon environmental conditions througha variety of mechanisms. These include physical (e.g. photo-oxidation, coagulation,sedimentation), physico-chemical (e.g. pH, osmotic effects) and biochemical-biolog-ical (e.g. nutrient levels, predators, algae, bacteriophages) factors.The interplay between these factors is poorly understood, especially quantitatively.
Because of this limitation, coliform growth and decay have traditionally beenassessed on the basis of the first-order approach of the T-90 measured values, thatis, the exposure required to ensure 90% mortality. Care must be taken, however,because bacterial decay in the dark is only approximately half of that atmidday (Bowieet al., 1985). Apart from this sensitivity to light, measurements have also detected asensitivity to water salinity. As in all other physico-bio-chemical processes, tempera-ture also plays an important role (Ganoulis, 1992).
1.1.3Integrated Water Resources Management
Water Resources Management is traditionally defined as a process of effectivelyallocating an appropriate amount of water to a given sector, such as urban water
1.1 Water Pollution and Risk Analysis j13

supply, agriculture or industry. Adequate decisions should be made and measurestaken in order to satisfy the demand for water both in terms of quantity andquality.In urban water supply for example, decisions on structural and non-structural
measures should be taken in order to ensure good drinking water for all citizens. Asshown in Figure 1.5, satisfying the demand whilst collecting municipal wastewaterand providing adequate treatment for environmental protection, constitute parts ofthe urban water management problem. Management of urban water resourcesinvolves addressingnot only technical issues but alsomany social factors, institutionsand administrative procedures.Themain objective of water resourcesmanagement is to satisfy the demand, given
the possibilities and limitations of the water supply. The balance between supply anddemand should take into consideration both water quantity and quality aspects aswell as the protection of the environment.As seen in Figure 1.5 water resourcesmanagement involves problem formulation,
planning, implementation of appropriate measures, regulation of both water de-mand and supply and finally decision making. The various steps involved in thisprocess are described schematically in Figure 1.6. Implementation of the design anddecision stages involves the following processes:
Step 1: Identify the problem. Analyse important factors and variables.Step 2: Determine the objectives in terms of the above variables.Step 3: Develop a mathematical model correlating input–output variables.Step 4: Identify alternative options.Step 5: Select the optimum solution.Step 6: Employ sensitivity analysis, that is, examine the influence on the results of any
change in the value of parameters and the assumptions made.
Figure 1.5 Urban water resources management.
14j 1 Water Resources: Quantity and Quality

At the river catchment scale, different uses of water, such as for drinking,agricultural irrigation, hydropower production and industry, often lead to conflictingsituations. For example industries producing large amounts of untreated wastewatermay pollute groundwater in the surrounding aquifer, which in turn affects the qualityof water pumped for drinking purposes. The increase in water pollution fromindustrial activities may also affect the quality of river water used for irrigation.When groundwater is over-pumped from a series of wells, the groundwater table islowered and could affect agricultural production, as less water will be available forcrop roots. Lowering the water table in a coastal zone may also increase seawaterintrusion and soil salinisation, leading to a negative impact on agriculture andecosystems.Obviously, when actions are taken for different water uses, as can be seen in the
examples above, there is a need to coordinate the various aspects of the relatedactivities, such as between different:
. sectors of water uses (water supply, agriculture, industry, energy, recreation, etc.);
. types of natural resources (land, water and others);
. types of water resources (surface water, groundwater);
Figure 1.6 Modelling and decision making processes in water resources management.
1.1 Water Pollution and Risk Analysis j15

. locations in space (local, regional, national, international);
. variations in time (daily, monthly, seasonal, yearly, climate change);
. impacts (environmental, economic, social, etc.);
. scientific and professional disciplines (engineering, law, economy, ecology, etc.);
. water-related institutions (government, private, international, NGOs, etc.);
. decision-makers, water professionals, scientists and stakeholders.
As shown in Figure 1.7, IntegratedWater Resources Management (IWRM) can beachieved by coordinating different topics, areas, disciplines and institutions, whichcan be categorised as being either natural (type of resources, space and time scales) orman-related (sectors, scientific disciplines, impacts, institutions, participants). Thereis no general rule about the optimum degree of integration and how to achieve it.Concerning the spatial scale and taking into account the hydrological cycle and thewater budget, the area of the river basin is themost relevant watermanagement unit.The effect of possible climate change should also be taken into account, althoughmajor uncertainties still persist for quantifying such effects.The need for coordination inWaterResourcesManagementwasfirst recognised in
the 1970s and the actual term �Integrated Water Resources Management� (IWRM)was first coined in 1977 at the UN Conference in Mar del Plata. The term is verybroad, and is therefore subject to different definitions.In the Background Paper No. 4 produced by its Technical Committee (TEC), The
GlobalWater Partnership (GWP) – anNGObased in Stockholm –defines IWRMas �aprocess which promotes the coordinated development and management of water,land and related resources to maximise the resultant economic and social welfare inan equitable manner without compromising the sustainability of vital ecosystems�.(GWP, 2000). The �Tool Box� being developed by GWP promotes IWRM and makesrecommendations on how it can be achieved (GWP, 2002, 2004).The World Water Council (WWC) stated that IWRM is a �Philosophy that holds
that water must be viewed from a holistic perspective, both in its natural state andin balancing competing demands on it – agricultural, industrial, domestic andenvironmental. Management of water resources and services needs to reflect theinteraction between these different demands, and so must be coordinated withinand across sectors. If the many cross-cutting requirements are met, and if therecan be horizontal and vertical integration within the management framework forwater resources and services, a more equitable, efficient and sustainable regimewill emerge� (Global Water Partnership, Framework for Action 1999).At theWorld Summit in Rio (1992), a special reference was made to IWRM. In the
action programme known as Agenda 21 adopted at the Conference, in Chapter 18,Paragraph 18.6 it is stated that �. . . the holistic management of freshwater as a finiteand vulnerable resource, and the integration of sectoral water plans and programmeswithin the framework of national economic and social policy, are of paramountimportance for action in the 1990s and beyond�. The fragmentation of responsibilitiesforwater resourcesdevelopment among sectoral agencies is proving, however, to be aneven greater impediment to promoting integrated water management than had beenanticipated. Effective implementation and coordination mechanisms are required.
16j 1 Water Resources: Quantity and Quality

Water resources development and protection, andmore particularly IWRM, is oneof the main elements for achieving �sustainable development�. According to theBrundtland Commission (1987) sustainable development should satisfy currentneeds without compromising the requirements of future generations. For waterresources, sustainable managementmay be defined as using water for various needswithout compromising its hydrologic, qualitative and ecological integrity. Sustain-ability can be achieved by resolving environmental, economic and social issuesrelated to water management.Sustainabilitymay be viewed as an ultimate goal, but it is onewhich is very difficult
to achieve. It is therefore important to define quantitative sustainability indices inorder to measure and record the progress achieved or the degradation observed indifferent domains. A risk assessment approach using four risk indices (technical orengineering, economic, environmental and social) is proposed in order to monitor
Figure 1.7 Natural and man-related issues of IWRM.
1.1 Water Pollution and Risk Analysis j17

quantitatively the degree to which IWRM achieves sustainable water resourcesmanagement and sustainable development (Ganoulis, 2001).
1.2Water Pollution in Transboundary Regions
Two types of border dividing the territory of different states within a river basin areshown in Figure 1.8:
(1) Borders cross the river at a point and divide the river catchment in two areas,the upstream and the downstream. In this case, there is no joint sharing of oneriver section by the two states. This is the case of the border between Hungaryand Serbia at points crossed by the Danube and Tisza Rivers or the borderbetween Greece and the Former Yugoslav Republic of Macedonia (FYROM)crossed by the Vardar/Axios) River near the city of Gevgelia (Figure 1.8a).
(2) Rivers serve as borders between states, as in the case of the lower course of theDanube River, which serves as the border between Bulgaria and Romania(Figure 1.8b); and borders that follow and also cross international rivers.
How the interstate borders follow and/or cross international rivers, and how theydivide rivers and river basins, will determine what type of water resources problemsexist or will likely arise and need bilateral or multilateral interstate solutions. Fortransboundary waters, a large number of international agreements for solvingvarious types of interstate water resources problems are available. The most impor-tant international treaty is the United Nations Economic Commission for Europe(UNECE) Convention.
Figure 1.8 Schematic representation of two types of interstate borders:(a) crossing and (b) following a river.
18j 1 Water Resources: Quantity and Quality

1.2.1The UNECE Convention (Helsinki, 1992)
Legal name: Convention on the protection anduse of transboundarywatercourses andinternational lakes.The Convention obliges Parties to prevent, control and reduce water pollution
from point and non-point sources. It is intended to strengthen national measuresfor the protection and ecologically sound management of transboundary surfacewaters and groundwaters. Multilateral cooperation for the protection of naturalresources to prevent, control and reduce transboundary impact of surface orgroundwaters which mark, cross or are located on boundaries between two ormore States.Transboundary impact means any significant adverse effect on the environment
resulting from a change in the conditions of transboundary waters caused by ahuman activity, the physical origin ofwhich is situatedwholly or in partwithin an areaunder the jurisdiction of another Party. The Convention also includes provisions formonitoring, research and development, consultations, warning and alarm systems,mutual assistance, institutional arrangements, and the exchange and protection ofinformation, as well as public access to information. In taking protective measuresthe Parties are advised to be guided by the following principles:
(a) The precautionary principle, by virtue of which action to avoid the potentialtransboundary impact of the release of hazardous substances shall not bepostponed on the grounds that scientific research has not fully proved a causallink between those substances on the one hand, and the potential transboundaryimpact on the other.
(b) The polluter-pays principle, by virtue of which costs of pollution prevention, controland reduction measures shall be borne by the polluter.
(c) Sustainability:Water resources shall be managed so that the needs of the presentgeneration are met without compromising the ability of future generations tomeet their own needs.
The Convention requires that the limits of discharges should be based on bestavailable technologies for hazardous substances. Municipal wastewater needs to bebiologically treated and best available technologies should be used to reducenutrient discharges. Appropriate measures and best environmental practices mustbe used for the reduction of nutrients and hazardous substances from non-pointsources.
1.3The EU Water Framework Directive
EU environmental regulation aims at coordinating different measures taken atCommunity level to tackle particular environmental problems in order to meet
1.3 The EU Water Framework Directive j19

established objectives. Key examples of such regulation are the Urban Waste WaterTreatment Directive, the Nitrates Directive and the Integrated Pollution Preventionand Control Directive.In 2000, theEUissued theWater FrameworkDirective (WFD) in order to ensure an
analysis of the state of water bodies and �a review of the impact of human activity onthe status of surface waters and on groundwater�. The analysis and review are to beconducted so as to determine how far each body of water is from the objectives(Directive 2000/60/EC).The overall objective of the WFD is a �good status� for all waters to be achieved
by December 2015. For surface waters, �good status� is determined by a �goodecological� and a �good chemical status�. This is determined by hydro-morpho-logical (e.g. the condition of habitats), physico-chemical and biological monitor-ing and analysis. The WFD aims to establish a framework for the protection ofinland surface waters, transitional waters, coastal waters and groundwaterwhich:
. Prevents further deterioration and protects and enhances the status of aquaticecosystems.
. Promotes sustainable water use based on the long-term protection of availablewater resources.
. Aims to enhance protection and improvement of the aquatic environment.
. Ensures the progressive reduction of pollution of groundwater and prevents itsfurther pollution.
. Contributes to mitigating the effects of floods and droughts.
Key elements of the WFD include:
. Technical considerations: monitoring, river basin planning, and management.
. Institutional: adopt the river basin as a single system for water management.
. Environmental: water quality and ecosystems.
. Water economics.
. Public participation.
TheWFD requires that River BasinManagement Plans (RBMPs) are produced foreach River Basin District (RBD) by 2009. These will be strategic managementdocuments, developed via the river basin planning process, which will integratethe management of the water and land environment. Preparation will involve aprocess of analysis, monitoring, objective setting and consideration of the measuresto maintain or improve water status.Under the WFD, environmental monitoring programmes are required and
specific objectives for water quality are set up. The WFD operates using a cyclicalmanagement process. This process begins by identifying water bodies in each RBDand describing their natural characteristics. The second stage is to assess thepressures and impacts on the water environment. This assessment identifies thosewater bodies that are unlikely to achieve the environmental objectives set out in theDirective by 2015.
20j 1 Water Resources: Quantity and Quality
The Directive calls for the application of economic principles (e.g. the recovery ofthe costs of water services and the polluter pays principle), approaches and tools(e.g. cost effectiveness analysis), and for the consideration of economic instruments(e.g. water pricing) for achieving its environmental objective in the most effectivemanner.The WFD recognises the value and importance of involving all those with an
interest in the water and land environment in how the WFD is put into practice. Incertain areas (e.g. the development of RBMPs), stakeholder involvement is aninherent part of the Directive.
1.4Uncertainties in Water Resources Management
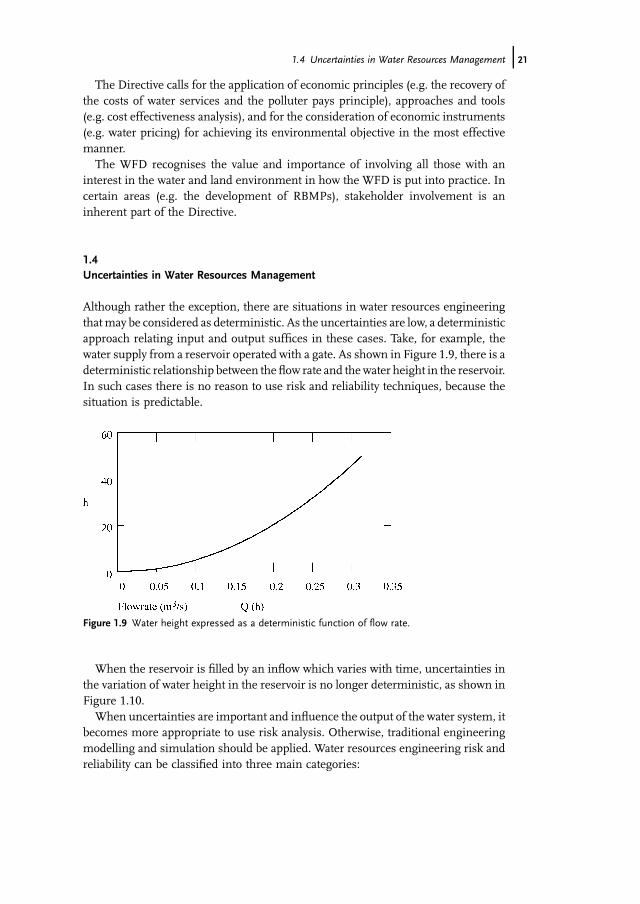
Although rather the exception, there are situations in water resources engineeringthatmay be considered as deterministic. As the uncertainties are low, a deterministicapproach relating input and output suffices in these cases. Take, for example, thewater supply from a reservoir operated with a gate. As shown in Figure 1.9, there is adeterministic relationship between the flow rate and thewater height in the reservoir.In such cases there is no reason to use risk and reliability techniques, because thesituation is predictable.
When the reservoir is filled by an inflow which varies with time, uncertainties inthe variation of water height in the reservoir is no longer deterministic, as shown inFigure 1.10.When uncertainties are important and influence the output of the water system, it
becomes more appropriate to use risk analysis. Otherwise, traditional engineeringmodelling and simulation should be applied. Water resources engineering risk andreliability can be classified into three main categories:
Figure 1.9 Water height expressed as a deterministic function of flow rate.
1.4 Uncertainties in Water Resources Management j21

(1) structural reliability (dams, flood levees and other hydraulic structures),(2) water supply reliability (problems of water quantity),(3) water pollution risk (problems of water quality).
In all three areas, uncertainties are mainly due to the spatial and temporalvariability associated with hydrological variables. In addition to these uncertainties,which arise from the definition of the physical problem, other types of uncertaintiesare added, such as those related to the use ofmethods and tools to describe andmodelthe physical problem (i.e. sampling techniques, data acquisition, data analysis andmathematical modelling). This book deals with the third group of problems, the riskto environmental water quality.
Four different types of uncertainties may be distinguished:
(1) Hydrologic uncertaintyThis refers to the various hydrological events such as precipitation, river flow,coastal currents, water quality, and so on.
(2) Hydraulic uncertaintyThese are uncertainties related to hydraulic design and hydraulic engineeringstructures.
(3) Economic uncertaintyThis refers to all fluctuations in prices, costs and investments that may affect thedesign and optimisation processes.
(4) Structural uncertaintyThis means all deviations due tomaterial tolerances and other possible technicalcauses of structural failure.
Methods and tools able to quantify such uncertainties should be incorporated intothe design and decision processes.
Figure 1.10 Stochastic variation of the water level in a reservoir.
22j 1 Water Resources: Quantity and Quality

1.5Environmental Risk Assessment and Management
According to the European Commission (EC) directive 85/337 relative to environ-mental impact studies, the design of water resources management projects shouldproceed in five steps:
As shown in Figure 1.11, application of environmental risk analysis consists of twomain parts(1) the assessment of risk, and(2) risk management.
The assessment of risk is mainly based on modelling of the physical system,including forecasting its evolution under risk. Although the main objective of risk
Figure 1.11 Risk assessment and risk management as elements of environmental risk analysis.
1.5 Environmental Risk Assessment and Management j23
analysis is the management of the system, it is not possible to do this if risk has notbeen quantified first.
The risk assessment phase involves the following steps:Step 1: Risk or hazard identificationStep 2: Assessment of loads and resistancesStep 3: Uncertainty analysisStep 4: Risk quantification
When it is possible to assess risk under a given set of assumptions, the process ofrisk management may begin.
The various steps needed for risk management are:Step 1: Identification of alternatives and associated risksStep 2: Assessment of costs involved in various risk levelsStep 3: Technical feasibility of alternative solutionsStep 4: Selection of acceptable options according to the public perception of risk,
government policy and social factorsStep 5: Implementation of the optimal choice
Because of the human and social questions involved, riskmanagement is themostimportant part of the whole process and is also themost difficult to develop. From anengineering point of view, theories and algorithms of optimisation under uncertain-ty, multi-criterion optimisation and decision making under risk are all applicable.Apart fromthestochasticapproach, thefuzzyset theorymaybeapplied.Althoughthe
useof fuzzy sets in sequential decision-makingwas formulatedmore than twodecadesago by Bellman andZadeh (1970), no realistic application has yet been put forward forhydrology and water resources engineering. The reason for this may be that a solidbackground in both fuzzy set theory and water resources engineering is required.However thecalculationsaremuchsimpler than inclassicaldynamicprogramming,asapplied for example, in reservoir operation or groundwater management. It is quitenatural to describe extreme events (especially droughts) as fuzzy or hybrid numbers.
Here we may distinguish between(a) design or planning problems, and(b) operational problems.
In planning problems, a set of discrete alternatives (also called options, actions,schemes, decisions, etc.) is defined and ratedwith a set of performance indices orfiguresof merit which are usually deterministic, stochastic or fuzzy. These usually alsoinclude non-numerical criteria. The recommended multi-objective procedure (Tecleet al., 1988) consists of
(1) defining the type of objectives-specifications-criteria-preferences (weights,scales, etc.);
(2) defining the alternatives, which should be distinct, not just marginally different;(3) using the input uncertainty characterisation/quantification to rate each alterna-
tive in terms of the selected criteria, including risk-related figures ofmerit. Usingvalue functions to quantify the non-numerical criteria;
24j 1 Water Resources: Quantity and Quality

(4) selecting at least one multi-criterion decision-making technique to rank thealternatives;
(5) evaluating the ranking, for example by comparing the results of application ofdifferent techniques (Duckstein et al., 1991), and performing a sensitivityanalysis.
The trade-off between criteria or indicators may be carried out in a hierarchicalmanner: at first, ecological indicators may be traded off to yield a composite index ofrisk, and then the economic indicators may be followed to yield a composite costindex. At the second stage the two composite indices are then traded off. At each level,fuzzy numbers may be combined or compared, using for example, a measure of thedistance between them.In operational problems, it is customary to include only numerical criteria anduse a
sequential decision making scheme such as dynamic programming (Parent et al.,1991).Taking into account the above considerations, the presentation of material in this
book is arranged along twomain paths. Thefirst comprises themain elements of riskanalysis, which rank from the simpler to the more advanced such as
(1) identification of hazards,(2) risk quantification, and risk management.
The second path follows the traditional engineering approach, that is
(1) analysis of inputs,(2) modelling, and evaluation of outputs.
This book then combines the two paths. The material illustrates recent conceptsand techniques of risk and reliability analysis in water resources engineeringplanning and management with emphasis on water quality problems.
1.6Aim and Organisation of the Book
Risk and reliability is still a relatively new subject as applied to water resources andenvironmental engineering. As a contribution to understanding and using thispowerful tool, the present volume aims to serve as a textbook. This is themain reasonfor having included numerical examples of applications, questions and problems onthe various topics covered by the book and also characteristic case studies, illustratingthe use of risk assessment techniques in environmental water quality. The generalframework of engineering risk analysis is presented from the traditional engineering(conceptual modelling) rather than from the systems engineering point of view.Methods and tools from stochastic modelling and fuzzy set theory are applied toenvironmental problems related to water pollution.InMay 1985, aNATOAdvanced Study Institute (ASI) was held in Tucson, Arizona,
USA for the purpose of classifying various concepts of engineering reliability and risk
1.6 Aim and Organisation of the Book j25

in water resources. In the edited volume of themeeting (Duckstein and Plate, 1987) ageneral systems engineering framework is provided for the calculation of engineer-ing risk and reliability in water resources. Reliability investigations are presented intwo groups: reliability in hydraulic structures and reliability in water supply systems.In the same volume, the last chapter is devoted to decisionmaking under uncertaintyand under multiple objectives.Six years later (May 1991), another NATO ASI was held in Porto Carras, Greece.
This ASImay be considered as a continuation and extension of the initial endeavour.The main purpose was to provide a unified approach to risk and reliability in bothwater quantity and water quality problems, reflecting at the same time concepts andtechniques that have emerged recently. The book published after the meeting(Ganoulis, 1991c), illustrates the steps to be followed in a systematic frameworkfor the analysis and management of risks in water resources engineering problems.Methods and tools for risk quantification and management, recent developments,new techniques and case studies are presented for risk-based engineering design inwater resources and water pollution problems. Whilst less importance is placed onstructural reliability and standard techniques for reservoir management under �non-crisis� conditions,more attention is placedon themethodologies for the quantificationand management of risks related to a broad spectrum of problems. Such methodolo-gies range from thehydrologic estimationof exceedingprobability (Bob�ee,Ashkar andPerreault, 1991) and the stochastic estimation of pollution risk in rivers (Plate, 1991),coastal waters (Ganoulis, 1991d) and groundwater (Bagtzoglou, Tompson andDoudherty, 1991) to new techniques, such as the �envelope� approach for dynamicrisk analysis (Haimes et al., 1991) and the fuzzy set approach (Duckstein and Bogardi,1991). These techniques appear to be applicable to both scientific anddecisionmakingaspects of water resources and environmental engineering.Althoughmany theoretical developments have occurred in recent years (Morel and
Linkov, 2006; Hlavinek et al., 2008), progress made both in the understanding andapplication of Risk and Reliability analysis in Water Resources and EnvironmentalEngineering remains slow. Themain reasons for this seem to be the large amount ofdata required and the lack of engineers trained to dealwith phenomena of a stochasticnature, including optimum cost/benefit decisions under uncertainty. To the author�sknowledge, no other textbook is actually available in the current literature thatpresents the various aspects of risk and reliability in environmental impact analysisand water quality problems in a unified and comprehensive framework.The purpose of this book is to present in a unified manner, methods and
techniques to evaluate the impacts and risks on environmental water quality fromalternative water management plans and wastewater or pollutant disposal into theaquatic environment. The book covers uncertainty analysis of water quantity andquality data, stochastic simulation in hydraulic/water resources/environmentalengineering, decision theory under uncertainty and case studies. Methods for riskanalysis of extremes in hydrology and risk assessment of groundwater, river andcoastal pollution are also presented. In this second edition, questions and numericalexercises are added at the end of each chapter and information to help answer thesequestions and resolve the numerical applications are given in Appendix C.
26j 1 Water Resources: Quantity and Quality

This book may be of interest to engineers (civil, chemical and environmental),hydrologists, chemists, biologists, graduate students, researchers and professionalsworking on the issues of environmental water quality.The assessment of risk in water resources problems should be based on the
proper identification of the particular situation. This means that the most signifi-cant loads, parameters and boundary conditions of the problem should be identi-fied, together with uncertainties which may give rise to a risk of environmentalthreat. This process is that of risk identification and it is analysed in Chapter 2. Twomain methodologies have been developed so far for uncertainty analysis, namelythe probabilistic approach and the fuzzy set theory. Basic concepts and the mainrules for stochastic and fuzzy calculus are presented in this chapter, together withillustrative examples mainly taken from water quality and water pollutionapplications.Risk assessment may be accomplished by the quantification of risk. This is very
important for engineering applications and forms the background for risk manage-ment. Methods and techniques to quantify risks, not only in water resourcesbut in a broader area of engineering, are presented in Chapter 3. In this chapter�loads� and �resistances� are described either as stochastic or as fuzzy variables. Withthe exception of some simple cases, where direct calculation of risk is possible, theenvironmental system is usually modeled by means of either the stochastic or thefuzzy set approach. The general frameworks for stochastic and fuzzy modellingare described in Chapter 3 and methodologies, such as the Monte Carlo simulation,are also illustrated for risk quantification.Chapter 4 deals more specifically with the risk assessment of water pollution. The
assessment of pollution risks in coastal, river and aquifer systems is analysed byappropriate mathematical modelling, describing transport, dispersion and physico-chemical reactions of the pollutants. To quantify uncertainties due to differentvariabilities such as advection, dispersion and initial conditions the random walksimulation is used.Chapter 5 deals with risk management. Here the risks have been identified and, as
far as possible, quantified. Various criteria are defined to characterise risk, includingperformance indices related to the effects of uncertainty. Some of these criteria maybe probabilistic or fuzzy. In any case, risk management provides the means withwhich to investigate the mitigation of the consequences of risks. For this purpose,trade-offs may be made at increasingly high levels between the various risk in-dicators. For example at one level an environmental risk index may be traded offagainst a technical risk index, and at a higher level an overall risk indexmay be tradedoff against an overall economic risk index.A very important demonstration of how risk analysis can be useful when
facing new and challenging problems, such as the implications in engineeringworks from possible coastal pollution and eutrophication due to climate change,is given in Chapter 6, with the case of the Gulf of Thermaikos (Macedonia,Greece). Some other characteristic risk-related case studies are presented in thischapter, namely the coastal pollution in the Gulf of Thermaikos and its inter-actions with the optimum design of the sewage treatment plant of the city, the
1.6 Aim and Organisation of the Book j27

risk assessment of pollution with nitrates from the river Axios (Macedonia,Greece) and the groundwater salinisation of the Campaspe aquifer (Victoria,Australia).
1.7Questions and Problems – Chapter 1
Water Pollution and Risk Analysis
A Systemic View of Water Resources(a) What percentage of the Earth�s surface is covered by oceans?(b) What percentage of the total water on Earth is fresh water?(c) What percentage of the total freshwater on Earth is surface water?(d) What percentage of the total freshwater on Earth is groundwater?(e) Explain why water is the most valuable resource on Earth.(f) What is the main characteristic of the hydrological cycle?(g) Define efficient precipitation.(h) Is the water balance equation generally valid and what are its limitations?
(1) In a catchment area of 0.7Gm2, the mean annual rainfall is 670mm and thecorrespondent evapotranspiration 520mm. (a) Assuming negligible storage, de-termine the total runoff (surface andunderground) inmmandkm3; (b) determinethe catchment�s annual water budget in km3; (c) calculate the evapotranspitionrate as a percentage of the rainfall. What can you conclude if you compare this tothe global average percentage evapotranspiration rate?
(2) The surface area of a reservoir is 0.9� 106m2. The average inflow is 0.15m3/sand the mean annual evaporation rate is 1500mm/year. Calculate: (a) the dailyevaporation rate in mm and m3; (b) the change in storage per year in mm andm3/year. Does the storage capacity increase or decrease? (c) The time needed toraise the water level by 1m.
The New Paradigm of Water Quality(a) How are water quantity and water quality interrelated?(b) What is the meaning of the new water quality paradigm?(c) How is biological assessment a useful tool for assessing the status of water
quality?
Integrated Water Resources Management (IWRM)(a) What is the best space scale at which IWRM should take place?(b) What are the main reasons for adopting the IWRM process?(c) Give examples of the benefits of using IWRM.(d) Do you consider water to be a human right or a human need?(e) In your opinion should water be considered as a commodity or a social
requirement?
28j 1 Water Resources: Quantity and Quality

Water Pollution in Transboundary Regions(a) How can �fair� water allocation be implemented in a transboundary river basin?(b) Equity and efficiency are notions closely related to water allocation. What are the
parameters that should be taken into account in order to achieve equity andefficiency?
(c) Should higher value uses of water take priority over lower value uses?
The EU Water Framework Directive(a) What is the definition of �good status of water� in the EU WFD?(b) How can �good water status� be achieved?(c) Enumerate the key elements of the EU-WFD.
Uncertainties in Water Resources Management (WRM)(a) What are the causes of uncertainties in WRM?(b) What is the relationship between uncertainties and risk?(c) Describe at least four different types of uncertainties in WRM.
Environmental Risk Assessment (ERA) and Environmental RiskManagement (ERM)(a) What is the difference between ERA and ERM?(b) Describe at least four steps necessary to achieve ERA.(c) Describe at least five steps necessary to achieve ERM.
1.7 Questions and Problems – Chapter 1 j29