1 © Visteon Corporation GB-Mod #8 Rev 3.6 10/03 Measure Phase GB Mod #8.
114
1 © Visteon Corporation GB-Mod #8 Rev 3.6 10/03 Measure Phase GB Mod #8
-
Upload
ursula-shaw -
Category
Documents
-
view
225 -
download
6
Transcript of 1 © Visteon Corporation GB-Mod #8 Rev 3.6 10/03 Measure Phase GB Mod #8.

1© Visteon Corporation GB-Mod #8 Rev 3.6 10/03
Measure Phase
GB Mod #8

2© Visteon Corporation GB-Mod #8 Rev 3.6 10/03
Continuous Improvement Road Map
Improve
Control
• Define CTQ• Determine Current State
• Determine Key Input / Output Variables
• Perform MSA• Calculate initial process
capabilities
Measure
• Verify Effects of Key inputs with DOE’s
• Determine Optimum Settings
• Update Control Plan• Verify Improvements
Analyze• Evaluate Existing Control Plan• Using statistical methods to determine potential key inputs• Prioritize key input variables
N
Define

3© Visteon Corporation GB-Mod #8 Rev 3.6 10/03
Measurement Phase
• Plan the Project • Identify Key Input and Output Variables
(KPIVs & KPOVs)• Confirm Measurement Systems• Determine Initial Process Capabilities

4© Visteon Corporation GB-Mod #8 Rev 3.6 10/03
Measure - Toolbox
• Process Mapping• MSA / GR&R• Capability Analysis
Cpk (Continuous) DPMO (Attribute)

5© Visteon Corporation GB-Mod #8 Rev 3.6 10/03
Section Objectives
• Gain an understanding of the different data types Variable Attribute
• Capable of mapping a process showing process inputs and outputs
• Understand the basics behind measurement system error
• Understand the concepts behind capability metrics

6© Visteon Corporation GB-Mod #8 Rev 3.6 10/03
Process Mapping

7© Visteon Corporation GB-Mod #8 Rev 3.6 10/03
Suppliers Business CustomersBlock DiagramsSparse detail
Input-OutputDiagrams
Detailed …
...Increasingly detailed through
decomposition
ProcessFlowchartingGreat detail
Process Mapping – Levels of detail

8© Visteon Corporation GB-Mod #8 Rev 3.6 10/03
Detailed Process Mapping
• A tool which provides a structured approach to creating the Y=f(x) relationship.
• Utilizes structured 7 step method.• It’s a Team Effort - One person does not
know all the process In a plant project:
Manufacturing Engineers Line Operators Line Supervisors Maintenance Technicians

9© Visteon Corporation GB-Mod #8 Rev 3.6 10/03
Detailed Process Mapping
• Inputs to Detailed Mapping: Brainstorming Walking the floor Operator Manuals Engineering Specifications Operator Experience PEMME (People, Equipment, Methods, Material,
Environment)

10© Visteon Corporation GB-Mod #8 Rev 3.6 10/03
Detailed Process Mapping - Step 1
1) Define the scope of the process the team needs to focus on. The scope of the process needs to be at an actionable level. Are all the steps below documented at an actionable level?
Prepare Reactor Oxidize Stabilize Finish
Charge melted wax Put in set points Put in set points Check nozzle typeBring to reaction temp Sample hourly Slowly reduce press Put in set points
Monitor acid number Monitor temp Monitor appearance
DPU = 0.05 DPU = 0.02 DPU = 0.01 DPU = 0.11CT = 45 sec CT = 30 sec CT = 5 sec CT = 21 secCOPQ = ? COPQ = ? COPQ = ? COPQ = ?

11© Visteon Corporation GB-Mod #8 Rev 3.6 10/03
Detailed Process Mapping - Step 2
2) Document all tasks or operations needed in the production of a “good” product or service (include; defect data, cycle time, costs, etc. at each step if available). Additionally, all inspection, rework, transportation steps should be identified.
Prepare Reactor Oxidize Stabilize Finish
Charge melted wax Put in set points Put in set points Check nozzle typeBring to reaction temp Sample hourly Slowly reduce press Put in set points
Monitor acid number Monitor temp Monitor appearance
DPU = 0.05 DPU = 0.02 DPU = 0.01 DPU = 0.11CT = 45 sec CT = 30 sec CT = 5 sec CT = 21 secCOPQ = ? COPQ = ? COPQ = ? COPQ = ?

12© Visteon Corporation GB-Mod #8 Rev 3.6 10/03
Prepare Reactor Oxidize Stabilize Finish
Charge melted wax Put in set points Put in set points Check nozzle typeBring to reaction temp Sample hourly Slowly reduce press Put in set points
Monitor acid number Monitor temp Monitor appearance
DPU = 0.05 DPU = 0.02 DPU = 0.01 DPU = 0.11CT = 45 sec CT = 30 sec CT = 5 sec CT = 21 secCOPQ = ? COPQ = ? COPQ = ? COPQ = ?
Detailed Process Mapping - Step 3
3) Document each task or operation above as value add or non value add. Value add: Is recognized by the customer Changes the product Is required by law, regulation, the contract, or for
health, safety, & environmental considerations
NVAVA VA NVA

13© Visteon Corporation GB-Mod #8 Rev 3.6 10/03
4) List both internal and external Y's at each process step.
Internal Y’s are outputs that are critical for the next operation.
External Y’s are outputs identified as critical by the customer.
Detailed Process Mapping - Step 4
Output
Prep timePrepare Reactor Acid number
ViscosityCharge melted wax Reactor temp
Bring to reaction temp Temp profileHT coeff
Oxid timeOxidize Acid number
ColorPut in set points ViscositySample hourly Reactor temp
Monitor acid number Temp profile
Offgas flowOffgas compHT coeffResp time
Output
Stab timeStabilize Acid number
ColorPut in set points Viscosity
Slowly reduce press Reactor temp
Monitor temp Temp profileOffgas flowOffgas compHT coeff
Finish timeFinish Acid number
ColorCheck nozzle type ViscosityPut in set points Drop Point
Monitor appearance HardnessPellet appearance
1
2
3
4

14© Visteon Corporation GB-Mod #8 Rev 3.6 10/03
Identifying the ‘Y’s• What condition do we want to see the product in
when it leaves this process step?• What critical dimensions need to be satisfied
before moving to the next step?• What critical characteristics or features must be
satisfied?• Are these important for the next process step
(internal customer) or are they critical for the external customer?
Detailed Process Mapping - Step 4

15© Visteon Corporation GB-Mod #8 Rev 3.6 10/03
Detailed Process Mapping - Step 5
5) List both internal and external X's at each process step.External inputs are critical characteristics identified from raw material.
Internal inputs are variables within the process itself.
Input
Agit speedTemperaturePressureAir flow% O2 in air
Air temp
Belt speedBelt tempFlow rateNozzle typeHole sizeRoom tempAgit speedTank temp
Output
Stab timeStabilize Acid number
ColorPut in set points Viscosity
Slowly reduce press Reactor tempMonitor temp Temp profile
Off gas flowOff gas compHT coeff
Finish timeFinish Acid number
ColorCheck nozzle type Viscosity
Put in set points Drop PointMonitor appearance Hardness
Pellet appear
Output
Prep timePrepare ReactorAcid numberViscosityCharge melted waxReactor tempBring to reaction tempTemp profileHT coeff
Oxid timeOxidize Acid number
ColorPut in set points ViscositySample hourly Reactor temp
Monitor acid number Temp profile
Offgas flow
Input
Wax gradeAmt waxCharge rateAgit speedRxn tempPressureAir flow% O2 in air
ViscosityWax temp
AN targetAgit speed *Temperature *Pressure *Air flow *% O2 in air
Air tempAir humidity Offgas comp
HT coeffResp time

16© Visteon Corporation GB-Mod #8 Rev 3.6 10/03
Identifying the ‘X’s• What inputs/factors/variables in this process step
may have an effect on the Y’s identified?• What factors may prevent from successfully
achieving the Y’s identified?• Use the brainstorming techniques and the
PEMME categories to fully explore the range of potential inputs.
Detailed Process Mapping - Step 5

17© Visteon Corporation GB-Mod #8 Rev 3.6 10/03
Detailed Process Mapping - Step 6
6) Classify all X's as one or more of the following:- Controllable (C): these are inputs that you can adjust or
control while the process is running (i.e...., speed, feed rate, temperature, pressure, etc)
- Standard Operating Procedures (SOP): common sense items that one should execute because it makes sense. The goal here is to ensure that we document the true procedure (i.e...., cleaning, safety, loading of components, setup, etc)
- Noise (N): things you cannot control due to cost or difficulty (ambient temperature or humidity, operator training).

18© Visteon Corporation GB-Mod #8 Rev 3.6 10/03
Detailed Process Mapping - Step 6
Input Type Output
Agit speed Contr Stab time
Temperature ContrStabilize
Acid number
Pressure Contr Color
Air flow ContrPut in set points
Viscosity
% O2 in air NoiseSlowly reduce press
Reactor temp
Air temp ContrMonitor temp
Temp profile
Off gas flow
Off gas comp
HT coeff
Belt speed Contr Finish time
Belt temp ContrFinish
Acid number
Flow rate Contr Color
Nozzle type ContrCheck nozzle type
Viscosity
Hole size ContrPut in set points
Drop Point
Room temp NoiseMonitor appearance
Hardness
Agit speed Contr Pellet appear
Tank temp Contr
Input Type Output
Wax grade ContrPrep timeAmt wax Contr Prepare ReactorAcid numberCharge rate ContrViscosityAgit speed Contr Charge melted waxReactor tempRxn temp Contr Bring to reaction tempTemp profilePressure ContrHT coeffAir flow Contr
% O2 in air Noise
Viscosity Noise
Wax temp Noise
AN target Contr Oxid time
Agit speed * Contr Oxidize Acid number
Temperature * Contr Color
Pressure * Contr Put in set points Viscosity
Air flow * Contr Sample hourly Reactor temp
% O2 in air Noise Monitor acid number Temp profile
Air temp Contr Offgas flow
Air humidity Noise Offgas comp
HT coeff
Resp time
19© Visteon Corporation GB-Mod #8 Rev 3.6 10/03
Detailed Process Mapping - Step 7
7) Identify where you currently are collecting data and also identify where you may need to collect data. These areas can be called Tally Points
Tally Point 1 Tally Point 2
Output
Prep timePrepare ReactorAcid numberViscosityCharge melted waxReactor tempBring to reaction tempTemp profileHT coeff
Oxid timeOxidize Acid number
ColorPut in set points ViscositySample hourly Reactor temp
Monitor acid number Temp profile
Offgas flow
Input
Wax gradeAmt waxCharge rateAgit speedRxn tempPressureAir flow% O2 in air
ViscosityWax temp
AN targetAgit speed *Temperature *Pressure *Air flow *% O2 in air
Air tempAir humidity Offgas comp
HT coeffResp time
Input
Agit speedTemperaturePressureAir flow% O2 in air
Air temp
Belt speedBelt tempFlow rateNozzle typeHole sizeRoom tempAgit speedTank temp
Output
Stab timeStabilize Acid number
ColorPut in set points Viscosity
Slowly reduce press Reactor tempMonitor temp Temp profile
Off gas flowOff gas compHT coeff
Finish timeFinish Acid number
ColorCheck nozzle type Viscosity
Put in set points Drop PointMonitor appearance Hardness
Pellet appear

20© Visteon Corporation GB-Mod #8 Rev 3.6 10/03
Process Map Example – CAB Brazing
InputControllable or
Noise?M'ment System
Spec Process OutputM'ment System
Spec
Belt speed through fluxer C Tachometer As per condensor 2-tier.
Nozzle diameter (blockages) C
Flowrate? Back
pressure? Diameter?
Dependent on measurement system.
Correct external flux application (quantity)
None None
Flow rate of aqueous flux C Flow meter TBDUniform distribution of aqueous flux
Visual No dry segments
on core
Nozzle alignment/orientation CAngle,
spacing measurement
Current setting? Minimum flux on internal fin Visual No flux inside core
Flux purity C Visual No foreign bodies. Correct belt position Visual TBDCore position (across width) C Tape-measure TBDPresence of flux covers C Visual All headers covered.Flux Concentration in solution C By weight Target?
Belt speed through furnace C Tachometer As per condensor 2-tier.Sufficient clad flow (no leakers)
Leak test <3cc/min
Loading density (mass loading) C Count models Definition required. OK Silicon diffusion/erosion Lab check ?
Temperature profile (Set points) C Thermocouple As per control plan. No underbrazeInternal braze
check?
Oxygen levels N None <400 PPM No oxidation VisualNo core
discolouration
Nitrogen levels (flow rate) C Flow meterCurrent setting (paint
mark)Dimensional conformance to spec
Vernier As per drawing
Nitrogen purity C ? ? Good internal braze Visual>70% per tube &
no bridgingHumidity - Dew point N None <400 PPM No discolouration Visual ?
Core position (across width) C Tape-measure TBD No damage VisualAcceptance Standards
Adequate external fin adhesion
Visual >70% per tube??
Flux Application
Furnace

21© Visteon Corporation GB-Mod #8 Rev 3.6 10/03
Exercise

22© Visteon Corporation GB-Mod #8 Rev 3.6 10/03
Example!
• Pick an actual process from within the plant• Create a Process Map for that Process
This can be a manufacturing or transactional process
For ExampleFloat Bracket CuttingVinyl LayupBilling ProcessWork order creation

23© Visteon Corporation GB-Mod #8 Rev 3.6 10/03
Yet another Example!
• Break up into your catapult teams. • Create a process map of the launching
activities• Be sure to identify the key inputs and outputs• Be prepared to report back to the class.

24© Visteon Corporation GB-Mod #8 Rev 3.6 10/03
Expanding the Detailed Process Map
InputMeas. Sys.
Spec TypeMajor Step
Sub-Step OutputMeas. Sys.
Spec.Cp/ Cpk
X's Process Steps Y's
• Measurement System How this input or output is measured?
• Specification USL, Target, LSL
• Type Controllable, Noise, SOP, Material
Notice how much information you have about the process in a very simple format!

25© Visteon Corporation GB-Mod #8 Rev 3.6 10/03
Example of Detailed Map
Input Meas. Sys. Spec Type Major Step Sub-Step OutputMeas. Sys.
Spec.Cp/ Cpk
Prepare Production
BatchTank Temp
Thermocoup 300-310 Cont Set Tank
TempSoftening
PointLab Test
118 125 1.6/1.2
Agit. RPM
Tachometer 275-300 Cont Agitate ViscosityLab Test
55 75 1.0/0.6
PenetrationLab Test
15 20 1.2/.8
KPIV's Process Steps KPOV's
This can be created easily in Excel

26© Visteon Corporation GB-Mod #8 Rev 3.6 10/03
Uses for the Detailed Process Map
• You must have an accurate map which represents the actual process. It provides critical input to: Input to Cause and Effects Matrix Input to initial assessment of factors (x’s). Input to evaluation of process outputs. Foundation for the Measure Phase
• The detailed process map should be updated as suspected factors are eliminated and as new factors come to light during the project.

27© Visteon Corporation GB-Mod #8 Rev 3.6 10/03
Next Steps
Detailed Process Map
Cause and Effects Matrix
1 2 3 4 5 6 7 8 9 10 11
Process Step Process Inputs Hea
vies
in
Pro
duct
Ligh
ts in
P
rodu
ct
Moi
stur
e in
P
rodu
ct
Aci
dity
in
Pro
duct
Low
Cap
acity
Fr
om U
nit
Exc
essi
ve
Dow
ntim
e
Mat
eria
l Lo
sses
Cor
rosi
on o
f E
quip
men
t
Poo
r Rea
ctor
P
erfo
rman
ce
Total
139 Day Tanks Analysis 10 10 9 9 3359 Reactor Cat./HF Ratio 5 8 7 1577 Reactor Rxr Temperature 6 5 4 7 149
73 Lights Removal Condenser Leak 4 8 2 4 1 14874 Lights Removal Reboiler Leak 4 8 2 4 1 148
131 Purification Low Stages 8 8 144144 Final Storage Containers 3 2 6 6 140100 Neutralization pH Value 6 6 3 13816 Catalyst Stripper Pluggage 3 6 5 3 137
111 Drying Decomposition 2 6 3 2 2 13439 Drier Water Carryover 4 6 5 1 13234 Drier Molecular Sieve 3 3 2 7 2 125
OUTPUTS
INP
UT
S
Input Type Output
Agit speed Contr Stab timeTemperature Contr Stabilize Acid numberPressure Contr ColorAir flow Contr Put in setpoints Viscosity% O2 in air Noise Slowly reduce press Reactor temp
Air temp Contr Monitor temp Temp profileOffgas flowOffgas compHT coeff
Belt speed Contr Finish timeBelt temp Contr Finish Acid numberFlow rate Contr ColorNozzle type SOP Check nozzle type ViscosityHole size Contr Put in setpoints Drop PointRoom temp Noise Monitor appearance HardnessAgit speed Contr Pellet appearTank temp Contr
Input Type Output
Wax grade SOP Prep timeAmt wax Contr Prepare Reactor Acid numberCharge rate Contr ViscosityAgit speed Contr Charge melted wax Reactor tempRxn temp Contr Bring to reaction temp Temp profilePressure Contr HT coeffAir flow Contr% O2 in air Noise
Viscosity NoiseWax temp Noise
AN target SOP Oxid timeAgit speed * Contr Oxidize Acid numberTemperature * Contr ColorPressure * Contr Put in setpoints ViscosityAir flow * Contr Sample hourly Reactor temp% O2 in air Noise Monitor acid number Temp profile
Air temp Contr Offgas flowAir humidity Noise Offgas comp
HT coeffResp time

28© Visteon Corporation GB-Mod #8 Rev 3.6 10/03
Types of Data

29© Visteon Corporation GB-Mod #8 Rev 3.6 10/03
What do you want to know?
Information Sources:
• Words (A to Z)
• Pictorial
• Verbal
• Numeric (0-9)
1) What do you want to know?
2) How do you want to see what it is thatyou need to know?
3) What type of tool will generate what itis that you need to see?
4) What type of data is required of theselected tool ?
5) Where can you get the required typeof data?
CriticalQuestions
Plan
Execute
“Data does not provide information – You have to torture data for it to give information. And the instrument of torture is statistics”. Dr. Mikel Harry.
Grouping Measurement
Discrete Continuous
Nominal Ordinal
Interval Ratio

30© Visteon Corporation GB-Mod #8 Rev 3.6 10/03
Discrete Vs. Continuous Data
FAIL PASS
Electrical Circuit
DISCRETE
NO-GO GO
QTY UNIT DESCRIPTION TOTAL
1 $10.00 $10.00
3 $1.50 $4.50
10 $10.00 $10.00
2 $5.00 $10.00
SHIPPING ORDER
ERROR
$
TEMPERATURE
Thermometer
Time
CONTINUOUS
Caliper
$

31© Visteon Corporation GB-Mod #8 Rev 3.6 10/03
Example
• Breakout into your groups• Create a list of various types of data that is
collected in your areas and categorize it accordingly (Continuous or Discrete)
• Be prepared to present your findings to the class

32© Visteon Corporation GB-Mod #8 Rev 3.6 10/03
Continuous
Discrete $ $
SparseInformation
Rich WithInformation
The Advantage of Continuous Data
• To obtain the same level of understanding regarding a process

33© Visteon Corporation GB-Mod #8 Rev 3.6 10/03
Nominal: unrelated categories which represent membership or non-membership.
Ordinal: ordered categories with no information about distance between categories.
Interval: ordered categories with equal distance between categories, but no absolute zero point.
Ratio: ordered categories with equal distance between categories with an absolute zero point.
• Discrete data (usually)• Grouping / sorting’• Yes / no, pass / fail• Arithmetic not possible
• Discrete data• Ranking• Seldom used• Very little arithmetic possible
• Continuous data• Most common scale• Use arithmetic with caution
• Continuous data• Proportional relationship• Most forms of arithmetic apply
• Categories• Labels
• 1st, 2nd, 3rd
• Relative height• Alphabetic order• 1<2<3<4
• Temperature scales• Dial indicator
• Velocity = distance/time• Ruler
Categories of scale Description Examples
Categories of Scales

34© Visteon Corporation GB-Mod #8 Rev 3.6 10/03
Equipment Application
Environment Materials
Poor paintadhesion
Application form
Select one from each group
Nationality
Marital status
Occupation
List of Field Reps
Access to a digital camera
Without access to a digital camera
Fred W.
Bill S.
John D.
Sam C.
Bob T.
Jim C.
Joe W.
Diane A.
Nominal Scale• Nominal scales of measure are used to classify elements into categories without
considering any specific property.
• Examples of nominal scales include “causes” on fish bone diagrams, yes / no, pass / fail, etc.
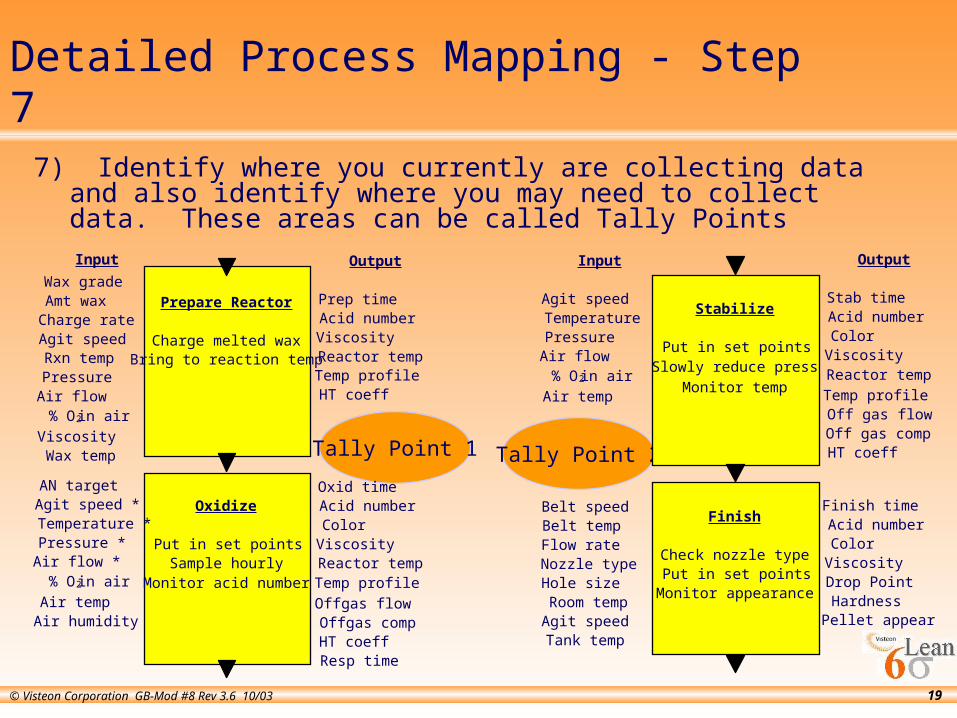
35© Visteon Corporation GB-Mod #8 Rev 3.6 10/03
Example 1: Pareto Chart - Paint Adhesion Test
Rel
ativ
e S
ize
Pre
para
tion
Ordinal Scale
Prim
erT
ype
Pai
ntT
ype
App
licat
ion
Hum
idity
Ope
rato
r
Order ofimportance
Example 2: Customer Survey
Question: How would yourate our service?
Excellent
Very Good
Good
Fair
Poor
Ordinal Scale
• Ordinal scales of measure are used to order or rank nominal (pass / fail) data based on a specific property.
• Examples of ordinal scales include relative height, Pareto charts, customer satisfaction surveys, etc.

36© Visteon Corporation GB-Mod #8 Rev 3.6 10/03
Types of Questions for Questionnaires
• Strongly agree
• Somewhat agree
• Neither agree or disagree
• Somewhat disagree
• Strongly disagree
• Somewhat less than expected
• Much less than expected
• One of the best of all
• Better than most
• About the same as most
• Worse than many
• One of the worst of all
• Much better than expected
• Somewhat better than expected
• As expected
Likert Scale (Ordinal)
• Example Rating Scale Ranges Five-point school grading system (A B C D E) Seven-point numerical rating (1 2 3 4 5 6 7) Verbal scale (excellent, good, average, fair, poor)

37© Visteon Corporation GB-Mod #8 Rev 3.6 10/03
Interval and Ratio Scale
Examples of interval scale:(no absolute zero)
1. Displaced Scale
50
40
30
20
10
0
3. Relative Velocity
Examples of Ratio Scale(absolute zero)
1. Ruler
100908070605040302010
02. Position Vs Timeat Constant Speed
3. Weight As a Function of Number of Bricks
0
0.10
0.20
2. Dial Gage
Gageblock
• Interval scales of measure are used to express numerical information on a scale with equal distance between categories, but no absolute zero. a dial gage sitting on top of a gage block, comparison of differences, etc.
• Ratio scales of measure are used to express numerical information on a scale with equal distance between categories, but with an absolute zero in the range of measurement. a tape measure, ruler, position Vs time at constant speed, etc.

38© Visteon Corporation GB-Mod #8 Rev 3.6 10/03
Discrete (Attribute) Continuous (Variable)
Continuous
(Variable)
Discrete
(Attribute)
Outputs
Inp
uts
Chi-square Analysis of Variance
Discriminate Analysis
Logistic regression
Correlation
Multiple Regression
Selecting Statistical Techniques
• There are statistical techniques to cover all combinations of data types.
These are some of the statistical techniques that you will use to drive Process Improvement

39© Visteon Corporation GB-Mod #8 Rev 3.6 10/03
Example
• Break back into your small groups• Brainstorm ways to transform the discrete
data you identified into continuous data• Be prepared to present your findings to the
group

40© Visteon Corporation GB-Mod #8 Rev 3.6 10/03
Measurement Systems Evaluation

41© Visteon Corporation GB-Mod #8 Rev 3.6 10/03
Variable Gage R&R
• The ideal measurement system will produce “true” measurements every time it is used (Zero Bias, Zero Variance).
• The study of measurement systems will provide information as to the % of variation in your process data which comes from error in the measurement.
• It is also a great tool for comparing two or more measurement devices or two or more operators against one another.
• MSA should be used as part of the criteria required to accept and release a new piece of measurement equipment to manufacturing.
• It should be the basis for evaluating a measurement system which is suspect of being deficient.

42© Visteon Corporation GB-Mod #8 Rev 3.6 10/03
Long-term
Process Variation
Short-term
Process Variation
Variation
w/in sample
Actual Process Variation
Repeatability Calibration Stability Linearity
Variation due
to instrument
Variation due
to operators
Measurement Variation
Observed Process Variation
To address actual process variability, the variation due to the measurement system must first be
identified and separated from that of the process
To address actual process variability, the variation due to the measurement system must first be
identified and separated from that of the process
Possible Sources of Process Variation

43© Visteon Corporation GB-Mod #8 Rev 3.6 10/03
Possible Sources of Process Variation
We will look at “repeatability” and “reproducibility” since these are the primary contributors to measurement errorWe will look at “repeatability” and “reproducibility” since these are the primary contributors to measurement error
Long-term
Process Variation
Short-term
Process Variation
Variation
w/in sample
Actual Process Variation
Stability Linearity
Variation due
Measurement Variation
Observed Process Variation
Repeatability
Variation due
to operatorsto instrument
Calibration

44© Visteon Corporation GB-Mod #8 Rev 3.6 10/03
AveragesAverages
VariabilityVariability
222measurementproducttotal +=
total product measurement
Measurement System Bias -Determined through “Calibration Study”
Measurement System Variability - Determined through “R&R Study”
AccuracyAccuracy
PrecisionPrecision
Precision Vs. Accuracy

45© Visteon Corporation GB-Mod #8 Rev 3.6 10/03
Basic Model
Observed variability = product variability + measurement variability
Measurement System Bias: assessed via the “calibration program”:
(accuracy)
Measurement System Variability: assessed via the “variable R&R study”:
(precision)
Observed value = master value + measurement offsetmeasurement systemproducttotal
True values
Measured values
measurement offset
2
22measurement system producttotal
True values
Measured values

46© Visteon Corporation GB-Mod #8 Rev 3.6 10/03
'Measurement Variation'
Humidity
Cleanliness
Vibration
Line Voltage Variation
Temperature Fluctuation
Operator Technique
Standard Procedures
Sufficient Work Time
Maintenance Standard
Calibration Frequency
Operator Training
Ease of Data Entry
Algorithm Instabilty
Electrical Instability
Wear
Mechanical instability
Tool
Environment
Work Methods
Sources of Measurement Variation

47© Visteon Corporation GB-Mod #8 Rev 3.6 10/03
Knowledge to be obtained
• How big is the measurement error?• What are the sources of measurement error?• Is the tool stable over time?• Is the tool capable for this study?• How do we improve the measurement
system?

48© Visteon Corporation GB-Mod #8 Rev 3.6 10/03
Product Variability
(Actual variability)
Product Variability
(Actual variability)
MeasurementVariability
MeasurementVariability
Total Variability(Observed variability)
Total Variability(Observed variability)
2
22Measurement systemproducttotal +=
2 2 2 2total product repeatability reproducibility= + +
Sources of Variation

49© Visteon Corporation GB-Mod #8 Rev 3.6 10/03
Terminology
• Accuracy related terms True value Bias
• Precision related terms Repeatability Reproducibility
• Linearity• Discrimination• Stability (over time)• Correlation

50© Visteon Corporation GB-Mod #8 Rev 3.6 10/03
Accuracy
• Accuracy - Extent to which the average of the measurements deviate from the true value True value
Theoretically correct valueNIST standards
BiasDistance between average value of all measurements
and true valueAmount tool is consistently off targetSystematic error or offset

51© Visteon Corporation GB-Mod #8 Rev 3.6 10/03
Master Value(Reference Standard)
AverageValue
Accuracy
• Accuracy: The difference between the observed average value of measurements and the master value. The master value is an accepted, traceable reference standard (e.g., NIST).
Measurement systemproducttotal +=

52© Visteon Corporation GB-Mod #8 Rev 3.6 10/03
Instrument 2Instrument 1
Master Value(Reference Standard)
AverageValue
Accuracy
• Bias: average of measurements are different by a fixed amount, effects include: Operator bias - different operators get detectably different
averages for the same measurements on the same part Machine bias - different machines get detectably different
averages for the same measurements on the same parts

53© Visteon Corporation GB-Mod #8 Rev 3.6 10/03
Precision
• Total variation in the measurement system• Measure of natural variation of repeated
measurements• Terms: Random error, spread, test / retest
error• Repeatability and Reproducibility
2 2 2 2total product repeatability reproducibility

54© Visteon Corporation GB-Mod #8 Rev 3.6 10/03
Precision
• Repeatability: The inherent variability of the measurement device• Variation that occurs when repeated measurements are made of the
same variable under similar conditions Same part Same operator Same set-up Same units Same environmental conditions Short-term
• Estimated by the pooled (average) standard deviation of the distribution of repeated measurements
• Repeatability is usually less than the total variation of the measurement system
2 2 2 2total product repeatability reproducibility

55© Visteon Corporation GB-Mod #8 Rev 3.6 10/03
Master Value
Good Repeatability Poor Repeatability
2 2 2 2total product repeatability reproducibility
Precision
• Repeatability: the variation between successive measurements of the same part, same characteristic, by the same person using the same instrument. Also known as test - retest error; used as an estimate of short-term measurement variation.

56© Visteon Corporation GB-Mod #8 Rev 3.6 10/03
2 2 2 2total product repeatability reproducibility
Precision
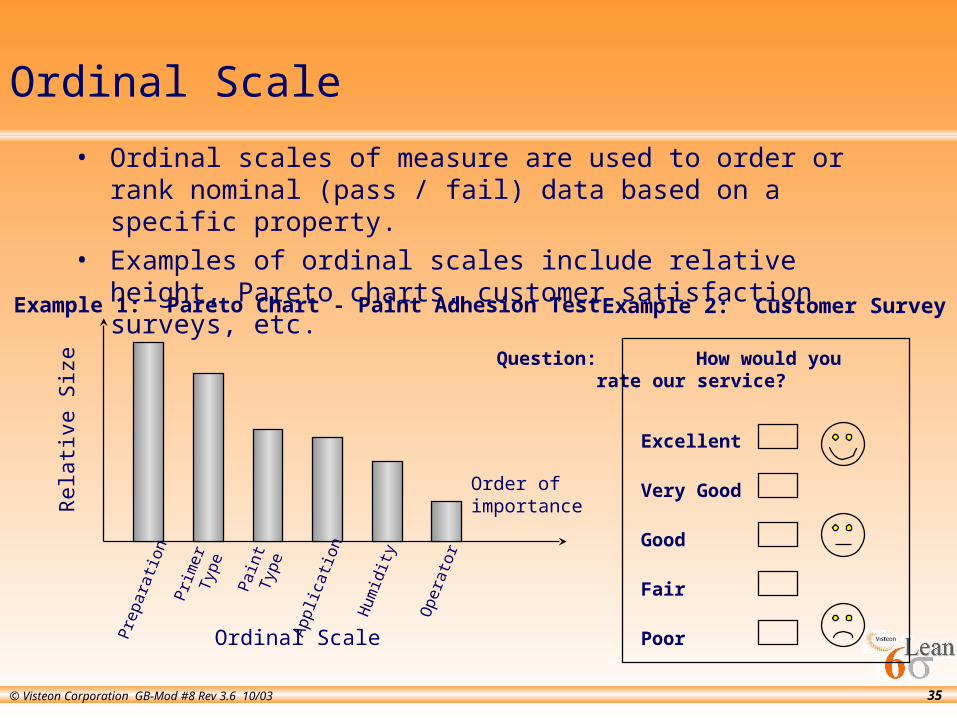
• Reproducibility: The variation that results when different conditions are used to make the same measurements Different operators Different set-ups Different test units Different environmental conditions Long-term measurement variation
• Estimated by the standard deviation of the averages of measurements from different measurement conditions
57© Visteon Corporation GB-Mod #8 Rev 3.6 10/03
Inspector A
Master Value
Inspector B
Inspector C
Inspector A
Inspector B
Inspector C
Precision
• Reproducibility: The difference in the average of the measurements made by different persons using the same or different instrument when measuring the identical characteristic on the same part

58© Visteon Corporation GB-Mod #8 Rev 3.6 10/03
Example: Accuracy Vs. Precision
• Suppose we have a reference material with a ‘true’ hardness of 5.0.
• Method 1 gives the following readings:3.8, 4.4, 4.2, 4.0
• Method 2 gives the following readings:6.5, 4.0, 3.2, 6.3
• Which method is more accurate?• Which method is more precise?• Which method do you prefer? Why?• Report out by groups (flip charts)

59© Visteon Corporation GB-Mod #8 Rev 3.6 10/03
O
Accuracy
Gage 1: Linearity is an issue here
Measurement Units
Accuracy
Gage 2: Linearity is NOT an issue here
Measurement Units
Linearity
• Linearity: A measure of the difference in Accuracy or Precision over the range of instrument capability.
O
Y axis is deviation from master reading. When gage agrees with master, plotted point will be on 0. X axis is full range of product values that gage is to be used over.

60© Visteon Corporation GB-Mod #8 Rev 3.6 10/03
1 2 3 4 5
Good Discrimination
1 2 3 4 5
Poor Discrimination
Discrimination
• The number of decimal places that can be measured by the system. Increments of measure should be at least one-tenth of the width of the product specification or process variation.

61© Visteon Corporation GB-Mod #8 Rev 3.6 10/03
Stability
• The distribution of measurements remains constant and predictable over time for both mean and standard deviation
• No drifts, sudden shifts, cycles, etc...• Evaluated using a trend chart• Ensured through a regular calibration and
R&R program

62© Visteon Corporation GB-Mod #8 Rev 3.6 10/03
Master Value(Reference Standard)
Time 2
Time 1
Stability
• Evaluation of the difference in accuracy or precision over time.

63© Visteon Corporation GB-Mod #8 Rev 3.6 10/03
Method 1
Correlation Example:
OffsetMeth
od
2
Correlation Example:
No Offset
Method 1
Meth
od
2
Correlation Example:
No Correlation
Method 1
Meth
od
2
Correlation
• A measure of linear association between two variables, e.g. two different measurement methods or two different laboratories.

64© Visteon Corporation GB-Mod #8 Rev 3.6 10/03
• Measurement System Variance: Primary output of analytical Gage R&R To determine whether the measurement system is “good”
or “bad” for a certain application, you need to compare the measurement variation to the product/process variation
• Comparing with Tolerance: Precision-to-Tolerance Ratio (P/T)
• Comparing with Product/Process Variation (P/TV): % Repeatability and Reproducibility (%R&R) Signal-to-Noise Ratio (S/N) Discrimination Index
MS
MS
222rpdrptMS
Measurement System Metrics

65© Visteon Corporation GB-Mod #8 Rev 3.6 10/03
P/T and P/TV
“P to TV” is used to qualify a measurement system as capable of measuring to the total observed process variation:
“P to T” is used to qualify a measurement system as capable of measuring to a given product specification:
2 2 2 2total product repeatability reproducibility= + +
2 *15.5 Measurement system (MS)=SystemMeasurement of Precision
True values
Measured values
Note: 99% of the curve will be
within 5.15 ’s.
total
MS
total
MSTVP
*15.5
*15.5
*15.5
*15.5/
2
2
==
LSLUSLLSLUSLTP MSMS
-=
-=
*15.5*15.5/
2
LSL USL
Question: When will P/TV and P/T be the same?

66© Visteon Corporation GB-Mod #8 Rev 3.6 10/03
• Precision to Tolerance Ratio
• Addresses what percent of the Tolerance is taken up by measurement error.
• Best case: < 10% Acceptable: < 30%• Includes both repeatability and reproducibility
P TTolerance
MS/. *
=515
Tolerance = USL - LSL
Measurement Capability Index

67© Visteon Corporation GB-Mod #8 Rev 3.6 10/03
• %R&R
• Addresses what percent of the Total Variation is taken up by measurement error.
• Best case: <10% Acceptable: <30% If the R&R is less than 30% of the total sigma, the effect
is less than five percent If less than 10% of the total sigma, the effect is less than
1%• Includes both repeatability and reproducibility
Usually expressed as percent
Usually expressed as percent% &R R MS
Total
= ´ 100
Measurement Capability Index

68© Visteon Corporation GB-Mod #8 Rev 3.6 10/03
Uses of P/T and P/TV (%R&R)
• The P/T ratio is the most common estimate of measurement system precision. This estimate may be appropriate for evaluating how well the
measurement system can perform with respect to the spec. Specifications, however, may be too tight or too loose. Generally, the P/T ratio is a good estimate when the
measurement system is only used to classify production samples. Even then, if process capability (Cpk) is not adequate, the P/T ratio may give you a false sense of security.
The P/TV (%R&R) is the best measure for the Black Belt/Green Belt.
This estimates how well the measurement system performs with respect to the overall process variation.
%R&R is the best estimate when performing process improvement studies. Care must be taken to use samples representing full process range.

69© Visteon Corporation GB-Mod #8 Rev 3.6 10/03
The Method - Calculating %R&R
Step 1: Collect 10 samples that represent the full range of long-term process variation. In addition, identify the operators who use this instrument daily.
Step 2: Calibrate the gage or verify the last calibration date is valid.Step 3: Setup the Minitab data collection sheet for the R&R study.
Column headings: Part ID, Operator, Trial, Measurement(s)Calc > Make Patterned Data > Simple Set of Numbers (for each input)
Step 4: Ask the first operator to measure all the samples once in random order. Blind sampling, in which the operator does not know the identity of each part should be used to reduce human bias.
Step 5: Have the second operator measure all the samples once in random order and continue until all operators have measured the samples once (this is trial 1).
Step 6: Repeat steps 4 & 5 for the required number of trials.Step 7: Enter the data and tolerance information into Minitab.
Stat > Quality Tools > Gage R&R StudyStat > Quality Tools > Gage Run Chart
Step 8: Analyze the results by assessing the quality of the measurement system based on the guidelines on the following page. Determine follow-up actions.

70© Visteon Corporation GB-Mod #8 Rev 3.6 10/03
The Daimler-Chrysler Corporation, Ford Motor Corporation and General Motor Corporation guidelines for acceptable gage variation (based on standard deviation) as compared to total variation are given as a percent of Tolerance (% Tolerance). They are:
• Ideal 10% or less• Acceptable 10-20%• Marginal 20-30% (depends on the application)
To arrive at % Gage R&R as a percent of Tolerance, MINITAB’s ANOVA method:1. Calculates the variance component of the Gage R&R term2. Takes the square root of the variance component to get the estimated standard
deviation for the Gage R&R term.3. Multiplies 5.15 times stddev and divides by the tolerance.MiniTab presents this value at the top of an output column in the session window titled: % Tolerance.A drawback to this method of calculating percentages is that the percentages in these columns will never sum to 100%. In order to look at the true percent of variation each term is contributing to the overall variation estimate, it may be easier to look at the column titled % Contribution.
Gage R&R Study - What is Acceptable?
Copyright Minitab Inc. 1998. All rights reserved. Rel 12 (Ver 1: Rev 1)

71© Visteon Corporation GB-Mod #8 Rev 3.6 10/03
When the calculations for variation are based upon variance components, it is assumed you are comparing the variation due to the measuring system to the overall variation in the study. Because variance components are ()2, the values on page 37 (10, 20, and 30 percent) would also have to be squared (.12, .22, .32). So when you look at this column consider the rules below instead:
• Ideal 1% or less
• Acceptable 1-4%
• Marginal 4-9% (depends on the application)
While variance components are not the units used in the measurement systems reference manual, the advantage to using variance components is that the percentages will sum to 100%. The disadvantage is that you cannot compare these values to tolerance.
Gage R&R Study - What is Acceptable?
Copyright Minitab Inc. 1998. All rights reserved. Rel 12 (Ver 1: Rev 1) Minitab 12 TrainingMeasurement System Analysis

72© Visteon Corporation GB-Mod #8 Rev 3.6 10/03
Handling Poor Gage Capability:
• If a dominant source of variation is repeatability (equipment), you need to replace, repair, or otherwise adjust the equipment.
• If, in consultation with the equipment vendor or upon searches of industry literature, you find that the gage technology that you are using is “state-of-the-art” and it is performing to its specifications, you should still fix the gage. One temporary solution to this problem is to use signal averaging (see next page).
• If a dominant source of variation is operator (reproducibility), you must address this via training and definition of the standard operating procedure. You should look for differences between operators to give you some indication as to whether it is a training, skill, and/or procedure problem.
• Evaluate the specifications. Are they reasonable?• If the gage capability is marginal (as high as 30% of study variation)
and the process is operating at a high capability (Ppk greater than 2), then the gage is probably not hindering you and you can continue to use it.
73© Visteon Corporation GB-Mod #8 Rev 3.6 10/03
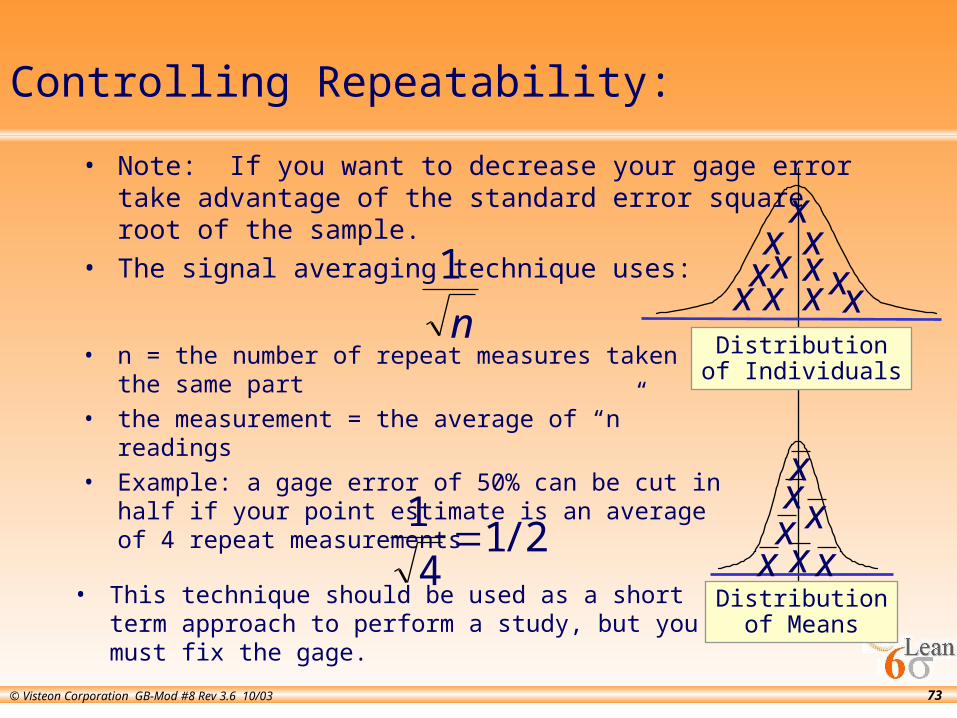
• Note: If you want to decrease your gage error take advantage of the standard error square root of the sample.
• The signal averaging technique uses:
n
1
• n = the number of repeat measures taken on the same part
• the measurement = the average of “n” readings
• Example: a gage error of 50% can be cut in half if your point estimate is an average of 4 repeat measurements
2/14
1 • This technique should be used as a short term approach to
perform a study, but you must fix the gage.
xxxx
x xx
Distributionof Means
xxxxx
xxx
xx
x
Distributionof Individuals
Controlling Repeatability:

74© Visteon Corporation GB-Mod #8 Rev 3.6 10/03
Measurement System Evaluation Questions
• Written inspection / measurement procedure?• Detailed process map developed?• Specific measuring system and set-up defined?• Trained or Certified Operators?• Instrument calibration performed in a timely manner?• Tracking Accuracy?• Tracking %R&R?• Tracking Bias?• Tracking Linearity?• Tracking Discrimination?• Correlation with supplier or customer where appropriate?

75© Visteon Corporation GB-Mod #8 Rev 3.6 10/03
Measurement System Analysis Questions
• Have you picked the right measurement system? Is this measurement system associated with either critical inputs or outputs?
• What do the precision, accuracy, tolerance, P/T ratio, %R&R and trend chart look like?
• What are the sources of variation and what is the measurement error?
• What needs to be done to improve this system?• Have we informed the right people of our results?• Who owns this measurement system?• Who owns trouble shooting?• Does this system have a control plan in place?• What’s the calibration frequency? Is that frequent enough?• Do identical systems match?

76© Visteon Corporation GB-Mod #8 Rev 3.6 10/03
Exercise!
• Break up into your catapult teams
• Using the provided data sheet, perform a Measurement system analysis on determining the length of throwing a catapult projectile
• Enter the data into either Minitab or Measurement Assurance software to get a final GR&R

77© Visteon Corporation GB-Mod #8 Rev 3.6 10/03
Attribute Terminology
• Attribute Data: Qualitative (go / no go) data that can be tallied for recording and analysis.
• Attribute Measurement System: A measurement system that compares each part to a standard and accepts the part if this standard is met.
• Screen: 100% evaluation of product using inspection techniques (an attribute measurement system).
• Screen Effectiveness: The ability of the attribute measurement system to properly discriminate good from bad.
• Customer Bias: Operator has a tendency to hold back good product.
• Producer Bias: Operator has a tendency to pass defective product.

78© Visteon Corporation GB-Mod #8 Rev 3.6 10/03
Purpose of Attribute R&R
• To assess your inspection or workmanship standards against your customer’s requirements
• To determine if inspectors across all shifts, all machines, etc… use the same criteria to determine “good” from “bad”
• To quantify the ability of inspectors to accurately repeat their inspection decisions
• To identify how well these inspectors are conforming to a “known master” which includes: how often operators decide to ship truly defective product how often operators do not ship truly acceptable product
• Discover areas where: training is needed procedures are lacking standards are not defined

79© Visteon Corporation GB-Mod #8 Rev 3.6 10/03
Attribute R&R -- The Method
Step 1 - Select a minimum of 30 parts from the process.– 50% of the parts in your study should have defects– 50% of the parts should be defect free– If possible select border line (or marginal) good and bad samples
Step 2 - Identify the Inspectors who should be qualified.Step 3 - Have each inspector, independently and in random order, assess
these parts and determine whether or not they pass or fail.Step 4 - Enter the data into the Inspection.xls spreadsheet to report the
effectiveness of the attribute measurement system. Step 5 - Document the results. Implement appropriate actions to fix the
inspection process if necessary.Step 6 - Re-run the study to verify the fix.Note: A 30 piece sample will yield an estimate of inspector efficiency and
capability which has a fair amount of uncertainty. Typically a larger sample is not needed because the inspection process is obviously ineffective. The spreadsheet can handle up to 100 samples.

80© Visteon Corporation GB-Mod #8 Rev 3.6 10/03
% APPRAISER SCORE (1) -> 100.00% 78.57% 100.00%
% SCORE VS. ATTRIBUTE (2) -> 78.57% 64.29% 71.43%
SCREEN % EFFECTIVE SCORE (3) -> 57.14%
SCREEN % EFFECTIVE SCORE vs. ATTRIBUTE (4) -> 42.86%
SCORING REPORTDATE: 3/10/96
Attribute Legend5 (used in computations) NAME: Allied Employee1 pass PRODUCT: 3313 Spark Plug All operators
2 fail BUSINESS: F&SP agree within and All Operators
between each agree with
Other standard
Known Population Y/N Y/NSample # Attribute Try #1 Try #2 Try #1 Try #2 Try #1 Try #2 Agree Agree
1 pass pass pass pass pass fail fail N N2 pass pass pass pass pass fail fail N N3 fail fail fail fail pass fail fail N N4 fail fail fail fail fail fail fail Y Y5 fail fail fail pass fail fail fail N N6 pass pass pass pass pass pass pass Y Y7 pass fail fail fail fail fail fail Y N8 pass pass pass pass pass pass pass Y Y9 fail pass pass pass pass pass pass Y N
10 fail pass pass fail fail fail fail N N11 pass pass pass pass pass pass pass Y Y12 pass pass pass pass pass pass pass Y Y13 fail fail fail fail fail fail fail Y Y14 fail fail fail pass fail fail fail N N
Operator #1 Operator #2 Operator #3
Example:

81© Visteon Corporation GB-Mod #8 Rev 3.6 10/03
% APPRAISER SCORE(1) -> 100.00% 78.57% 100.00%
% SCORE VS. ATTRIBUTE(2) -> 78.57% 64.29% 71.43%
SCREEN % EFFECTIVE SCORE(3) -> 57.14%
SCREEN % EFFECTIVE SCORE vs. ATTRIBUTE (4) -> 42.86%
Example:
(1) If % Appraiser Score is less than 100% training needs to occur, focus on specific areas
(2) % Score Vs. Attribute is an error against a known population as deemed by experts
(3) 100% is the target for Screen % Effectiveness Score(4) Screen % Effective Vs. Attribute is an error against a
known population as deemed by the experts. 100% is the target
(5) Attribute legend allows excel to use a macro to count the number of occurrences of the legend text

82© Visteon Corporation GB-Mod #8 Rev 3.6 10/03
Capability AnalysisFor
Continuous Data

83© Visteon Corporation GB-Mod #8 Rev 3.6 10/03
The Need for Capability
• Can appropriately quantify the nature of the problem the team will attack as one of the following: For quantitative data (variable output, Y):
Are the specifications correct for the parameter (Y) of interest (process or performance output variable)?
Is the location of the central tendency of the parameter (Y) centered within the appropriate specifications?
Is the process variation in the parameter greater than allowed by the specifications?
For discrete qualitative events (attribute output,Y): Is the measurement system effecting our ability to assess true
process capability? What is the allowable, internal and external, escaping defect
rate?• Assessing capability allows the organization to predict its true quality
levels for all its goods and services• This guides us to the initial estimate of a product or process sigma level

84© Visteon Corporation GB-Mod #8 Rev 3.6 10/03
Process Performance Metrics
CONTINUOUS
DATA
SHORT-
TERMCP CPK
PP PPK
DPO
DPU
PPM
YRT
DPMO
TYPE OF DATA HISTORY
OF DATA
TYPE OF METRIC
ONE
UNIVERSAL
METRIC
DISCRETE
DATA
LONG-
TERM
LONG-
TERM
DATA
Sigma
Scale

85© Visteon Corporation GB-Mod #8 Rev 3.6 10/03
Continuous MeasuresProcess Capability
Target UpperSpecLimit
LowerSpecLimit
If the product is producedinside the spec limits
it’s OK
Actual variation fromfrom the process
Process Capability compares the actual variation to the requirements for variable data

86© Visteon Corporation GB-Mod #8 Rev 3.6 10/03
Process Capability
Target UpperSpecLimit
LowerSpecLimit
Process Capability = Limits
Actual Variation

87© Visteon Corporation GB-Mod #8 Rev 3.6 10/03
Situations
TargetUpperSpecLimit
LowerSpecLimit
Off Target& Capable
TargetUpperSpecLimit
LowerSpecLimit
On Target& Capable
TargetUpperSpecLimit
LowerSpecLimit
On Target& Not Capable
TargetUpperSpecLimit
LowerSpecLimit
Off Target& Not Capable

88© Visteon Corporation GB-Mod #8 Rev 3.6 10/03
Classic Process Capability
• To fully understand the capability of a product/process we need measure on/off target, the spread in both the short and long term
Capabilitypotential
Off Target
Short Term Long Term
Cp
PpkCpk
Pp

89© Visteon Corporation GB-Mod #8 Rev 3.6 10/03
Short Term (Potential) Process Capability Cp
LowerSpec
UpperSpecTarget
Mean
Out ofSpecification
Out ofSpecification
Measures how well theactual variation
fits the specification
To calculate Cp we see how well the process variation
fits the specification Actual processvariation with mean and
standard deviation

90© Visteon Corporation GB-Mod #8 Rev 3.6 10/03
LowerSpec
UpperSpecTarget
Mean USL - LSL
6st
Cp =
USL = Upper Spec LimitLSL = Lower Spec Limitst = Short term Process standard deviation
This tells us howgood the process
could be
Short Term (Potential) Process Capability Cp

91© Visteon Corporation GB-Mod #8 Rev 3.6 10/03
If Cp = Cpk QUESTION
Sigma Level = 3Cp
Target USLLSL
Cp = 1 Sigma level = 3
33
Target USLLSL
66Cp = 2 Sigma level = 6
Cp = 1.33 Sigma level = 4
Target USLLSL
44

92© Visteon Corporation GB-Mod #8 Rev 3.6 10/03
Example
1.60 1.90Target
S Dev = 0.08
Cp =?

93© Visteon Corporation GB-Mod #8 Rev 3.6 10/03
Example
1.60 1.90Target
S Dev = 0.08
Cp =?
USL-LSL6st

94© Visteon Corporation GB-Mod #8 Rev 3.6 10/03
Example
1.60 1.90Target
S Dev = 0.08
Cp =?
1.9-1.66* 0.08
=0.625

95© Visteon Corporation GB-Mod #8 Rev 3.6 10/03
Short Term (Actual) Process Capability
LowerSpec
UpperSpecTarget
Mean
Out ofSpecification
USL -
- LSL
3st
3st
Process Capability Cpk
Cpk= Min of
This tells us in the short-term how well the process
is centred

96© Visteon Corporation GB-Mod #8 Rev 3.6 10/03
Long Term (Overall) Process Capability
LowerSpec
UpperSpecTarget
Mean
Out ofSpecification
Out ofSpecification
USL - LSL
6lt
Process Capability Pp
Pp =
USL = Upper Spec LimitLSL = Lower Spec Limitlt = Long term Process standard deviation
This tells us in the long-term how good the process could be

97© Visteon Corporation GB-Mod #8 Rev 3.6 10/03
Long Term (Overall) Process Capability
LowerSpec
UpperSpecTarget
Mean
Out ofSpecification
Process Capability Ppk
USL -
- LSL
3lt
3lt
Ppk= Min of
This tells us what the CUSTOMER
experiences in the long - term
Zlt = 3Ppk
For six sigma
Zlt = 4.5 = 3Ppk
Ppk = 1.5

98© Visteon Corporation GB-Mod #8 Rev 3.6 10/03
Summary: Variable Data PerformanceP
roce
ss R
espo
nse
Time
Short-Term Measure Cp/Cpk
Long-Term Measure Pp/Ppk
What the Customer
SeesCustomer target

99© Visteon Corporation GB-Mod #8 Rev 3.6 10/03
Short and Long Term Capability
LSL USLT LSL USLT
SHORT TERM LONG TERM
B
C
D
Cp
A
CpkPp Ppk
2.0 2.0
2.0
2.0 2.0
1.5 2.0 1.5
2.0 varies 1.0 1.0
2.0 varies 1.0 0.5

100© Visteon Corporation GB-Mod #8 Rev 3.6 10/03
Process Width
Design Width
LSL
T
- 3
Short -Term Capability Indices
termshortp
LSLUSLC
*6
termshortUSLpk
XUSLC
*3
)()(
termshortLSLpk
LSLXC
*3
)()(
) , ( min )()( LSLpkUSLpkpk CCC
USL
+ 3
Long -Term Capability Indices
termlong
USLpk XUSL
P
*3
)()(
termlongp
LSLUSLP
*6
termlongLSLpk
LSLXP
*3
)()(
) , ( min )()( LSLpkUSLpkpk PPP
Cp, Cpk, Pp, Ppk Formulas

101© Visteon Corporation GB-Mod #8 Rev 3.6 10/03
The Method – Collecting Capability Data (Short Term Capability)
Step 1: Ensure the gauge produces a good R&R % StudyStep 2: Ensure the machine is in a stable condition, by
measuring the first parts off following complete tool change
Step 3: when you are confident on stability measure the next 50 consecutive parts on the required dimension
Step 4: Collect data on checklist and observe/record any special cause interference. If interference causes a shift in measured values, stop exercise and start over again when the cause has been rectified.
Step 5: Take data to gauge room / Black belt for statistical analysis of normality and capability.

102© Visteon Corporation GB-Mod #8 Rev 3.6 10/03
Capability - Caution !
94.0894.0794.0694.0594.0494.03
USLLSL
Process Capability Analysis for Diameter of
PPM Total
PPM > USL
PPM < LSL
PPM Total
PPM > USL
PPM < LSL
PPM Total
PPM > USL
PPM < LSL
Ppk
PPL
PPU
Pp
Cpm
Cpk
CPL
CPU
Cp
StDev (Overall)
StDev (Within)
Sample N
Mean
LSL
Target
USL
2221.83
2061.99
159.84
199.72
195.40
4.31
0.00
0.00
0.00
0.96
1.20
0.96
1.08
*
1.18
1.48
1.18
1.33
0.0071127
0.0057534
70
94.0556
94.0300
*
94.0760
Exp. "Overall" PerformanceExp. "Within" PerformanceObserved PerformanceOverall Capability
Potential (Within) Capability
Process Data
Within
Overall

103© Visteon Corporation GB-Mod #8 Rev 3.6 10/03
Six Sigma Capability
3 - Sigma
6 - Sigma
And/Or

104© Visteon Corporation GB-Mod #8 Rev 3.6 10/03
Capability AnalysisFor
Discrete Data

105© Visteon Corporation GB-Mod #8 Rev 3.6 10/03
Six Sigma PerformanceDiscrete Data
• With discrete data often there are no upper and lower specification limits!
• We are often dealing with defects (pass/fail), proportion defective, yields etc
• In such cases 6-Sigma performance is concerned with Defect Per Unit (DPU) Defect Per Opportunity (DPO) Defects Per Million Opportunities (DPMO) First Pass or Final Yield (YFT)
Rolled throughput Yield (YRT)
Sigma Level

106© Visteon Corporation GB-Mod #8 Rev 3.6 10/03
Defects Per Unit (DPU)
Defects Per Unit (DPU) = Number of observed defects
Number of Units
A defect is any variation of a required characteristic whichis far enough removed from its target so as to cause
customer dissatisfaction
A unit can be:
•A component•A sub-assembly•A piece of paperwork•A line of software•A purchase order•etc

107© Visteon Corporation GB-Mod #8 Rev 3.6 10/03
DPU and Complexity
• DPU is a powerful measure but it does not take into account the complexity of the unit:
• For example a manual soldering process is known to create 2 defects per every 100 joints (each component requires 2 joints) A PCB with 100 components would have a DPU of 4 A PCB with 1000 components would have a DPU of 40
• The complexity issue can be overcome by considering the part count. In some situations this is acceptable, but what about a piece of paperwork, the complexity does not depend on part count
• To include complexity the idea of a defect opportunity can be used

108© Visteon Corporation GB-Mod #8 Rev 3.6 10/03
Defects Per Million Opportunities (DPMO)
• They key measure in Six Sigma is the idea of Defects Per Million Opportunities (DPMO)
• Its power lies in that it is universal benchmark• We count Defect opportunities: any measurable
chance a defect could occur
DPMO = defects per unit x 1,000,000
Number of opportunities
for error in one unit
• DPMO is related to sigma level

109© Visteon Corporation GB-Mod #8 Rev 3.6 10/03
Components of DPMO
• Opportunity - anything we can measure or test Active: An opportunity for a defect which is actively
tested or checked Passive: An opportunity that may exist, but is not
actively being looked for or tested
• Defect - any non-conformance Active: one that was previously identified Passive: One that has not been found yet and
may never be found
• Unit - the number units (part, systems components etc)

110© Visteon Corporation GB-Mod #8 Rev 3.6 10/03
Calculating DPMO
• Count the observed level of defects. (Occasions when customer requirements are not met.)
• Determine the number of opportunities for defects to occur within the process. The defect opportunity must be important to the
stakeholder / customer. Don’t artificially hike the number of opportunities
When calculating DPMO after improvement actions, use the same number of opportunities as before the changes.
• From the two figures calculate the DPMO (number of defects per million defect opportunities).
• When calculating DPMO we should have at least 5 defects

111© Visteon Corporation GB-Mod #8 Rev 3.6 10/03
DPMO to Sigma
• From the Six Sigma “theory” based on the Normal distribution we know that in the long term a process with a Sigma Level of 6 will produce 3.4 defects in every million
• We can use this to have a consistent measure for discrete data situations through the idea of DPMO
• Six Sigma performance = 3.4 DPMO• Tables exist to convert DPMO into sigma levels

112© Visteon Corporation GB-Mod #8 Rev 3.6 10/03
DPMO to Sigma Level Table
• The DPMO table assumes long term data are used to estimate the yield By definition we use short-term sigma level is used for
making comparisons
Sigma level
hundredths
tenths 0.00 0.01 0.02 0.03 0.04 0.05 1.5 500,000 496,000 492,000 488,000 484,000 480,100 1.6 460,200 456,200 452,200 448,300 444,300 440,400 1.7 420,700 416,800 412,900 409,000 405,200 401,300 1.8 382,100 378,300 374,500 370,700 366,900 363,200 1.9 344,600 340,900 337,200 333,600 330,000 326,400 2.0 308,500 305,000 301,500 298,100 294,600 291,200 2.1 274,300 270,900 267,800 264,300 261,100 257,800
Sigmalevel
DPMO
113© Visteon Corporation GB-Mod #8 Rev 3.6 10/03
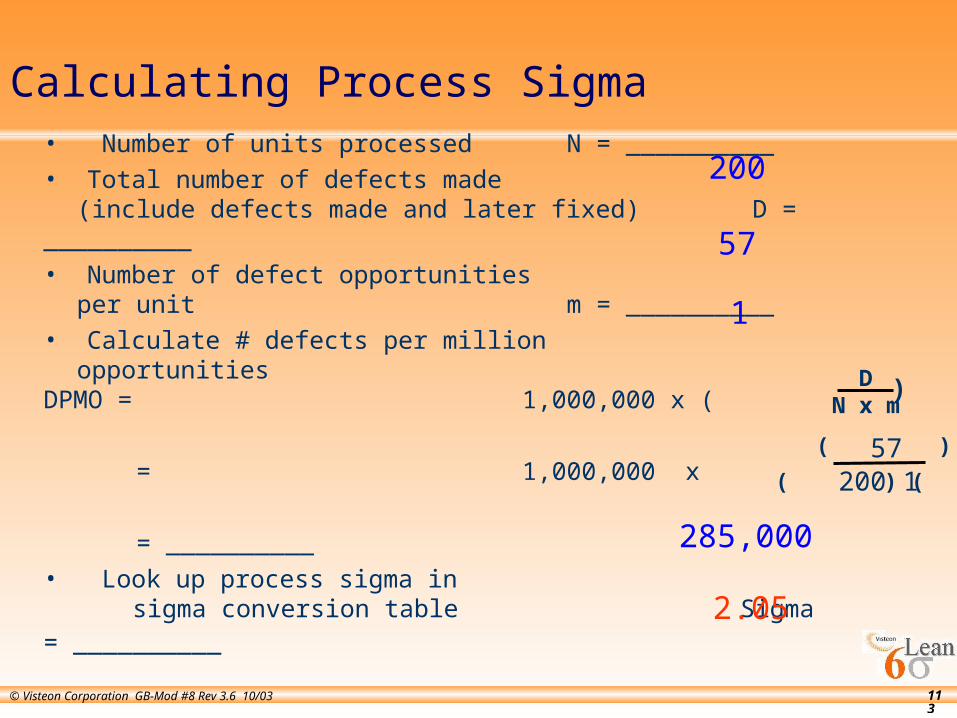
Calculating Process Sigma
• Number of units processed N = __________• Total number of defects made
(include defects made and later fixed) D = __________• Number of defect opportunities
per unit m = __________• Calculate # defects per million
opportunities DPMO = 1,000,000 x (
= 1,000,000 x
= __________• Look up process sigma in sigma conversion table Sigma = __________
200
57
1
DN x m
)
( )
( ) ( )
57200 1
285,000
2.05

114© Visteon Corporation GB-Mod #8 Rev 3.6 10/03
When starting a 6-Sigma project we need to know
where we are!!! We use the above to BASELINE
the process
6 3.4
5 233
4 6,210
3 66,807
2 308,537
99.9997
99.977
99.379
93.32
69.20
2.0
1.667
1.333
1.0
0.67
1.5
1.167
0.833
0.5
0.17
Process performance is measured by any of the below
(Defects Per Million
Opportunities)Yield %Yield % (Short term
Process Capability)
CCpp(Z) (Long termProcess
Capability)PPpkpkDPMODPMO