Domingues, Carlos Alberto - QSA Certificate (Security Metrics)

EUROPEAN COMMISSIONEUROSTAT
Directorate C: National accounts, prices and key indicatorsUnit C2: National and regional accounts production. Balance of Payments
17 April 2015
BP/15/08
BALANCE OF PAYMENTS
WORKING GROUP
21-22 APRIL 2015Starting: 21 April 2015 at 9.30Ending: 22 April 2015 at 15.00
OOO
2014 Eurostat BOP/RoW Survey: detailed results*
OOO
Item 8 of the agenda
* Website: http://circa.europa.eu/Public/irc/dsis/BOP/home.
1

1. Executive summary
A survey comparing quarterly data as reported in the Quarterly Balance of Payments (QBoP) and Quarterly Sector Accounts (QSA) and the Rest of the World (RoW) sector of the non-financial account (CKA) was already conducted in 2004, 2006, 2009 and 2011. The 2014 survey has, for the first time, a financial account part. Preliminary results of the 2014 BOP/RoW CKA part of the survey were presented to the BOPWG on 19-20 November 2014. This document presents the detailed results of the QBoP/RoW CKA and additional information about the processing status of the financial part of the survey to the BOPWG. Annex C reports for each Member State and main item the overall value of the observed discrepancy and the main reason provided for the CKA part.
The 2014 BOP/RoW survey continues to compare BOP and QSA data compiled according to the national concept, as 2011 survey did, but now according to the methodological requirements of the BPM6 and the ESA 2010. In this sense, the survey results could be viewed as a quality indicator of the implementation of the new international standards.
Both parts of the survey are based on the data reported at the end of the third quarter of 2014, with reference period second quarter of 2014. Being the first officially reported data for both statistics it is normal that their quality will improve over time. Actually many Member States underlined this aspect when explaining the level of discrepancies.
Another major difference from the 2011 survey is the time series length, which for 2011 covered the entire time span (1999 – 2010) for almost all Member States, very different from the 2014 survey, when as shown on 19-20 November 2014, only 8 Member States provided data covering the 1999 – 2013 time span. As a consequence, the comparison between the discrepancies becomes difficult and disputable; hence, the comparison is made on the basis of the yearly average of absolutes values of discrepancies. In the meantime, in order to maintain a level of comparability of results along the time axis, for B9 item the discrepancies resulted from 2014 survey will be compared with the 010 item from 2011.
2. The history of the BOP/RoW survey
A history of the NF part of the survey was already presented to the BOPWG on 19-20 November 2014 and will not be presented again in this document.
The BPM6 and the ESA2010 have created the methodological framework for the financial part of the survey. It is the first time that the financial part of the survey is conducted. Eurostat initially thought of running this BOP/RoW survey in October 2013; the idea was to support a last cross-check of the BOP and RoW data, before the new standards are introduced. However, during the discussions at the CMFB, the Member States expressed their preference that the survey should be run in 2014, after the implementation of the new methodological. According to the CMFB preference the survey was conducted in 2014.
3. The main features of the 2014 BOP/RoW survey
The CKA part of the survey started on 10 November 2014, when the questionnaires were sent to the BOP and QSA compilers of each country. The questionnaires were pre-filled by Eurostat with the BOP and QSA data delivered by the Member States at the end of September 2014 and published by Eurostat in October 2014.
The FA part of the survey was launched on 12 December 2014, when the questionnaires were sent to the BOP and NA compilers. The data used had the same origin as the CKA part of the survey.
2

To protect the confidentiality of certain data, each country received only its own data and was requested to provide explanations for the discrepancies between BOP and RoW data, as shown in the pre-filled questionnaires.
23 Member States (AT, BE, CZ, DK, DE, EE, ES, FI, GR, HR, HU, IT, LT, LU, LV, NL, PL, PT, RO, SE, SI, SK, UK) replied to the CKA survey. 5 countries (BG, CY, FR, IE and HR) did not send responses. It is true that for Bulgaria, Ireland and Croatia QSA data are missing, so maybe this is the main reason of their missing answers. The latest information from France shows that its questionnaire reached the destination very late so the compilers had not enough the time to prepare the answer. Cyprus did not reply due to the fact that QSA data were based on the BPM5 QBoP data and covered only year 2013.
In response to the survey, a number of Member States improved their initial data coverage, adding new data which were missing at the beginning of the survey. The Member States reacted as follows:- Greece asked for a new questionnaire with QSA data;- Lithuania covered with QBOP data the 2004 -2007 period and for QSA the 2004 – 2013
period;- The Nederlands increased the time coverage to 2008 for its QBOP data; - Spain that added QBOP data to cover all span time of the survey;- Poland that filled in initial data for some aggregates levels;- Romania added data for QBOP for 2005 – 2007 and for QSA for 2005 – 2012.
In the meantime the respondents corrected the errors that affected Secondary Income, D61 item, where Credit and Debit has been erroneously switched.
Regarding the Financial Account, 19 Member States answered to the questionnaire (AT, BE, CZ, DE, EE, GR, HR, HU, IT, LT, LV, NL, PL, PT, RO, SE, SI, SK, UK).
A few Member States (BE, EL, FR, SI, SE) were confronted with additional difficulties when filling in the questionnaires. Regarding the RoW account, their data were prefilled by EUROSTAT using the national point of view. The source for this error was information provided by the ECB (confirmed internally by EUROSTAT sources for the 5 Member States mentioned above), that the implementation of the new SDMX requested the abandon of the old RoW point of view. In order to correct this error, only Sweden asked for a new questionnaire prefilled in the correct way.
The FA survey was intended to identify the discrepancies between BOP instrument assets, spread across functional categories and the instrument assets presentation used by QSA. The questionnaire was designed according to the ESA 2010, chapter 18 which describes the relationships between the two statistics. The questionnaire uses the instrument assets as bridge to pair the data of both systems. In order to do this, the BOP data were summed up by instrument asset code.
The questionnaire has two parts, one for assets and one for liabilities. Initially it had tables only for the following instrument assets: F1, F11, F12, F2, F3, F3+FL, F4, F5, F51, F52, F6, F7, F8, F Total. The need to clarify the differences between BOP sum of components and the BOP total instruments (F), noticed for the assets part, led to insertion of the table ‘Table 0’.The use of Table 0 therefore added to the FA survey a second aim: solving the internal BOP inconsistencies.
Table 0 was used by 11 Member States (BE, HU, IT, LT, LV, PL, RO, GB, AT, GB) to explain existing internal BOP inconsistencies.
3
The initial length of data series for FA varies from 15 years (2013-1999+1) to 1 year. During the reconciliation phase, many Member States added new data lengthening their data series and improving the data coverage of the survey.
From the processing point of view FA survey's data are being in analyse phase - that means each answer and reason is categorised as to obtain consistent groups of reason. EUROSTAT estimate that the final results should be expected midsummer 2015.
In most countries, the replies to the questionnaires were jointly prepared by BOP and QSA compilers; the list of colleagues who kindly contributed to the survey is attached (Annex A). Their efforts in providing clear explanations for the observed discrepancies are very much appreciated by Eurostat: without their help the reasons for the observed differences would remain unknown.
4. Comparison of the discrepancies for the CKA part between the 2011 survey and the 2014 survey
Due to the different length of data series, the comparison between the two datasets could not be performed along the time axis. Such comparison has been made in November 2014 for a reduced number of Member States and revealed a lower level of discrepancies compared to the 2014 survey.
In order to quantify for each Member State the impact of the implementation of the new methodological standards on the discrepancies, another indicator, the yearly average discrepancy for B9, was used. This average is computed as the sum of known absolute values of discrepancies along the time axis, divided by the number of values. Eurostat re-computed the values of the indicator for 2010 by using data from both surveys, and for 2013 only from the 2014 survey.
Table 1 shows the absolute and relative values of the indicator for all Member States in decreasing order of 2013 values for B9.
4

Table 1: Annual Discrepancy Average for the years 2010 and 2013 BOP and QSA B9, EU28, 2011 and 2014 datasets, million EUR
MS Absolute Yearly average
Relative variation of yearly average (2010
BPM5=100%)2010
BPM52010
BPM62013
BPM62010
BPM62013
BPM6FR 4658 8312 10891 178.44% 233.80%PL 2820 8814 8814 312.55% 312.54%BE 6270 7328 8504 116.88% 135.62%NL 7650 1911 6676 24.98% 87.26%IT 6924 7346 5972 106.09% 86.25%GR 5359 3915 2932 73.05% 54.71%SE 929 2527 2133 272.03% 229.57%DE 1900 2116 2028 111.34% 106.72%AT 719 1335 1910 185.74% 265.63%CZ 1089 2222 1669 204.03% 153.30%SK 459 n.a 1007 n.a 219.28%ES 1634 817 832 49.99% 50.90%PT 461 425 589 92.19% 127.82%RO 106 803 572 757.27% 540.09%FI 583 389 445 66.69% 76.34%
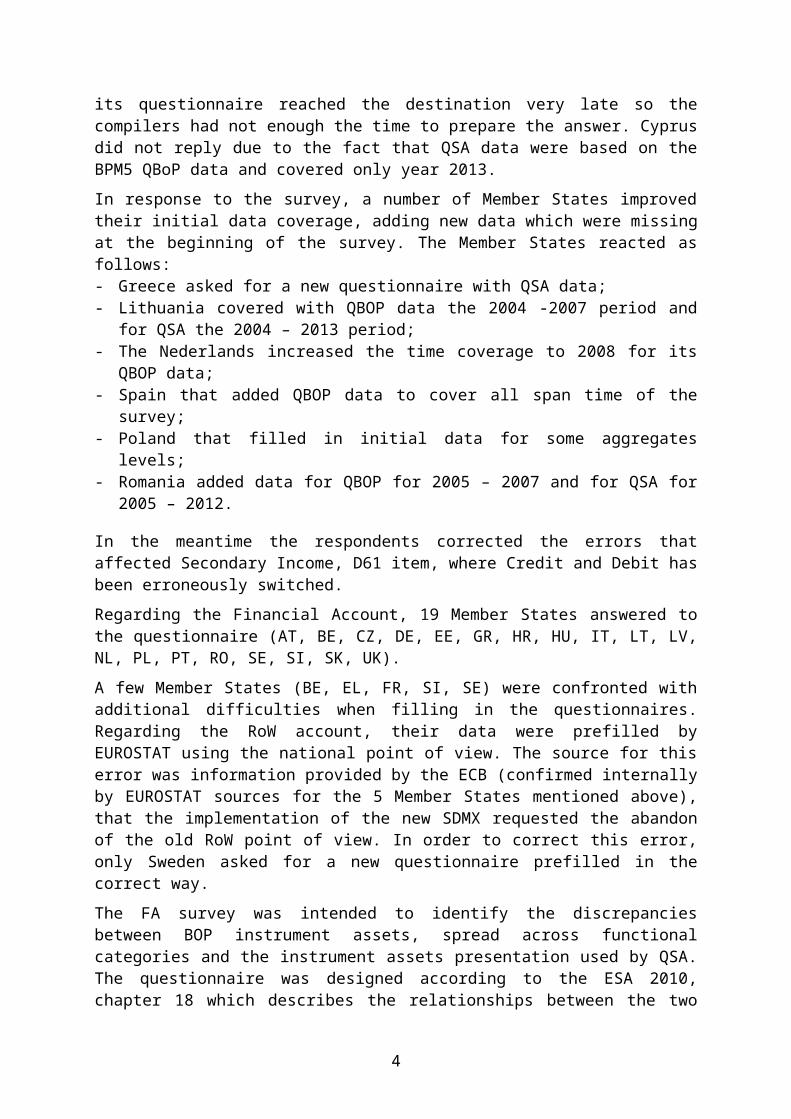
HU 487 265 226 54.43% 46.39%SI 46 114 213 246.74% 463.48%LT 65 152 184 234.09% 283.22%DK 175 20 165 11.34% 94.42%EE 58 29 110 49.66% 189.63%GB 1106 17 73 1.50% 6.58%LV 2 68 62 3403.70
% 3116.29%BG 136 n.a n.a n.a n.aIE 356 n.a n.a n.a n.aLU 1599 n.a n.a n.a n.aCY 302 n.a n.a n.a n.aMT n.a n.a n.a n.a n.aHR n.a n.a n.a n.a n.a
Figure 1 compares the differences between BOP and RoW by the absolute value of the annual average of discrepancy at the most aggregated level, at B9/net lending net borrowing, EU 28 aggregate, for 2010 and 2013, resulting from the BOP and RoW datasets that were used for the 2011 survey and for the 2014 survey.
5

Figure 1: The differences between BOP and QSA B9 Net, EU28, 2011 and 2014 datasets, million EUR, absolute annual discrepancy average
-2000
0
2000
4000
6000
8000
10000
12000
FR PL BE NL IT GR SE DE AT CZ SK ES PT RO FI HU SI LT DK EE GB LV BG IE LU CY MT HR
B9 Net Annual Average Discrepancy
2010 2010 R 2013
Table 1 shows for 2010 that 9 Member States (NL, GR, ES, PT, FI, HU, DK, EE, and GB) have lower discrepancies according to the BPM6/ESA2010 methodological framework than according to the BPM5/ESA95. 12 Member States show under the same conditions greater discrepancies, with a percentage increase between 106.09% (IT) and 3403.70% (LV).
For 2013, 8 Member States (NL, IT, GR, ES, FI, HU, DK, GB) have reduced the average discrepancies compared with the 2010 based BPM5 data. The reduction percentage varies from 6.58% (GB) to 94.24 % (DK). For 13 Member States the indicator values show an increase of discrepancies, varying from 106.72 % (DE) to 3116.29 % (LV).
The same analysis, using the yearly average, was conducted for Goods, Services, and Compensation of employees, Property income, Reinvested Earnings, and Capital Account. The results are available in Annex B.
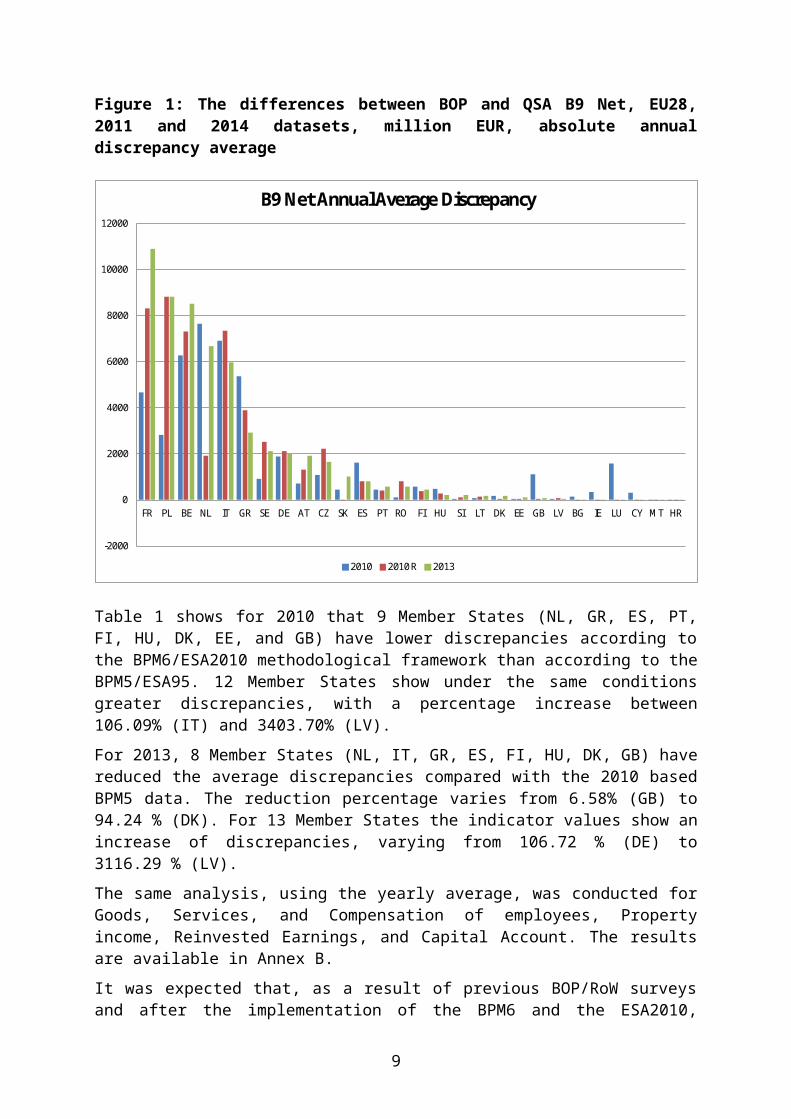
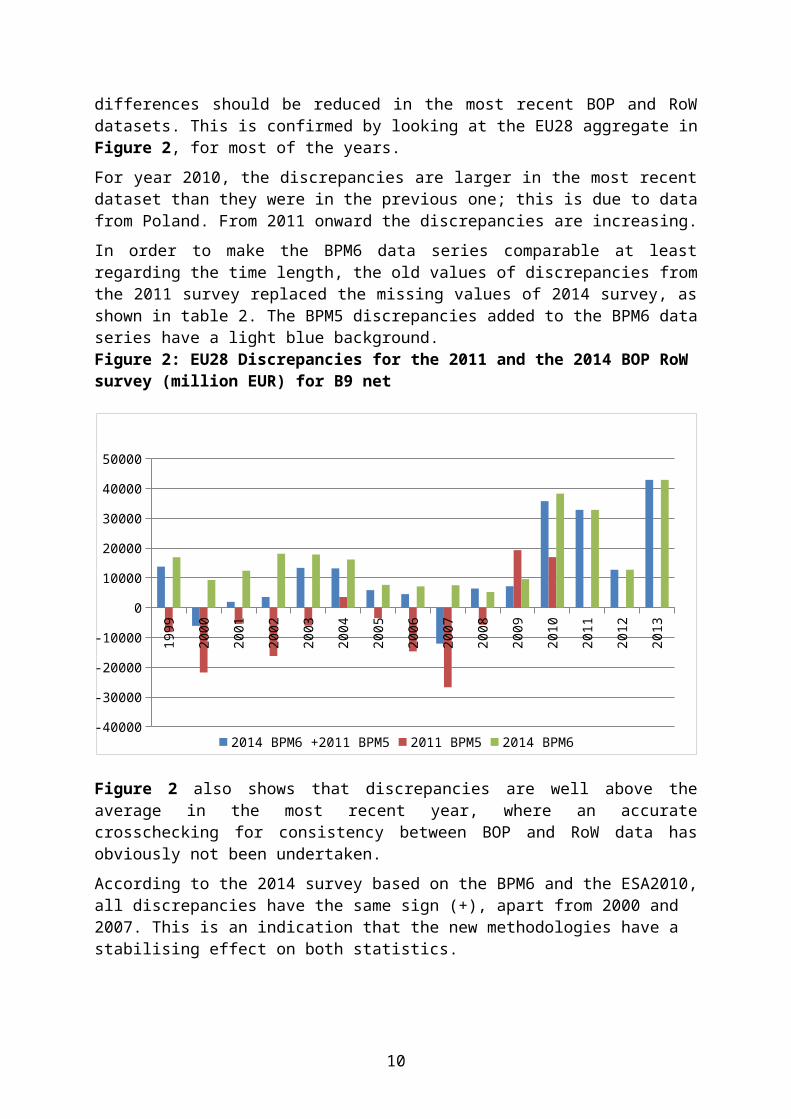
It was expected that, as a result of previous BOP/RoW surveys and after the implementation of the BPM6 and the ESA2010, differences should be reduced in the most recent BOP and RoW datasets. This is confirmed by looking at the EU28 aggregate in Figure 2, for most of the years.
For year 2010, the discrepancies are larger in the most recent dataset than they were in the previous one; this is due to data from Poland. From 2011 onward the discrepancies are increasing.
In order to make the BPM6 data series comparable at least regarding the time length, the old values of discrepancies from the 2011 survey replaced the missing values of 2014 survey, as shown in table 2. The BPM5 discrepancies added to the BPM6 data series have a light blue background.
6

Figure 2: EU28 Discrepancies for the 2011 and the 2014 BOP RoW survey (million EUR) for B9 net
1999
2000
2001
2002
2003
2004
2005
2006
2007
2008
2009
2010
2011
2012
2013
-40000
-30000
-20000
-10000
0
10000
20000
30000
40000
50000
2014 BPM6 +2011 BPM5 2011 BPM5 2014 BPM6
Figure 2 also shows that discrepancies are well above the average in the most recent year, where an accurate crosschecking for consistency between BOP and RoW data has obviously not been undertaken.
According to the 2014 survey based on the BPM6 and the ESA2010, all discrepancies have the same sign (+), apart from 2000 and 2007. This is an indication that the new methodologies have a stabilising effect on both statistics.
7
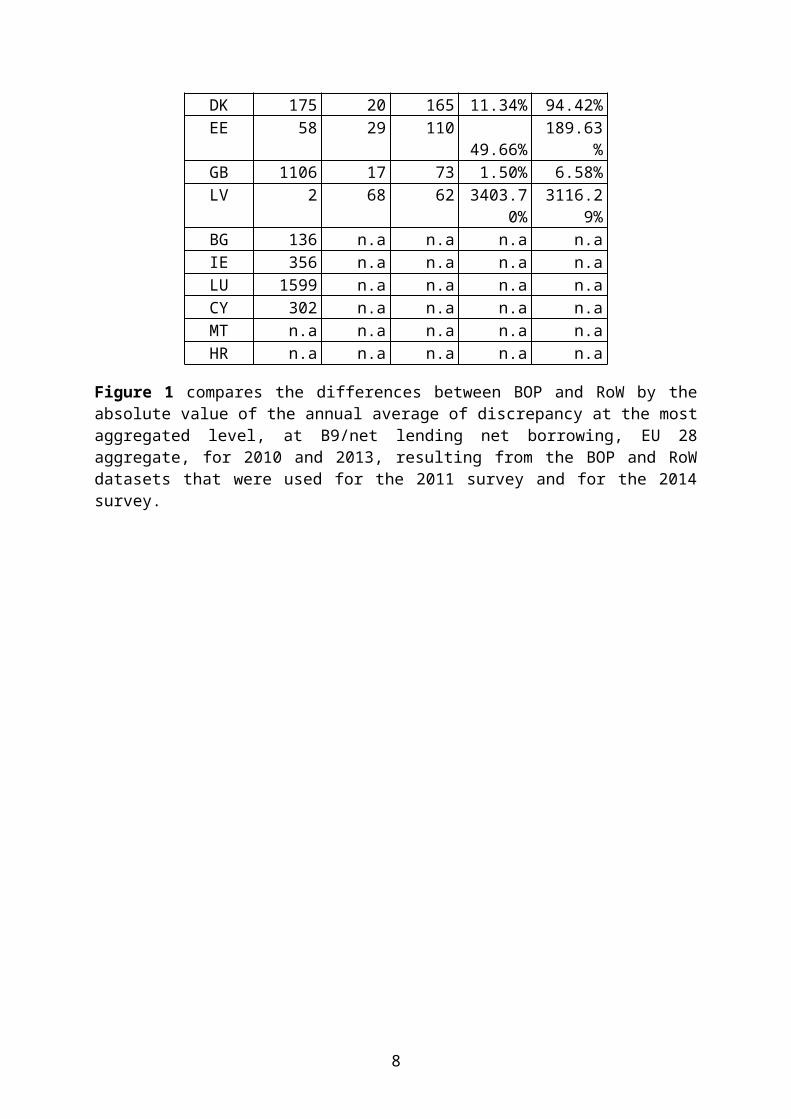
Table 2: Comparable discrepancies along the time axis for B9 net million EUR1999 2000 2001 2002 2003 2004 2005 2006 2007 2008 2009 2010 2011 2012 2013
EU 28 13,939 -6,052 2,160 3,056 11,583 12,091 5,741 4,748-
12,543 6,087 7,291 36,132 32,869 12,785 41,939AT -461 -52 -115 -83 -91 -354 -424 1,421 1,700 1,228 1,863 -465 -1,262 -3,252 -4,088
BE : : : -4,182 -6,743 -4,157-
4,149 -5,152 -8,041 -8,556 -9,694 -3,735 -6,249-
16,412 6,376BG -171 12 -242 -519 -522 9 9 12 14 25 9 -85 : : :CY : : -11 -18 -3 74 24 34 -29 229 -496 -2,108CZ 55 -49 -126 -652 90 -305 1,416 -139 -2,268 4,487 1,268 910 1,817 1,442 -93
DE -933 -400 -850 -549 1,611 -504-
2,341 -4,098 -3,913 -22 -4,978 -5,187 777 -2,069 -2,184DK 0 0 0 0 0 0 96 0 -20 0 1 1 2 -758 608EE 21 -11 -34 32 20 8 21 60 176 -140 -92 -29 126 212 -74ES -1,804 -1,609 -1,548 806 749 800 849 392 62 -68 708 -408 940 1,454 -279FI -2,086 94 -32 79 -189 -81 -156 -273 -366 -786 -143 -380 -639 -27 1,345FR 10,979 -2,806 1,153 455 2,050 325 7,074 12,136 16,708 9,754 16,977 19,325 26,078 24,269 13,270GB -5 -8 -11 -33 -40 -53 -42 -6 0 0 0 0 0 -540 -352GR : 4,705 6,711 9,689 8,513 8,399 5,637 1,369 2,021 4,613 5,923 1,906 102 3,008 3,720HRHU 91 -135 19 354 251 675 1,254 193 36 -129 -30 14 -26 128 -54IE : : : -756 -1,182 -699 -767 338 321 2 207 3IT 10,710 13,930 13,875 16,578 17,278 15,438 -68 -101 56 -3 5 -104 -14 -87 1,335LT 0 6 7 6 11 64 132 123 162 178 226 180 196 223 357LU : : : : : : : 2,584 568 1,065 2,183 :LV : 64 63 64 70 66 91 88 88 86 30 39 50 51 -22MT : : : : : : : : : : : : : : :
NL -1,363-
17,639-
15,216 -16,270 -4,813 -5,226 -807 1,464-
10,011 -3,515 678 -1,540 13,620 5,411 15,289
PL : -1,181 -1,485 -1,325 -1,562 -1,857-
2,911 -2,971 -2,969 -4,970 -4,134 28,394 -1,158 1,472 4,231PT -12 199 -249 398 349 724 536 48 525 940 -521 599 -873 1,136 1,730RO : : : : : : -3 -15 213 1,644 -138 626 109 -346 :SE -1,188 -1,285 140 -1,037 -4,279 -1,245 264 -2,734 -7,483 56 -2,462 -1,694 -384 -2,425 433
8
SI 105 114 110 18 14 -10 7 -27 -90 -31 -98 -129 -342 -105 392SK -138 -48 -171 531 1,815 1,163 192 -173 484 376 -76 -346 : : 1,007
9
5. The main results of the 2014 BOP/RoW survey
The first result achieved with the 2014 BOP/RoW survey is, when looking at the pre-filled questionnaires, almost all countries realised that they had transmitted wrong or not updated data to Eurostat. These countries should transmit correct and updated data to Eurostat as soon as possible (some already did), including the correct (BOP or RoW) data in the questionnaire used for the survey. It is not sufficient to allow Eurostat to update the data contained in the on-line dissemination database.
The remaining chapter focusses on the differences observed for the main transactions, looking at the Member States which contributed to the largest discrepancies and looking at the reasons provided to explain these discrepancies. Annex C provides, for each Member State and main item, an overview of the observed discrepancies, including explanations for the main reasons.
Figures 3, 4 and 5 compare the values of BOP RoW differences for the main transactions: goods, services, primary income, property income, secondary income and capital account.
Figure 3 – BOP/RoW differences for the main items, EU28, credits/exports/uses, million EUR
-30000
-20000
-10000
0
10000
20000
30000
40000
50000
1999
2000
2001
2002
2003
2004
2005
2006
2007
2008
2009
2010
2011
2012
2013
Goods C Services C IN1 c D4 C IN2 C D9 C
10

Figure 4: BOP/RoW differences for the main items, EU28, debits/imports/resources, million EUR
-40000
-30000
-20000
-10000
0
10000
20000
30000
4000019
99
2000
2001
2002
2003
2004
2005
2006
2007
2008
2009
2010
2011
2012
2013
Goods D Services D IN1 D D4 D IN2 D D9 D
Figure 5 – BOP/RoW differences for the main items, EU28, net, million EUR
-15000
-10000
-5000
0
5000
10000
15000
20000
25000
30000
35000
1999
2000
2001
2002
2003
2004
2005
2006
2007
2008
2009
2010
2011
2012
2013
Goods N Services N IN1 N D4 N IN2 N D9 N
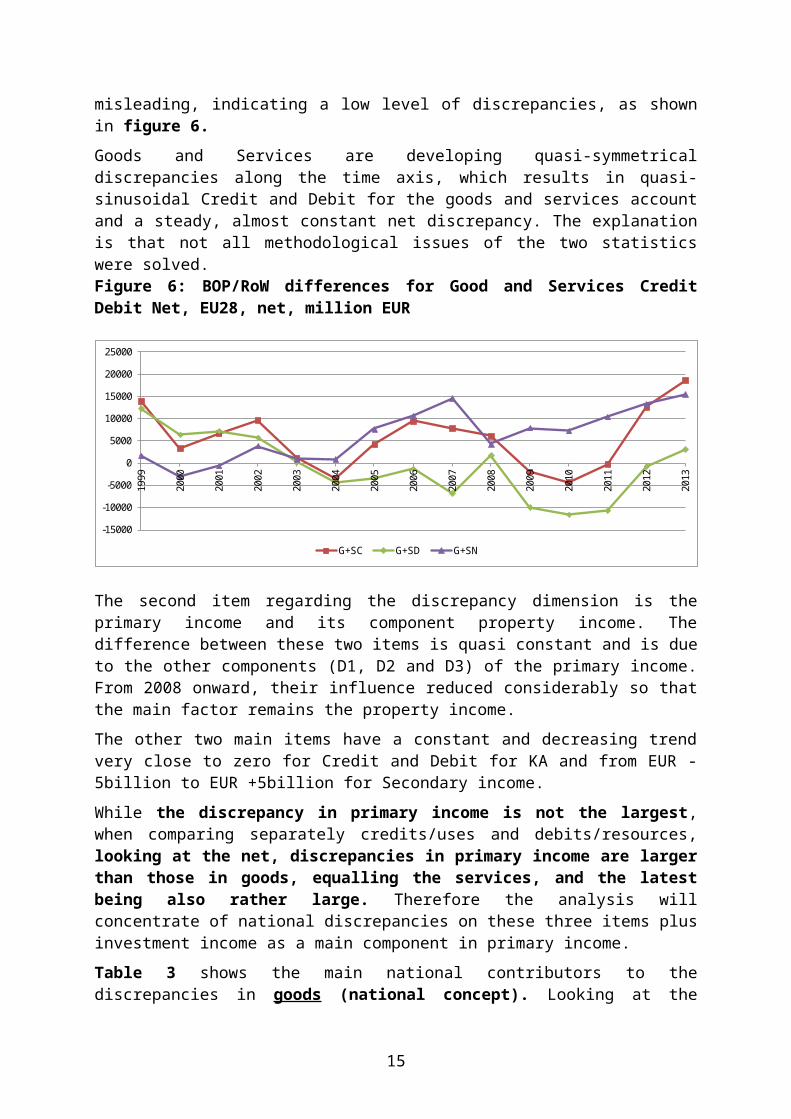
All three graphs show that Goods and Services discrepancies are framing the other main discrepancies. Regarding the Goods account and the Services account, the discrepancies show opposite signs. The interpretation of their sum, the Goods and Services section of the Current Account discrepancies, might be misleading, indicating a low level of discrepancies, as shown in figure 6.
Goods and Services are developing quasi-symmetrical discrepancies along the time axis, which results in quasi-sinusoidal Credit and Debit for the goods and services account and a steady, almost constant net discrepancy. The explanation is that not all methodological issues of the two statistics were solved.
11

Figure 6: BOP/RoW differences for Good and Services Credit Debit Net, EU28, net, million EUR
-15000
-10000
-5000
0
5000
10000
15000
20000
25000
1999
2000
2001
2002
2003
2004
2005
2006
2007
2008
2009
2010
2011
2012
2013
G+S C G+S D G+S N
The second item regarding the discrepancy dimension is the primary income and its component property income. The difference between these two items is quasi constant and is due to the other components (D1, D2 and D3) of the primary income. From 2008 onward, their influence reduced considerably so that the main factor remains the property income.
The other two main items have a constant and decreasing trend very close to zero for Credit and Debit for KA and from EUR -5billion to EUR +5billion for Secondary income.
While the discrepancy in primary income is not the largest, when comparing separately credits/uses and debits/resources, looking at the net, discrepancies in primary income are larger than those in goods, equalling the services, and the latest being also rather large. Therefore the analysis will concentrate of national discrepancies on these three items plus investment income as a main component in primary income.
Table 3 shows the main national contributors to the discrepancies in goods (national concept). Looking at the cumulated discrepancy over the period, 8 Member States account for 96% of total discrepancy (FR, GR, PT, LU, AT, BE, FI, SE), but a number of other countries also show significant discrepancies. The main reason provided for these discrepancies are different data sources used, reclassification from services to goods, net result of merchanting, compilation practices, CIF/fob prices and balancing of accounts. In the case of goods, debits, 92% of total EU28 discrepancy is caused by 8 Member States (FR, GR, PT, DK, BE, SE, FI, AT), the second largest discrepancy is observed for Greece, and is attributed to the different data sources used by the national compilers. Detailed data (and related explanations) for each Member State are included in Tables A1 and A2, Annex C.
Table 4 shows that for Services, not considering the unexplained discrepancy of France, the most frequent reason used is the reclassification from services to goods and vice versa, the exclusion of FISIM and vintage and revisions differences.
Table 5 shows that for Primary Income the compilation practice is the most frequent reason for discrepancies, together with mistakes in RoW data and influence from components (D1, D4). The influence from components is a reason that sums up all the reasons of one component and is used here to replace the missing explanations from Member States.
12
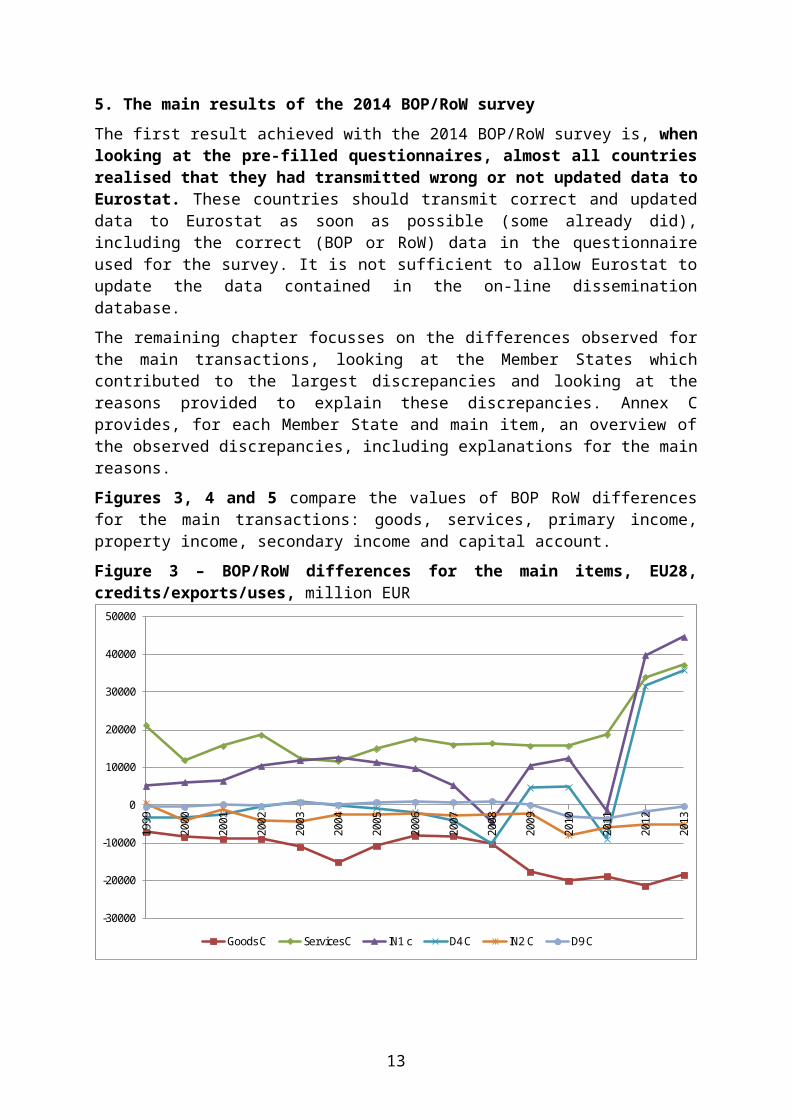
Table 3: BOP/RoW discrepancies in goods: the top contributors
Table 4: BOP/RoW discrepancies in services: the top contributors
Table 1B - Services- Credits/Uses/ExportsMS 1999 2000 2001 2002 2003 2004 2005 2006 2007 2008 2009 2010 2011 2012 2013 Total MS ABS(Total) Main ReasonEU 28 21,113 11,888 15,690 18,647 12,251 11,711 15,006 17,480 15,981 16,448 15,718 15,780 18,726 34,037 37,137 277,612 EU 28 492298.96FR 21,111 12,054 15,524 18,608 13,546 13,159 15,462 19,154 20,379 23,386 19,259 22,714 24,756 37,672 38,056 314,840 FR 314840.00 Unexplained differenceLU : -2,557 -2,327 -2,363 -2,525 -2,795 -3,423 -4,109 -5,259 -8,205 -5,776 -7,811 -7,946 -6,821 -6,622 -68,536 LU 68536.30 77 Financial Services excluding FISIM (CN BOP)PT 1,592 1,917 1,912 1,915 1,907 1,803 1,932 2,175 2,410 2,403 2,255 2,493 3,369 3,502 3,998 35,583 PT 35583.00 5 Reclassif from services to goodsSE : : : : -2,292 -2,385 -1,563 -1,394 -1,500 -2,613 -2,727 -3,327 -3,573 -4,097 309 -25,162 SE 25162.27 4 Reclassification from goods to servicesGR : : : : : : : : : : 2,306 2,104 2,682 2,718 2,991 12,801 GR 12801.00 5 Reclassification from Services to GoodsDE 0 -3 -1 -1 -4 -4 -5 -4 -1,941 -428 -1,514 -1,413 -984 -1,655 -2,334 -10,291 DE 10291.00 9 Vintage and revision differences FISIMFI -1,152 526 523 475 507 679 673 1,207 1,035 913 906 1,000 1,026 852 -220 8,948 FI 8948.35 5 Reclassification from services to goods
Table 1B - Services debits/resourcesMS 1999 2000 2001 2002 2003 2004 2005 2006 2007 2008 2009 2010 2011 2012 2013 Total MS ABS(Total) Main ReasonEU 28 21,044 15,517 15,149 13,987 6,747 5,792 7,455 6,750 365 1,725 3,359 688 -2,389 11,670 17,888 125,746 EU 28 409537.63FR 18,981 15,337 14,376 15,611 11,333 10,542 9,152 9,800 7,777 11,836 10,072 10,302 7,266 22,186 29,240 203,811 FR 203811.00 Unexplained differenceLU : -1,751 -1,710 -3,341 -3,551 -3,736 -3,349 -5,469 -8,858 -11,664 -8,177 -9,841 -10,347 -11,256 -12,235 -95,285 LU 95284.50 77 Financial Services excluding FISIM (CN BOP)SE : : : : -3,329 -3,690 -3,406 -3,262 -4,017 -4,413 -3,120 -4,087 -4,269 -4,705 -4,019 -42,317 SE 42316.78 Unexplained differenceDK : : : : : : 1,559 1,771 1,904 1,998 1,501 1,715 1,966 3,052 2,080 17,545 DK 17545.36 78 cif fob correction PT 799 1,018 984 849 796 952 1,022 1,230 1,332 1,262 1,292 1,421 1,662 1,390 1,451 17,460 PT 17460.00 5 Reclassif from services to goodsFI 732 508 455 258 285 492 536 1,278 1,045 835 812 947 938 272 -66 9,327 FI 9326.61 5 Reclassification from services to goods
Table 1B - Goods - Credits/Uses/ExportsMS 1999 2000 2001 2002 2003 2004 2005 2006 2007 2008 2009 2010 2011 2012 2013 Total MS ABS(Total) Main ReasonEU 28 -7,092 -8,524 -8,966 -8,941 -11,077 -15,073 -10,739 -8,057 -8,097 -10,320 -17,636 -20,022 -18,905 -21,415 -18,448 -193,311 EU 28 233865.79FR -4,861 -6,924 -7,265 -6,771 -3,850 -6,418 -5,859 -4,842 -7,508 -8,495 -9,037 -7,443 -5,653 -5,077 -6,583 -96,586 FR 96586.00 Unexplained differenceGR : : : : : : : : : : -5,245 -6,664 -7,106 -8,180 -7,777 -34,972 GR 34972.00 10. Different data sources usedPT -1,514 -1,692 -1,660 -1,772 -1,743 -1,518 -1,612 -2,058 -1,920 -1,855 -2,181 -2,105 -2,179 -2,617 -2,586 -29,012 PT 29012.00 5 Reclassif. from services to goodsLU : 175 -9 121 -101 -256 -49 -992 -1,289 -1,833 -1,714 -2,153 -2,653 -3,350 -4,200 -18,302 LU 18302.00 76 Net X of goods under merchanting (CN-BOP)AT : : : : : : : 3,201 4,836 4,755 4,456 -1 1 0 -749 16,500 AT 16499.90 1 Compilation practicesBE : : : : : : : : : -3,375 -3,644 -313 -1,640 -553 119 -9,406 BE 9405.90 11 Balancing of accountsFI -1,056 192 319 38 -338 -706 -704 -1,267 -1,099 -890 -650 -901 -1,275 -495 -306 -9,138 FI 9137.74 5 Reclassification from services to goodsSE : : : : -4,103 -5,311 -1,357 -1,097 373 1,361 528 -111 1,631 812 -141 -7,415 SE 7415.03 91 CIF/FOB to invoice based approach
Table 1C - Goods - debits/resourcesMS 1999 2000 2001 2002 2003 2004 2005 2006 2007 2008 2009 2010 2011 2012 2013 Total MS ABS(Total) Main ReasonEU 28 -8,714 -9,088 -7,876 -8,203 -6,524 -10,073 -10,909 -8,004 -7,088 65 -13,268 -12,230 -8,262 -12,370 -14,746 -137,290 EU 28 220699.10FR -7,398 -7,954 -6,533 -6,305 -4,885 -7,382 -6,575 -4,505 -6,981 -2,997 -3,820 -199 -121 -897 -4,841 -71,393 FR 71393.00 Unexplained differenceGR : : : : : : : : : : -9,551 -8,590 -5,977 -9,654 -9,924 -43,696 GR 43696.00 10. Different data sources usedPT -881 -1,016 -991 -870 -747 -921 -1,148 -1,245 -1,350 -1,318 -1,522 -1,830 -1,791 -1,871 -2,020 -19,521 PT 19521.00 1 Compilation practicesDK : : : : : : -1,558 -1,771 -1,904 -1,998 -1,501 -1,715 -1,967 -2,519 -2,478 -17,411 DK 17411.33 78 Cif-fob adjustmentBE : : : : : : : : : 2,639 499 1,421 2,979 4,355 5,228 17,121 BE 17120.60 12 (transit trade natural gaz)SE : : : : 358 277 917 682 3,142 2,252 1,771 1,212 905 627 190 12,333 SE 12333.29 78 Cif-fob adjustmentFI -745 -35 -51 -271 -627 -746 -748 -1,495 -1,335 -1,087 -1,021 -1,107 -1,101 -618 -946 -11,933 FI 11932.60 5 Reclassification from services to goodsAT : : : : : : : 1,758 2,988 3,018 2,384 -1 -3 0 426 10,570 AT 10569.80 1 Compilation practices
13
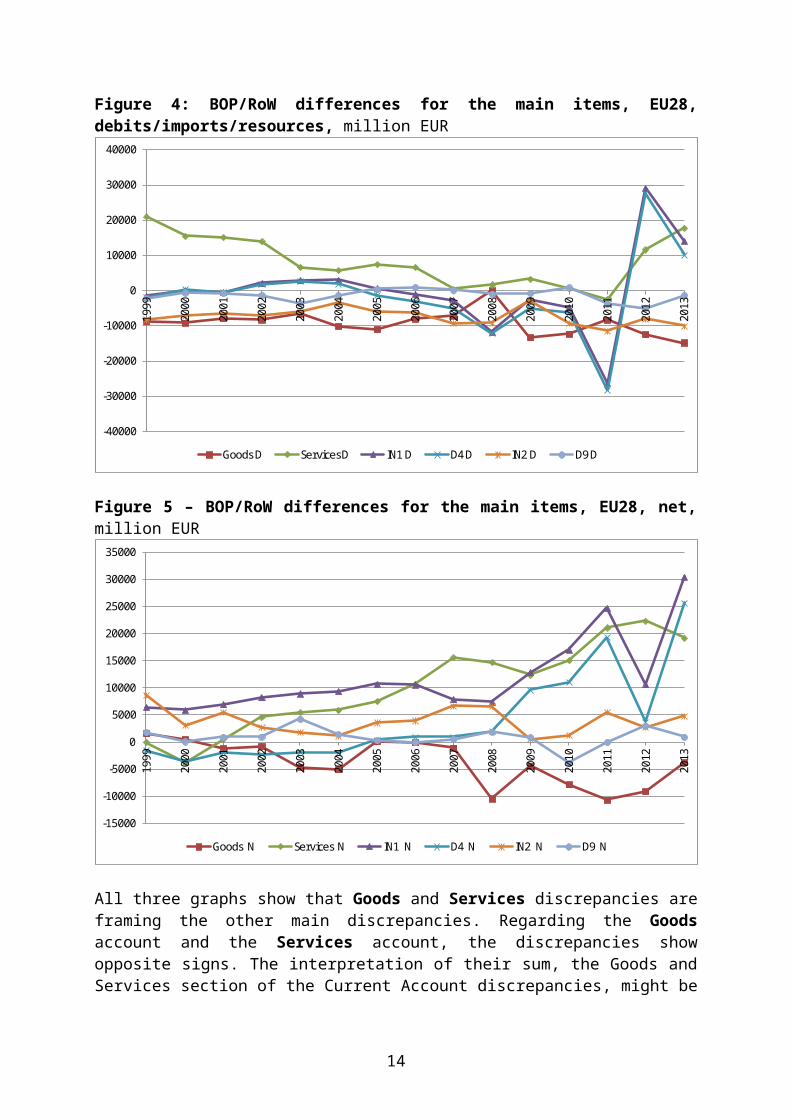
Table 5: BOP/RoW discrepancies in Primary income: the top contributors
Table 1B -Primary Income- Credits/Uses/ExportsMS 1999 2000 2001 2002 2003 2004 2005 2006 2007 2008 2009 2010 2011 2012 2013 Total MS ABS(Total) Main ReasonEU 28 5,058 6,005 6,480 10,353 11,884 12,541 11,400 9,727 5,213 -4,363 10,377 12,398 -1,437 39,765 44,662 180,063 EU 28 310244.86GB 8,443 8,437 8,616 9,262 9,327 10,164 9,968 9,447 8,627 7,663 7,657 7,132 7,296 6,475 5,782 124,294 GB 124294.28 1 Compilation practicesFR 1,433 1,745 2,024 3,660 5,438 2,835 2,841 1,622 -1,687 -8,502 2,351 9,009 3,078 15,643 6,195 47,685 FR 47684.90 Unexplained differenceNL : : : : : : : : : 3,190 7,862 -1,280 -8,722 14,613 31,095 46,758 NL 46758.00 1 Compilation practicesSE : : : : : : : : : -3,084 -3,217 -3,450 -3,521 -3,728 -5,222 -22,223 SE 22222.92 92 D1 expl diffFI -675 -913 -1,040 -1,058 -1,230 -391 -360 -824 -971 -1,351 -1,177 -1,233 -1,400 -1,413 -2,050 -16,087 FI 16087.11 Unexplained differenceDE -1,411 -877 -1,073 -1,394 -1,989 -1,107 -1,988 -2,290 -944 -2,906 -1,405 -850 -327 2,196 2,342 -14,023 DE 14023.00 Mistakes detected in RoW data PT 226 291 331 242 995 851 512 774 553 776 640 2,470 1,318 71 -334 9,717 PT 9716.54 1 Compilation practicesBE : : : : : : : : : -387 -645 296 462 4,792 3,670 8,188 BE 8187.91 95 D4 Expl diff
Table 1B - Primary Income Debits/ ResourcesMS 1999 2000 2001 2002 2003 2004 2005 2006 2007 2008 2009 2010 2011 2012 2013 Total MS ABS(Total) Main ReasonEU 28 -1,427 45 -465 2,090 2,927 3,125 624 -890 -2,707 -11,747 -2,527 -4,669 -26,176 29,100 14,167 1,469 EU 28 84065.10DE -1,570 -2,581 -2,708 -1,858 -2,032 -1,632 -1,251 -994 -1,023 -1,240 -661 -720 -85 -164 1,976 -16,543 DE 16543.00 Mistakes detected in RoW data CZ : : : : : : : : : -4,512 -2,038 -1,894 -3,449 -668 -203 -12,765 CZ 12765.21 9 Vintage and revision differencesNL : : : : : : : : : 4,768 6,531 -2,727 -20,711 5,025 18,871 11,757 NL 11757.00 1 Compilation practicesPT 285 42 624 -289 572 111 316 367 284 264 1,222 2,409 3,408 307 159 10,081 PT 10080.60 1 Compilation practicesBE : : : : : : : : : 526 -751 481 655 15,256 -9,101 7,066 BE 7065.71 95 D4 expl dif
Table 6: BOP/RoW discrepancies in Property income: the top contributors Table 1B - D4 - Credits/Uses/Exports
MS 1999 2000 2001 2002 2003 2004 2005 2006 2007 2008 2009 2010 2011 2012 2013 Total MS ABS(Total) Main ReasonEU 28 -3,395 -3,223 -2,393 -476 934 -66 -867 -1,953 -4,149 -10,071 4,671 4,813 -8,924 31,548 35,845 42,296 EU 28 96268.68NL : : : : : : : : : 3,191 7,862 -1,280 -8,722 14,612 31,095 46,758 NL 46758.00 1 Compilation practicesPT 225 291 330 244 996 850 513 773 553 826 652 2,556 1,362 76 -313 9,933 PT 9932.64 1 Compilation practicesDE -940 -498 -683 -1,234 -1,838 -971 -1,713 -1,893 313 -2,158 -944 -660 -186 1,662 1,895 -9,848 DE 9848.00 Mistakes detected in RoW data FI -3 -25 -130 -147 -330 -54 -37 -120 -264 -639 -447 -550 -560 -688 -2,059 -6,054 FI 6054.10 Unexplained differenceBE : : : : : : : : : -574 -964 -30 -11 4,435 3,001 5,856 BE 5856.42 99 Other
Table 1B - D4- Debits/resourcesMS 1999 2000 2001 2002 2003 2004 2005 2006 2007 2008 2009 2010 2011 2012 2013 Total MS ABS(Total) Main ReasonEU 28 -1,882 348 -483 1,801 2,795 1,857 -1,315 -2,926 -5,144 -12,101 -5,000 -6,211 -28,234 27,767 10,181 -18,547 EU 28 81181.66FR -1,052 1,111 -28 2,852 2,934 2,407 -372 -2,493 -4,619 -11,799 -9,256 -4,911 -8,551 7,115 3,108 -23,554 FR 23554.00 Unexplained differenceCZ : : : : : : : : : -4,466 -2,025 -1,849 -3,476 -725 -270 -12,812 CZ 12811.58 9 Vintage and revision differencesNL : : : : : : : : : 4,769 6,531 -2,727 -20,711 5,025 18,871 11,758 NL 11758.00 1 Compilation practicesPT 288 47 623 -293 576 108 319 369 291 259 1,219 2,423 3,387 296 156 10,070 PT 10069.54 1 Compilation practicesDE -909 -869 -1,160 -807 -763 -594 -509 -369 -395 -467 -718 -702 -124 -230 -148 -8,764 DE 8764.00 Mistakes detected in RoW data
14
For Property Income, table 6 reveals that the main reasons are the compilation practice along with errors in RoW data. The main contributors for Credit and Debit are practically the same: NL, DE, FR, BE, PT and FI. In order to analyse the capacity of BOP and QSA statistics and to identify and to correct the discrepancies, the following tables show the structure of discrepancies grouped by reasons for each main item and the ratio of explained discrepancies in total discrepancies.
In the tables the sum of explanations is greater than the discrepancy both expressed in absolute values.
Table 7: Structure of explained discrepancies by reasons for Goods Credit
Reason Value frequency5 Reclassif. from services to goods(+ Net X) 65508 51 Compilation practices 33890 511 Balancing of accounts 26946 310. Different data sources used 21148 199 Other 13700 412 Mistakes detected in BoP data 5811 2991 llegal conomy 4532 29 Vintage and revision differences 3762 44 Reclassification from goods to services 3079 213 Mistakes detected in RoW data 1922 2EU28 Total discrepancy(-FR) 137279EU28 Total discrepancy unexplained(-FR) 4276EU28 explaining degree 96.89%
Figure 7: Structure of explained discrepancies by reasons for Goods Credit
15

Table 8: Structure of explained discrepancies by reasons for Goods Debit
Reason Value frequency78 CIF/FOB adjustment 40110 310. Different data sources used 32737 11 Compilation practices 27912 65 Reclassification from services to goods 19061 42 transit trade (natural gaz) 17997 1991 Illegal Economy 16857 54 Reclassification from goods to services 12539 29 Vintage and revision differences 6653 33 repairs not carried out in bop data 3164 113 Mistakes detected in RoW data 1922 211 Balancing of accounts 1172 212 Mistakes detected in BoP data 387 2EU28 Total discrepancy(-FR) 149306EU28 Total discrepancy unexplained(-FR) 1537EU28 explaining degree 98.97%
Figure 8: Structure of explained discrepancies by reasons for Goods Debit
For credit and debit Goods, the main sources of discrepancies are reclassifications from services, CIF/FoB adjustment, compilation practices and different data sources. The errors in data are also present beside the illegal economy activities, which were reported by several Member States. The high degree of reconciliation shows that the reduction of discrepancies is only a problem of time.
16

Table 9: Structure of explained discrepancies by reasons for Services Credit
Reason Value frequency2 Fisim allocation 51235 85 Reclassification from services to goods 42775 41 Compilation practices 27003 109 Vintage and revision differences 12689 64 Reclassification from goods to services 12125 211 Balancing of accounts 5324 310. Different data sources used 4035 26 Insurance 1391 413 Mistakes detected in RoW data 410 43 repairs not carried out in bop data 271 1991 Illegal Economy 253 312 Mistakes detected in BoP data 115 2EU28 Total discrepancy(-FR) 177458EU28 Total discrepancy unexplained(-FR) 36232EU28 explaining degree 79.58%
Figure 9: Structure of explained discrepancies by reasons for Services Credit
17
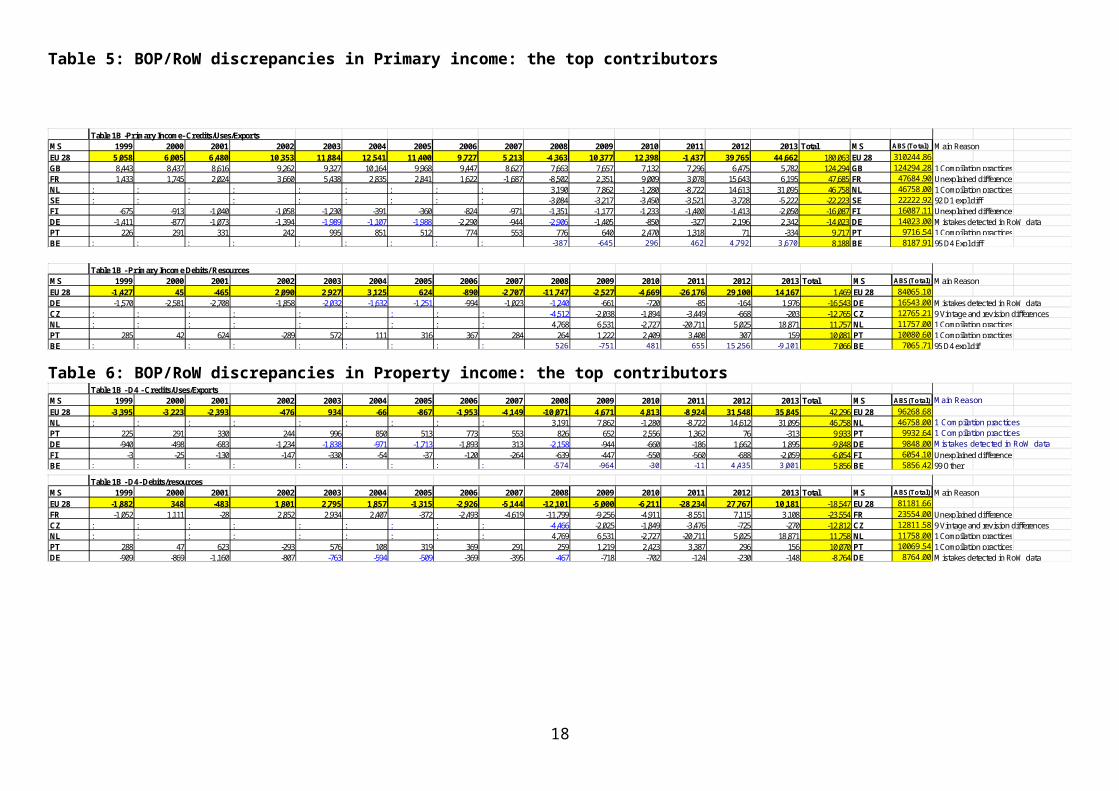
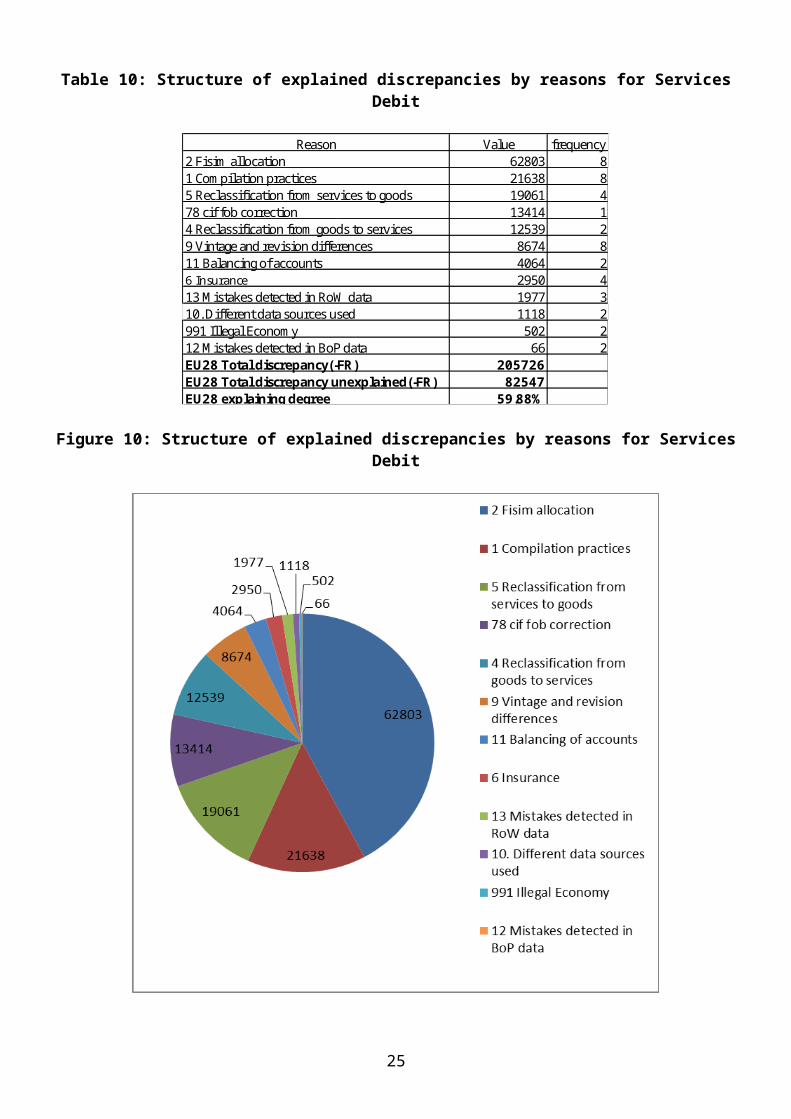
Table 10: Structure of explained discrepancies by reasons for Services Debit
Reason Value frequency2 Fisim allocation 62803 81 Compilation practices 21638 85 Reclassification from services to goods 19061 478 cif fob correction 13414 14 Reclassification from goods to services 12539 29 Vintage and revision differences 8674 811 Balancing of accounts 4064 26 Insurance 2950 413 Mistakes detected in RoW data 1977 310. Different data sources used 1118 2991 Illegal Economy 502 212 Mistakes detected in BoP data 66 2EU28 Total discrepancy(-FR) 205726EU28 Total discrepancy unexplained(-FR) 82547EU28 explaining degree 59.88%
Figure 10: Structure of explained discrepancies by reasons for Services Debit
For Services the FISIM allocation has a leading position, beside the reclassifications and compilation practices. Not very important in absolute values, the errors and illegal economic activities are also present. The high value of FISIM is due to LU (financial services). It has a non-negligible impact on the reconciliation degree, making it to drop to 60%.
18
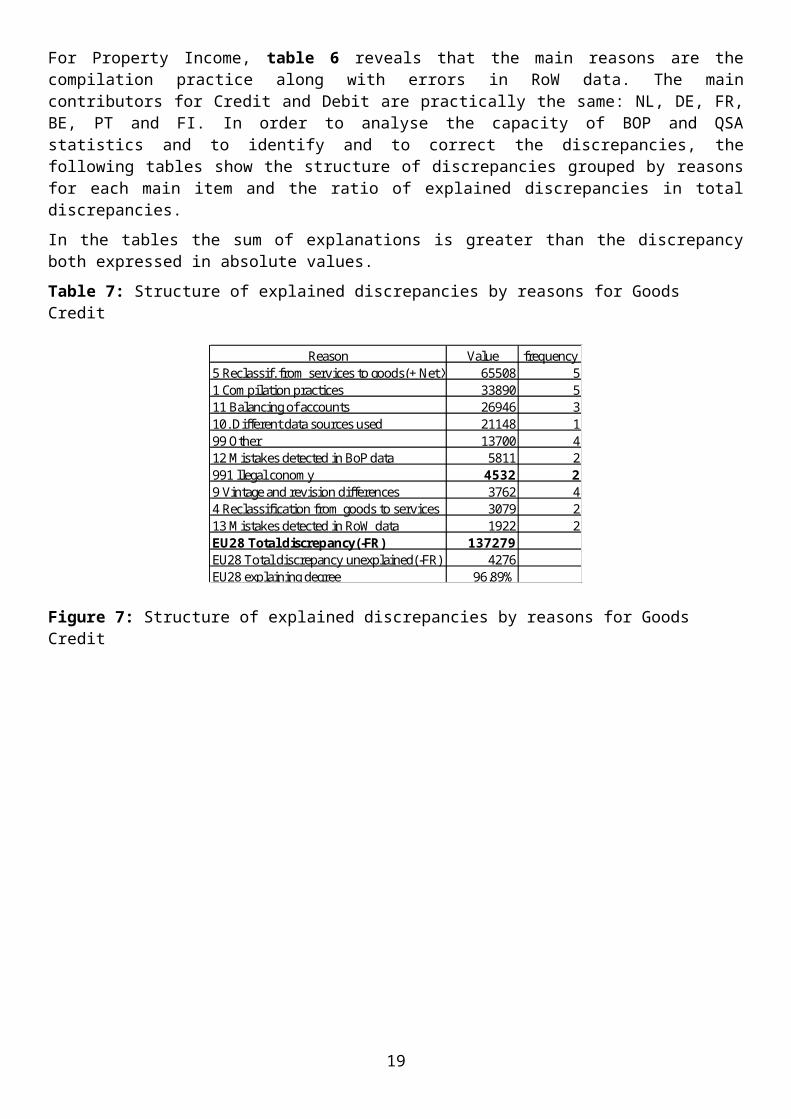
Table 11: Structure of explained discrepancies by reasons for Primary Income Credit
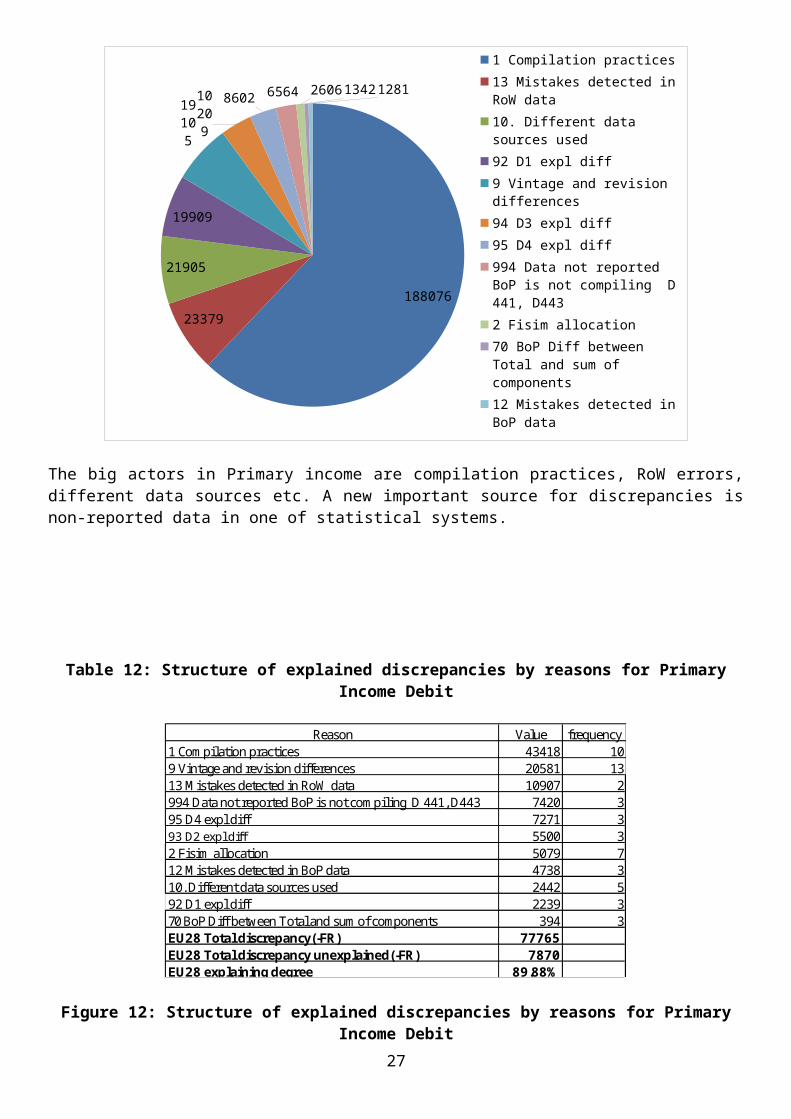
Reason Value frequency1 Compilation practices 188076 1013 Mistakes detected in RoW data 23379 110. Different data sources used 21905 892 D1 expl diff 19909 39 Vintage and revision differences 19105 1194 D3 expl diff 10209 495 D4 expl diff 8602 3994 Data not reported BoP is not compiling D 441, D443 6564 22 Fisim allocation 2606 370 BoP Diff between Total and sum of components 1342 312 Mistakes detected in BoP data 1281 2EU28 Total discrepancy(-FR) 262560EU28 Total discrepancy unexplained(-FR) 21967EU28 explaining degree 91.63%
Figure 11: Structure of explained discrepancies by reasons for Primary Income Credit
188076
23379
21905
19909
19105
10209
8602 6564 2606 1342 12811 Compilation practices
13 Mistakes detected in RoW data
10. Different data sources used
92 D1 expl diff
9 Vintage and revision differences
94 D3 expl diff
95 D4 expl diff
994 Data not reported BoP is not compiling D 441, D443
2 Fisim allocation
70 BoP Diff between Total and sum of components
12 Mistakes detected in BoP data
The big actors in Primary income are compilation practices, RoW errors, different data sources etc. A new important source for discrepancies is non-reported data in one of statistical systems.
19

Table 12: Structure of explained discrepancies by reasons for Primary Income Debit
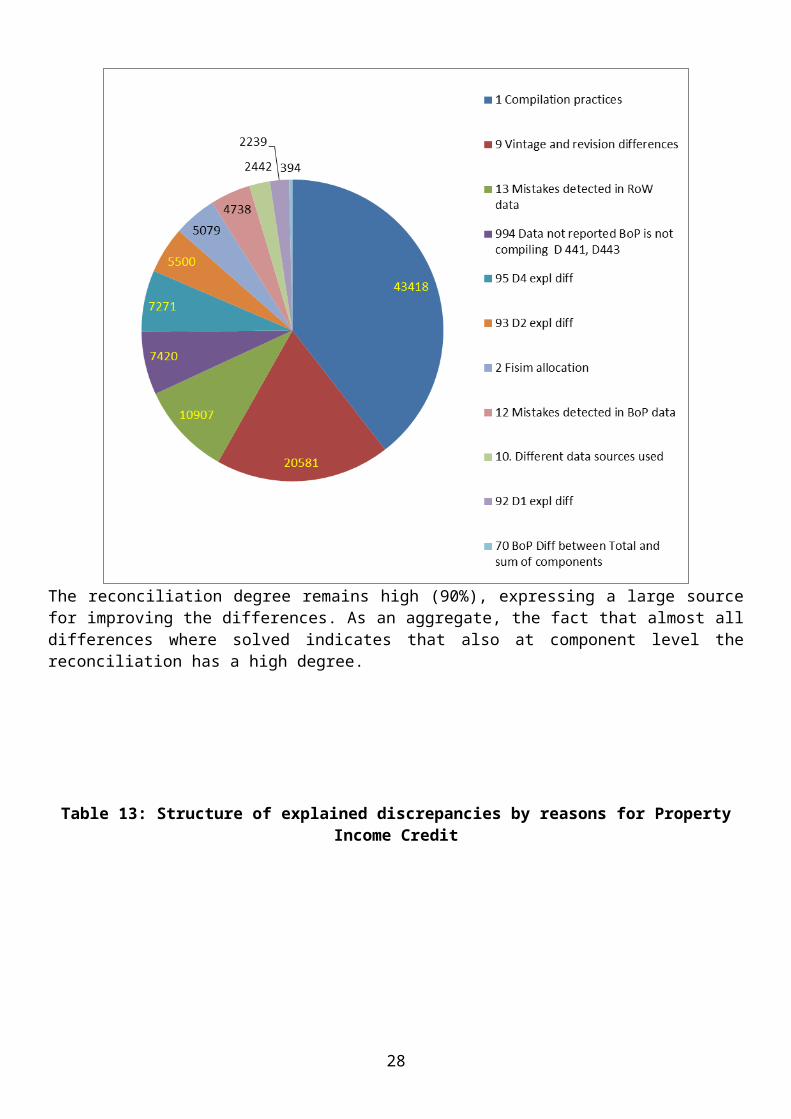
Reason Value frequency1 Compilation practices 43418 109 Vintage and revision differences 20581 1313 Mistakes detected in RoW data 10907 2994 Data not reported BoP is not compiling D 441, D443 7420 395 D4 expl diff 7271 393 D2 expl diff 5500 32 Fisim allocation 5079 712 Mistakes detected in BoP data 4738 310. Different data sources used 2442 592 D1 expl diff 2239 370 BoP Diff between Total and sum of components 394 3EU28 Total discrepancy(-FR) 77765EU28 Total discrepancy unexplained(-FR) 7870EU28 explaining degree 89.88%
Figure 12: Structure of explained discrepancies by reasons for Primary Income Debit
The reconciliation degree remains high (90%), expressing a large source for improving the differences. As an aggregate, the fact that almost all differences where solved indicates that also at component level the reconciliation has a high degree.
20

Table 13: Structure of explained discrepancies by reasons for Property Income Credit
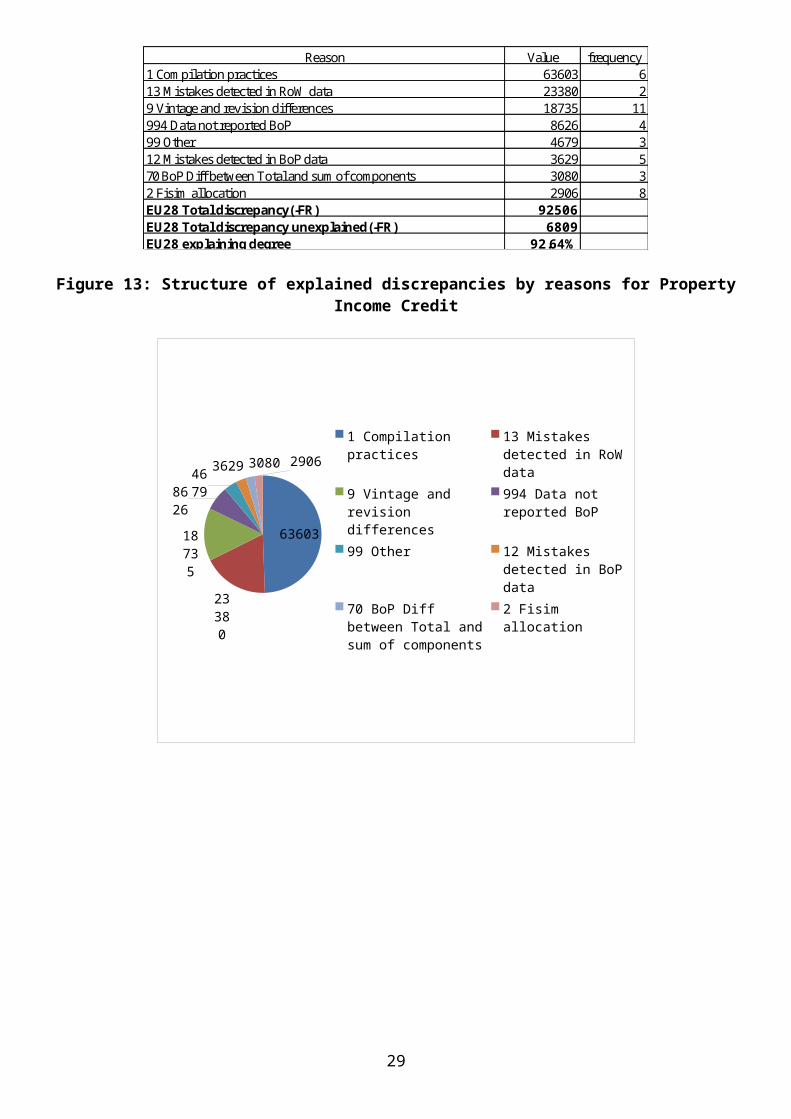
Reason Value frequency1 Compilation practices 63603 613 Mistakes detected in RoW data 23380 29 Vintage and revision differences 18735 11994 Data not reported BoP 8626 499 Other 4679 312 Mistakes detected in BoP data 3629 570 BoP Diff between Total and sum of components 3080 32 Fisim allocation 2906 8EU28 Total discrepancy(-FR) 92506EU28 Total discrepancy unexplained(-FR) 6809EU28 explaining degree 92.64%
Figure 13: Structure of explained discrepancies by reasons for Property Income Credit
63603
23380
18735
8626
4679
3629 30802906
1 Compilation practices13 Mistakes detected in RoW data9 Vintage and revision dif -ferences994 Data not reported BoP 99 Other12 Mistakes detected in BoP data 70 BoP Diff between Total and sum of components2 Fisim allocation
21

Table 14: Structure of explained discrepancies by reasons for Property Income Debit
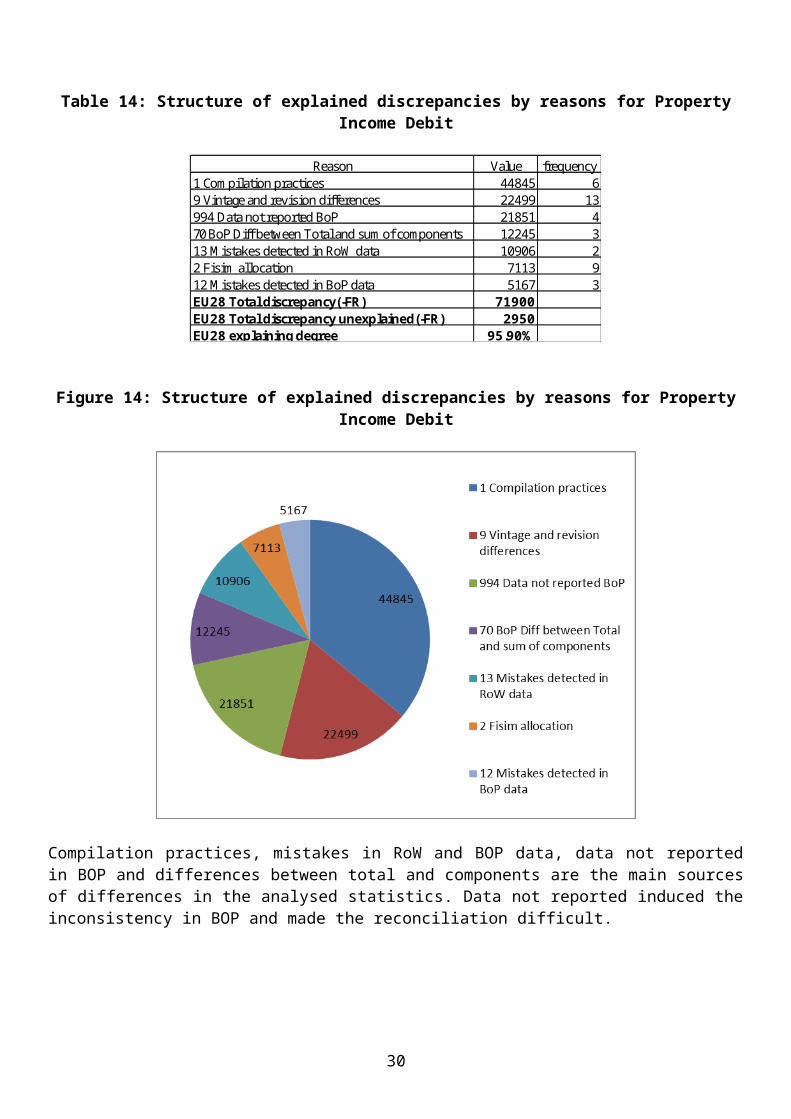
Reason Value frequency1 Compilation practices 44845 69 Vintage and revision differences 22499 13994 Data not reported BoP 21851 470 BoP Diff between Total and sum of components 12245 313 Mistakes detected in RoW data 10906 22 Fisim allocation 7113 912 Mistakes detected in BoP data 5167 3EU28 Total discrepancy(-FR) 71900EU28 Total discrepancy unexplained(-FR) 2950EU28 explaining degree 95.90%
Figure 14: Structure of explained discrepancies by reasons for Property Income Debit
Compilation practices, mistakes in RoW and BOP data, data not reported in BOP and differences between total and components are the main sources of differences in the analysed statistics. Data not reported induced the inconsistency in BOP and made the reconciliation difficult.
22
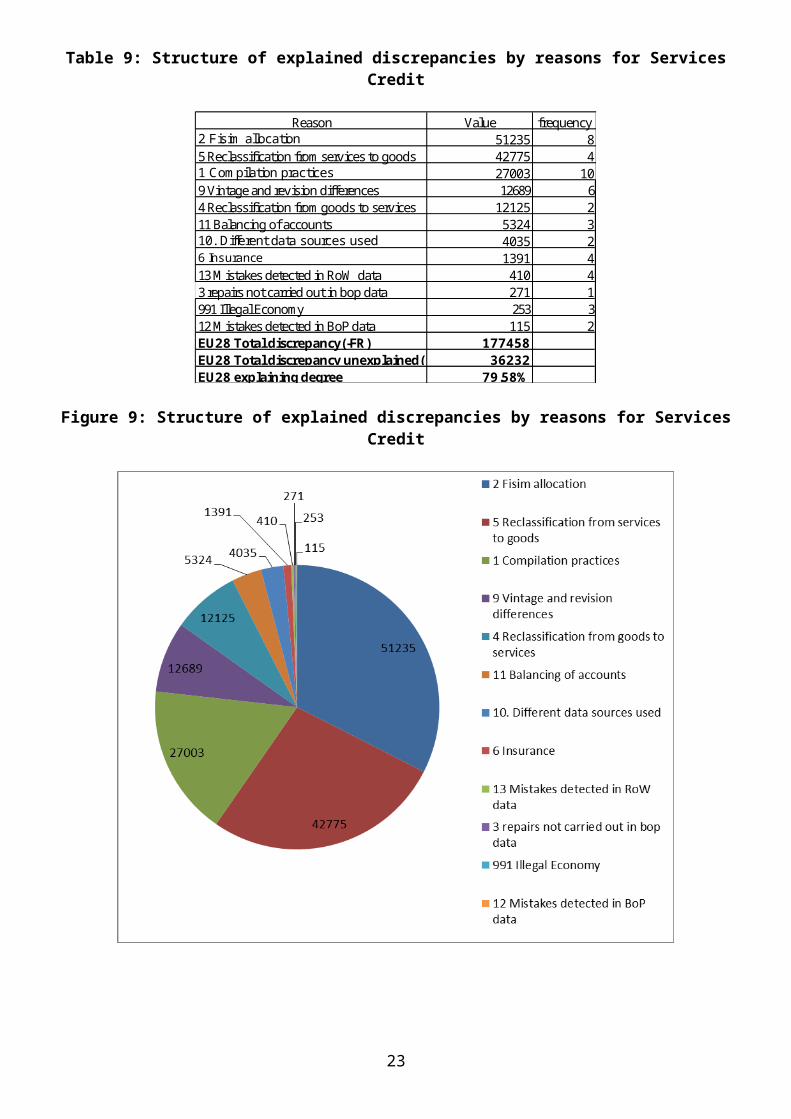
Table 15: Structure of explained discrepancies by reasons for CA+KA B9 NET
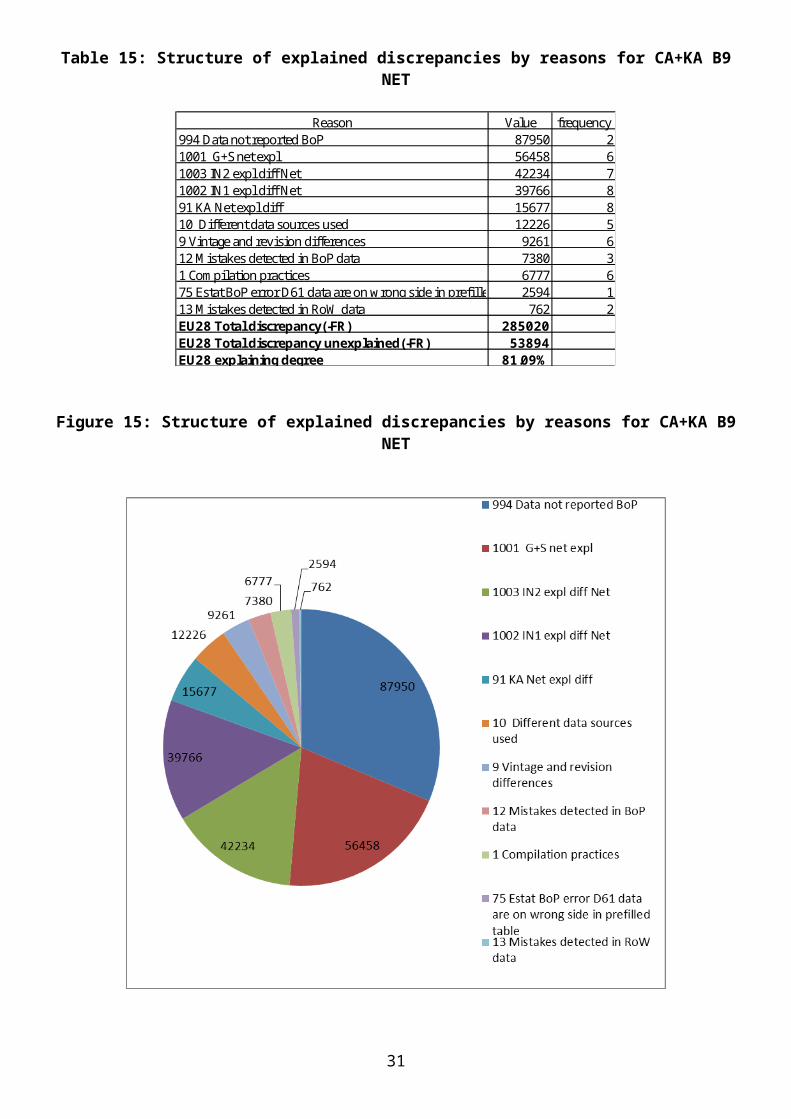
Reason Value frequency994 Data not reported BoP 87950 21001 G+S net expl 56458 61003 IN2 expl diff Net 42234 71002 IN1 expl diff Net 39766 891 KA Net expl diff 15677 810 Different data sources used 12226 59 Vintage and revision differences 9261 612 Mistakes detected in BoP data 7380 31 Compilation practices 6777 675 Estat BoP error D61 data are on wrong side in prefilled table2594 113 Mistakes detected in RoW data 762 2EU28 Total discrepancy(-FR) 285020EU28 Total discrepancy unexplained(-FR) 53894EU28 explaining degree 81.09%
Figure 15: Structure of explained discrepancies by reasons for CA+KA B9 NET
The final item B9 includes all the differences. The first 5 sources are aggregates which reflect the influences of main items. Under the "994 data not reported" there are non-reported values of Italy for years before 2008, maybe their significance is not very important. Important is that the reconciliation degree remains high at 81%.
23

7. Conclusion
The most important conclusion is that the implementation of the BPM6 and the ESA2010 created a methodological frame in which the reconciliation of the statistical system is highly available.
The 2014 BOP RoW survey used "hot data", the first issued under the new methodological requirements; hence the existence of errors is explainable. Even so, a significant number of Member States (with sophisticated economy) reduced the discrepancies. Almost all Member States managed to reconcile their discrepancies and proved a proactive behaviour (see Member States that improved their data completeness or requested new prefilled questionnaires). Member States should immediately react and should eliminate the discovered errors (in BOP), and send the appropriate revisions and correction to EUROSTAT via the normal transmission programme. Missing or not reported data should be sent to EUROSTAT.
While for most countries the differences between BOP and RoW data are much lower than they used to be in the past, few countries still show significant discrepancies that they should appropriately address.
Taken into account the benefices in reducing discrepancies revealed by the past and present round EUROSTAT propose to maintain and redo the survey on regular basis, the date of the next round being in 2017.
Members of BOP WG are invited:
1) To comment on the results of the survey and to provide feedback on projects for addressing the eventual large discrepancies observed.
2) To confirm that mid-summer is the favoured time for FA part of the BOP/RoW survey.
3) To discuss the survey necessity and its next round date.
24
Annex B: Analysis of the annual discrepancy average
Goods CreditsMS Absolute Yearly
average of discrepancy
Relative variation of yearly average (2010
BPM5=100%)2010
BPM52010
BPM62013
BPM62010
BPM62013
BPM6GR 3367 5955 6994 176.86% 207.74%FR 2793 6606 6439 236.51% 230.53%AT 3559 3450 2250 96.95% 63.22%PT 1761 1803 1934 102.37% 109.85%BE 2777 2444 1607 88.00% 57.87%SE 1008 1780 1530 176.59% 151.74%LU 247 790 1350 319.73% 546.11%FI 67 680 682 1017.82% 1021.36%HU 507 596 491 117.64% 96.90%SK 144 n.a 437 n.a 302.64%RO 7 0 335 0.88% 4583.08%PL 3 144 256 5133.94% 9137.35%DE 52 2 198 4.33% 380.90%EE 358 87 144 24.34% 40.07%MT 1 n.a 102 n.a 12707.78%CZ 4722 146 92 3.09% 1.95%DK 33 0 43 0.00% 128.46%SI 0 6 5 1627.84% 1302.27%IT 580 1 1 0.09% 0.20%LV 1 1 1 76.57% 68.30%ES 491 0 0 0.05% 0.08%LT 0 0 0 n.a. n.a.GB 330 0 0 0.00% 0.00%NL 4805 0 0 0.00% 0.00%BG 715 n.a. n.a. n.a. n.a.CY 5 n.a. n.a. n.a. n.a.HR n.a. n.a. n.a. n.a. n.a.IE 468 n.a. n.a. n.a. n.a.
25

Goods DebitsMS Absolute Yearly
average of discrepancy
Relative variation of yearly average (2010
BPM5=100%)2010
BPM52010
BPM62013
BPM62010 BPM6 2013
BPM6GR 9130 9071 8739 99.35% 95.72%FR 4149 5461 4760 131.62% 114.71%BE 3037 1520 2853 50.04% 93.96%DK 1644 1741 1935 105.91% 117.68%AT 3525 2030 1322 57.58% 37.51%PT 876 1153 1301 131.60% 148.50%SE 693 1326 1121 191.40% 161.79%PL 944 688 1029 72.84% 109.03%FI 32 772 796 2379.25% 2450.73%HU 268 669 535 249.38% 199.50%RO 14 480 463 3362.70% 3241.07%SI 25 40 164 161.20% 660.91%DE 1579 53 145 3.33% 9.20%SK 303 n.a. 138 n.a. 45.57%LU 165 121 120 73.33% 72.92%LV 1 82 75 10930.20% 9950.51%MT 8 n.a. 40 n.a. 484.85%EE 350 16 18 4.47% 5.04%LT 6 7 5 106.88% 75.02%IT 640 1 2 0.12% 0.36%ES 565 0 0 0.06% 0.06%NL 1775 0 0 0.00% 0.02%CZ 3694 0 0 0.00% 0.00%GB 370 0 0 0.00% 0.00%BG 594 n.a. n.a. n.a. n.a.CY 80 n.a. n.a. n.a. n.a.HR n.a. n.a. n.a. n.a. n.a.IE 344 n.a. n.a. n.a. n.a.
26
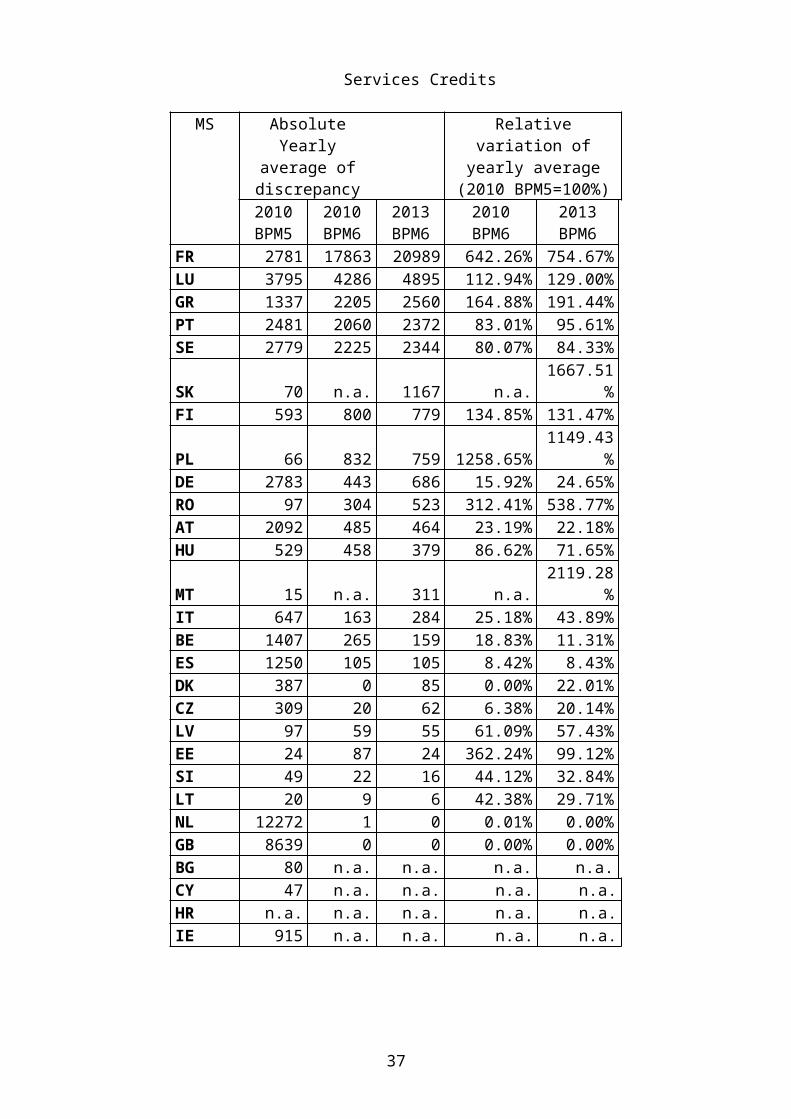
Services Credits
MS Absolute Yearly average of
discrepancy
Relative variation of yearly average (2010
BPM5=100%)2010
BPM52010
BPM62013
BPM62010 BPM6 2013
BPM6FR 2781 17863 20989 642.26% 754.67%LU 3795 4286 4895 112.94% 129.00%GR 1337 2205 2560 164.88% 191.44%PT 2481 2060 2372 83.01% 95.61%SE 2779 2225 2344 80.07% 84.33%SK 70 n.a. 1167 n.a. 1667.51%FI 593 800 779 134.85% 131.47%PL 66 832 759 1258.65% 1149.43%DE 2783 443 686 15.92% 24.65%RO 97 304 523 312.41% 538.77%AT 2092 485 464 23.19% 22.18%HU 529 458 379 86.62% 71.65%MT 15 n.a. 311 n.a. 2119.28%IT 647 163 284 25.18% 43.89%BE 1407 265 159 18.83% 11.31%ES 1250 105 105 8.42% 8.43%DK 387 0 85 0.00% 22.01%CZ 309 20 62 6.38% 20.14%LV 97 59 55 61.09% 57.43%EE 24 87 24 362.24% 99.12%SI 49 22 16 44.12% 32.84%LT 20 9 6 42.38% 29.71%NL 12272 1 0 0.01% 0.00%GB 8639 0 0 0.00% 0.00%BG 80 n.a. n.a. n.a. n.a.CY 47 n.a. n.a. n.a. n.a.HR n.a. n.a. n.a. n.a. n.a.IE 915 n.a. n.a. n.a. n.a.
27
Services debits
MS Absolute Yearly average of
discrepancy
Relative variation of yearly average (2010 BPM5=100%)
2010 BPM5
2010 BPM6
2013 BPM6
2010 BPM6 2013 BPM6
FR 2301 12093 13587 525.46% 590.39%LU 5704 5586 6806 97.94% 119.33%SE 3402 3666 3847 107.75% 113.08%DK 884 1741 1949 196.88% 220.42%PT 1179 1080 1164 91.57% 98.71%SK 77 n.a. 791 n.a. 1029.84%BE 1792 949 761 52.95% 42.47%FI 130 682 631 523.82% 484.38%IT 915 651 625 71.22% 68.29%AT 260 511 495 196.33% 190.32%RO 16 510 393 3243.97% 2499.24%PL 247 248 298 100.43% 120.70%HU 423 284 231 67.02% 54.65%ES 1641 200 193 12.22% 11.76%MT 8 n.a. 159 n.a. 2062.49%GR 1077 242 123 22.47% 11.46%SI 32 27 29 83.13% 91.60%LV 71 18 24 24.89% 34.50%CZ 596 0 19 0.00% 3.26%DE 1924 5 9 0.27% 0.46%EE 24 12 7 49.16% 29.31%LT 34 3 2 7.92% 5.57%NL 14560 1 1 0.01% 0.00%GB 3749 0 0 0.00% 0.00%BG 136 n.a. n.a. n.a. n.a.CY 70 n.a. n.a. n.a. n.a.HR -1 n.a. n.a. n.a. n.a.IE 792 n.a. n.a. n.a. n.a.
28
Compensation of employees credit
MS Absolute Yearly average of
discrepancy
Relative variation of yearly average (2010 BPM5=100%)
2010 BPM5
2010 BPM6
2013 BPM6
2010 BPM6 2013 BPM6
SE 0 1930 2122 n.a. n.a.FR 617 886 865 143.47% 140.21%DE 735 580 538 78.94% 73.29%RO 1 590 532 62713.84% 56566.19%HU 291 288 231 99.17% 79.33%BE 81 56 88 69.34% 108.18%FI 39 45 45 115.92% 115.34%LT 23 33 23 142.16% 99.51%SK 375 n.a. 15 n.a. 4.00%CZ 164 13 14 7.89% 8.64%DK 76 0 11 0.00% 14.23%MT 1 n.a. 1 n.a. 182.90%EE 4 1 1 17.81% 16.37%AT 23 1 1 2.86% 2.38%LV 1 0 0 71.89% 79.67%ES 1 0 0 45.83% 36.67%GR 0 1 0 258.22% 103.29%IT 433 0 0 0.06% 0.05%GB 0 0 0 0.00% 0.00%NL 265 0 0 0.00% 0.00%PL 9 0 0 0.00% 0.00%PT 0 0 0 0.00% 0.00%SI 0 0 0 0.00% 0.00%BG 163 n.a. n.a. n.a. n.a.CY 69 n.a. n.a. n.a. n.a.HR n.a. n.a. n.a. n.a. n.a.IE 1 n.a. n.a. n.a. n.a.LU 14 n.a. n.a. n.a. n.a.
29
Compensation of employees debit
MS Absolute Yearly average of
discrepancy
Relative variation of yearly average (2010 BPM5=100%)
2010 BPM5
2010 BPM6
2013 BPM6
2010 BPM6 2013 BPM6
DE 1310 847 822 64.69% 62.77%BE 283 239 271 84.66% 96.08%HU 132 130 104 98.18% 78.54%FR 19 86 101 460.95% 545.06%GR 59 79 87 133.53% 147.99%SK 53 n.a 71 n.a 133.83%CZ 139 29 71 20.90% 51.06%SE 0 67 54 185948.97% 151031.59%RO 1 42 45 4802.56% 5115.97%FI 17 25 39 147.81% 231.84%LT 9 11 8 121.99% 85.45%MT 0 n.a 1 n.a 3734.31%EE 2 1 1 29.07% 35.64%DK 23 0 1 0.00% 2.61%AT 18 1 1 3.54% 3.07%LV 1 1 1 42.81% 42.43%ES 1 0 0 45.83% 36.67%IT 41 0 0 0.41% 0.33%GB 1 0 0 0.00% 0.00%NL 177 0 0 0.00% 0.00%PL 43 0 0 0.00% 0.00%PT 0 0 0 0.00% 0.00%SI 2 0 0 0.00% 0.00%BG 0 n.a n.a n.a n.aCY 58 n.a n.a n.a n.aHR -1 n.a n.a n.a n.aIE 1 n.a n.a n.a n.aLU 64 n.a n.a n.a n.a
30
Investment Income D4 credit
MS Absolute Yearly average of
discrepancy
Relative variation of yearly average (2010 BPM5=100%)
2010 BPM5
2010 BPM6
2013 BPM6
2010 BPM6
2013 BPM6
NL 77127 4111 11127 5.33% 14.43%FR 3505 2242 2819 63.97% 80.42%BE 665 523 1503 78.58% 225.86%DE 2401 1154 1173 48.06% 48.84%PT 412 734 704 178.21% 170.92%ES 1771 648 620 36.60% 35.01%IT 7556 421 420 5.57% 5.56%FI 474 229 404 48.25% 85.07%SE 288 41 336 14.37% 116.70%DK 270 4 327 1.62% 121.17%MT -1 n.a. 239 n.a. -23888.05%PL 79 136 237 170.98% 298.77%AT 726 200 182 27.57% 25.10%CZ 42 177 148 425.35% 354.97%RO 28 164 146 587.33% 525.26%HU 2488 59 48 2.37% 1.93%GR 546 28 48 5.13% 8.72%LV 17 57 47 327.81% 271.48%LT 8 51 44 650.39% 560.36%SI 35 42 38 120.56% 107.93%SK 45 n.a. 16 n.a. 34.73%EE 11 7 7 63.31% 61.02%GB 1166 0 0 0.00% 0.00%BG 13 n.a. n.a. n.a. n.a.CY 62 n.a. n.a. n.a. n.a.HR -1 n.a. n.a. n.a. n.a.IE 539 n.a. n.a. n.a. n.a.LU 12604 n.a. n.a. n.a. n.a.
31
Investment Income D4 debit
MS Absolute Yearly average of discrepancy
Relative variation of yearly average (2010
BPM5=100%)2010
BPM52010
BPM62013
BPM62010
BPM62013 BPM6
NL 73556 4676 9772 6.36% 13.29%BE 636 532 4405 83.64% 692.59%FR 3470 3653 4174 105.27% 120.29%CZ 147 2780 2135 1887.44% 1449.53%PT 91 568 710 624.37% 780.95%DE 2257 689 584 30.51% 25.89%IT 2154 436 417 20.22% 19.38%PL 185 601 402 324.33% 217.05%FI 333 232 392 69.64% 117.70%GR 628 225 298 35.83% 47.48%RO 61 292 265 480.97% 436.36%ES 1347 140 232 10.40% 17.24%MT n.a n.a 227 n.a -22718.52%SK 314 n.a 160 n.a 50.89%DK 385 17 156 4.45% 40.40%SE 483 95 132 19.63% 27.39%HU 2600 133 118 5.12% 4.55%AT 1199 98 92 8.17% 7.68%LT 27 47 38 170.26% 138.63%LV 43 28 26 64.35% 60.98%EE 25 10 12 39.29% 47.69%SI 34 3 2 8.93% 6.55%GB 3042 0 0 0.00% 0.00%BG 58 n.a. n.a. n.a. n.a.CY 188 n.a. n.a. n.a. n.a.HR n.a. n.a. n.a. n.a. n.a.IE 447 n.a. n.a. n.a. n.a.LU 12268 n.a. n.a. n.a. n.a.
32

Reinvested Earnings D43 Credit
MS Absolute Yearly average of discrepancy
Relative variation of yearly average (2010 BPM5=100%)
2010 BPM5
2010 BPM6
2013 BPM6
2010 BPM6 2013 BPM6
NL 9943 7375 5943 74.17% 59.77%FR 1401 539 1195 38.45% 85.31%AT 228 30 537 13.26% 235.67%BE 0 53 346 18412.90% 119314.49%FI 81 2 310 2.23% 380.42%DK 403 223 298 55.47% 74.14%PT 252 147 169 58.39% 66.85%SE 54 18 50 33.24% 91.74%GR 60 16 35 26.60% 58.19%LT 0 0 7 n.a n.aES 148 1 1 0.90% 0.72%RO 53 1 1 2.62% 1.81%LV 1 0 0 55.03% 58.26%IT 1195 0 0 0.01% 0.02%PL 49 0 0 0.00% 0.37%EE 5 0 0 5.68% 2.91%CZ 2 0 0 1.93% 1.30%SK 27 n.a. 0 n.a. 0.05%HU 1536 0 0 0.00% 0.00%DE 5 0 0 0.00% 0.00%GB 3434 0 0 0.00% 0.00%SI 0 0 0 0.00% 0.00%BG 1 n.a. n.a. n.a. n.a.CY 71 n.a. n.a. n.a. n.a.HR n.a. n.a. n.a. n.a. n.a.IE 5 n.a. n.a. n.a. n.a.LU 1890 n.a. n.a. n.a. n.a.MT n.a. n.a. n.a. n.a. n.a.
33

Reinvested Earnings D43 Debit
MS Absolute Yearly average of discrepancy
Relative variation of yearly average (2010
BPM5=100%)2010
BPM52010
BPM62013
BPM62010
BPM62013
BPM6NL 18409 6918 8180 37.58% 44.44%
CZ 25 1585 13406411.64
% 5418.70%FR 1936 525 853 27.12% 44.06%BE 94 255 605 272.78% 646.71%PT 0 346 492 n.a n.aAT 786 119 381 15.14% 48.54%DK 281 1 336 0.25% 119.65%FI 251 2 223 0.75% 88.88%SK 258 n.a. 60 n.a. 23.45%GR 302 25 50 8.10% 16.53%RO 282 14 17 4.79% 5.95%LT 0 1 2 n.a. n.a.EE 10 1 1 9.06% 10.77%LV 1 1 0 67.63% 63.43%IT 265 0 0 0.13% 0.17%ES 91 0 0 0.37% 0.29%SE 189 0 0 0.10% 0.10%PL 53 0 0 0.00% 0.11%HU 1097 0 0 0.00% 0.00%DE 6 0 0 0.00% 0.00%GB 505 0 0 0.00% 0.00%SI 0 0 0 0.00% 0.00%BG 29 n.a. n.a. n.a. n.a.CY 132 n.a. n.a. n.a. n.a.HR n.a. n.a. n.a. n.a. n.a.IE 337 n.a. n.a. n.a. n.a.LU 9954 n.a. n.a. n.a. n.a.MT n.a. n.a. n.a. n.a. n.a.
34

Capital Account total credit
MS Absolute Yearly average of
discrepancy
Relative variation of yearly average (2010
BPM5=100%)2010
BPM52010
BPM62013
BPM62010
BPM62013
BPM6GR 1025 1079 1288 105.23% 125.66%CZ 307 1070 1212 348.26% 394.49%PL 1034 729 1150 70.52% 111.22%FR 274 589 616 214.80% 224.65%NL 396 203 217 51.27% 54.81%DE 101 199 202 197.44% 200.56%IT 280 137 92 48.85% 32.77%BE 492 108 90 21.93% 18.35%SK 130 n.a. 80 n.a. 61.04%GB 785 16 72 2.08% 9.23%SE 41 66 72 162.29% 176.40%HU 140 63 63 45.19% 44.96%SI 11 25 50 219.19% 434.87%FI 15 10 10 67.80% 65.19%AT 140 1 9 0.42% 6.59%PT 424 3 9 0.73% 2.14%EE 15 1 3 7.72% 21.55%LV 1 1 1 161.16% 177.36%ES 462 0 0 0.05% 0.07%DK 78 0 0 0.14% 0.19%RO 140 0 0 0.09% 0.06%LT 83 0 0 0.02% 0.01%BG 3 n.a. n.a. n.a. n.a.CY 5 n.a. n.a. n.a. n.a.HR n.a. n.a. n.a. n.a. n.a.IE 310 n.a. n.a. n.a. n.a.LU 209 n.a. n.a. n.a. n.a.MT n.a. n.a. n.a. n.a. n.a.
35

Capital Account total debit
MS Absolute Yearly average of
discrepancy
Relative variation of yearly average (2010 BPM5=100%)
2010 BPM5
2010 BPM6
2013 BPM6
2010 BPM6 2013 BPM6
FR 443 616 808 138.99% 182.23%DE 273 626 769 229.67% 282.11%PL 2 376 461 16337.33% 20039.20%NL 767 408 246 53.12% 32.03%ES 357 243 199 67.89% 55.71%BE 763 194 164 25.39% 21.47%CZ 245 14 137 5.59% 56.00%IT 493 163 132 33.05% 26.67%SK 107 n.a. 117 n.a. 109.05%SE 29 108 101 376.98% 351.36%PT 98 39 52 40.02% 53.32%HU 139 26 34 18.89% 24.27%AT 149 1 26 0.40% 17.37%LT 7 11 12 171.43% 179.80%GR 72 15 9 20.73% 11.88%EE 3 0 3 11.60% 103.59%FI 1 1 1 101.12% 98.93%LV 1 1 1 50.96% 58.22%SI 5 1 1 21.54% 12.92%RO 67 0 0 0.28% 0.19%DK 78 0 0 0.09% 0.10%GB 818 0 0 0.00% 0.00%BG 0 n.a. n.a. n.a. n.a.CY 1 n.a. n.a. n.a. n.a.HR n.a. n.a. n.a. n.a. n.a.IE 310 n.a. n.a. n.a. n.a.LU 139 n.a. n.a. n.a. n.a.MT n.a. n.a. n.a. n.a. n.a.
36
ANNEX C: BOP-ROW differences by Member State: total value and main reasons provided
37
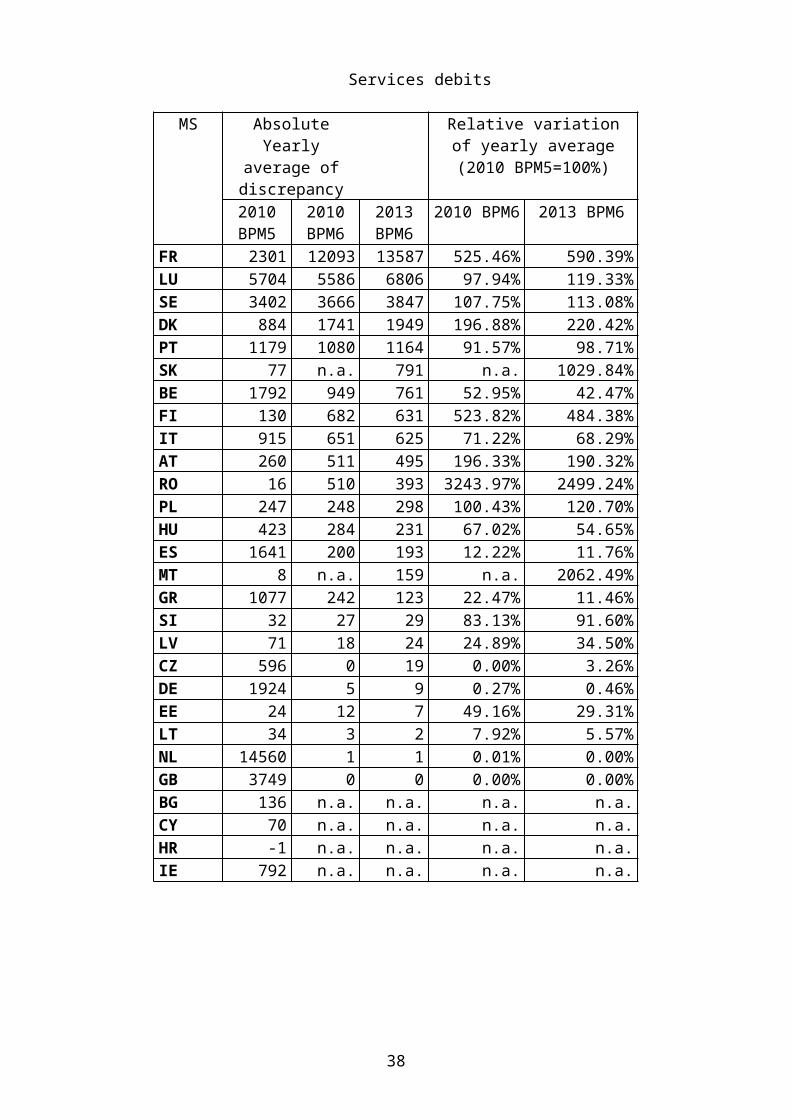
Table A1 – Goods – BOP Credits minus RoW Uses BoP/RoW survey November 2014 CA + KATable 1B - Goods - Credits/Uses/Exports
MS 1999 2000 2001 2002 2003 2004 2005 2006 2007 2008 2009 2010 2011 2012 2013 Total MS ABS(Total) Main ReasonEU 28 -7,092 -8,524 -8,966 -8,941 -11,077 -15,073 -10,739 -8,057 -8,097 -10,320 -17,636 -20,022 -18,905 -21,415 -18,448 -193,311 EU 28 233865.79FR -4,861 -6,924 -7,265 -6,771 -3,850 -6,418 -5,859 -4,842 -7,508 -8,495 -9,037 -7,443 -5,653 -5,077 -6,583 -96,586 FR 96586.00 Unexplained differenceGR : : : : : : : : : : -5,245 -6,664 -7,106 -8,180 -7,777 -34,972 GR 34972.00 10. Different data sources usedPT -1,514 -1,692 -1,660 -1,772 -1,743 -1,518 -1,612 -2,058 -1,920 -1,855 -2,181 -2,105 -2,179 -2,617 -2,586 -29,012 PT 29012.00 5 Reclassif. from services to goodsLU : 175 -9 121 -101 -256 -49 -992 -1,289 -1,833 -1,714 -2,153 -2,653 -3,350 -4,200 -18,302 LU 18302.00 76 Net X of goods under merchanting (CN-BOP)AT : : : : : : : 3,201 4,836 4,755 4,456 -1 1 0 -749 16,500 AT 16499.90 1 Compilation practicesBE : : : : : : : : : -3,375 -3,644 -313 -1,640 -553 119 -9,406 BE 9405.90 11 Balancing of accountsFI -1,056 192 319 38 -338 -706 -704 -1,267 -1,099 -890 -650 -901 -1,275 -495 -306 -9,138 FI 9137.74 5 Reclassification from services to goodsSE : : : : -4,103 -5,311 -1,357 -1,097 373 1,361 528 -111 1,631 812 -141 -7,415 SE 7415.03 91 CIF/FOB to invoice based approachHU 341 -271 -348 -558 -942 -862 -1,153 -1,001 -1,488 71 61 62 72 69 71 -5,874 HU 5873.93 1 Compilation practicesDE -3 -2 -3 -1 -1 -1 -5 -2 -2 -1 -5 1 1 -3 2,940 2,913 DE 2913.00 9 Vintage and revision differencesRO : : : : : : : : : 0 0 0 0 -1,676 : -1,676 RO 1676.17 13 Mistakes detected in RoW data CZ : : : : : : : : : -58 -207 -172 -115 0 0 -552 CZ 551.73 1 Compilation practicesSK : : : : : : : : : : : : : : 437 437 SK 436.65 1 Compilation practicesEE : : : : : : : : : : : -87 187 234 66 400 EE 399.78 13 Mistakes detected in RoW dataDK : : : : : : 0 0 0 0 0 0 0 -274 -113 -387 DK 386.82 9 Vintage and revision differencesMT : : : : : : : : : : : : : -98 -106 -204 MT 204.17 Unexplained differencePL : : : : : : : : : : : -144 -182 -213 485 -54 PL 53.81 991 llegal conomySI : : : : : : : : : : 4 8 3 7 2 24 SI 24.00 Unexplained differenceIT 1 -1 0 0 0 -1 0 0 -1 -1 0 -1 2 -1 -8 -11 IT 11.00 Unexplained differenceES 0 0 1 0 0 1 0 0 0 0 0 1 1 -1 1 4 ES 4.00 Unexplained differenceLV : 0 0 1 1 -1 0 0 1 1 -1 0 0 0 0 0 LV 0.12 Unexplained differenceLT : : : : : 0 0 0 0 0 0 0 0 0 0 0 LT 0.03 No differenceGB 0 0 0 0 0 0 0 0 0 0 0 0 0 0 0 0 GB 0.00 No differenceNL : : : : : : : : : 0 0 0 0 0 0 0 NL 0.00 No differenceBG : : : : : : : : : : : : : : : 0 BG 0.00 No dataCY 0 CY 0.00 No dataHR 0 HR 0.00 No dataIE 0 IE 0.00 No data
Table A2 – Goods – BOP Debits minus RoW Resources BoP/RoW survey November 2014 CA + KATable 1C - Goods - debits/resources
MS 1999 2000 2001 2002 2003 2004 2005 2006 2007 2008 2009 2010 2011 2012 2013 Total MS ABS(Total) Main ReasonEU 28 -8,714 -9,088 -7,876 -8,203 -6,524 -10,073 -10,909 -8,004 -7,088 65 -13,268 -12,230 -8,262 -12,370 -14,746 -137,290 EU 28 220699.10FR -7,398 -7,954 -6,533 -6,305 -4,885 -7,382 -6,575 -4,505 -6,981 -2,997 -3,820 -199 -121 -897 -4,841 -71,393 FR 71393.00 Unexplained differenceGR : : : : : : : : : : -9,551 -8,590 -5,977 -9,654 -9,924 -43,696 GR 43696.00 10. Different data sources usedPT -881 -1,016 -991 -870 -747 -921 -1,148 -1,245 -1,350 -1,318 -1,522 -1,830 -1,791 -1,871 -2,020 -19,521 PT 19521.00 1 Compilation practicesDK : : : : : : -1,558 -1,771 -1,904 -1,998 -1,501 -1,715 -1,967 -2,519 -2,478 -17,411 DK 17411.33 78 Cif-fob adjustmentBE : : : : : : : : : 2,639 499 1,421 2,979 4,355 5,228 17,121 BE 17120.60 12 (transit trade natural gaz)SE : : : : 358 277 917 682 3,142 2,252 1,771 1,212 905 627 190 12,333 SE 12333.29 78 Cif-fob adjustmentFI -745 -35 -51 -271 -627 -746 -748 -1,495 -1,335 -1,087 -1,021 -1,107 -1,101 -618 -946 -11,933 FI 11932.60 5 Reclassification from services to goodsAT : : : : : : : 1,758 2,988 3,018 2,384 -1 -3 0 426 10,570 AT 10569.80 1 Compilation practicesHU 310 -230 -398 -787 -695 -1,192 -1,466 -1,318 -1,603 0 0 -29 0 0 0 -7,409 HU 7408.53 1 Compilation practicesPL : : : : : : : : : : : -688 -1,023 -1,196 -1,210 -4,117 PL 4117.08 994 llegal conomyRO : : : : : : : : : -400 -399 -641 -411 -462 : -2,314 RO 2313.97 991 - illegal economyLV : -64 -62 -62 -72 -75 -108 -109 -120 -122 -55 -54 -69 -74 0 -1,046 LV 1046.07 991 Illegal EconomyLU : 213 160 96 145 -20 -121 110 198 184 42 45 99 -28 -227 895 LU 895.00 99 unexpl diff under the limitsDE 2 -1 0 -5 -2 -2 -90 -100 -108 -106 -93 -121 -121 -125 1,302 430 DE 430.00 9 Vintage and revision differencesSI : : : : : : : : : : 0 80 286 133 -321 178 SI 178.00 1 Compilation practicesSK : : : : : : : : : : : : : : 138 138 SK 138.09 99 other non identifiedMT : : : : : : : : : : : : : -40 -40 -80 MT 79.68 Unexplained differenceLT : : : : : -11 -11 -12 -14 0 0 0 0 0 0 -48 LT 48.25 1 Compilation practicesEE : : : : : : : : : : : -16 53 0 2 39 EE 38.71 12 Mistakes detected in BoP dataIT -2 0 -1 1 0 -1 -1 1 0 0 -1 1 -1 1 -24 -27 IT 27.00 Unexplained differenceES 0 0 0 0 0 1 0 0 0 -1 0 2 0 0 -1 1 ES 1.00 Unexplained differenceCZ : : : : : : : : : 0 0 0 0 0 0 0 CZ 0.12 99-roundingNL : : : : : : : : : 0 0 0 1 -1 0 0 NL 0.00 99 Rounding differencesGB 0 0 0 0 0 0 0 0 0 0 0 0 0 0 0 0 GB 0.00 No differenceBG : : : : : : : : : : : : : : : 0 BG 0.00 No dataCY 0 CY 0.00 No dataHR 0 HR 0.00 No dataIE 0 IE 0.00 No data
38

Table A3 – Services – BOP Credits minus RoW UsesBoP/RoW survey November 2014 CA + KATable 1B - Services- Credits/Uses/Exports
MS 1999 2000 2001 2002 2003 2004 2005 2006 2007 2008 2009 2010 2011 2012 2013 Total MS ABS(Total) Main ReasonEU 28 21,113 11,888 15,690 18,647 12,251 11,711 15,006 17,480 15,981 16,448 15,718 15,780 18,726 34,037 37,137 277,612 EU 28 492298.96FR 21,111 12,054 15,524 18,608 13,546 13,159 15,462 19,154 20,379 23,386 19,259 22,714 24,756 37,672 38,056 314,840 FR 314840.00 Unexplained differenceLU : -2,557 -2,327 -2,363 -2,525 -2,795 -3,423 -4,109 -5,259 -8,205 -5,776 -7,811 -7,946 -6,821 -6,622 -68,536 LU 68536.30 77 Financial Services excluding FISIM (CN BOP)PT 1,592 1,917 1,912 1,915 1,907 1,803 1,932 2,175 2,410 2,403 2,255 2,493 3,369 3,502 3,998 35,583 PT 35583.00 5 Reclassif from services to goodsSE : : : : -2,292 -2,385 -1,563 -1,394 -1,500 -2,613 -2,727 -3,327 -3,573 -4,097 309 -25,162 SE 25162.27 4 Reclassification from goods to servicesGR : : : : : : : : : : 2,306 2,104 2,682 2,718 2,991 12,801 GR 12801.00 5 Reclassification from Services to GoodsDE 0 -3 -1 -1 -4 -4 -5 -4 -1,941 -428 -1,514 -1,413 -984 -1,655 -2,334 -10,291 DE 10291.00 9 Vintage and revision differences FISIMFI -1,152 526 523 475 507 679 673 1,207 1,035 913 906 1,000 1,026 852 -220 8,948 FI 8948.35 5 Reclassification from services to goodsIT 4 5 6 4 2 1 1 2 112 209 898 712 976 755 574 4,261 IT 4261.00 1 Compilation practicesPL : : : : : : : : : : : -832 -859 -958 -390 -3,038 PL 3037.75 10 Different data sources used HU -517 -55 -98 -38 1,033 1,118 1,739 -296 -395 -71 -61 -79 -72 44 -71 2,181 HU 2181.23 1 Compilation practicesES 75 -13 142 48 81 139 214 -7 -56 -62 -6 420 314 1 2 1,292 ES 1292.00 6 Insurance SK : : : : : : : : : : : : : : 1,167 1,167 SK 1166.87 9 Vintage and revision differencesAT : : : : : : : 727 1,066 268 350 14 -707 -271 -307 1,140 AT 1140.30 1 Compilation PracticesBE : : : : : : : : : 659 94 -42 8 -28 124 815 BE 814.60 9 Vintage and revision differencesMT : : : : : : : : : : : : : 289 333 621 MT 621.45 Unexplained differenceLV : 14 9 -2 -4 5 -8 42 147 189 147 82 33 -5 -90 560 LV 560.02 2 FISIM allocationDK : : : : : : 0 0 0 0 0 0 0 619 -147 472 DK 471.82 9 Vintage and revision differencesCZ : : : : : : : : : -31 0 27 30 40 -245 -178 CZ 178.13 1 Compilation PracticesRO : : : : : : : : : -171 -393 -347 -309 1,397 : 177 RO 177.29 6 InsuranceEE : : : : : : : : : : : 87 0 0 7 94 EE 94.40 13 Mistakes detected in RoW dataSI : : : : : : : : : : -22 -21 -18 -18 1 -78 SI 78.00 1 Compilation practicesLT : : : : : -9 -16 -18 -17 0 0 0 0 0 0 -60 LT 60.19 1 Compilation practicesNL : : : : : : : : : 1 1 0 0 0 0 2 NL 2.00 99 Rounding differencesGB 0 0 0 0 0 0 0 0 0 0 0 0 0 0 0 0 GB 0.00 No differenceBG : : : : : : : : : : : : : : : 0 BG 0.00 No dataCY 0 CY 0.00 No dataHR 0 HR 0.00 No dataIE 0 IE 0.00 No data
Table A4 – Services - BOP Debits minus Row ResourcesBoP/RoW survey November 2014 CA + KATable 1B - Services debits/resources
MS 1999 2000 2001 2002 2003 2004 2005 2006 2007 2008 2009 2010 2011 2012 2013 Total MS ABS(Total) Main ReasonEU 28 21,044 15,517 15,149 13,987 6,747 5,792 7,455 6,750 365 1,725 3,359 688 -2,389 11,670 17,888 125,746 EU 28 409537.63FR 18,981 15,337 14,376 15,611 11,333 10,542 9,152 9,800 7,777 11,836 10,072 10,302 7,266 22,186 29,240 203,811 FR 203811.00 Unexplained differenceLU : -1,751 -1,710 -3,341 -3,551 -3,736 -3,349 -5,469 -8,858 -11,664 -8,177 -9,841 -10,347 -11,256 -12,235 -95,285 LU 95284.50 77 Financial Services excluding FISIM (CN BOP)SE : : : : -3,329 -3,690 -3,406 -3,262 -4,017 -4,413 -3,120 -4,087 -4,269 -4,705 -4,019 -42,317 SE 42316.78 Unexplained differenceDK : : : : : : 1,559 1,771 1,904 1,998 1,501 1,715 1,966 3,052 2,080 17,545 DK 17545.36 78 cif fob correction PT 799 1,018 984 849 796 952 1,022 1,230 1,332 1,262 1,292 1,421 1,662 1,390 1,451 17,460 PT 17460.00 5 Reclassif from services to goodsFI 732 508 455 258 285 492 536 1,278 1,045 835 812 947 938 272 -66 9,327 FI 9326.61 5 Reclassification from services to goodsIT 794 332 895 794 620 526 972 1,336 766 778 2 -2 3 -2 -1,548 6,266 IT 6266.00 1 Compilation practicesBE : : : : : : : : : 1,203 1,222 422 607 173 940 4,567 BE 4567.10 11 Balancing of accountsAT : : : : : : : 374 854 420 586 320 41 262 1,104 3,961 AT 3961.10 Unexplained differenceHU -402 -12 -4 -9 796 903 1,094 -64 -95 -16 -8 0 0 66 0 2,249 HU 2249.28 1 Compilation practicesRO : : : : : : : : : -424 -444 -661 -432 -2 : -1,963 RO 1963.21 13 Mistakes detected in RoW data ES 140 95 140 -187 -218 -194 -134 -248 -316 -53 -488 192 -430 31 29 -1,641 ES 1641.00 1 1 Compilation practices (*)PL : : : : : : : : : : : 248 656 174 112 1,190 PL 1190.21 10 Different data sources used SK : : : : : : : : : : : : : : 791 791 SK 791.13 9 Vintage and revision differencesGR : : : : : : : : : : 145 -339 -76 -39 -18 -327 GR 327.00 2 FISIM AllcationMT : : : : : : : : : : : : : 123 196 319 MT 318.96 Unexplained differenceSI : : : : : : : : : : -28 -25 -33 -39 -21 -146 SI 146.00 1 Compilation practicesLV : 14 14 11 14 7 14 12 -8 -31 -9 59 54 36 -59 128 LV 128.47 2 FISIM allocationCZ : : : : : : : : : 0 0 0 0 0 -116 -116 CZ 116.40 13 Mistakes detected in RoW data DE 0 -25 -1 0 1 -3 0 -3 -14 -8 3 4 6 -53 12 -81 DE 81.00 9 Vintage and revision differences FISIMEE : : : : : : : : : : : 12 -1 1 15 27 EE 26.82 12 Mistakes detected in BoP dataLT : : : : : -7 -5 -4 -4 0 0 0 0 0 0 -19 LT 18.70 1 Compilation practicesNL : : : : : : : : : 1 -2 0 0 0 0 -1 NL 1.00 99 Rounding differencesGB 0 0 0 0 0 0 0 0 0 0 0 0 0 0 0 0 GB 0.00 No differenceBG : : : : : : : : : : : : : : : 0 BG 0.00 No dataCY 0 CY 0.00 No dataHR 0 HR 0.00 No dataIE 0 IE 0.00 No data
39
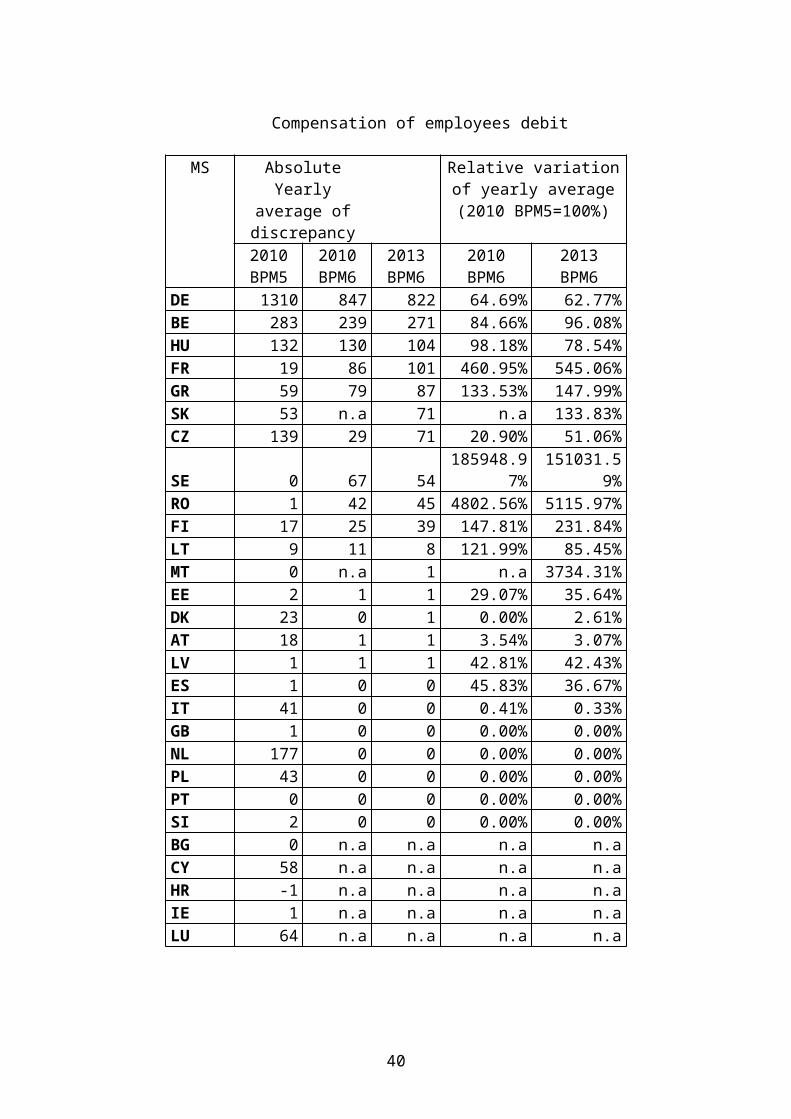
Table A5 –SG2 FISIM - CreditsBoP/RoW survey November 2014 CA + KATable 1B -FISIM- Credits/Uses/Exports
MS 1999 2000 2001 2002 2003 2004 2005 2006 2007 2008 2009 2010 2011 2012 2013 Total MS ABS(Total) Main ReasonEU 28 -44 -59 -64 -57 -55 -47 -42 -379 -2,260 -4,276 -5,355 -6,935 -4,937 -1,124 -341 -25,974 EU 28 36069.97FR : : : : : : : : : -2,477 -2,306 -3,916 -3,880 622 63 -11,894 FR 11894.00 Unexplained differenceDE 0 -2 0 0 0 0 0 0 -1,938 -424 -1,514 -1,411 -980 -1,653 -2,334 -10,256 DE 10256.00 9 Vintage and revision differencesNL : : : : : : : : : -1,118 -1,866 -1,997 -878 -722 295 -6,286 NL 6286.00 12 Mistakes detected in BoP dataIT : : : : : 2 1 2 113 210 898 714 972 755 297 3,964 IT 3964.00 1 Compilation practicesSE : : : : : : : -340 -367 -351 -603 -410 -337 -388 1,049 -1,746 SE 1746.00 994 data not reported 93 No estimation of FISIM in BoP before 2013HU -45 -58 -64 -56 -56 -50 -44 -43 -68 0 0 0 0 0 0 -483 HU 482.74 2 FISIM allocationPL : : : : : : : : : : : 25 108 226 120 478 PL 477.70 10 Different data sources usedCZ : : : : : : : : : 38 54 93 103 104 69 461 CZ 460.85 1 Compilation practicesRO : : : : : : : : : -155 -18 -34 -43 -67 : -319 RO 318.68 12 Mistakes detected in BoP data FI : : : : : : : : : : : : : : 136 136 FI 136.02 Unexplained differenceLV : : : : : : : : : : : : : : -30 -30 LV 30.48 2 FISIM allocationSK : : : : : : : : : : : : : : -8 -8 SK 8.00 9 Vintage and revision differencesES 1 0 0 0 0 1 1 1 0 0 1 1 0 0 2 8 ES 8.00 Unexplained differenceEE : : : : : : : : : : : 1 0 0 0 1 EE 0.67 13 Mistakes detected in RoW dataAT : : : : : : : 0 1 0 -1 0 0 -1 1 1 AT 0.60 Unexplained differencePT 0 1 0 -1 1 0 0 0 -1 0 0 0 0 0 0 0 PT 0.18 Unexplained differenceLT : : : : : 0 0 0 0 0 0 0 0 0 0 0 LT 0.05 No differenceSI : : : : : : : : : : 0 0 0 0 0 0 SI 0.00 No differenceBE : : : : : : : : : : : : : : : 0 BE 0.00 No differenceBG : : : : : : : : : : : : : : : 0 BG 0.00 No data
CY 0 CY 0.00 No data
DK : : : : : : : : : : : : : : : 0 DK 0.00 No differenceGB : : : : : : : : : : : : : : : 0 GB 0.00 No differenceGR : : : : : : : : : : : : : : : 0 GR 0.00 No differenceHR 0 HR 0.00 No dataIE 0 IE 0.00 No dataLU 0 LU 0.00 No dataMT : : : : : : : : : : : : : : : 0 MT 0.00 No difference
Table A6 – FISIM - DebitsBoP/RoW survey November 2014 CA + KATable 1B - FISIM debits/resources
MS 1999 2000 2001 2002 2003 2004 2005 2006 2007 2008 2009 2010 2011 2012 2013 Total MS ABS(Total) Main ReasonEU 28 -10 -9 53 34 20 538 959 829 467 124 -287 78 -920 911 322 3,108 EU 28 20032.21NL : : : : : : : : : 956 1,866 1,981 821 722 -296 6,050 NL 6050.00 12 Mistakes detected in BoP dataFR : : : : : : : : : -1,418 -1,704 -1,803 -1,783 498 699 -5,511 FR 5511.00 Unexplained differenceIT : : : : : 525 973 1,338 769 774 1 1 2 -4 32 4,411 IT 4410.97 1 Compilation practicesSE : : : : : : : -472 -248 -265 -486 -344 -254 -248 49 -2,268 SE 2267.55 994 data not reported ES 7 25 55 42 44 56 38 25 40 101 42 43 35 31 29 613 ES 613.00 2 FISIM allocation S125PL : : : : : : : : : : : 198 255 68 -29 492 PL 491.87 10 Different data sources usedHU -17 -7 -3 -8 -23 -44 -52 -63 -80 -18 -11 0 0 0 0 -328 HU 327.78 2 FISIM allocationFI : : : : : : : : : : : : : : -151 -151 FI 151.00 Unexplained differenceRO : : : : : : : : : : : : : -102 : -102 RO 102.26 12 Mistakes detected in BoP data DE 0 -26 0 0 0 0 0 0 -12 -6 7 4 4 -53 14 -68 DE 68.00 9 Vintage and revision differencesSK : : : : : : : : : : : : : : -25 -25 SK 25.21 9 Vintage and revision differencesCZ : : : : : : : : : 0 0 0 0 0 -5 -5 CZ 5.20 1 Compilation practicesLV : : : : : : : : : : : : : : 4 4 LV 4.40 2 FISIM allocationEE : : : : : : : : : : : -3 1 0 0 -3 EE 2.53 13 Mistakes detected in RoW dataPT 0 -1 1 0 -2 1 0 0 0 0 -1 0 0 -1 1 -1 PT 0.82 Unexplained differenceAT : : : : : : : 2 -2 0 -1 1 0 0 0 -1 AT 0.50 Unexplained differenceLT : : : : : 0 0 0 0 0 0 0 0 0 0 0 LT 0.13 Unexplained differenceSI : : : : : : : : : : 0 0 0 0 0 0 SI 0.00 No difference
BE : : : : : : : : : : : : : : : 0 BE 0.00 No difference
BG : : : : : : : : : : : : : : : 0 BG 0.00 No dataCY 0 CY 0.00 No dataDK : : : : : : : : : : : : : : : 0 DK 0.00 No differenceGB : : : : : : : : : : : : : : : 0 GB 0.00 No differenceGR : : : : : : : : : : : : : : : 0 GR 0.00 No differenceHR 0 HR 0.00 No dataIE 0 IE 0.00 No dataLU 0 LU 0.00 No dataMT : : : : : : : : : : : : : : : 0 MT 0.00 No difference
40
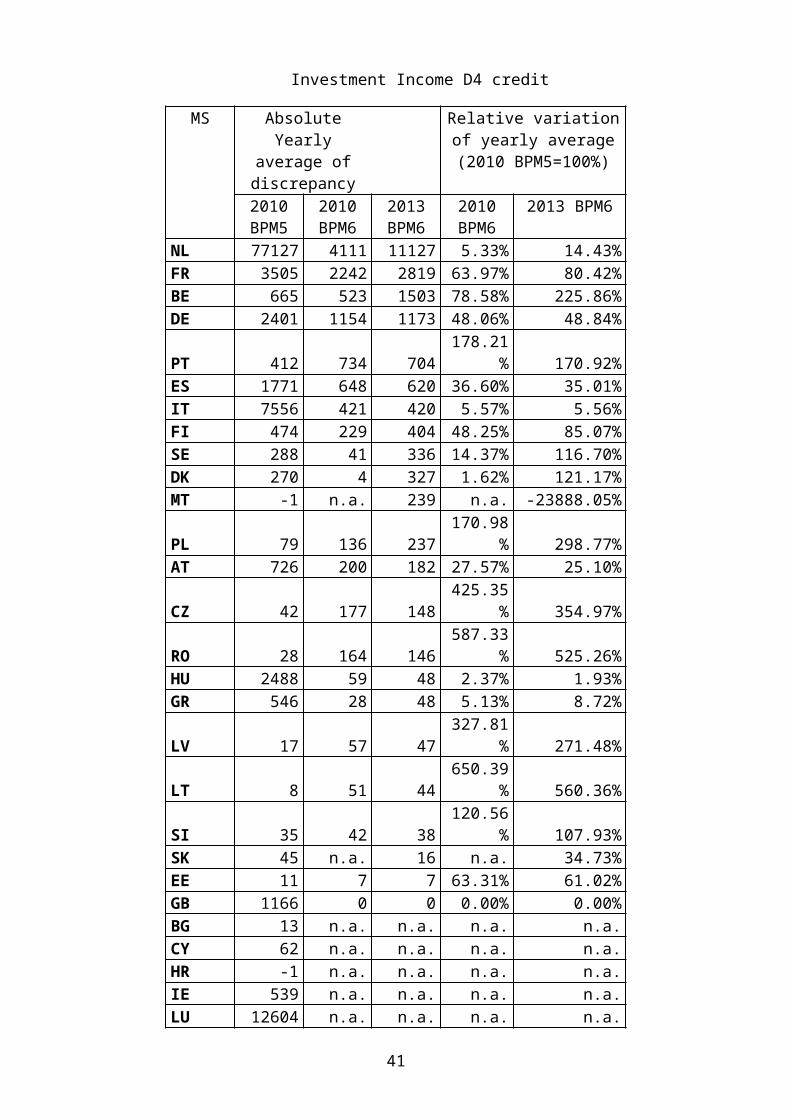
Table A7 – Primary Income CreditsBoP/RoW survey November 2014 CA + KATable 1B -Primary Income- Credits/Uses/Exports
MS 1999 2000 2001 2002 2003 2004 2005 2006 2007 2008 2009 2010 2011 2012 2013 Total MS ABS(Total) Main ReasonEU 28 5,058 6,005 6,480 10,353 11,884 12,541 11,400 9,727 5,213 -4,363 10,377 12,398 -1,437 39,765 44,662 180,063 EU 28 310244.86GB 8,443 8,437 8,616 9,262 9,327 10,164 9,968 9,447 8,627 7,663 7,657 7,132 7,296 6,475 5,782 124,294 GB 124294.28 1 Compilation practicesFR 1,433 1,745 2,024 3,660 5,438 2,835 2,841 1,622 -1,687 -8,502 2,351 9,009 3,078 15,643 6,195 47,685 FR 47684.90 Unexplained differenceNL : : : : : : : : : 3,190 7,862 -1,280 -8,722 14,613 31,095 46,758 NL 46758.00 1 Compilation practicesSE : : : : : : : : : -3,084 -3,217 -3,450 -3,521 -3,728 -5,222 -22,223 SE 22222.92 92 D1 expl diffFI -675 -913 -1,040 -1,058 -1,230 -391 -360 -824 -971 -1,351 -1,177 -1,233 -1,400 -1,413 -2,050 -16,087 FI 16087.11 Unexplained differenceDE -1,411 -877 -1,073 -1,394 -1,989 -1,107 -1,988 -2,290 -944 -2,906 -1,405 -850 -327 2,196 2,342 -14,023 DE 14023.00 Mistakes detected in RoW data PT 226 291 331 242 995 851 512 774 553 776 640 2,470 1,318 71 -334 9,717 PT 9716.54 1 Compilation practicesBE : : : : : : : : : -387 -645 296 462 4,792 3,670 8,188 BE 8187.91 95 D4 Expl diffPL : : : : : : : : : : : 915 954 2,030 925 4,823 PL 4823.34 10 Different data sources usedHU -616 -686 -601 -705 -947 -18 79 -160 -160 2 -1 0 1 -7 2 -3,819 HU 3818.52 10 Different data sources usedES -2,342 -1,973 -1,760 356 299 321 22 394 -502 -627 85 699 598 586 62 -3,782 ES 3782.00 9 Vintage and revisions differencesGR : : : : : : : : : : -912 -713 -475 -22 213 -1,909 GR 1909.00 10 Different data sources usedAT : : : : : : : 297 298 350 -4 204 220 226 211 1,801 AT 1801.40 Unexplained differenceRO : : : : : : : : : 564 -546 -531 -550 -582 : -1,645 RO 1644.96 92 D1 Expl DiffDK : : : : : : -6 0 -20 0 0 0 1 -952 1,867 890 DK 889.84 9 Vintage and revision differencesLT : : : : : -87 -122 -135 -145 -184 -4 -6 -6 -64 121 -632 LT 632.01 9 Vintage and revision differencesLV : -19 -16 -9 -8 -27 -28 -63 -156 -200 -104 3 10 6 18 -593 LV 593.00 2 FISIM allocationSI : : : : : : : : : : 8 49 121 158 207 543 SI 543.00 1 Compilation practicesCZ : : : : : : : : : 12 211 -17 31 24 134 395 CZ 395.36 Mistakes detected in BoP data MT : : : : : : : : : : : : : 125 -355 -230 MT 229.91 Unexplained differenceIT : : : : : : 483 666 319 321 -421 -295 -521 -407 -271 -126 IT 126.00 2 FISIM allocationSK : : : : : : : : : : : : : : 60 60 SK 59.59 10 Different data sources usedEE : : : : : : : : : : : -6 -5 -4 -8 -22 EE 22.27 2 FISIM allocationBG : : : : : : : : : : : : : : : 0 BG 0.00 No dataCY 0 CY 0.00 No dataHR 0 HR 0.00 No dataIE 0 IE 0.00 No dataLU 0 LU 0.00 No data
Table A8 – Primary Income DebitsBoP/RoW survey November 2014 CA + KATable 1B - Primary Income Debits/ Resources
MS 1999 2000 2001 2002 2003 2004 2005 2006 2007 2008 2009 2010 2011 2012 2013 Total MS ABS(Total) Main ReasonEU 28 -1,427 45 -465 2,090 2,927 3,125 624 -890 -2,707 -11,747 -2,527 -4,669 -26,176 29,100 14,167 1,469 EU 28 84065.10DE -1,570 -2,581 -2,708 -1,858 -2,032 -1,632 -1,251 -994 -1,023 -1,240 -661 -720 -85 -164 1,976 -16,543 DE 16543.00 Mistakes detected in RoW data CZ : : : : : : : : : -4,512 -2,038 -1,894 -3,449 -668 -203 -12,765 CZ 12765.21 9 Vintage and revision differencesNL : : : : : : : : : 4,768 6,531 -2,727 -20,711 5,025 18,871 11,757 NL 11757.00 1 Compilation practicesPT 285 42 624 -289 572 111 316 367 284 264 1,222 2,409 3,408 307 159 10,081 PT 10080.60 1 Compilation practicesBE : : : : : : : : : 526 -751 481 655 15,256 -9,101 7,066 BE 7065.71 95 D4 expl difFR 442 2,966 2,003 4,760 5,001 4,822 2,447 313 -1,337 -9,843 -7,049 -3,356 -6,534 8,047 3,617 6,300 FR 6299.60 Unexplained differenceSE : : : : : : : : : -785 -616 -724 -678 -761 -957 -4,520 SE 4520.48 D93 D21 expl diffHU -456 -375 -360 -518 -683 -144 -201 -178 -187 16 16 19 20 -90 -65 -3,188 HU 3187.69 10 Different data sources usedFI -76 93 66 89 168 99 108 101 84 144 -44 -123 -410 -130 -2,691 -2,523 FI 2522.95 Unexplained differenceGR : : : : : : : : : : 282 359 424 385 612 2,062 GR 2062.00 2 FISIM AllocationPL : : : : : : : : : : : 601 -1 1,006 0 1,605 PL 1604.91 9 Vintage and revision differencesES -52 -82 -66 -71 -72 -78 -149 -187 -158 -95 -84 675 750 669 382 1,382 ES 1382.00 9 Vintage and revisions differencesRO : : : : : : : : : -686 -1 -238 -158 -109 : -1,193 RO 1192.96 95 D4 expl diffAT : : : : : : : 393 28 29 49 22 22 17 223 783 AT 782.70 Unexplained differenceSI : : : : : : : : : : 69 85 112 181 182 629 SI 629.00 1 Compilation practicesDK : : : : : : -59 44 0 0 0 0 0 -358 939 566 DK 565.64 9 Vintage and revision differencesIT : : : : : : -485 -670 -332 -244 477 414 455 349 447 411 IT 411.00 2 FISIM allocationLT : : : : : -31 -70 -66 -101 -143 -6 -2 -2 0 51 -370 LT 369.97 2 FISIM allocationMT : : : : : : : : : : : : : 142 -289 -147 MT 147.42 Unexplained differenceEE : : : : : : : : : : : 12 -2 12 50 72 EE 71.87 12 Mistakes detected in BoP dataLV : -18 -23 -23 -26 -23 -32 -13 35 57 76 40 8 -14 10 54 LV 54.00 12 Mistakes detected in BoP dataSK : : : : : : : : : : : : : : -48 -48 SK 48.23 9 Vintage and revision differencesGB 0 0 0 0 0 0 0 0 0 0 0 0 0 0 1 1 GB 1.18 9 Vintage and revision differencesBG : : : : : : : : : : : : : : : 0 BG 0.00 No dataCY 0 CY 0.00 No dataHR 0 HR 0.00 No dataIE 0 IE 0.00 No dataLU 0 LU 0.00 No data
41

Table A9 D1 Compensation of employees – CreditsBoP/RoW survey November 2014 CA + KATable 1B - D1 - Credits/Uses/Exports
MS 1999 2000 2001 2002 2003 2004 2005 2006 2007 2008 2009 2010 2011 2012 2013 Total MS ABS(Total) Main ReasonEU 28 -234 -281 -398 -272 -552 47 161 -1,307 -1,713 -3,024 -1,718 -2,165 -2,288 -1,706 -1,054 -16,504 EU 28 43254.49SE : : : : : : : -1,244 -1,683 -2,130 -2,231 -2,361 -2,332 -2,532 -2,464 -16,977 SE 16976.71 9 Vintage and revision differences FR 875 985 991 959 906 798 904 881 854 793 881 800 733 761 861 12,982 FR 12982.00 Unexplained differenceDE -551 -589 -619 -439 -451 -727 -704 -899 -849 -767 -134 -231 -181 588 348 -6,205 DE 6205.00 1 1,9,10 differences not apportionableHU -541 -595 -679 -710 -933 0 0 0 0 0 0 0 0 0 0 -3,459 HU 3458.98 10 Different data sources usedRO : : : : : : : : : -958 -409 -403 -416 -475 : -2,661 RO 2660.87 12 Mistakes detected in BoP data BE : : : : : : : : : 13 146 10 39 -128 192 272 BE 272.30 Mistakes detected in BoP data FI -17 -82 -88 -81 -74 18 19 19 29 35 42 35 -118 -3 11 -253 FI 253.04 9 Vintages and revisions differencesLT : : : : : -44 -57 -67 -64 0 0 0 0 0 0 -232 LT 232.06 1 Compilation practicesDK : : : : : : 0 0 0 0 0 0 0 97 0 97 DK 97.00 9 Vintage and revision differencesCZ : : : : : : : : : -12 -13 -15 -15 -16 -16 -85 CZ 85.19 1 Compilation practicesSK : : : : : : : : : : : : : : 15 15 SK 15.00 10 Different data sources usedES 0 0 0 0 0 1 0 1 0 1 0 0 0 0 0 3 ES 3.00 Unexplained differenceIT 0 0 -2 0 0 0 -1 0 0 0 0 0 0 0 0 -3 IT 3.00 Unexplained differenceAT : : : : : : : 2 0 -1 0 1 0 1 0 2 AT 2.40 Unexplained difference
EE : : : : : : : : : : : -1 -1 0 -1 -2 EE 2.34 9-Vintage and revision differences
MT : : : : : : : : : : : : : 1 1 2 MT 2.32 Unexplained differenceLV : 0 0 -1 0 0 0 -1 0 -1 0 -1 1 0 0 -2 LV 2.28 Unexplained differenceGR : : : : : : : : : : 0 1 0 0 0 1 GR 1.00 Unexplained differenceGB 0 0 0 0 0 0 0 0 0 0 0 0 0 0 0 0 GB 0.00 No differenceNL : : : : : : : : : 0 0 0 0 0 0 0 NL 0.00 No differencePL : : : : : : : : : : : 0 0 0 0 0 PL 0.00 No differencePT 0 0 0 0 0 0 0 0 0 0 0 0 0 0 0 0 PT 0.00 No differenceSI : : : : : : : : : : 0 0 0 0 0 0 SI 0.00 No differenceBG : : : : : : : : : : : : : : : 0 BG 0.00 No dataCY 0 CY 0.00 No dataHR 0 HR 0.00 No dataIE 0 IE 0.00 No dataLU 0 LU 0.00 No data
Table A10 D1 Compensation of employees – DebitsBoP/RoW survey November 2014 CA + KATable 1B - D1 Debits/resources
MS 1999 2000 2001 2002 2003 2004 2005 2006 2007 2008 2009 2010 2011 2012 2013 Total MS ABS(Total) Main ReasonEU 28 -787 -1,864 -1,856 -1,411 -1,723 -1,196 -694 -705 -529 -503 328 183 70 197 2,884 -7,608 EU 28 14775.29DE -653 -1,680 -1,604 -1,055 -1,273 -1,263 -777 -605 -592 -609 4 54 37 45 2,083 -7,888 DE 7888.00 1 1,9,10 differences not apportionableBE : : : : : : : : : 161 347 209 239 120 552 1,629 BE 1628.50 Mistakes detected in BoP data HU -213 -230 -269 -386 -460 0 0 0 0 0 0 0 0 0 0 -1,557 HU 1557.01 10 Different data sources usedFR 88 91 81 105 104 77 99 101 97 40 79 65 84 99 308 1,518 FR 1518.00 Unexplained differenceFI -10 -45 -64 -76 -95 2 0 0 0 0 0 4 -268 -5 11 -547 FI 546.90 9 Vintages and revisions differencesGR : : : : : : : : : : -82 -75 -95 -93 -90 -435 GR 435.00 1. Compilation PracticesCZ : : : : : : : : : 25 33 29 99 111 128 426 CZ 425.51 1 Compilation practicesSE : : : : : : : -181 -4 -57 -28 -64 24 -37 -39 -387 SE 386.69 9 Vintage and revision differencesRO : : : : : : : : : -63 -25 -38 -49 -49 : -224 RO 223.63 12 Mistakes detected in BoP data LT : : : : : -10 -17 -19 -29 0 0 0 0 0 0 -75 LT 75.45 1 Compilation practicesSK : : : : : : : : : : : : : : -71 -71 SK 71.00 10 Different data sources usedDK : : : : : : 0 0 0 0 0 0 0 3 2 5 DK 5.37 Unexplained differenceLV : 1 0 0 0 0 1 0 1 2 0 0 0 0 1 5 LV 4.85 Unexplained differenceEE : : : : : : : : : : : -1 -1 0 0 -2 EE 2.25 13 Mistakes detected in RoW dataES 0 0 0 0 1 -1 0 0 -2 0 0 0 0 0 0 -2 ES 2.00 Unexplained differenceIT 0 -1 0 0 0 -1 0 0 0 0 0 0 0 0 0 -2 IT 2.00 Unexplained differenceAT : : : : : : : 0 1 -1 -1 -1 0 0 -1 -2 AT 1.70 Unexplained differenceMT : : : : : : : : : : : : : 2 0 1 MT 1.42 Unexplained difference
GB 0 0 0 0 0 0 0 0 0 0 0 0 0 0 0 0 GB 0.00 No difference
NL : : : : : : : : : 0 0 0 0 0 0 0 NL 0.00 No differencePL : : : : : : : : : : : 0 0 0 0 0 PL 0.00 No differencePT 0 0 0 0 0 0 0 0 0 0 0 0 0 0 0 0 PT 0.00 No differenceSI : : : : : : : : : : 0 0 0 0 0 0 SI 0.00 No differenceBG : : : : : : : : : : : : : : : 0 BG 0.00 No dataCY 0 CY 0.00 No dataHR 0 HR 0.00 No dataIE 0 IE 0.00 No dataLU 0 LU 0.00 No data
42

Table A11 D21Taxes on product - DebitsBoP/RoW survey November 2014 CA + KATable 1B -D21 Debits/resources
MS 1999 2000 2001 2002 2003 2004 2005 2006 2007 2008 2009 2010 2011 2012 2013 Total MS ABS(Total) Main ReasonEU 28 -194 -247 -85 -160 -201 43 -164 -751 -828 -1,121 -238 -671 -506 -492 -2,344 -7,960 EU 28 11577.75SE : : : : : : : -558 -636 -611 -485 -595 -627 -604 -604 -4,719 SE 4718.62 99. Others (please specify and clarify) FR -31 -43 -8 -58 -92 -80 -77 -48 -37 0 2 -96 3 -107 -2,069 -2,741 FR 2741.00 Unexplained differenceFI -142 -139 -127 -106 -104 -130 -154 -176 -200 : : : : : : -1,278 FI 1278.00 12 Mistakes detected in BoP data GR : : : : : : : : : : 104 98 121 176 162 661 GR 661.00 10. Different data sources usedCZ : : : : : : : : : -71 -46 -74 -72 -55 -62 -379 CZ 379.01 1 Compilation practicesRO : : : : : : : : : -197 143 135 139 142 : 362 RO 361.70 1 Compilation practiceSI : : : : : : : : : : -57 -59 -62 -54 -52 -284 SI 284.00 1 Compilation practicesLV : 0 0 0 0 7 17 21 35 35 22 13 17 21 26 216 LV 215.55 12 Mistakes detected in BoP dataBE : : : : : : : : : -169 7 -5 -42 -28 33 -205 BE 204.63 12 Mistakes detected in BoP dataSK : : : : : : : : : : : : : : 183 183 SK 182.70 10. Different data sources usedHU 0 0 0 0 0 0 0 0 62 66 25 0 0 0 0 153 HU 153.14 1 Compilation practicesDE -8 -32 55 5 2 224 36 -18 -36 -162 52 -72 3 21 42 112 DE 112.00 10 Different data sources usedDK : : : : : : 44 44 0 0 0 0 0 0 0 88 DK 87.72 9 Vintage and revision differencesES -10 -28 -6 -3 -2 0 -23 -13 0 0 0 0 -2 -1 1 -87 ES 87.00 1 Compilation practices
LT : : : : : 19 -2 -1 -13 -22 -7 -3 -3 -2 -8 -42 LT 41.51 993 different aproah Others (different classification of subsidies)
EE : : : : : : : : : : : 0 0 0 26 26 EE 26.14 12 Mistakes detected in BoP dataMT : : : : : : : : : : : : : -13 -12 -25 MT 25.00 Unexplained differenceAT : : : : : : : 0 0 1 0 0 1 0 -11 -10 AT 10.00 Unexplained differencePT -3 -5 1 2 -5 3 -5 -3 -3 9 3 -13 18 10 -1 9 PT 8.78 10 Different data sources usedPL : : : : : : : : : : : 0 0 0 0 0 PL 0.24 Unexplained differenceIT : : : : : : : : : 0 -1 0 0 0 1 0 IT 0.00 Unexplained differenceGB 0 0 0 0 0 0 0 0 0 0 0 0 0 0 0 0 GB 0.00 No differenceNL : : : : : : : : : 0 0 0 0 0 0 0 NL 0.00 No differenceBG : : : : : : : : : : : : : : : 0 BG 0.00 No dataCY 0 CY 0.00 No dataHR 0 HR 0.00 No dataIE 0 IE 0.00 No dataLU 0 LU 0.00 No data
Table A12 D31 Subsidies on products - CreditsBoP/RoW survey November 2014 CA + KATable 1B - D31 - Credits/Uses/Exports
MS 1999 2000 2001 2002 2003 2004 2005 2006 2007 2008 2009 2010 2011 2012 2013 Total MS ABS(Total) Main ReasonEU 28 8,114 8,048 7,763 8,536 9,256 8,994 9,708 16,796 8,714 9,068 9,671 10,964 9,696 9,174 8,922 143,425 EU 28 169507.95GB 7,930 7,887 7,678 8,436 8,471 9,289 4,984 4,722 4,314 3,832 3,829 3,566 3,648 3,237 2,891 84,714 GB 84713.61 1 Compilation practicesDE 1,069 1,235 1,598 1,662 1,905 2,137 5,903 7,757 5,100 5,737 5,994 5,609 5,639 5,459 5,512 62,316 DE 62316.00 99:classification differences within tables 4.3 and 4.4PT -540 -515 -504 -534 -579 -642 -546 -379 -302 -284 -312 -302 -331 -272 -259 -6,300 PT 6299.92 1 Compilation practicesFR 60 -288 -663 -805 -427 -1,233 -183 4,961 79 23 65 1,825 514 552 557 5,037 FR 5037.00 Unexplained differenceFI -360 -462 -465 -497 -471 -533 -511 -85 -63 : : : : : : -3,447 FI 3447.00 12 Mistakes detected in BoP data LT : : : : : -119 -179 -160 -157 -194 -235 -248 -307 -348 -378 -2,325 LT 2324.86 993 different aproah Others (different classification of subsidies)LV : 0 0 0 0 32 117 138 151 220 215 271 279 341 332 2,096 LV 2096.00 12 Mistakes detected in BoP data ES -45 191 119 273 356 62 -47 34 -318 -181 157 205 184 47 158 1,195 ES 1195.00 1 Compilation practicesSE : : : : : : : -191 -89 -91 -96 -66 -60 -21 -22 -637 SE 636.75 71 Elsewhere registered Others, please see 99 ExplanationSI : : : : : : : : : : 101 100 122 142 146 611 SI 611.00 1 Compilation practicesGR : : : : : : : : : : -54 47 77 121 92 283 GR 283.00 10. Different data sources usedHU 0 0 0 0 0 0 170 0 0 44 0 0 0 0 0 214 HU 213.89 1 Compilation practicesCZ : : : : : : : : : -2 6 -41 -67 -87 -20 -210 CZ 210.22 1 Compilation practicesBE : : : : : : : : : -36 0 -2 -2 4 -79 -115 BE 115.09 9 Vintages and revisions differencesSK : : : : : : : : : : : : : : -6 -6 SK 5.78 1 Compilation practicesAT : : : : : : : -1 0 1 1 0 0 -1 -1 -2 AT 1.90 Unexplained differenceDK : : : : : : 0 0 0 0 0 0 0 0 0 1 DK 0.94 Unexplained difference
EE : : : : : : : : : : : 0 0 0 0 0 EE 0.00 99-Discrepancy due to rounding
IT : : : : : : : : : 0 0 0 0 0 0 0 IT 0.00 No differenceMT : : : : : : : : : : : : : 0 0 0 MT 0.00 No differenceNL : : : : : : : : : 0 0 0 0 0 0 0 NL 0.00 No differenceBG : : : : : : : : : : : : : : : 0 BG 0.00 No dataCY 0 CY 0.00 No dataHR 0 HR 0.00 No dataIE 0 IE 0.00 No dataLU 0 LU 0.00 No dataPL : : : : : : : : : : : : : : : 0 PL 0.00 10 Different data sources usedRO : : : : : : : : : : : : : : : 0 RO 0.00 No difference
43
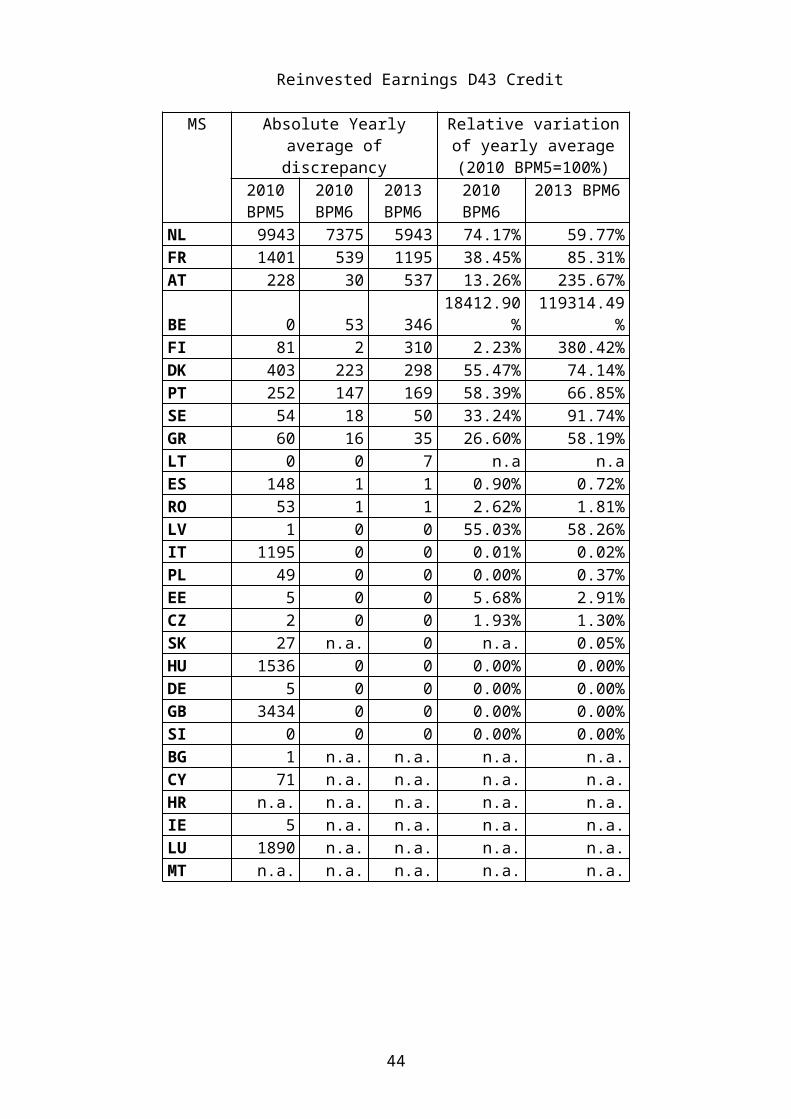
Table A13 – D39 Other subsidies on products CreditsBoP/RoW survey November 2014 CA + KATable 1B -D39 - Credits/Uses/Exports
MS 1999 2000 2001 2002 2003 2004 2005 2006 2007 2008 2009 2010 2011 2012 2013 Total MS ABS(Total) Main ReasonEU 28 -615 30 -129 656 485 964 489 -8,658 -2,188 -2,296 -3,728 -2,040 -471 250 -505 -17,757 EU 28 139811.28DE -991 -1,026 -1,367 -1,385 -1,606 -1,547 -5,473 -7,258 -5,512 -5,719 -6,321 -5,571 -5,603 -5,517 -5,421 -60,317 DE 60317.00 99 classification differences within tables 4.3 and 4.4GB 513 550 936 825 856 872 4,984 4,725 4,314 3,832 3,829 3,566 3,648 3,237 2,891 39,576 GB 39576.12 1 Compilation practicesSE : : : : : : : -1,172 -1,196 -1,085 -981 -1,073 -1,166 -1,194 -964 -8,831 SE 8831.49 71 Elsewhere registered Others, please see 99 ExplanationPL : : : : : : : : : : : 1,286 1,524 2,443 1,453 6,706 PL 6705.71 10 Different data sources usedPT 540 514 505 534 577 643 547 378 301 235 300 217 288 266 240 6,086 PT 6085.52 1 Compilation practicesFR -75 243 124 841 994 914 536 -5,179 579 381 381 505 1,674 1,414 1,921 5,253 FR 5253.00 Unexplained differenceFI -295 -344 -357 -333 -356 -355 -343 -723 -736 : : : : : : -3,842 FI 3842.00 12 Mistakes detected in BoP data GR : : : : : : : : : : -852 -797 -606 -193 -232 -2,680 GR 2680.00 10. Different data sources usedLT : : : : : 119 169 140 141 139 232 256 318 312 462 2,289 LT 2288.82 993 different aproah Others (different classification of subsidies)LV : 0 0 0 0 -32 -118 -137 -151 -220 -214 -272 -279 -341 -332 -2,096 LV 2095.88 12 Mistakes detected in BoP data SI : : : : : : : : : : -135 -156 -145 -144 -166 -746 SI 746.00 1 Compilation practicesRO : : : : : : : : : 702 0 0 0 0 : 702 RO 701.90 1 Compilation practiceES -307 93 30 173 21 350 187 568 71 -308 67 -12 -150 -6 -510 267 ES 267.00 1 Compilation practicesCZ : : : : : : : : : -223 -34 6 24 -5 34 -197 CZ 197.08 1 Compilation practices
BE : : : : : : : : : 0 0 2 3 -5 77 76 BE 76.28 9 Vintage and revision differences
SK : : : : : : : : : : : : : : 67 67 SK 66.71 1 Compilation practicesMT : : : : : : : : : : : : : -21 -24 -45 MT 45.00 Unexplained differenceHU 0 0 0 0 0 0 0 0 0 -29 0 0 0 0 0 -29 HU 29.00 1 Compilation practicesEE : : : : : : : : : : : 3 -1 2 0 5 EE 4.53 9 Vintage and revision differencesIT : : : : : : : : : 0 0 0 1 0 0 1 IT 1.00 Unexplained differenceAT : : : : : : : -1 1 -1 0 0 -1 1 0 1 AT 0.70 Unexplained differenceDK : : : : : : 0 0 0 0 0 0 0 0 0 -1 DK 0.54 Unexplained differenceNL : : : : : : : : : 0 0 0 0 0 0 0 NL 0.00 No differenceBG : : : : : : : : : : : : : : : 0 BG 0.00 No dataCY 0 CY 0.00 No dataHR 0 HR 0.00 No dataIE 0 IE 0.00 No dataLU 0 LU 0.00 No data
Table A14 – D4 Property Income CreditsBoP/RoW survey November 2014 CA + KATable 1B - D4 - Credits/Uses/Exports
MS 1999 2000 2001 2002 2003 2004 2005 2006 2007 2008 2009 2010 2011 2012 2013 Total MS ABS(Total) Main ReasonEU 28 -3,395 -3,223 -2,393 -476 934 -66 -867 -1,953 -4,149 -10,071 4,671 4,813 -8,924 31,548 35,845 42,296 EU 28 96268.68NL : : : : : : : : : 3,191 7,862 -1,280 -8,722 14,612 31,095 46,758 NL 46758.00 1 Compilation practicesPT 225 291 330 244 996 850 513 773 553 826 652 2,556 1,362 76 -313 9,933 PT 9932.64 1 Compilation practicesDE -940 -498 -683 -1,234 -1,838 -971 -1,713 -1,893 313 -2,158 -944 -660 -186 1,662 1,895 -9,848 DE 9848.00 Mistakes detected in RoW data FI -3 -25 -130 -147 -330 -54 -37 -120 -264 -639 -447 -550 -560 -688 -2,059 -6,054 FI 6054.10 Unexplained differenceBE : : : : : : : : : -574 -964 -30 -11 4,435 3,001 5,856 BE 5856.42 99 OtherES -1,989 -2,257 -1,909 -90 -78 -92 -117 -209 -254 -138 -138 506 566 546 412 -5,241 ES 5241.00 9 Vintage and revisions differencesFR -613 -623 -62 755 2,205 289 181 -1,157 -4,663 -10,852 -730 4,779 -562 12,372 2,443 3,762 FR 3762.00 Unexplained differenceSE : : : : : : : : : -16 -50 -58 -59 -50 -1,785 -2,018 SE 2018.32 71 Elsewhere registered Others, please see 99 ExplanationAT : : : : : : : 260 246 287 -83 124 156 155 147 1,292 AT 1292.00 Unexplained differencePL : : : : : : : : : : : -136 -314 -230 -269 -948 PL 948.33 9 Vintage and revision differencesCZ : : : : : : : : : 249 251 32 89 131 136 888 CZ 887.94 Mistakes detected in BoP data DK : : : : : : -6 0 -20 0 0 0 2 -1,049 1,867 793 DK 793.11 9 Vintage and revision differencesRO : : : : : : : : : -226 -137 -128 -134 -106 : -732 RO 732.18 994 Data not reportedLV : -19 -17 -9 -7 -26 -27 -64 -155 -199 -104 3 11 5 19 -591 LV 590.88 2 FISIM allocationHU -75 -91 78 6 -14 -18 -90 -160 -160 -13 -1 0 1 -7 2 -544 HU 544.44 1 Compilation practicesLT : : : : : -43 -55 -48 -64 -129 -1 -14 -17 -28 37 -364 LT 363.86 9 Vintage and revision differencesMT : : : : : : : : : : : : : 130 -347 -217 MT 216.89 Unexplained differenceIT : : : : : : 484 666 320 322 -421 -313 -549 -419 -285 -195 IT 195.00 2 FISIM allocationSI : : : : : : : : : : -45 -39 -35 -36 -33 -188 SI 188.00 1 Compilation practicesEE : : : : : : : : : : : -7 -5 -7 -8 -28 EE 28.06 2 FISIM allocationSK : : : : : : : : : : : : : : -16 -16 SK 15.52 9 Vintage and revision differencesGR : : : : : : : : : : -28 28 46 44 -92 -2 GR 2.00 2 FISIM AllocationGB 0 0 0 0 0 0 0 0 0 0 0 0 0 0 0 0 GB 0.00 No differenceBG : : : : : : : : : : : : : : : 0 BG 0.00 No dataCY 0 CY 0.00 No dataHR 0 HR 0.00 No dataIE 0 IE 0.00 No dataLU 0 LU 0.00 No data
44
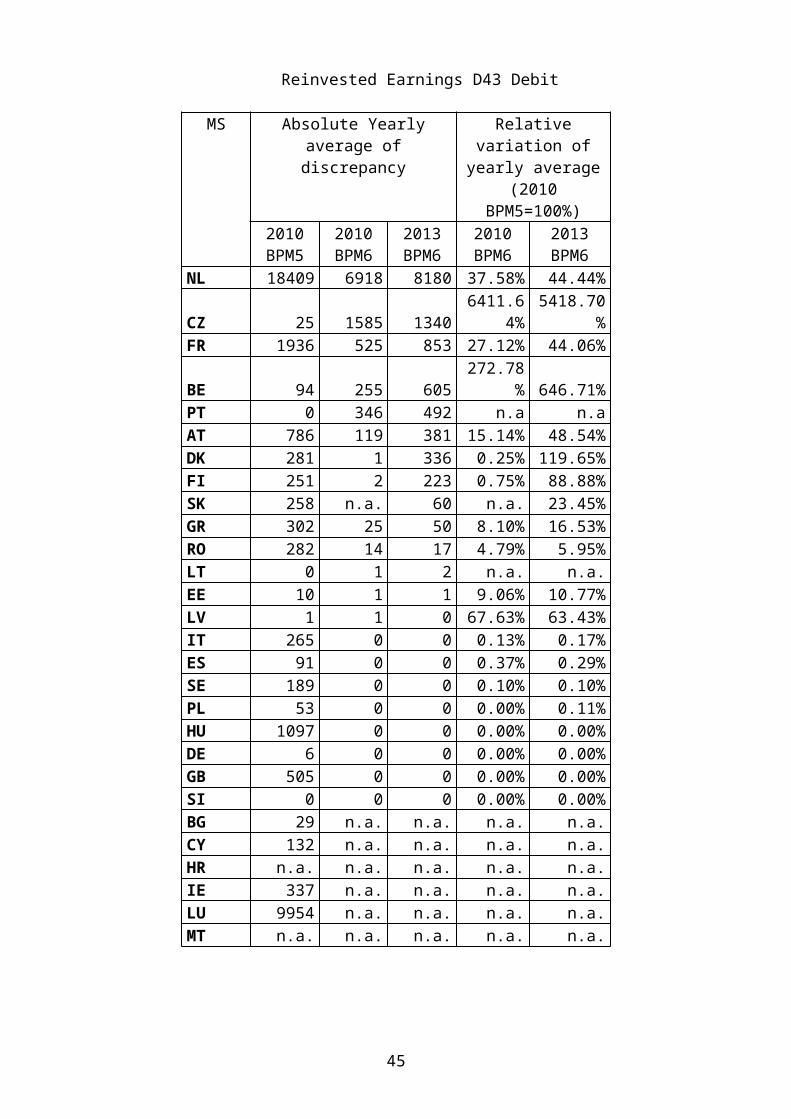
Table A15 – D4 Property Income DebitsBoP/RoW survey November 2014 CA + KATable 1B - D4- Debits/resources
MS 1999 2000 2001 2002 2003 2004 2005 2006 2007 2008 2009 2010 2011 2012 2013 Total MS ABS(Total) Main ReasonEU 28 -1,882 348 -483 1,801 2,795 1,857 -1,315 -2,926 -5,144 -12,101 -5,000 -6,211 -28,234 27,767 10,181 -18,547 EU 28 81181.66FR -1,052 1,111 -28 2,852 2,934 2,407 -372 -2,493 -4,619 -11,799 -9,256 -4,911 -8,551 7,115 3,108 -23,554 FR 23554.00 Unexplained differenceCZ : : : : : : : : : -4,466 -2,025 -1,849 -3,476 -725 -270 -12,812 CZ 12811.58 9 Vintage and revision differencesNL : : : : : : : : : 4,769 6,531 -2,727 -20,711 5,025 18,871 11,758 NL 11758.00 1 Compilation practicesPT 288 47 623 -293 576 108 319 369 291 259 1,219 2,423 3,387 296 156 10,070 PT 10069.54 1 Compilation practicesDE -909 -869 -1,160 -807 -763 -594 -509 -369 -395 -467 -718 -702 -124 -230 -148 -8,764 DE 8764.00 Mistakes detected in RoW data BE : : : : : : : : : 199 -1,317 -80 4 14,695 -10,135 3,367 BE 3366.84 994HU -244 -145 -92 -132 -223 -144 -201 -178 -187 16 16 19 20 -90 -65 -1,631 HU 1630.75 1 Compilation practicesPL : : : : : : : : : : : 601 -1 1,006 0 1,605 PL 1604.67 9 Vintage and revision differencesGR : : : : : : : : : : 179 271 323 237 481 1,491 GR 1491.00 2 FISIM AllocationES -42 -54 -60 -68 -70 -77 -126 -174 -156 -96 -83 675 751 670 382 1,472 ES 1472.00 9 Vintage and revisions differencesRO : : : : : : : : : -425 -117 -335 -247 -201 : -1,325 RO 1324.53 994 Data not reportedSE : : : : : : : : : -117 -103 -65 -76 -120 -314 -794 SE 794.27 71 Elsewhere registered Others, please see 99 ExplanationAT : : : : : : : 393 28 28 36 5 9 6 232 736 AT 736.40 Unexplained differenceDK : : : : : : -103 0 0 0 0 0 0 -362 937 473 DK 472.82 9 Vintage and revision differencesIT : : : : : : -484 -669 -331 -244 478 407 419 326 399 301 IT 301.00 2 FISIM allocationMT : : : : : : : : : : : : : 85 -369 -284 MT 284.50 Unexplained differenceLT : : : : : -40 -53 -46 -59 -128 0 0 0 -1 52 -275 LT 275.16 2 FISIM allocationLV : -19 -23 -22 -26 -31 -49 -35 1 21 53 26 -9 -36 -18 -166 LV 165.62 2 FISIM allocationSK : : : : : : : : : : : : : : -160 -160 SK 159.74 9 Vintage and revision differencesFI 76 277 257 270 367 228 262 277 284 350 109 26 49 59 -2,987 -97 FI 96.99 Unexplained differenceEE : : : : : : : : : : : 10 -2 12 24 44 EE 44.08 12 Mistakes detected in BoP dataSI : : : : : : : : : : -2 -4 -1 0 4 -3 SI 3.00 Unexplained differenceGB 0 0 0 0 0 0 0 0 0 0 0 0 0 0 1 1 GB 1.18 9 Vintage and revision differencesBG : : : : : : : : : : : : : : : 0 BG 0.00 No dataCY 0 CY 0.00 No dataHR 0 HR 0.00 No dataIE 0 IE 0.00 No dataLU 0 LU 0.00 No data
Table A16 – D41 Interest CreditsBoP/RoW survey November 2014 CA + KATable 1B - D41 - Credits/Uses/Exports
MS 1999 2000 2001 2002 2003 2004 2005 2006 2007 2008 2009 2010 2011 2012 2013 Total MS ABS(Total) Main ReasonEU 28 -16,737 -28,818 -29,410 -21,514 -19,224 -17,048 -32,264 -55,311 -74,739 -100,939 -43,766 -26,840 -31,526 -20,797 14,746 -504,188 EU 28 572507.58FR -13,519 -24,494 -25,593 -19,873 -17,933 -15,006 -21,811 -34,355 -49,074 -55,210 -21,339 -10,817 -16,234 -8,216 -1,429 -334,903 FR 334903.00 Unexplained differenceBE : : : : : : : : : -26,110 -11,986 -8,759 -9,368 -8,830 871 -64,182 BE 64181.84 994 Data not reported Y370B AT : : : : : : : -5,408 -7,668 -9,262 -6,655 -5,486 -5,477 -4,746 46 -44,656 AT 44655.60 Unexplained differenceSE : : : : : : : -5,316 -6,554 -8,070 -4,211 -3,233 -3,974 -3,449 -1,285 -36,092 SE 36092.13 12 Mistakes detected in BoP data IT : : : : : : -8,125 -7,403 -9,578 1,681 544 319 321 306 390 -21,545 IT 21545.00 994 data not reportedFI -1,123 -1,756 -1,873 -1,561 -1,088 -1,409 -1,405 -1,725 -2,400 -2,570 -832 -362 -489 -328 -176 -19,094 FI 19093.78 74 Non comp categories depositsNL : : : : : : : : : 699 1,587 1,964 1,815 1,758 10,525 18,348 NL 18348.00 1 Compilation practicesHU -366 -481 -387 -386 -334 -406 -442 -648 -857 -1,436 -1,253 -1,183 1 0 2 -8,175 HU 8174.61 994 data not reported Back data is not detailed enough in the BoP before 2011PT 310 414 510 451 405 443 466 631 826 717 509 698 576 171 180 7,306 PT 7305.91 1 Compilation practicesDE -128 -232 -123 -57 -168 -485 -908 -974 751 18 928 90 1,561 2,454 4,215 6,942 DE 6942.00 9 Vintage and revision differences FISIMLV : -94 -102 -87 -105 -152 -201 -350 -540 -699 -481 -166 -166 -152 19 -3,277 LV 3276.62 75 estat bop errorES -1,912 -2,175 -1,843 -1 -2 1 -4 -3 -4 5 -11 639 716 733 626 -3,235 ES 3235.00 9 Vintage and revisions differencesDK : : : : : : 201 262 378 -62 -401 26 -136 65 1,058 1,390 DK 1390.48 9 Vintage and revision differencesRO : : : : : : : : : -447 -250 -198 -229 -130 : -1,254 RO 1253.52 994 data not reportedPL : : : : : : : : : : : -237 -320 -349 -270 -1,176 PL 1176.43 9 Vintage and revision differencesCZ : : : : : : : : : -66 87 -89 -106 -55 -30 -258 CZ 257.75 9-Vintage and revision differencesLT : : : : : -34 -36 -22 -19 -128 0 -1 0 0 -7 -247 LT 247.40 9 Vintage and revision differencesEE : : : : : : : : : : : -80 -72 -80 -8 -240 EE 239.99 12 Mistakes detected in BoP dataGR : : : : : : : : : : -5 35 54 50 35 169 GR 169.00 2. FISIM AllocationSK : : : : : : : : : : : : : : -15 -15 SK 15.32 9-Vintage and revision differencesSI : : : : : : : : : : 1 0 1 2 -1 3 SI 3.00 Unexplained differenceGB 0 0 0 0 0 0 0 0 0 0 0 0 0 0 1 1 GB 1.18 9-Vintage and revision differencesBG : : : : : : : : : : : : : : : 0 BG 0.00 No dataCY 0 CY 0.00 No dataHR 0 HR 0.00 No dataIE 0 IE 0.00 No dataLU 0 LU 0.00 No dataMT : : : : : : : : : : : : : : : 0 MT 0.00 No difference
45

Table A17 – D41 Interest DebitsBoP/RoW survey November 2014 CA + KATable 1B - D41 Debits/resources - Credits/Uses/Exports
MS 1999 2000 2001 2002 2003 2004 2005 2006 2007 2008 2009 2010 2011 2012 2013 Total MS ABS(Total) Main ReasonEU 28 -17,051 -29,884 -33,076 -26,579 -22,327 -21,476 -40,491 -71,047 -99,462 -128,413 -62,620 -41,836 -43,626 -25,649 6,639 -656,897 EU 28 684779.38FR -15,030 -27,180 -29,653 -23,999 -20,435 -19,671 -27,702 -42,259 -61,364 -69,880 -37,781 -23,408 -25,505 -11,183 -1,746 -436,796 FR 436796.00 Unexplained differenceBE : : : : : : : : : -29,573 -10,827 -7,614 -8,016 -6,845 1,131 -61,743 BE 61743.35 994 Data not reported Y370B AT : : : : : : : -5,677 -8,345 -9,291 -5,487 -3,913 -4,480 -4,007 171 -41,030 AT 41029.50 Unexplained differenceIT : : : : : : -10,393 -14,023 -16,551 -244 476 416 456 352 446 -39,065 IT 39065.00 994 data not reportedSE : : : : : : : -6,101 -7,441 -8,334 -3,833 -2,761 -3,132 -2,488 -287 -34,377 SE 34376.59 12 Mistakes detected in BoP data FI -1,332 -1,870 -2,540 -1,851 -1,122 -948 -1,222 -1,374 -1,868 -2,182 -841 -524 -804 -621 -191 -19,290 FI 19290.14 Unexplained differenceHU -750 -846 -905 -746 -774 -744 -901 -1,084 -1,584 -2,295 -1,927 -1,575 20 -90 -65 -14,266 HU 14266.21 994 data not reported Back data is not detailed enough in the BoP before 2011RO : : : : : : : : -1,621 -2,405 -1,898 -1,850 -2,389 -2,297 : -12,460 RO 12459.99 994 Data not reportedCZ : : : : : : : : : -1,282 -1,026 -1,231 -1,117 -528 -555 -5,738 CZ 5738.10 9 Vintage and revision differencesLV : -90 -109 -102 -96 -121 -220 -404 -810 -1,095 -639 -497 -536 -425 -16 -5,161 LV 5161.02 75 estat bop errorNL : : : : : : : : : -1,833 556 -147 -133 -813 5,654 3,284 NL 3284.00 1 Compilation practicesES -1 0 -3 -2 0 1 0 -1 0 -22 -7 802 914 849 582 3,112 ES 3112.00 9 Vintage and revisions differencesGR : : : : : : : : : : 531 653 559 378 407 2,528 GR 2528.00 2. FISIM AllocationPT 85 121 155 138 115 122 129 93 347 313 204 145 133 32 49 2,179 PT 2179.40 1 Compilation practicesDE -23 -18 -21 -16 -15 -76 -125 -171 -162 -161 -120 -150 583 859 696 1,080 DE 1080.00 9 Vintage and revision differences FISIMPL : : : : : : : : : : : 1 -6 1,004 -6 993 PL 992.86 9 Vintage and revision differencesDK : : : : : : -3 0 0 0 0 0 0 270 497 765 DK 764.94 9 Vintage and revision differencesEE : : : : : : : : : : : -180 -176 -96 26 -426 EE 425.76 12 Mistakes detected in BoP dataLT : : : : : -40 -53 -46 -63 -128 0 -1 0 -1 4 -328 LT 328.49 2 FISIM allocationSK : : : : : : : : : : : : : : -157 -157 SK 157.06 9 Vintage and revision differencesSI : : : : : : : : : : 0 -2 1 1 -1 -1 SI 1.00 Unexplained differenceGB 0 0 0 0 0 0 0 0 0 0 0 0 0 0 0 0 GB 0.00 No differenceBG : : : : : : : : : : : : : : : 0 BG 0.00 No dataCY 0 CY 0.00 No dataHR 0 HR 0.00 No dataIE 0 IE 0.00 No dataLU 0 LU 0.00 No dataMT : : : : : : : : : : : : : : : 0 MT 0.00 No difference
Table A18 – D41 Portfolio Investments CreditsBoP/RoW survey November 2014 CA + KATable 1B - D42 - Credits/Uses/Exports
MS 1999 2000 2001 2002 2003 2004 2005 2006 2007 2008 2009 2010 2011 2012 2013 Total MS ABS(Total) Main ReasonEU 28 -6,306 -4,637 -4,575 -4,658 -1,731 -5,373 -13,966 -20,403 -25,517 -25,265 -18,477 -11,146 -47,124 4,772 18,320 -166,085 EU 28 200583.27FR -5,362 -4,052 -3,721 -3,094 -576 -5,085 -7,424 -9,733 -10,855 -10,762 -9,261 -7,034 -13,064 -4,397 -1,335 -95,755 FR 95755.00 Unexplained differenceSE : : : : : : : -2,785 -4,175 -4,058 -3,114 -4,073 -5,133 -5,863 -807 -30,007 SE 30007.30 12 Mistakes detected in BoP data
IT : : : : : : -5,525 -5,068 -8,495 -21 -20 -24 -45 -55 -51 -19,304 IT 19304.00 994 data not reported
DE -814 -269 -558 -1,177 -1,669 -487 -807 -920 -437 -2,173 -1,875 -754 -1,750 -796 -2,320 -16,806 DE 16806.00 13 Mistakes detected in RoW data NL : : : : : : : : : -4,075 92 4,119 -22,342 12,572 19,458 9,824 NL 9824.00 1 Compilation practicesBE : : : : : : : : : -2,877 -3,273 -4,076 -3,791 5,540 998 -7,478 BE 7478.26 994 Data not reported Y370B PT -12 -40 -43 -62 1,158 684 532 684 621 593 246 2,162 953 -79 -84 7,313 PT 7312.90 1 Compilation practicesAT : : : : : : : -1,545 -836 -664 -456 -542 -719 -770 12 -5,519 AT 5519.10 Unexplained differenceFI -71 -217 -225 -292 -614 -441 -628 -904 -1,130 -875 -476 -666 -754 -750 2,761 -5,283 FI 5282.86 12 Mistakes detected in BoP data ES -42 -48 -11 -18 -14 -26 -46 -56 -98 -282 -217 1 -166 -143 -386 -1,552 ES 1552.00 13 Mistakes detected in RoW dataDK : : : : : : -23 -24 -43 -36 -24 -89 -132 -406 280 -499 DK 498.73 99 under the limitsHU -5 -11 -16 -16 -16 -18 -43 -51 -68 0 0 -13 0 0 0 -257 HU 257.36 99- Back data is not detailed enough in the BoP before 2011, but the values in the BoP and NA are the sameSI : : : : : : : : : : -48 -44 -42 -42 -41 -217 SI 217.00 1 Compilation practicesGR : : : : : : : : : : -27 -33 -43 -62 -49 -214 GR 214.00 801 Portofolio investment dividents not included in BoPRO : : : : : : : : : -33 -22 -26 -28 -45 : -154 RO 154.05 994 Data not reportedEE : : : : : : : : : : : -41 -58 -40 -7 -146 EE 146.46 12 Mistakes detected in BoP dataCZ : : : : : : : : : 0 0 0 0 0 -120 -120 CZ 120.06 9 Vintage and revision differencesPL : : : : : : : : : : : -11 -4 116 -1 100 PL 99.59 9 Vintage and revision differencesLV : -1 -1 0 1 0 0 -3 0 -2 0 -1 -6 -7 -1 -21 LV 20.74 801 Data for PI not includedLT : : : : : 0 0 0 0 0 0 0 0 0 14 13 LT 12.69 9 Vintage and revision differencesGB 0 0 0 0 0 0 0 0 0 0 0 0 0 0 -1 -1 GB 1.18 9 Vintage and revision differencesSK : : : : : : : : : : : : : : 0 0 SK 0.01 No differenceBG : : : : : : : : : : : : : : : 0 BG 0.00 No dataCY 0 CY 0.00 No dataHR 0 HR 0.00 No dataIE 0 IE 0.00 No dataLU 0 LU 0.00 No dataMT : : : : : : : : : : : : : : : 0 MT 0.00 No difference
46
Table A19 – D41 Portfolio Investments DebitsBoP/RoW survey November 2014 CA + KATable 1B - D42 Debits/Resources
MS 1999 2000 2001 2002 2003 2004 2005 2006 2007 2008 2009 2010 2011 2012 2013 Total MS ABS(Total) Main ReasonEU 28 -6,567 -4,657 -7,431 -5,783 -5,098 -6,619 -22,803 -33,228 -37,788 -34,586 -23,196 -18,224 -31,412 -11,555 10,270 -238,679 EU 28 277515.02FR -4,862 -2,064 -4,415 -2,908 -2,461 -3,851 -7,900 -11,558 -14,132 -15,770 -12,362 -13,470 -19,084 -17,654 2,590 -129,901 FR 129901.00 Unexplained differenceIT : : : : : : -11,448 -13,239 -13,300 -3,492 0 0 0 0 0 -41,479 IT 41479.00 994 data not reported
FI -872 -1,569 -1,897 -1,767 -1,657 -1,939 -2,773 -3,081 -3,690 -3,935 -2,504 -2,546 -2,743 -2,349 553 -32,768 FI 32768.35 12 Mistakes detected in BoP data
SE : : : : : : : -4,060 -4,920 -5,409 -2,598 -2,912 -4,708 -5,447 -28 -30,081 SE 30080.96 12 Mistakes detected in BoP data NL : : : : : : : : : -1,343 -1,334 2,594 -1,654 -1,788 15,609 12,084 NL 12084.00 1 Compilation practicesDE -860 -828 -1,109 -764 -731 -507 -372 -182 -213 -293 -561 -513 -705 -1,086 -1,320 -10,044 DE 10044.00 13 Mistakes detected in RoW data AT : : : : : : : -579 -985 -1,034 -725 -651 -758 -615 0 -5,347 AT 5347.00 Unexplained differenceBE : : : : : : : : : -1,383 -2,095 -784 -1,478 18,144 -8,549 3,854 BE 3854.43 11 Balancing of accountsCZ : : : : : : : : : -718 -753 -643 -609 -195 -846 -3,765 CZ 3764.85 1 Compilation practicesHU -73 -70 -64 -66 -45 -161 -298 -334 -554 -355 -113 -120 0 0 0 -2,253 HU 2252.93 99- Back data is not detailed enough in the BoP before 2011, but the values in the BoP and NA are the sameDK : : : : : : -133 -90 -111 -125 -31 -28 -45 50 2,496 1,984 DK 1983.53 9 Vintage and revision differencesPT 47 -115 58 -277 -200 -165 139 -92 159 -385 346 1,418 982 -297 -247 1,370 PT 1369.90 1 Compilation practicesGR : : : : : : : : : : -315 -369 -223 -136 -105 -1,148 GR 1148.00 1. Compilation PracticesRO : : : : : : : : : -321 -136 -139 -305 -129 : -1,031 RO 1030.58 994 Data not reportedEE : : : : : : : : : : : -59 -82 -46 -4 -191 EE 190.73 12 Mistakes detected in BoP dataLT : : : : : 0 0 0 0 0 0 0 0 0 63 63 LT 63.20 9 Vintage and revision differencesSK : : : : : : : : : : : : : : 60 60 SK 60.40 9 Vintage and revision differencesES 53 -11 -4 -1 -1 5 -15 -9 -40 -18 -8 -3 0 -1 -2 -55 ES 55.00 13 Mistakes detected in RoW dataLV : 0 0 0 -3 -1 -2 -4 -4 -4 -6 1 -2 -2 -2 -30 LV 29.79 801 Data for PI not includedPL : : : : : : : : : : : 0 0 -4 -2 -5 PL 5.01 9 Vintage and revision differencesGB 0 0 0 0 0 0 0 0 0 0 0 0 0 0 2 2 GB 2.35 9 Vintage and revision differencesSI : : : : : : : : : : 0 0 0 0 0 0 SI 0.00 No differenceBG : : : : : : : : : : : : : : : 0 BG 0.00 No dataCY 0 CY 0.00 No dataHR 0 HR 0.00 No dataIE 0 IE 0.00 No dataLU 0 LU 0.00 No dataMT : : : : : : : : : : : : : : : 0 MT 0.00 No difference
Table A20 – D43 Reinvested Earnings CreditsBoP/RoW survey November 2014 CA + KATable 1B - D43 - Credits/Uses/Exports
MS 1999 2000 2001 2002 2003 2004 2005 2006 2007 2008 2009 2010 2011 2012 2013 Total MS ABS(Total) Main ReasonEU 28 -206 -15 -142 -53 -505 -106 170 581 -3,124 5,024 8,707 -7,035 13,710 1,873 -730 18,150 EU 28 37819.63NL : : : : : : : : : 7,153 8,083 -6,888 11,524 -1,900 -108 17,864 NL 17864.00 1 Compilation practicesFR -224 -29 -129 -44 -65 24 544 943 -2,375 -2,058 -1 28 1,872 5,163 4,428 8,077 FR 8077.00 Unexplained differenceFI 0 0 0 1 -2 0 -3 0 5 1 -3 -6 4 0 -4,618 -4,622 FI 4621.83 Unexplained differenceAT : : : : : : : 40 -1 0 0 -110 -141 -1,637 -2,367 -4,216 AT 4216.49 Unexplained differenceBE : : : : : : : : : 0 -1 -159 -1 731 1,182 1,753 BE 1753.08 1 (see annex 1)DK : : : : : : -204 -259 -387 66 402 -22 142 -807 397 -672 DK 671.58 9 Vintage and revision differencesSE : : : : : : : -35 -21 -17 -16 0 0 -1 306 216 SE 216.03 9 Vintage and revision differences BoPGR : : : : : : : : : : -21 -11 -6 -9 -128 -175 GR 175.00 9. Revision DifferencesPT 15 13 -11 -12 -438 -130 -169 -107 -347 -122 267 137 318 332 112 -143 PT 142.64 1 Compilation practicesLT : : : : : 0 0 0 0 0 0 0 0 0 65 65 LT 65.41 9 Vintage and revision differencesES 2 1 -1 2 1 0 2 -2 2 2 -1 0 0 0 0 8 ES 8.00 Unexplained differenceRO : : : : : : : : : 0 -2 -2 0 0 : -5 RO 4.76 99 under the limitsIT : : : : : : 0 0 0 0 0 -1 0 -1 0 -2 IT 2.00 Unexplained differencePL : : : : : : : : : : : 0 -1 0 0 -1 PL 0.73 Unexplained differenceEE : : : : : : : : : : : 0 0 0 0 1 EE 0.59 9-Vintage and revision differences
LV : 0 -1 0 0 0 0 1 -1 0 0 -1 0 1 0 0 LV 0.48 Unexplained difference
SK : : : : : : : : : : : : : : 0 0 SK 0.01 No differenceCZ : : : : : : : : : 0 0 0 0 0 0 0 CZ 0.00 99-roundingHU 0 0 0 0 0 0 0 0 0 0 0 0 0 0 0 0 HU 0.00 Unexplained differenceDE 0 0 0 0 0 0 0 0 0 0 0 0 0 0 0 0 DE 0.00 No differenceGB 0 0 0 0 0 0 0 0 0 0 0 0 0 0 0 0 GB 0.00 No differenceSI : : : : : : : : : : 0 0 0 0 0 0 SI 0.00 No differenceBG : : : : : : : : : : : : : : : 0 BG 0.00 No dataCY 0 CY 0.00 No dataHR 0 HR 0.00 No dataIE 0 IE 0.00 No dataLU 0 LU 0.00 No dataMT : : : : : : : : : : : : : : : 0 MT 0.00 No difference
47

Table A21 – D43 Reinvested Earnings DebitsBoP/RoW survey November 2014 CA + KATable 1B - D43 Debits/Resources
MS 1999 2000 2001 2002 2003 2004 2005 2006 2007 2008 2009 2010 2011 2012 2013 Total MS ABS(Total) Main ReasonEU 28 60 40 411 -160 655 64 51 779 1,051 7,450 5,660 -6,019 -18,735 11,010 -7,499 -5,181 EU 28 32253.73CZ : : : : : : : : : -3,161 -860 -733 -2,467 -705 110 -7,817 CZ 7817.05 9 Vintage and revision differencesPT 164 46 413 -150 667 158 74 393 -191 339 684 873 2,284 572 366 6,692 PT 6692.27 1 Compilation practicesFR -104 -4 -2 -8 -15 -92 -13 0 1,241 2,001 -1,919 -901 -520 2,712 3,264 5,640 FR 5640.00 Unexplained differenceBE : : : : : : : : : -2 1 -763 0 103 -2,762 -3,423 BE 3422.73 9 Vintage and revision differencesFI 0 0 0 -2 3 -2 -4 -3 0 -3 -4 1 4 2 -3,324 -3,330 FI 3330.31 Unexplained differenceDK : : : : : : -4 0 0 0 0 0 0 -724 -2,300 -3,027 DK 3027.43 9 Vintage and revision differencesAT : : : : : : : 389 0 1 1 205 373 1,105 -979 1,094 AT 1093.61 Unexplained differenceNL : : : : : : : : : 8,279 7,810 -4,664 -18,373 7,975 -1,980 -953 NL 953.00 1 Compilation practicesGR : : : : : : : : : : -37 -12 -12 -9 180 110 GR 110.00 9 Vintage and revision differencesRO : : : : : : : : : -4 -14 -22 -25 -19 : -84 RO 83.98 99 under the limits
SK : : : : : : : : : : : : : : -60 -60 SK 60.40 9 Vintage and revision differences
LT : : : : : 0 0 0 3 0 0 0 0 0 -13 -10 LT 10.07 9 Vintage and revision differencesIT : : : : : : 0 -1 -1 0 0 0 0 -2 0 -4 IT 4.00 Unexplained differenceEE : : : : : : : : : : : -1 1 -1 -2 -3 EE 3.28 12 Mistakes detected in BoP dataLV : 0 0 -1 0 0 -1 1 -1 0 0 -1 0 0 0 -3 LV 2.81 Unexplained differenceES 0 -1 0 0 0 -1 -1 0 0 1 0 0 0 0 0 -2 ES 2.00 Unexplained differenceSE : : : : : : : 0 0 0 -1 0 0 0 0 -1 SE 0.53 99 RoundingPL : : : : : : : : : : : 0 0 0 0 0 PL 0.24 Unexplained differenceHU 0 0 0 0 0 0 0 0 0 0 0 0 0 0 0 0 HU 0.01 Unexplained differenceDE 0 0 0 0 0 0 0 0 0 0 0 0 0 0 0 0 DE 0.00 No differenceGB 0 0 0 0 0 0 0 0 0 0 0 0 0 0 0 0 GB 0.00 No differenceSI : : : : : : : : : : 0 0 0 0 0 0 SI 0.00 No differenceBG : : : : : : : : : : : : : : : 0 BG 0.00 No dataCY 0 CY 0.00 No dataHR 0 HR 0.00 No dataIE 0 IE 0.00 No dataLU 0 LU 0.00 No dataMT : : : : : : : : : : : : : : : 0 MT 0.00 No difference
Table A22 – D44P Other investments CreditsBoP/RoW survey November 2014 CA + KATable 1B -D44P - Credits/Uses/Exports
MS 1999 2000 2001 2002 2003 2004 2005 2006 2007 2008 2009 2010 2011 2012 2013 Total MS ABS(Total) Main ReasonEU 28 -164 -176 -193 -224 -206 -241 -475 -703 -832 -6,021 -6,605 -4,340 -5,383 -3,276 -7,951 -36,791 EU 28 36791.54NL : : : : : : : : : -4,113 -5,094 -3,091 -3,664 -1,845 -2,490 -20,297 NL 20297.00 994 RoW B Prefiiled with D.44 missing D443IT : : : : : : : : : -1,360 -964 -615 -841 -711 -659 -5,150 IT 5150.20 12 Mistakes detected in BoP dataPT -88 -95 -126 -134 -129 -147 -316 -435 -546 -362 -368 -440 -485 -347 -522 -4,542 PT 4542.23 994 RoW B Prefiiled with D.44 missing D443FR : : : : : : : : : : : : : : -2,122 -2,122 FR 2122.00 Unexplained differenceES -76 -81 -67 -90 -77 -94 -114 -208 -251 -144 -128 -132 -153 -188 -214 -2,017 ES 2017.00 994 Data not reported BoP is not compiling operation D.441BE : : : : : : : : : : : : : : -1,225 -1,225 BE 1224.81 994 Data not reported(D443)AT : : : : : : : : : : : : : : -632 -632 AT 632.00 Unexplained differenceHU : : : : : : : : : : : : -183 -104 -87 -373 HU 373.46 74 These categories are not comparable, they do not have the same content. D443 in the RoWDK : : : : : : -45 -60 -35 -8 -34 -24 -8 -23 0 -237 DK 236.73 994 Data not reported ROW figures not excluding D443RO : : : : : : : : : -35 -16 -38 -48 -57 : -195 RO 194.51 994 Data not reportedLT : : : : : : : : : : : 0 -1 -1 0 -1 LT 1.19 Unexplained differenceEE : : : : : : : : : : : : : : 0 0 EE 0.41 No differenceCZ : : : : : : : : : 0 0 0 0 0 0 0 CZ 0.00 No differenceDE 0 0 0 0 0 0 0 0 0 0 0 0 0 0 0 0 DE 0.00 No differenceGR : : : : : : : : : : 0 0 0 0 0 0 GR 0.00 No differenceLV : : : : : : : : : : : : : : 0 0 LV 0.00 No differenceSI : : : : : : : : : : 0 0 0 0 0 0 SI 0.00 No differenceBG : : : : : : : : : : : : : : : 0 BG 0.00 No dataCY 0 CY 0.00 No dataFI : : : : : : : : : : : : : : : 0 FI 0.00 No differenceGB : : : : : : : : : : : : : : : 0 GB 0.00 No differenceHR 0 HR 0.00 No dataIE 0 IE 0.00 No dataLU 0 LU 0.00 No data
MT : : : : : : : : : : : : : : : 0 MT 0.00 No difference
PL : : : : : : : : : : : : : : : 0 PL 0.00 No differenceSE : : : : : : : : : : : : : : : 0 SE 0.00 No differenceSK : : : : : : : : : : : : : : : 0 SK 0.00 No difference
48

Table A23 – D44P Other investments DebitsBoP/RoW survey November 2014 CA + KATable 1B -D44P- Debits/Resources
MS 1999 2000 2001 2002 2003 2004 2005 2006 2007 2008 2009 2010 2011 2012 2013 Total MS ABS(Total) Main ReasonEU 28 -152 -199 -167 -162 -137 -145 -339 -346 -330 -940 -1,034 -1,290 -1,216 -1,220 -3,598 -11,276 EU 28 11280.07NL : : : : : : : : : -624 -786 -789 -801 -683 -723 -4,406 NL 4406.00 994 Data not reported RoW B Prefiiled with D.44 missing D443FR : : : : : : : : : : : : : : -2,249 -2,249 FR 2249.00 Unexplained differenceES -43 -53 -56 -68 -71 -78 -127 -174 -156 -72 -77 -126 -167 -186 -205 -1,659 ES 1659.00 994 Data not reported BoP is not compiling operation D.441GB -79 -120 -80 -64 -45 -50 -63 -94 -102 -49 -21 -45 -31 -20 -21 -884 GB 884.48 1 Compilation practiceRO : : : : : : : : : -160 -39 -218 -139 -219 : -775 RO 775.25 994 Data not reportedDE -23 -21 -28 -28 -17 -10 -13 -16 -18 -16 -38 -39 -38 -38 -38 -381 DE 381.00 1 Row Insurances included but not in BoP DataDK : : : : : : -112 -38 -29 -12 -55 -56 -18 -53 121 -252 DK 251.54 75 Estat BoP errorBE : : : : : : : : : : : : : : -246 -246 BE 245.67 994 Data not reported(D443)AT : : : : : : : : : : : : : : -210 -210 AT 209.90 Unexplained differencePT -7 -5 -3 -3 -4 -7 -24 -25 -25 -8 -15 -13 -10 -10 -11 -169 PT 169.39 994 Data not reported RoW B Prefiiled with D.44 missing D443HU : : : : : : : : : : : : -11 -12 -18 -41 HU 40.86 99- These categories are not comparable, they do not have the same content. D443 in the RoWSI : : : : : : : : : : -2 -4 -1 0 4 -3 SI 3.00 Unexplained differenceSK : : : : : : : : : : : : : : -3 -3 SK 2.99 10LT : : : : : : : : : : : 1 0 1 0 2 LT 1.94 10 Different data sources usedEE : : : : : : : : : : : : : : 0 0 EE 0.05 No differenceCZ : : : : : : : : : 0 0 0 0 0 0 0 CZ 0.00 No differenceGR : : : : : : : : : : 0 0 0 0 0 0 GR 0.00 No differenceIT : : : : : : : : : 0 0 0 0 0 0 0 IT 0.00 No differenceLV : : : : : : : : : : : : : : 0 0 LV 0.00 No differenceBG : : : : : : : : : : : : : : : 0 BG 0.00 No dataCY 0 CY 0.00 No dataFI : : : : : : : : : : : : : : : 0 FI 0.00 No differenceHR 0 HR 0.00 No dataIE 0 IE 0.00 No dataLU 0 LU 0.00 No data
MT : : : : : : : : : : : : : : : 0 MT 0.00 No difference
PL : : : : : : : : : : : : : : : 0 PL 0.00 No differenceSE : : : : : : : : : : : : : : : 0 SE 0.00 No difference
Table A24 – IN2 Secondary Income CreditsBoP/RoW survey November 2014 CA + KATable 1B - Secondary Income- Credits/Uses/Exports
MS 1999 2000 2001 2002 2003 2004 2005 2006 2007 2008 2009 2010 2011 2012 2013 Total MS ABS(Total) Main ReasonEU 28 495 -4,025 -1,041 -4,081 -4,188 -2,369 -2,346 -2,246 -2,590 -2,464 -2,183 -7,933 -5,884 -5,253 -5,141 -51,249 EU 28 246915.69FR -3,454 -5,200 -6,231 -8,379 -8,261 -7,012 -7,193 -6,107 -5,930 -7,047 -5,996 -7,109 -7,805 -8,671 -8,358 -102,753 FR 102753.10 Unexplained differenceGB 4,821 3,419 7,346 4,949 5,159 5,592 5,582 5,518 5,515 6,360 6,272 3,797 3,509 4,012 4,423 76,272 GB 76272.50 13 Mistakes detected in RoW dataES -794 -1,062 -997 -780 -717 -374 -629 -1,381 -1,612 -1,529 -1,625 -2,030 -58 1,396 792 -11,400 ES 11400.00 10 Different data sources usedDE -352 -1,371 -1,365 -328 -830 -640 -471 -387 -372 355 -734 -1,789 -838 -1,403 -845 -11,370 DE 11370.00 1 1, 9 ,10 Differences due to EU budgetFI 654 788 799 806 802 312 300 677 668 659 675 636 642 760 -57 9,118 FI 9118.15 Unexplained differencePL : : : : : : : : : : : -1,409 -2,280 -2,001 -2,235 -7,925 PL 7924.63 10 Different data sources usedPT -165 -280 -253 -231 -251 -453 -418 -512 -636 -524 -732 -827 -735 -522 -493 -7,033 PT 7032.80 994 data not reported taxes on propertySE : : : : : : : : : 877 742 998 867 774 791 5,049 SE 5049.45 3 Accrual recording NA D74CZ : : : : : : : : : 457 318 691 656 247 1,052 3,422 CZ 3422.07 10 Different data sources usedAT : : : : : : : -386 -751 -738 -114 -207 -365 -338 -71 -2,970 AT 2969.80 Unexplained differenceNL : : : : : : : : : -996 -1,418 -438 184 -40 -72 -2,780 NL 2780.00 999 Sum of explained in subtotals of IN2BE : : : : : : : : : 332 847 -126 207 197 535 1,992 BE 1991.65 10 Different data sources usedGR : : : : : : : : : : 218 181 311 400 324 1,434 GR 1434.00 10 Different data sources usedRO : : : : : : : : : -463 -197 -194 -200 -229 : -1,283 RO 1282.54 994 Data not reportedDK : : : : : : -54 0 0 -40 -457 -194 0 95 -379 -1,029 DK 1029.44 9 Vintage and revision differencesSK : : : : : : : : : : : : : : -456 -456 SK 456.12 1 Compilation practicesSI : : : : : : : : : : 15 84 102 67 -14 254 SI 254.00 Unexplained differenceLT : : : : : 167 147 -44 -20 -14 -2 -10 -30 6 -29 172 LT 171.61 9 Vintage and revision differencesHU -216 -319 -339 -116 -89 40 389 418 558 -155 6 4 -37 -8 -38 98 HU 98.42 9 Vintage and revision differences (other sector)IT : : : : : : 0 -43 -11 0 0 -2 -26 -2 0 -84 IT 84.00 Unexplained differenceEE : : : : : : : : : : : 12 13 8 -11 21 EE 21.42 1 Compilation practicesLV : 1 0 -1 -1 -1 1 0 1 1 -1 0 0 0 0 0 LV 0.00 Unexplained differenceBG : : : : : : : : : : : : : : : 0 BG 0.00 No dataCY 0 CY 0.00 No dataHR 0 HR 0.00 No dataIE 0 IE 0.00 No dataLU 0 LU 0.00 No dataMT : : : : : : : : : : : : : : : 0 MT 0.00 No difference
49
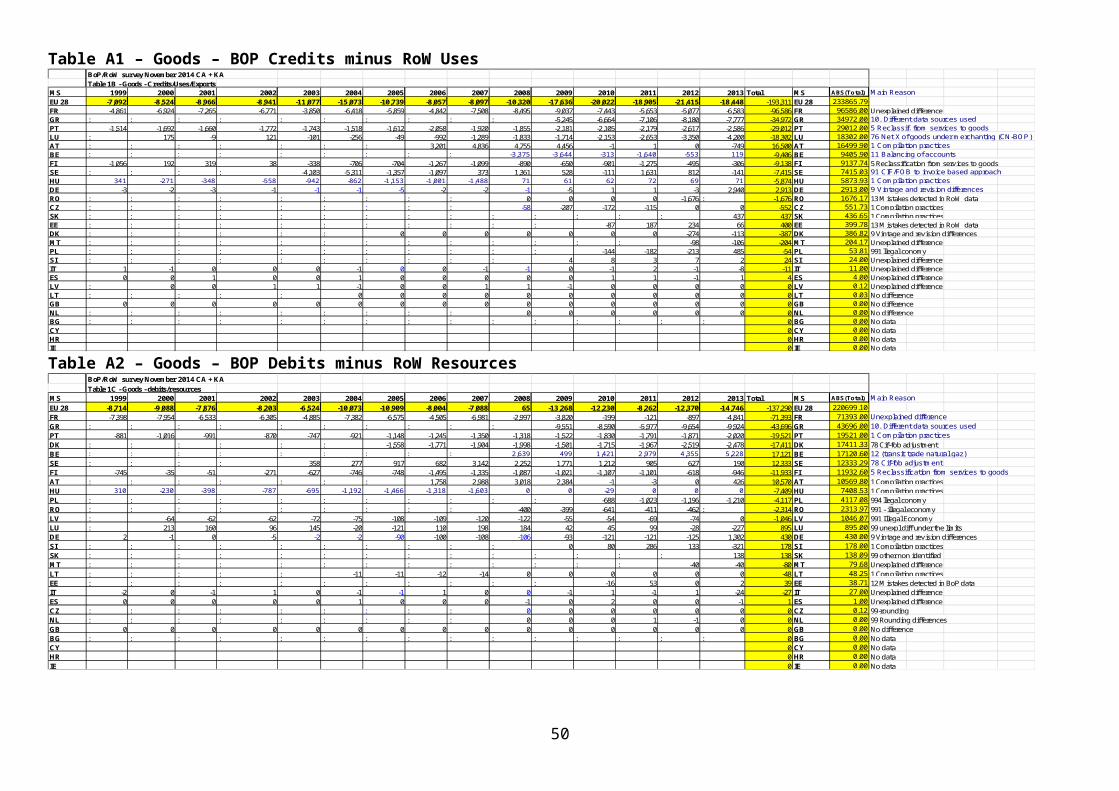
Table A25 – IN2 Secondary Income DebitsBoP/RoW survey November 2014 CA + KATable 1B -Secondary Income Debits/Resources
MS 1999 2000 2001 2002 2003 2004 2005 2006 2007 2008 2009 2010 2011 2012 2013 Total MS ABS(Total) Main ReasonEU 28 -8,217 -7,105 -6,554 -6,882 -6,043 -3,452 -5,957 -6,242 -9,313 -9,106 -2,772 -9,296 -11,400 -7,999 -9,926 -110,265 EU 28 171571.46FR -6,913 -5,737 -6,171 -7,048 -5,663 -4,182 -5,877 -7,766 -9,078 -8,201 -7,656 -7,802 -10,964 -10,122 -10,240 -113,420 FR 113420.30 Unexplained differenceDE 379 411 956 1,117 685 867 537 1,997 1,213 -353 2,067 1,337 775 1,723 940 14,651 DE 14651.00 10 Different data sources for EU budgetES -1,171 -1,272 -924 -668 -540 -185 -706 -651 -1,488 -1,677 -1,258 -1,370 -405 -192 782 -11,725 ES 11725.00 10 Different data sources usedBE : : : : : : : : : 1,230 5,328 646 980 674 1,076 9,934 BE 9934.19 10 Different data sources usedPL : : : : : : : : : : : -1,520 -1,762 -2,160 -1,783 -7,225 PL 7225.34 10 Different data sources usedNL : : : : : : : : : 495 304 680 818 1,133 613 4,043 NL 4043.00 999 Sum of explained in subtotals of IN2GR : : : : : : : : : : -769 -271 -439 59 -402 -1,822 GR 1822.00 10 Different data sources usedLT : : : : : 61 -30 -228 -212 -212 -212 -186 -229 -245 -315 -1,808 LT 1807.57 9 Vintage and revision differencesFI -91 -90 127 106 104 130 168 182 217 226 151 150 187 201 -274 1,493 FI 1493.24 Unexplained differenceHU -373 -416 -509 -464 -568 38 356 269 344 -12 -7 -37 -33 -6 93 -1,325 HU 1324.74 10 Different data sources used (total)RO : : : : : : : : : -203 -155 -157 -166 -170 : -852 RO 851.57 1 compilation practicesDK : : : : : : -97 -44 0 -40 -458 -195 0 61 3 -769 DK 768.74 9 Vintage and revision differencesPT -50 -1 -33 75 -61 -181 -306 -1 -306 271 4 7 11 9 -110 -670 PT 670.37 994 data not reported taxes on propertySE : : : : : : : : : -581 -230 -596 -151 997 57 -503 SE 503.00 9 Vintage and revision differences in BoPSK : : : : : : : : : : : : : : -443 -443 SK 443.36 1 Compilation practicesSI : : : : : : : : : : 44 75 102 66 59 346 SI 346.00 Unexplained differenceCZ : : : : : : : : : -49 -5 -87 -101 -33 -21 -296 CZ 295.66 10 Different data sources usedEE : : : : : : : : : : : 29 22 11 73 134 EE 134.11 1 Compilation practicesIT : : : : : : -1 -2 -1 -1 -3 1 -44 -6 -2 -59 IT 59.00 Unexplained differenceAT : : : : : : : 1 -2 0 83 1 1 0 -31 52 AT 51.80 Unexplained differenceLV : 1 -1 0 -1 0 0 0 0 -1 0 1 -1 0 0 -1 LV 1.49 Unexplained differenceGB 0 0 0 0 0 0 0 0 0 0 0 0 0 0 0 0 GB 0.00 No differenceBG : : : : : : : : : : : : : : : 0 BG 0.00 No dataCY 0 CY 0.00 No dataHR 0 HR 0.00 No dataIE 0 IE 0.00 No dataLU 0 LU 0.00 No dataMT : : : : : : : : : : : : : : : 0 MT 0.00 No difference
Table A26 – D5 Current Taxes on Income CreditsBoP/RoW survey November 2014 CA + KATable 1B - D5 - Credits/Uses/Exports
MS 1999 2000 2001 2002 2003 2004 2005 2006 2007 2008 2009 2010 2011 2012 2013 Total MS ABS(Total) Main ReasonEU 28 -229 -240 -793 -635 -496 -457 -519 -1,352 -1,581 -6,048 -5,377 -5,472 -5,967 -6,255 -5,640 -41,060 EU 28 43069.83FR -35 213 -251 -89 5 0 -370 -944 -1,173 -2,916 -2,236 -2,574 -3,089 -3,447 -3,341 -20,247 FR 20247.00 Unexplained differenceNL : : : : : : : : : -2,246 -2,214 -1,847 -2,016 -2,055 -1,654 -12,032 NL 12032.00 994 Taxes on wagesPT -110 -203 -260 -262 -245 -296 -403 -500 -631 -614 -651 -793 -634 -517 -399 -6,518 PT 6518.00 994 data not reported taxes on propertyDE -63 -144 -163 -158 -145 -128 -90 -80 -82 -87 -84 -66 -62 -77 -93 -1,522 DE 1522.00 1 1,9,10 Differences due to compensation of employees, differences not apportionableIT : : : : : : 336 283 378 0 0 0 0 0 0 997 IT 997.00 994 data not reportedSE : : : : : : : -110 -73 -74 -61 -68 -67 -74 -83 -610 SE 610.25 9 Vintage and revision differences in BoPBE : : : : : : : : : -112 -131 -124 -96 -84 -45 -592 BE 592.32 Mistakes detected in BoP data HU -21 -106 -119 -126 -111 -33 8 0 0 0 0 0 0 0 0 -507 HU 506.78 9 Vintage and revision differences (government)SK : : : : : : : : : : : : : : -34 -34 SK 34.00 1 compilation practiceCZ : : : : : : : : : 0 0 0 0 0 4 4 CZ 3.54 9 Vintage and revision differencesES 0 0 0 0 0 0 0 0 0 0 0 0 -1 0 4 3 ES 3.00 Unexplained differenceSI : : : : : : : : : : 0 0 -1 -1 0 -2 SI 2.00 Unexplained differenceDK : : : : : : 0 0 0 0 0 0 0 1 0 1 DK 0.94 Unexplained differenceAT : : : : : : : -1 0 0 -1 0 0 1 0 0 AT 0.40 Unexplained differenceEE : : : : : : : : : : : 1 -1 0 1 0 EE 0.35 13 Mistakes detected in RoW dataLT : : : : : 0 0 0 0 0 0 0 0 0 0 0 LT 0.17 Unexplained differenceRO : : : : : : : : : 0 0 0 0 0 : 0 RO 0.08 Unexplained differenceGB 0 0 0 0 0 0 0 0 0 0 0 0 0 0 0 0 GB 0.00 No differenceGR : : : : : : : : : : 0 0 0 0 0 0 GR 0.00 No differenceLV : 0 0 0 0 0 0 0 0 0 0 0 0 0 0 0 LV 0.00 No differencePL : : : : : : : : : : : 0 0 0 0 0 PL 0.00 No difference
BG : : : : : : : : : : : : : : : 0 BG 0.00 No data
CY 0 CY 0.00 No dataFI : : : : : : : : : : : : : : : 0 FI 0.00 No differenceHR 0 HR 0.00 No dataIE 0 IE 0.00 No dataLU 0 LU 0.00 No dataMT : : : : : : : : : : : : : : : 0 MT 0.00 No difference
50
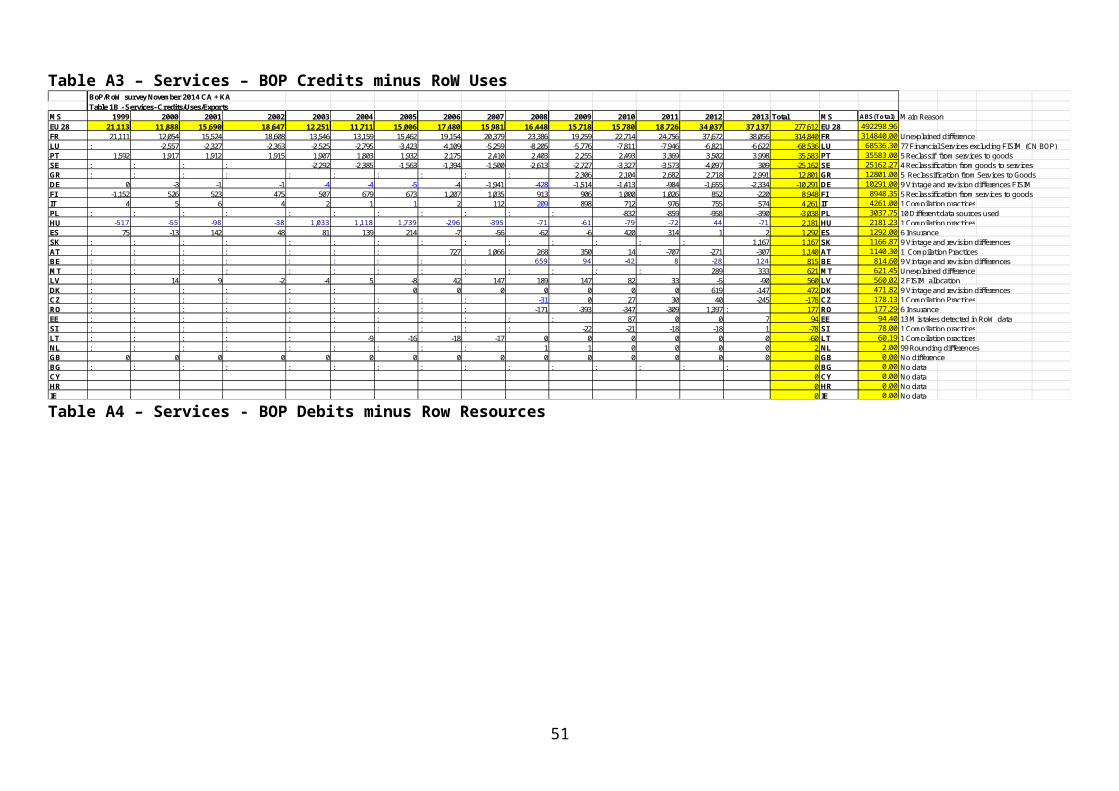
Table A27 – D5 Current Taxes on Income DebitsBoP/RoW survey November 2014 CA + KATable 1B -D5 Debits/Resources
MS 1999 2000 2001 2002 2003 2004 2005 2006 2007 2008 2009 2010 2011 2012 2013 Total MS ABS(Total) Main ReasonEU 28 -10 85 144 87 91 268 1,969 2,109 2,869 279 379 529 245 298 178 9,520 EU 28 22299.07IT : : : : : : 1,709 2,046 2,915 0 0 0 0 0 0 6,670 IT 6670.00 994 data not reportedFR 172 315 417 363 384 497 421 440 553 351 498 494 451 283 94 5,733 FR 5733.00 Unexplained differenceNL : : : : : : : : : 553 456 699 410 674 705 3,497 NL 3497.00 1 Compilation practicesSE : : : : : : : -160 -324 -384 -401 -412 -409 -433 -471 -2,994 SE 2994.09 9 Vintage and revision differences in BoPPT -63 -86 -102 -100 -117 -128 -157 -212 -268 -236 -166 -245 -215 -226 -172 -2,493 PT 2493.00 994 data not reported taxes on propertyHU -121 -148 -168 -168 -184 -96 0 2 2 2 1 3 9 6 75 -785 HU 784.64 9 Vintage and revision differences (other sector)SK : : : : : : : : : : : : : : -58 -58 SK 58.00 1 Compilation practicesDE 2 4 -4 -9 7 -5 -3 -6 -8 -7 -10 -10 -5 -8 7 -55 DE 55.00 1 1,9,10 Differences due to compensation of employees, differences not apportionablePL : : : : : : : : : : : 0 5 0 0 5 PL 5.10 9 Vintage and revision differencesDK : : : : : : 0 0 0 0 0 0 0 2 0 2 DK 2.15 Unexplained differenceBE : : : : : : : : : 1 0 -2 0 0 0 -2 BE 2.10 9 Vintage and revision differencesEE : : : : : : : : : : : -2 0 0 0 -1 EE 1.33 9-Vintage and revision differencesAT : : : : : : : 1 -1 0 0 1 1 1 -1 1 AT 1.00 Unexplained differenceSI : : : : : : : : : : 0 2 0 -1 -2 -1 SI 1.00 Unexplained differenceES 0 0 1 1 1 0 -1 -1 0 0 0 0 0 0 0 1 ES 1.00 Unexplained differenceLT : : : : : 0 -1 0 0 0 0 0 0 0 0 -1 LT 0.51 Unexplained differenceCZ : : : : : : : : : 0 0 0 0 0 0 0 CZ 0.08 99-rounding
RO : : : : : : : : : 0 0 0 0 0 : 0 RO 0.06 Unexplained difference
GB 0 0 0 0 0 0 0 0 0 0 0 0 0 0 0 0 GB 0.00 No differenceGR : : : : : : : : : : 0 0 0 0 0 0 GR 0.00 No differenceLV : 0 0 0 0 0 0 0 0 0 0 0 0 0 0 0 LV 0.00 No differenceBG : : : : : : : : : : : : : : : 0 BG 0.00 No dataCY 0 CY 0.00 No dataFI : : : : : : : : : : : : : : : 0 FI 0.00 No differenceHR 0 HR 0.00 No dataIE 0 IE 0.00 No dataLU 0 LU 0.00 No dataMT : : : : : : : : : : : : : : : 0 MT 0.00 No difference
Table A28 – D61 Social Contributions CreditsBoP/RoW survey November 2014 CA + KATable 1B - D61 - Credits/Uses/Exports
MS 1999 2000 2001 2002 2003 2004 2005 2006 2007 2008 2009 2010 2011 2012 2013 Total MS ABS(Total) Main ReasonEU 28 -549 -684 -767 -821 -703 -611 -774 -757 -755 -929 -387 -590 -881 90 -870 -9,988 EU 28 14600.42FR -234 -293 -284 -381 -332 -290 -269 -362 -430 -481 -466 -427 -438 -341 -318 -5,346 FR 5346.00 Unexplained differenceDE -23 -44 -94 -58 61 -42 -93 50 189 69 237 519 213 1,093 3 2,080 DE 2080.00 1,9,10 Diffenrecces due to compensation of employees, differences not apportionableHU -225 -263 -300 -302 -360 -203 0 0 0 0 0 0 0 0 0 -1,654 HU 1653.74 75 Estat bop error D61 data are on wrong side in prefilled tablePL : : : : : : : : : : : -391 -389 -393 -380 -1,553 PL 1552.64 Unexplained differenceRO : : : : : : : : : -462 -197 -194 -200 -229 : -1,283 RO 1282.76 994 Data not reportedIT : : : : : : -336 -326 -389 0 0 0 0 0 0 -1,051 IT 1050.83 994 data not reportedFI -67 -82 -88 -81 -74 -74 -77 -76 -77 : : : : : : -696 FI 696.00 Unexplained differenceSE : : : : : : : -45 -47 -49 -44 -48 -55 -59 -66 -414 SE 413.85 9 Vintage and revision differences in BoPSK : : : : : : : : : : : : : : -192 -192 SK 192.00 1 Compilation practicesLT : : : : : 0 1 1 1 12 20 11 12 16 17 90 LT 89.77 1 Compilation practicesEE : : : : : : : : : : : 0 0 0 85 85 EE 85.22 13 Mistakes detected in RoW dataBE : : : : : : : : : -17 68 -24 -20 -26 -27 -46 BE 45.60 1 Compilation practicesPT 0 0 0 1 1 -1 0 1 -1 0 -6 -33 -1 0 1 -39 PT 38.73 Unexplained differenceDK : : : : : : 0 0 0 0 0 0 0 37 0 37 DK 37.35 9 Vintage and revision differencesSI : : : : : : : : : : -2 -3 -3 -7 -6 -21 SI 21.00 Unexplained differenceCZ : : : : : : : : : 0 2 1 0 -2 13 14 CZ 13.94 1 Compilation practicesES 0 -1 -1 1 1 -1 1 0 0 -1 0 0 0 0 0 -1 ES 1.00 Unexplained difference
AT : : : : : : : 0 0 0 0 0 0 0 0 0 AT 0.00 No difference
GB 0 0 0 0 0 0 0 0 0 0 0 0 0 0 0 0 GB 0.00 No differenceGR : : : : : : : : : : 0 0 0 0 0 0 GR 0.00 No differenceLV : 0 0 0 0 0 0 0 0 0 0 0 0 0 0 0 LV 0.00 No differenceNL : : : : : : : : : 0 0 0 0 0 0 0 NL 0.00 No differenceBG : : : : : : : : : : : : : : : 0 BG 0.00 No dataCY 0 CY 0.00 No dataHR 0 HR 0.00 No dataIE 0 IE 0.00 No dataLU 0 LU 0.00 No dataMT : : : : : : : : : : : : : : : 0 MT 0.00 No difference
51

Table A29 – D61 Social Contributions DebitsBoP/RoW survey November 2014 CA + KATable 1B - D61 Debits/Resources
MS 1999 2000 2001 2002 2003 2004 2005 2006 2007 2008 2009 2010 2011 2012 2013 Total MS ABS(Total) Main ReasonEU 28 -502 -874 -921 -488 -849 -698 -595 -665 -595 -1,433 -1,392 -1,540 -1,471 -1,613 -1,648 -15,284 EU 28 15918.18NL : : : : : : : : : -655 -921 -1,007 -993 -1,031 -1,074 -5,681 NL 5681.00 1 Compilation practicesDE -224 -578 -596 -111 -466 -448 -291 -230 -211 -225 10 2 7 -36 -40 -3,437 DE 3437.00 1 1,9,10 Differences due to compensation of employees, differences not apportionableFR -229 -240 -260 -296 -291 -157 -144 -158 -171 -156 -150 -175 -122 -97 -86 -2,732 FR 2732.00 Unexplained differenceSE : : : : : : : -107 -140 -173 -173 -196 -206 -223 -223 -1,440 SE 1440.21 9 Vintage and revision differences in BoPDK : : : : : : -91 -99 -137 -182 -187 -135 -147 -145 -144 -1,268 DK 1268.26 75 Estat BoP error Eurostat misreading of the BOP reportHU -49 -53 -60 -73 -81 -40 0 0 0 0 0 0 0 0 0 -356 HU 355.58 9 Vintage and revision differences (other sector)FI 0 -3 -6 -7 -12 -54 -61 -68 -80 : : : : : : -291 FI 291.00 Unexplained differenceBE : : : : : : : : : -37 12 -51 -42 -73 -63 -254 BE 253.70 1 Compilation practicesLT : : : : : 0 0 0 0 31 28 43 38 17 20 178 LT 177.53 1 Compilation practicesIT : : : : : : -8 -3 144 0 0 0 0 0 0 133 IT 133.10 994 data not reportedRO : : : : : : : : : -37 -13 -22 -6 -26 : -104 RO 103.53 994 Data not reportedSK : : : : : : : : : : : : : : -39 -39 SK 39.00 1 Compilation practicesPT -1 0 0 0 0 0 0 0 1 0 0 1 0 0 0 2 PT 2.41 Unexplained differenceES 1 0 0 -1 1 1 0 -1 0 0 1 0 0 0 0 2 ES 2.00 Unexplained difference
SI : : : : : : : : : : 0 1 0 0 0 1 SI 1.00 Unexplained difference
EE : : : : : : : : : : : 0 0 0 0 1 EE 0.86 13 Mistakes detected in RoW dataAT : : : : : : : 0 0 0 0 0 0 0 0 0 AT 0.00 No differenceCZ : : : : : : : : : 0 0 0 0 0 0 0 CZ 0.00 1 Compilation practicesGB 0 0 0 0 0 0 0 0 0 0 0 0 0 0 0 0 GB 0.00 No differenceGR : : : : : : : : : : 0 0 0 0 0 0 GR 0.00 No differenceLV : 0 0 0 0 0 0 0 0 0 0 0 0 0 0 0 LV 0.00 No differenceBG : : : : : : : : : : : : : : : 0 BG 0.00 No dataCY 0 CY 0.00 No dataHR 0 HR 0.00 No dataIE 0 IE 0.00 No dataLU 0 LU 0.00 No dataMT : : : : : : : : : : : : : : : 0 MT 0.00 No differencePL : : : : : : : : : : : : : : : 0 PL 0.00 No difference
Table A30 – D62 Social Benefits CreditsBoP/RoW survey November 2014 CA + KATable 1B - D62 - Credits/Uses/Exports
MS 1999 2000 2001 2002 2003 2004 2005 2006 2007 2008 2009 2010 2011 2012 2013 Total MS ABS(Total) Main ReasonEU 28 -11 -39 -35 -51 -76 -90 1,330 1,611 1,299 136 125 236 -49 -23 239 4,602 EU 28 8216.31IT : : : : : : 1,436 1,729 1,433 0 0 0 0 0 0 4,598 IT 4598.00 994 data not reportedFR 96 93 96 98 98 103 102 117 124 142 141 276 5 3 306 1,800 FR 1800.00 Unexplained differenceFI -94 -115 -114 -128 -149 -160 -165 -180 -184 : : : : : -1,289 FI 1289.00 Unexplained differenceHU -14 -17 -16 -21 -24 -32 -41 -47 -65 0 0 0 0 0 0 -277 HU 276.97 9 Vintage and revision differences (other sector)SE : : : : : : : -5 -7 -8 -8 -17 -21 -24 -28 -117 SE 117.00 9 Vintage and revision differences in BoPSI : : : : : : : : : : -2 -8 -11 -2 -7 -30 SI 30.00 Unexplained differenceRO : : : : : : : : : : -2 -1 -21 -2 : -26 RO 25.55 99 under the limitsDE 0 0 0 0 0 0 0 0 0 0 0 0 0 0 -25 -25 DE 25.00 Unexplained differenceBE : : : : : : : : : -1 -1 -18 -1 -1 -1 -23 BE 22.60 9 Vintage and revision differencesLT : : : : : 0 0 0 -2 -1 -1 0 -1 -2 -2 -10 LT 10.44 9 Vintage and revision differencesDK : : : : : : 0 0 0 0 0 0 0 6 0 6 DK 5.51 Unexplained differenceSK : : : : : : : : : : : : : : -4 -4 SK 4.00 1 Compilation practiceES 0 0 0 1 0 0 0 0 1 1 0 0 0 0 0 3 ES 3.00 Unexplained differencePL : : : : : : : : : : : 0 0 0 -3 -3 PL 2.86 Unexplained differenceAT : : : : : : : -2 0 2 -1 1 2 -1 2 3 AT 2.80 Unexplained differencePT 1 0 0 -1 -1 -1 -2 -1 1 1 0 1 0 1 0 -2 PT 1.83 Unexplained differenceLV : 0 -1 0 0 0 0 0 -1 0 -1 1 0 0 1 -1 LV 1.05 Unexplained differenceEE : : : : : : : : : : : 0 0 0 0 -1 EE 0.71 9-Vintage and revision differencesCZ : : : : : : : : : 0 0 0 0 0 0 0 CZ 0.00 No differenceGR : : : : : : : : : : 0 0 0 0 0 0 GR 0.00 No difference
NL : : : : : : : : : 0 0 0 0 0 0 0 NL 0.00 No difference
BG : : : : : : : : : : : : : : : 0 BG 0.00 No dataCY 0 CY 0.00 No dataGB : : : : : : : : : : : : : : : 0 GB 0.00 No differenceHR 0 HR 0.00 No dataIE 0 IE 0.00 No dataLU 0 LU 0.00 No dataMT : : : : : : : : : : : : : : : 0 MT 0.00 No difference
52
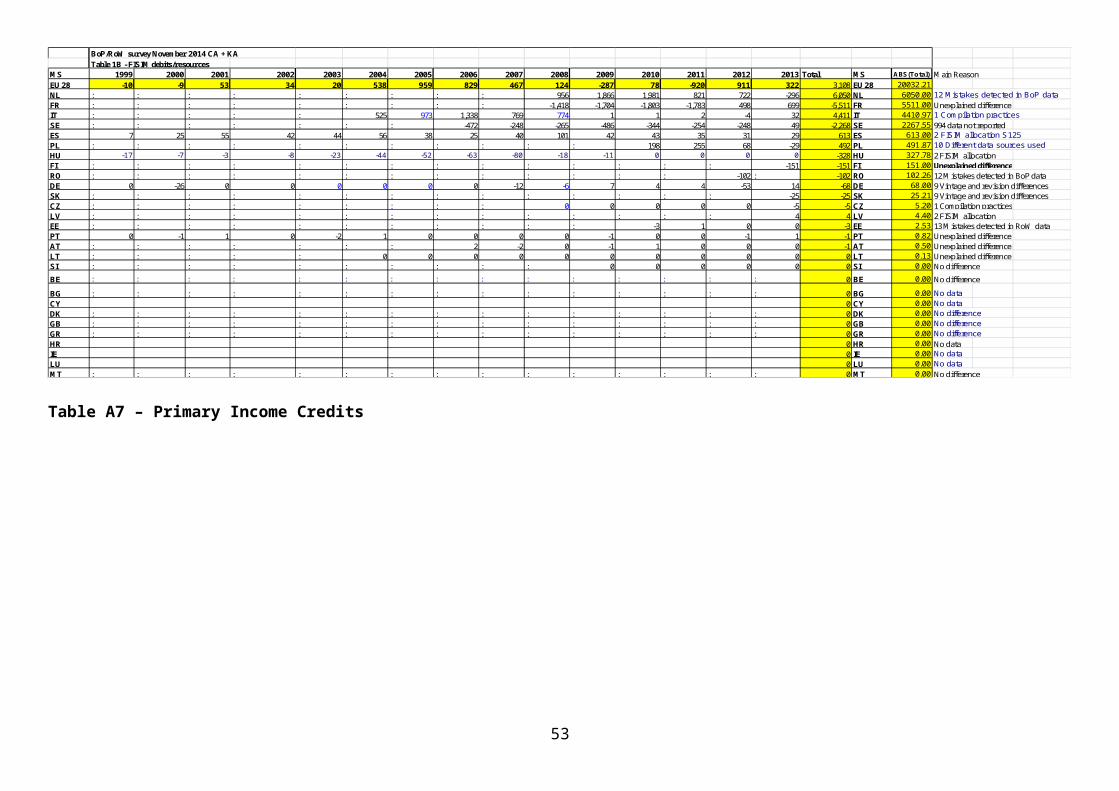
Table A31 – D62 Social Benefits DebitsBoP/RoW survey November 2014 CA + KATable 1B - D62 Debits/Resources
MS 1999 2000 2001 2002 2003 2004 2005 2006 2007 2008 2009 2010 2011 2012 2013 Total MS ABS(Total) Main ReasonEU 28 -893 -774 -764 -887 151 -683 -852 -1,600 -1,405 -1,570 -1,712 -1,551 -1,973 -2,150 -2,136 -18,799 EU 28 19032.73FR -344 -322 -461 -465 494 -120 -187 -670 -428 -322 -269 -16 -382 -519 -452 -4,463 FR 4463.00 Unexplained differenceDE -519 -417 -277 -377 -292 -304 -256 -177 -180 -271 -259 -259 -262 -243 -239 -4,332 DE 4332.00 10 Different data sourcesNL : : : : : : : : : -568 -701 -712 -722 -719 -717 -4,139 NL 4139.00 1 Compilation practicesSE : : : : : : : -342 -359 -362 -347 -392 -416 -484 -506 -3,209 SE 3209.36 9 Vintage and revision differences in BoPDK : : : : : : -138 -150 -165 -183 -178 -177 -194 -182 -187 -1,554 DK 1553.95 75 Eurostat misreading of the BOP reportFI 0 0 0 0 0 -202 -208 -211 -216 : : : : : : -837 FI 837.00 Unexplained differenceHU -13 -13 -26 -43 -48 -55 -61 -51 -57 0 0 0 0 0 0 -368 HU 367.72 9 Vintage and revision differences (government)PT -18 -22 0 0 -1 -1 0 0 0 137 0 0 0 0 -1 98 PT 97.58 9 Vintages and revisions differencesSI : : : : : : : : : : 5 5 -1 1 4 14 SI 14.00 Unexplained differenceLV : 0 -1 -1 -2 -2 0 1 0 -1 0 0 0 -1 1 -5 LV 5.32 Unexplained differenceAT : : : : : : : 1 0 1 0 1 2 2 0 5 AT 5.00 Unexplained differenceLT : : : : : 0 0 0 0 0 0 0 0 -4 0 -5 LT 4.60 Mistakes detected in BoP data BE : : : : : : : : : 0 37 -1 0 0 -39 -3 BE 2.90 994 Data not reported (in case of non availability, last data indexed in RoW)ES 0 1 0 -1 0 0 -1 -1 0 0 1 0 0 0 0 -1 ES 1.00 Unexplained differencePL : : : : : : : : : : : 0 0 0 0 0 PL 0.24 Unexplained differenceEE : : : : : : : : : : : 1 1 -1 -1 0 EE 0.04 13 Mistakes detected in RoW dataRO : : : : : : : : : : 0 : : 0 : 0 RO 0.02 No differenceCZ : : : : : : : : : 0 0 0 0 0 0 0 CZ 0.00 No difference
GB 0 0 0 0 0 0 0 0 0 0 0 0 0 0 0 0 GB 0.00 No difference
GR : : : : : : : : : : 0 0 0 0 0 0 GR 0.00 No differenceIT : : : : : : 0 0 0 0 0 0 0 0 0 0 IT 0.00 No differenceSK : : : : : : : : : : : : : : 0 0 SK 0.00 No differenceBG : : : : : : : : : : : : : : : 0 BG 0.00 No dataCY 0 CY 0.00 No dataHR 0 HR 0.00 No dataIE 0 IE 0.00 No dataLU 0 LU 0.00 No dataMT : : : : : : : : : : : : : : : 0 MT 0.00 No difference
Table A32 – D71 Net non life insurance CreditsBoP/RoW survey November 2014 CA + KATable 1B -D71 - Credits/Uses/Exports
MS 1999 2000 2001 2002 2003 2004 2005 2006 2007 2008 2009 2010 2011 2012 2013 Total MS ABS(Total) Main ReasonEU 28 -3,375 -3,794 -3,472 -5,056 -4,772 -4,392 -5,608 -4,424 -3,727 -1,098 -262 -1,319 -1,167 -840 -1,631 -44,937 EU 28 60143.03FR -2,994 -3,525 -3,193 -4,880 -4,613 -4,546 -4,659 -3,817 -3,303 -2,198 -1,676 -2,071 -2,087 -2,541 -2,956 -49,059 FR 49059.00 Unexplained differenceSE : : : : : : : 334 281 388 352 357 356 632 506 3,207 SE 3206.88 12 Mistakes detected in BoP data BE : : : : : : : : : 543 468 361 496 364 370 2,602 BE 2602.10 10 (accounting data of insurance companies data used in RoW)IT : : : : : : -864 -759 -681 0 1 1 0 0 0 -2,302 IT 2302.00 994 data not reportedES -95 -69 -84 4 -50 204 -31 -154 8 164 578 12 50 725 497 1,759 ES 1759.00 10 Different data sources usedFI -187 -195 -188 -178 -112 -36 -50 -27 -37 : : : : : : -1,010 FI 1010.00 Unexplained differenceHU -21 -10 -11 -9 -17 -18 -4 -6 -8 0 0 0 0 0 0 -105 HU 105.23 10 Different data sources used (other sector)SK : : : : : : : : : : : : : : -46 -46 SK 46.00 1 Compilation practicesSI : : : : : : : : : : 7 15 10 -1 -16 15 SI 15.00 1 Compilation practicesPT -79 6 4 7 21 7 4 7 6 6 9 4 3 2 3 10 PT 10.05 1 Compilation practicesEE : : : : : : : : : : : 1 4 3 1 10 EE 9.92 13 Mistakes detected in RoW dataDK : : : : : : 0 0 0 0 0 0 0 -21 14 -7 DK 7.28 9 Vintage and revision differencesLT : : : : : -4 -3 -2 9 -1 -2 0 0 -1 -3 -7 LT 7.05 10 Different data sources usedDE 1 0 0 0 0 1 -1 0 -1 0 0 -1 0 -2 0 -3 DE 3.00 Unexplained differenceRO : : : : : : : : : 0 0 0 0 0 : 0 RO 0.28 Unexplained differencePL : : : : : : : : : : : 0 0 0 0 0 PL 0.24 Unexplained differenceAT : : : : : : : 0 -1 0 1 0 1 0 0 0 AT 0.00 Unexplained differenceCZ : : : : : : : : : 0 0 0 0 0 0 0 CZ 0.00 No differenceGB 0 0 0 0 0 0 0 0 0 0 0 0 0 0 0 0 GB 0.00 No differenceGR : : : : : : : : : : 0 0 0 0 0 0 GR 0.00 No difference
LV : 0 0 0 0 0 0 0 0 0 0 0 0 0 0 0 LV 0.00 No difference
NL : : : : : : : : : 0 0 0 0 0 0 0 NL 0.00 No differenceBG : : : : : : : : : : : : : : : 0 BG 0.00 No dataCY 0 CY 0.00 No dataHR 0 HR 0.00 No dataIE 0 IE 0.00 No dataLU 0 LU 0.00 No dataMT : : : : : : : : : : : : : : : 0 MT 0.00 No difference
53
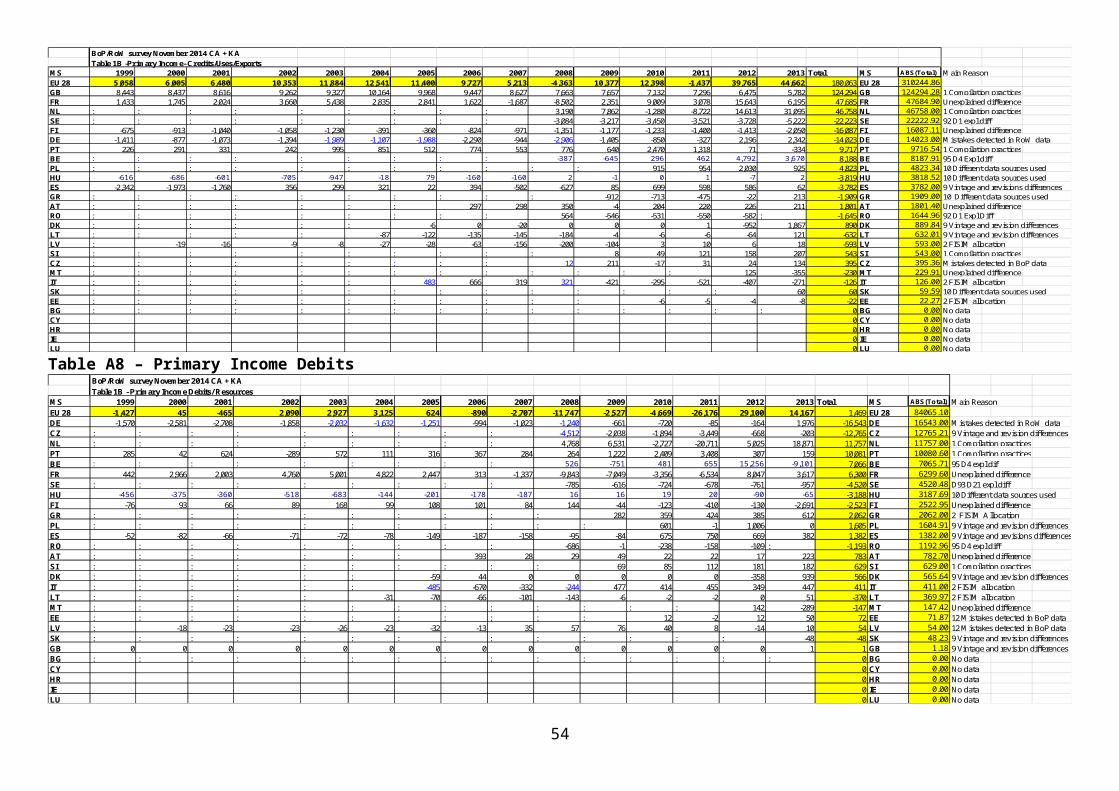
Table A33 – D71 Net non life insurance DebitsBoP/RoW survey November 2014 CA + KATable 1B -D71 Debits/Resources
MS 1999 2000 2001 2002 2003 2004 2005 2006 2007 2008 2009 2010 2011 2012 2013 Total MS ABS(Total) Main ReasonEU 28 1,941 2,108 2,352 3,984 4,205 5,670 5,648 12,134 3,514 12,066 7,024 5,656 5,214 9,510 6,865 87,890 EU 28 192532.16GB 4,601 4,811 4,681 7,231 7,182 8,013 10,348 17,243 8,624 14,315 9,296 8,425 7,549 9,554 7,222 129,095 GB 129094.86 12 wrongly coded for transmission FR -1,216 -1,324 -1,352 -2,492 -2,408 -2,120 -2,480 -2,900 -2,596 -2,344 -2,651 -3,063 -3,760 -2,180 -2,371 -35,257 FR 35257.00 Unexplained differenceES -1,211 -1,195 -835 -630 -435 -164 -441 -528 -973 -1,388 -947 -1,054 -23 381 624 -8,819 ES 8819.00 10 Different data sources usedIT : : : : : : -1,753 -2,554 -2,270 0 1 0 -24 -6 0 -6,606 IT 6606.00 994 data not reportedSE : : : : : : : 906 793 823 601 544 618 942 644 5,870 SE 5870.03 12 Mistakes detected in BoP data BE : : : : : : : : : 530 607 552 568 518 473 3,247 BE 3246.50 1 (resources in RoW is the combinaison of uses as estimated in RoW and the balance "credits-debits" from BoP, corrected for D44,; the balance for D71 in RoW and BoP is the same, apart from D44)PT -32 59 59 57 54 70 84 102 119 140 119 206 234 236 227 1,734 PT 1734.10 1 Compilation practicesFI -200 -244 -201 -182 -188 -115 -100 -104 -174 : : : : : -1,508 FI 1508.00 Unexplained differenceSI : : : : : : : : : : -3 33 50 41 31 152 SI 152.00 1 Compilation practicesLT : : : : : -14 -11 -32 -10 -9 1 -5 -15 -16 -18 -130 LT 129.73 10 Different data sources usedEE : : : : : : : : : : : 17 15 9 21 62 EE 62.12 1-Compilation practicesDK : : : : : : 0 0 0 0 0 0 0 32 13 45 DK 44.98 9 Vintage and revision differencesDE -1 1 0 0 0 0 1 0 0 0 0 1 2 1 1 6 DE 6.00 Unexplained differenceAT : : : : : : : 1 1 -1 0 0 0 -1 -1 -1 AT 0.90 Unexplained differencePL : : : : : : : : : : : 0 0 0 0 0 PL 0.48 Unexplained differenceRO : : : : : : : : : 0 0 0 0 0 : 0 RO 0.45 Unexplained differenceHU 0 0 0 0 0 0 0 0 0 0 0 0 0 0 0 0 HU 0.00 No differenceCZ : : : : : : : : : 0 0 0 0 0 0 0 CZ 0.00 No differenceGR : : : : : : : : : : 0 0 0 0 0 0 GR 0.00 No difference
LV : 0 0 0 0 0 0 0 0 0 0 0 0 0 0 0 LV 0.00 No difference
NL : : : : : : : : : 0 0 0 0 0 0 0 NL 0.00 No differenceBG : : : : : : : : : : : : : : : 0 BG 0.00 No dataCY 0 CY 0.00 No dataHR 0 HR 0.00 No dataIE 0 IE 0.00 No dataLU 0 LU 0.00 No dataMT : : : : : : : : : : : : : : : 0 MT 0.00 No differenceSK : : : : : : : : : : : : : : : 0 SK 0.00 No difference
Table A34 – D72 Non life insurance claims CreditsBoP/RoW survey November 2014 CA + KATable 1B -D72- Credits/Uses/Exports
MS 1999 2000 2001 2002 2003 2004 2005 2006 2007 2008 2009 2010 2011 2012 2013 Total MS ABS(Total) Main ReasonEU 28 -1,338 -1,700 -1,783 -1,575 -1,512 -1,147 -3,995 -4,454 -5,160 -2,128 -1,570 -1,711 -202 161 40 -28,075 EU 28 35937.91ES -751 -895 -966 -855 -821 -708 -732 -989 -1,600 -1,730 -1,511 -1,443 -270 132 467 -12,672 ES 12672.00 10 Different data sources usedIT : : : : : : -2,832 -2,718 -2,647 0 0 0 -27 -2 0 -8,226 IT 8226.00 994 data not reportedFR -387 -562 -615 -538 -503 -308 -317 -274 -442 -510 -333 -337 -233 -289 -306 -5,954 FR 5954.00 Unexplained differenceBE : : : : : : : : : 513 600 381 645 812 780 3,730 BE 3730.00 1 (uses in RoW is the combinaison of resources as estimated in RoW and the balance "credits-debits" from BoP; the balance for D72 in RoW and BoP is the same)SE : : : : : : : -336 -281 -388 -353 -358 -356 -632 -504 -3,207 SE 3207.32 12 Mistakes detected in BoP data FI -200 -245 -201 -182 -188 -115 -100 -104 -174 : : : : : : -1,509 FI 1509.00 Unexplained differenceDK : : : : : : 0 0 0 0 0 0 0 110 -409 -298 DK 298.40 9 Vintage and revision differencesSI : : : : : : : : : : 29 28 37 26 24 144 SI 144.00 1 Compilation practicesLT : : : : : -15 -12 -33 -16 -13 -2 -2 -11 -12 -17 -133 LT 133.36 10 Different data sources usedEE : : : : : : : : : : : 22 14 16 6 58 EE 57.69 1-Compilation practicesPT 1 1 0 0 0 -1 -1 0 0 -1 0 -1 1 -1 -1 -2 PT 2.25 Unexplained differenceAT : : : : : : : 0 0 0 -1 0 0 0 -1 -2 AT 2.20 Unexplained differenceDE -1 1 -1 0 0 -1 -1 0 0 1 1 0 0 0 0 -1 DE 1.00 Unexplained differencePL : : : : : : : : : : : 0 0 0 0 0 PL 0.48 Unexplained differenceRO : : : : : : : : : 0 0 0 0 0 : 0 RO 0.20 Unexplained differenceHU 0 0 0 0 0 0 0 0 0 0 0 0 0 0 0 0 HU 0.00 No differenceCZ : : : : : : : : : 0 0 0 0 0 0 0 CZ 0.00 No differenceGB 0 0 0 0 0 0 0 0 0 0 0 0 0 0 0 0 GB 0.00 No differenceGR : : : : : : : : : : 0 0 0 0 0 0 GR 0.00 No differenceLV : 0 0 0 0 0 0 0 0 0 0 0 0 0 0 0 LV 0.00 No differenceNL : : : : : : : : : 0 0 0 0 0 0 0 NL 0.00 No differenceBG : : : : : : : : : : : : : : : 0 BG 0.00 No dataCY 0 CY 0.00 No data
HR 0 HR 0.00 No data
IE 0 IE 0.00 No dataLU 0 LU 0.00 No dataMT : : : : : : : : : : : : : : : 0 MT 0.00 No differenceSK : : : : : : : : : : : : : : : 0 SK 0.00 No difference
54
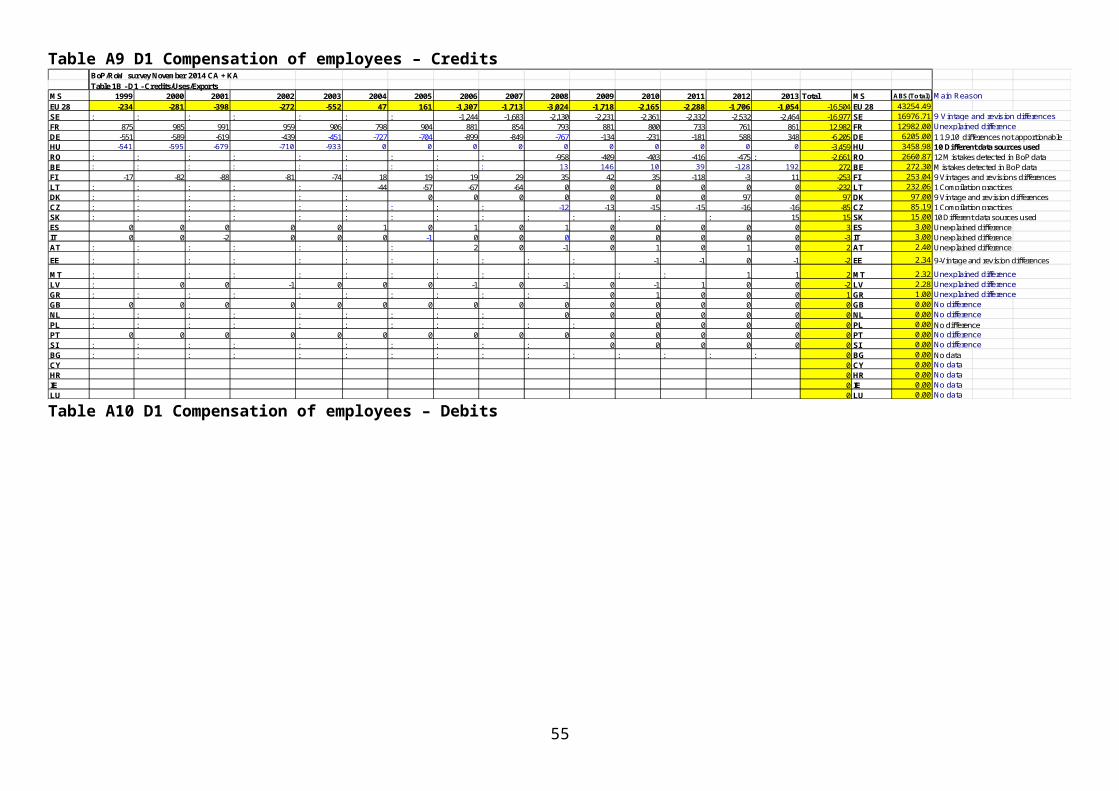
Table A35 – D72 Non life insurance claims DebitsBoP/RoW survey November 2014 CA + KATable 1B -D72 Debits/Resources
MS 1999 2000 2001 2002 2003 2004 2005 2006 2007 2008 2009 2010 2011 2012 2013 Total MS ABS(Total) Main ReasonEU 28 -6,490 -6,883 -6,768 -9,037 -8,554 -9,464 -14,998 -22,425 -14,509 -16,625 -11,171 -10,964 -10,804 -14,645 -13,133 -176,471 EU 28 184568.16GB -4,616 -4,840 -4,721 -7,261 -7,210 -8,082 -10,371 -17,300 -8,697 -14,383 -9,382 -8,827 -7,776 -10,431 -9,949 -133,848 GB 133847.69 Unexplained differenceFR -1,726 -1,770 -1,759 -1,548 -1,109 -1,304 -1,279 -1,243 -1,458 -1,648 -1,518 -1,719 -2,621 -3,935 -3,541 -28,178 FR 28178.00 Unexplained differenceIT : : : : : : -2,999 -2,779 -2,977 1 -1 0 -20 -3 0 -8,778 IT 8778.00 994 data not reportedSE : : : : : : : -907 -793 -823 -601 -544 -618 -942 -640 -5,867 SE 5867.49 12 Mistakes detected in BoP data BE : : : : : : : : : 513 598 380 644 813 779 3,727 BE 3727.30 10 (insurance accounts data used in RoW)ES 40 -77 -91 -38 -105 -21 -265 -122 -518 -288 -314 -314 -474 -198 148 -2,637 ES 2637.00 10 Different data sources usedFI -187 -195 -195 -182 -115 -37 -50 -38 -37 : : : : : : -1,036 FI 1036.00 Unexplained differenceSI : : : : : : : : : : 47 49 51 61 62 270 SI 270.00 1 Compilation practicesHU 0 0 -2 -8 -14 -18 -26 -29 -26 0 0 0 0 0 0 -123 HU 123.44 10 Different data sources used (other sector)EE : : : : : : : : : : : 12 8 12 8 39 EE 39.36 1-Compilation practicesSK : : : : : : : : : : : : : : -31 -31 SK 31.00 1-Compilation practicesLT : : : : : -3 -5 -8 0 2 0 0 1 0 -1 -14 LT 13.63 10 Different data sources usedDK : : : : : : 0 0 0 0 0 0 0 -21 32 11 DK 11.36 9 Vintage and revision differencesAT : : : : : : : -1 0 0 0 0 -1 0 -1 -4 AT 4.00 Unexplained differenceDE 0 -2 1 0 0 0 -3 1 -1 0 0 -1 3 -1 0 -3 DE 3.00 Unexplained differencePT 0 1 0 0 -1 1 0 0 0 1 0 0 -1 0 0 1 PT 0.61 Unexplained differencePL : : : : : : : : : : : 0 0 0 0 0 PL 0.24 Unexplained differenceRO : : : : : : : : : 0 0 0 0 0 : 0 RO 0.04 No differenceCZ : : : : : : : : : 0 0 0 0 0 0 0 CZ 0.00 No differenceGR : : : : : : : : : : 0 0 0 0 0 0 GR 0.00 No difference
LV : 0 0 0 0 0 0 0 0 0 0 0 0 0 0 0 LV 0.00 No difference
NL : : : : : : : : : 0 0 0 0 0 0 0 NL 0.00 No differenceBG : : : : : : : : : : : : : : : 0 BG 0.00 No dataCY 0 CY 0.00 No dataHR 0 HR 0.00 No dataIE 0 IE 0.00 No dataLU 0 LU 0.00 No dataMT : : : : : : : : : : : : : : : 0 MT 0.00 No difference
Table A36 – D7N Misc Transfers CreditsBoP/RoW survey November 2014 CA + KATable 1B -D7N - Credits/Uses/Exports
MS 1999 2000 2001 2002 2003 2004 2005 2006 2007 2008 2009 2010 2011 2012 2013 Total MS ABS(Total) Main ReasonEU 28 4,672 1,122 4,506 2,278 2,112 3,324 6,146 6,570 6,969 7,398 5,248 -3,111 -2,213 -2,074 -1,417 41,529 EU 28 179930.06GB 4,821 3,419 7,346 4,949 5,159 5,592 5,582 5,518 5,515 6,360 6,272 3,797 3,509 4,012 4,423 76,272 GB 76272.50 13 Mistakes detected in RoW dataFR 94 -1,183 -2,010 -2,675 -2,956 -2,100 -1,808 -1,034 -969 -1,412 -1,740 -2,231 -2,281 -2,303 -1,975 -26,583 FR 26583.00 Unexplained differencePL : : : : : : : : : : : -5,535 -6,538 -6,328 -6,683 -25,084 PL 25084.29 10 Different data sources used
NL : : : : : : : : : 1,725 1,535 2,236 3,015 2,863 2,468 13,842 NL 13842.00 994 D.75 unknown
SE : : : : : : : 1,048 1,229 1,008 854 1,132 1,011 931 966 8,179 SE 8179.21 3 Accrual recording NA D74DE -67 -651 -608 -62 -221 -63 -87 -77 -78 663 -660 -1,724 -785 -1,289 -710 -6,419 DE 6419.00 10 Different data sources used for EU budgetIT : : : : : : 2,259 1,750 1,895 0 0 0 2 1 1 5,908 IT 5908.00 994 data not reportedBE : : : : : : : : : -576 -173 -675 -798 -823 -508 -3,553 BE 3552.83 1 Compilation practicedCZ : : : : : : : : : 457 316 690 656 237 1,035 3,393 CZ 3392.59 10 10, 1 Different data sources usedAT : : : : : : : -385 -751 -737 -115 -206 -365 -336 -72 -2,967 AT 2966.80 Unexplained differenceFI -138 -152 -148 -140 -142 -417 -450 -459 -459 : : : : : : -2,505 FI 2505.24 Unexplained differenceGR : : : : : : : : : : 221 182 312 399 322 1,436 GR 1436.00 10. Different data sources usedHU -112 -133 -134 112 145 163 427 472 633 -155 6 4 -37 -8 -38 1,343 HU 1342.86 10 Different data sources used (Government)DK : : : : : : -54 0 0 -40 -456 -195 0 0 15 -731 DK 730.61 9 Vintage and revision differencesPT 23 -82 4 24 -26 -166 -21 -17 -11 82 -84 -7 -106 -11 -97 -495 PT 495.32 10 Different data sources usedES 50 -96 54 71 154 129 134 -237 -21 36 -692 -599 163 543 -176 -487 ES 487.00 10 Different data sources usedSK : : : : : : : : : : : : : : -332 -332 SK 331.60 1 Compilation practicedLT : : : : : 186 162 -9 -12 -11 -16 -19 -30 3 -23 231 LT 230.80 9 Vintage and revision differencesSI : : : : : : : : : : -19 48 65 46 -15 125 SI 125.00 Unexplained differenceEE : : : : : : : : : : : -10 -4 -11 -17 -42 EE 42.19 9-Compilation practicesLV : 0 1 0 0 0 1 0 -1 -2 0 0 -1 0 -1 -3 LV 2.73 Unexplained differenceRO : : : : : : : : : 0 0 0 1 0 : 0 RO 0.49 Unexplained differenceBG : : : : : : : : : : : : : : : 0 BG 0.00 No dataCY 0 CY 0.00 No dataHR 0 HR 0.00 No dataIE 0 IE 0.00 No dataLU 0 LU 0.00 No dataMT : : : : : : : : : : : : : : : 0 MT 0.00 No difference
55
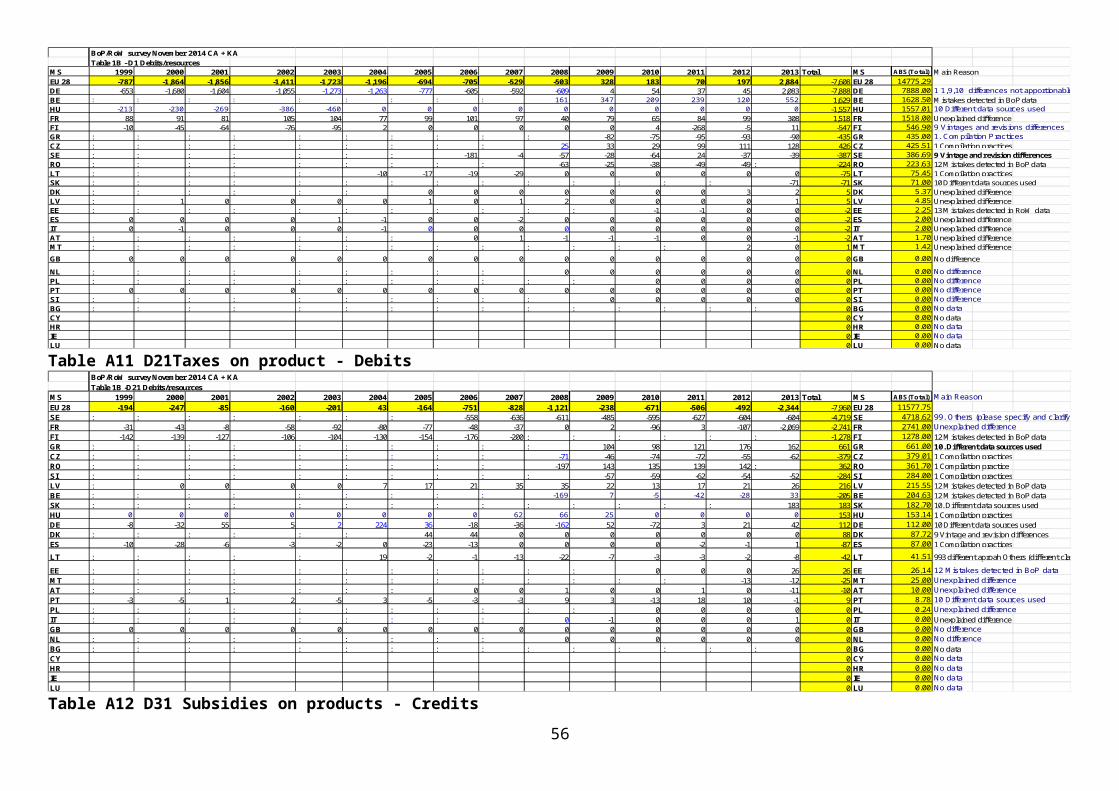
Table A37 – D7N Misc Transfers DebitsBoP/RoW survey November 2014 CA + KA
Table 1B -D7N Debits/Resources
MS 1999 2000 2001 2002 2003 2004 2005 2006 2007 2008 2009 2010 2011 2012 2013 Total MS ABS(Total) Main ReasonEU 28 -3,094 -2,098 -1,937 -1,133 -2,229 -1,684 -13,260 -12,180 -16,400 -4,612 1,359 -7,470 -7,399 -6,143 -4,818 -83,099 EU 28 146280.67FR -3,559 -2,344 -2,728 -2,526 -2,692 -844 -2,089 -3,029 -4,716 -3,761 -3,253 -3,069 -4,212 -3,430 -3,657 -45,909 FR 45909.20 Unexplained differenceIT : : : : : : -9,153 -8,647 -10,149 0 0 0 1 0 1 -27,947 IT 27947.00 994 data not reportedDE 922 866 1,332 1,560 908 1,218 890 2,133 1,212 -141 2,095 1,087 825 881 999 16,787 DE 16787.00 10 Different data sources used for EU budgetPL : : : : : : : : : : : -4,243 -3,614 -4,793 -4,018 -16,668 PL 16668.43 10 Different data sources usedFI -689 -703 -662 -526 -559 -2,016 -2,260 -2,347 -2,356 : : : : : : -12,118 FI 12118.00 Unexplained differenceSE : : : : : : : 185 280 338 690 402 879 2,135 1,252 6,161 SE 6161.26 3 Accrual recording NA D74GB 181 30 121 183 78 69 23 57 73 68 244 402 227 877 2,952 5,584 GB 5583.98 Unexplained differenceNL : : : : : : : : : -1,053 -945 -870 -403 -401 -1,060 -4,732 NL 4732.00 10 Different data sources usedBE : : : : : : : : : 208 4,017 -259 -214 -632 -112 3,009 BE 3008.99 Mistakes detected in BoP data LT : : : : : 79 -14 -188 -201 -235 -241 -224 -254 -247 -316 -1,841 LT 1840.96 9 Vintage and revision differencesGR : : : : : : : : : : -769 -271 -440 61 -401 -1,820 GR 1820.00 10. Different data sources usedDK : : : : : : -97 -43 0 -41 -458 -195 0 10 -41 -865 DK 865.38 9 Vintage and revision differencesHU -14 9 -13 58 38 -17 -238 -294 -254 -14 -8 -40 -41 -12 17 -822 HU 821.59 994 data not reported Back data is not detailed enough in the BoP, but he values in the BoP and NA are the sameRO : : : : : : : : : -166 -141 -135 -139 -142 : -723 RO 723.45 1 Compilation practicesLV : -1 1 -1 -1 -48 -96 -117 -133 0 0 -1 1 0 -1 -396 LV 396.17 75 Estat bop errorCZ : : : : : : : : : -49 -5 -87 -101 -33 -21 -296 CZ 295.70 10 Different data sources usedES 0 1 3 0 -2 0 2 0 2 2 2 0 91 -378 12 -265 ES 265.00 9 vintages and revisions differences Others (*)SK : : : : : : : : : : : : : : -161 -161 SK 161.04 1-Compilation practicesSI : : : : : : : : : : -3 -12 4 -28 -27 -66 SI 66.00 Unexplained differenceAT : : : : : : : 0 -2 0 83 0 0 0 -31 50 AT 49.60 Unexplained differenceEE : : : : : : : : : : : 0 0 -10 -39 -49 EE 49.01 12 Mistakes detected in BoP dataPT 65 45 9 119 1 -125 -229 109 -157 232 50 45 -8 -2 -165 -11 PT 10.91 10 Different data sources usedBG : : : : : : : : : : : : : : : 0 BG 0.00 No dataCY 0 CY 0.00 No dataHR 0 HR 0.00 No dataIE 0 IE 0.00 No dataLU 0 LU 0.00 No dataMT : : : : : : : : : : : : : : : 0 MT 0.00 No difference
Table A38 – D76 VAT&GNI EU own resources DebitsBoP/RoW survey November 2014 CA + KATable 1B - D76 Debits/Resources
MS 1999 2000 2001 2002 2003 2004 2005 2006 2007 2008 2009 2010 2011 2012 2013 Total MS ABS(Total) Main ReasonEU 28 -6,770 -7,101 -5,958 -8,110 -9,489 -11,471 -13,603 -11,351 -12,125 -12,400 -11,694 -12,865 -13,427 -15,537 -16,961 -168,862 EU 28 180331.62GB -6,866 -7,185 -6,123 -8,331 -9,736 -11,123 -12,770 -12,499 -12,162 -10,578 -11,690 -12,612 -12,626 -13,936 -16,627 -164,865 GB 164864.81 12 wrongly coded for transmission at lower level, top level ok.RO : : : : : : : : : -1,015 -1,064 -1,003 -1,090 -1,185 : -5,357 RO 5357.10 994 Data not reportedDE 10 -1 1 1 0 1 0 1,517 674 -881 1,030 661 0 -3 2 3,012 DE 3012.00 1 Compilation practices, due to revaluation of BNE and therefor different period recordingHU 0 0 0 0 0 -476 -751 -702 -754 -89 -58 -40 -47 -44 -27 -2,989 HU 2988.56 994 data not reported Back data is not detailed enough in the BoP, but he values in the BoP and NA are the samePT 87 85 165 220 247 136 -85 334 115 140 133 90 90 109 45 1,908 PT 1907.96 10 Different data sources usedSK : : : : : : : : : : : : : : -713 -713 SK 713.41 1 Compilation practicesEE : : : : : : : : : : : 121 139 149 165 574 EE 573.90 13 Mistakes detected in RoW dataBE : : : : : : : : : 34 -125 -100 -28 -231 146 -305 BE 304.75 10 Different data sources usedES -1 0 0 0 0 0 3 0 2 1 1 1 90 -377 11 -269 ES 269.00 9 vintages and revisions differences Others (*)SI : : : : : : : : : : 12 28 54 40 24 158 SI 158.00 Unexplained differenceAT : : : : : : : 0 1 0 83 0 -1 0 -1 83 AT 82.90 Unexplained differenceLV : : : : : : : : : -12 -13 -9 -6 -17 -12 -69 LV 69.43 75 estat bop errorLT : : : : : -9 0 0 0 0 -2 -2 -2 -2 -12 -29 LT 28.95 10 Different data sources usedCZ : : : : : : : : : 0 0 0 0 -40 39 -1 CZ 0.85 11 Balancing of accounts
DK : : : : : : 0 0 0 0 0 0 0 0 0 0 DK 0.00 No differenceNL : : : : : : : : : 0 0 0 0 0 0 0 NL 0.00 No differenceBG : : : : : : : : : : : : : : : 0 BG 0.00 No dataCY 0 CY 0.00 No dataFI : : : : : : : : : : : : : : : 0 FI 0.00 No differenceFR : : : : : : : : : : : : : : : 0 FR 0.00 No differenceGR : : : : : : : : : : : : : : : 0 GR 0.00 No differenceHR 0 HR 0.00 No dataIE 0 IE 0.00 No dataIT : : : : : : : : : : : : : : : 0 IT 0.00 No differenceLU 0 LU 0.00 No dataMT : : : : : : : : : : : : : : : 0 MT 0.00 No differencePL : : : : : : : : : : : : : : : 0 PL 0.00 No differenceSE : : : : : : : : : : : : : : : 0 SE 0.00 No difference
56

Table A39 – D9 CreditsBoP/RoW survey November 2014 CA + KATable 1B - Capital Account total- Credits/Uses/Exports
MS 1999 2000 2001 2002 2003 2004 2005 2006 2007 2008 2009 2010 2011 2012 2013 Total MS ABS(Total) Main ReasonEU 28 -405 -428 224 -254 698 151 744 910 732 1,055 133 -2,923 -3,672 -1,856 -314 -5,205 EU 28 27973.08CZ : : : : : : : : : -450 -1,048 -1,712 -2,335 -165 -1,562 -7,272 CZ 7271.59 9 Vintages and revisions differencesGR : : : : : : : : : : -325 -1,832 -1,362 -1,156 -1,764 -6,439 GR 6439.00 10. Different data sources usedFR -596 -594 59 -340 706 333 231 520 519 846 1,627 699 1,111 368 694 6,183 FR 6183.00 Unexplained differencePL : : : : : : : : : : : 729 -1,194 274 2,403 2,212 PL 2212.17 10 Different data sources usedNL : : : : : : : : : -185 -184 -240 -261 -229 -203 -1,302 NL 1302.00 994 Capital account Government D.92DE 9 3 8 134 41 -106 426 85 -123 932 -60 -464 177 -200 268 1,130 DE 1130.00 10 Different data sources used for EU budgetGB -5 -8 -11 -33 -40 -53 -42 -3 0 0 0 0 0 -540 -350 -1,086 GB 1086.14 12 Mistakes detected in BoP dataIT : : : : : : 139 377 300 -1 4 -1 -1 -1 3 819 IT 819.00 Mistakes detected in RoW data SE : : : : : : : -26 55 46 111 93 234 -10 -1 502 SE 501.83 99. Others (please specify and clarify) BE : : : : : : : : : -127 45 -152 52 -156 -10 -348 BE 348.50 10 (government data used in RoW)HU 225 198 211 -15 -6 -23 -8 -45 -17 -2 -10 0 -50 -99 -37 324 HU 323.53 4 Current or capital transfer? (other sector)
FI -38 -26 -41 0 0 0 0 0 0 2 1 -12 -5 : : -119 FI 119.00 Unexplained difference
SK : : : : : : : : : : : : : : 80 80 SK 79.60 1 Compilation practiced (government)AT : : : : : : : -1 1 1 0 1 -1 0 70 71 AT 70.60 Unexplained differencePT -1 -2 -1 0 -2 1 -1 -2 -5 -10 -11 -1 47 46 -6 52 PT 52.00 Unexplained differenceSI : : : : : : : : : : -18 -32 -85 20 93 -22 SI 22.00 1 Compilation practicesLV : 0 -1 1 0 0 -1 5 1 3 0 -1 1 -1 3 10 LV 9.75 75 Estat Bop errorEE : : : : : : : : : : : 1 0 -5 6 2 EE 2.21 1-Compilation practicesES 0 0 0 0 0 -1 0 0 1 0 1 0 0 -1 -1 -1 ES 1.00 Unexplained differenceRO : : : : : : : : : 0 0 0 0 0 : 0 RO 0.15 Unexplained differenceLT : : : : : 0 0 0 0 0 0 0 0 0 0 0 LT 0.02 No differenceDK : : : : : : 0 0 0 0 0 0 0 0 0 0 DK 0.00 Unexplained differenceBG : : : : : : : : : : : : : : : 0 BG 0.00 No dataCY 0 CY 0.00 No dataHR 0 HR 0.00 No dataIE 0 IE 0.00 No dataLU 0 LU 0.00 No dataMT : : : : : : : : : : : : : : : 0 MT 0.00 No difference
Table A40 – D9 DebitsBoP/RoW survey November 2014 CA + KATable 1B -Capital Account total - Debits/Resources
MS 1999 2000 2001 2002 2003 2004 2005 2006 2007 2008 2009 2010 2011 2012 2013 Total MS ABS(Total) Main ReasonEU 28 -2,212 -546 -726 -1,276 -3,618 -1,267 400 946 159 -863 -735 891 -3,695 -4,866 -1,313 -18,722 EU 28 27802.29FR -2,446 -737 -746 -708 -265 -397 -653 23 -324 -389 -316 -389 -237 -3,520 -966 -12,070 FR 12070.00 Unexplained differenceDE 365 346 169 -295 -3,046 -584 1,102 600 463 -319 -56 172 -3,323 -377 325 -4,458 DE 4458.00 99 Data not included in RoW DataES -172 -182 -216 -255 -255 -256 -252 -299 -271 -327 -425 0 0 18 -57 -2,949 ES 2949.00 10 Different data sources usedPL : : : : : : : : : : : -376 -465 -506 -498 -1,845 PL 1844.78 10 Different data sources usedNL : : : : : : : : : 215 15 993 123 30 99 1,475 NL 1475.00 10 Different data sources usedIT : : : : : : 207 438 230 -1 -1 101 28 88 90 1,180 IT 1180.00 13 Mistakes detected in RoW data BE : : : : : : : : : 62 91 428 115 206 -81 821 BE 821.35 10 Different data sources used
CZ : : : : : : : : : 4 -6 -32 2 -595 -186 -813 CZ 813.03 9 Vintage and revision differences
SE : : : : : : : 201 98 57 93 91 216 18 31 805 SE 804.71 99 Others (please specify and clarify) PT -5 -4 -4 -10 -1 -1 -7 -23 -29 -131 -128 -129 -119 -90 -105 -786 PT 786.00 Unexplained differenceAT : : : : : : : 1 1 1 0 0 0 -1 203 204 AT 204.48 Unexplained differenceLT : : : : : -6 -9 -10 -12 -20 -14 -7 -1 -36 -1 -117 LT 117.13 10 Different data sources usedSK : : : : : : : : : : : : : : -117 -117 SK 116.90 1 Compilation practicesHU 49 35 76 -8 -53 -25 11 15 5 -15 -4 21 -47 -98 -46 -85 HU 84.96 1 Compilation practicesGR : : : : : : : : : : 14 16 13 0 0 43 GR 43.00 1 Compilation PracticesEE : : : : : : : : : : : 0 -4 -4 -5 -12 EE 11.70 1 Compilation practicesFI -3 -4 -5 0 0 0 0 0 0 : : : 1 : : -10 FI 10.49 Unexplained differenceLV : 0 0 0 1 2 1 1 -1 1 0 0 2 1 0 8 LV 8.03 Unexplained differenceSI : : : : : : : : : : 1 1 1 0 0 3 SI 3.00 Unexplained differenceRO : : : : : : : : : 0 0 0 0 0 : 1 RO 0.60 Unexplained differenceDK : : : : : : 0 0 0 0 0 0 0 0 0 0 DK 0.13 Unexplained differenceGB 0 0 0 0 0 0 0 0 0 0 0 0 0 0 0 0 GB 0.00 No differenceBG : : : : : : : : : : : : : : : 0 BG 0.00 No dataCY 0 CY 0.00 No dataHR 0 HR 0.00 No dataIE 0 IE 0.00 No dataLU 0 LU 0.00 No dataMT : : : : : : : : : : : : : : : 0 MT 0.00 No difference
57
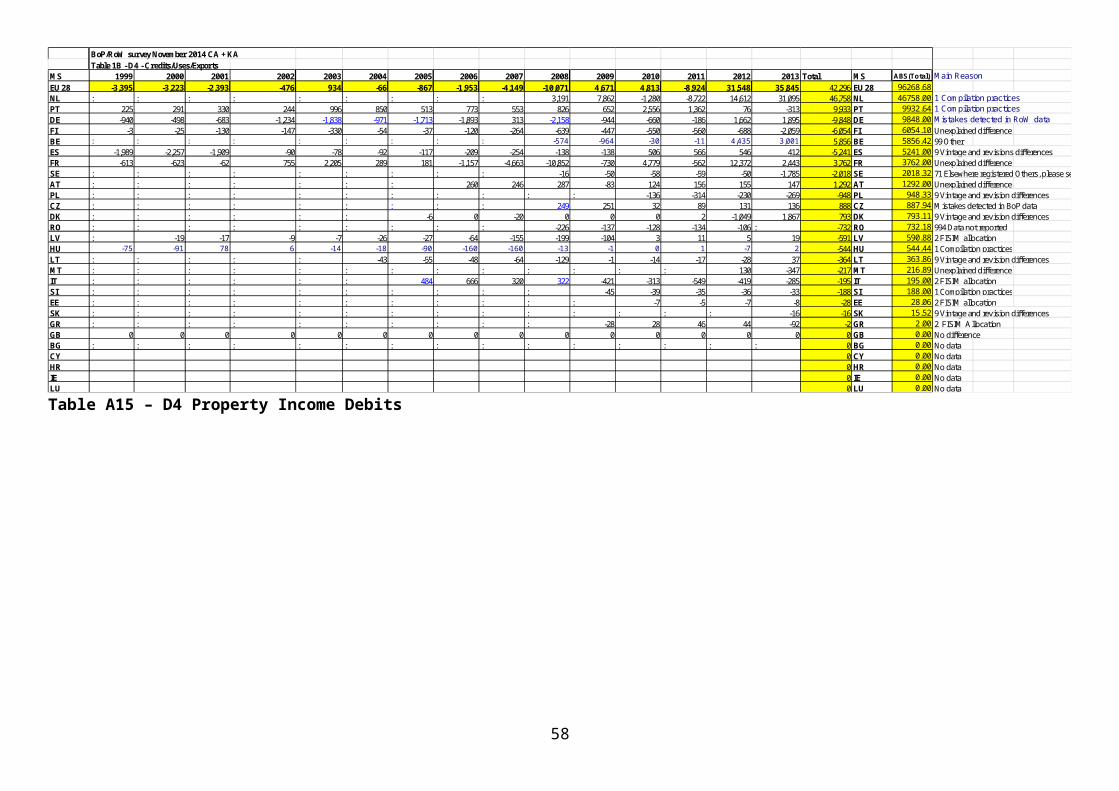
Table A41 – D9N CreditsBoP/RoW survey November 2014 CA + KATable 1B - D9N - Credits/Uses/Exports
MS 1999 2000 2001 2002 2003 2004 2005 2006 2007 2008 2009 2010 2011 2012 2013 Total MS ABS(Total) Main ReasonEU 28 -404 -431 225 -260 698 -4 461 1,095 926 1,121 202 -2,859 -4,003 -1,924 -519 -5,677 EU 28 28167.66CZ : : : : : : : : : -450 -1,048 -1,712 -2,335 -165 -1,562 -7,271 CZ 7271.40 10, 1 Different data sources usedGR : : : : : : : : : : -323 -1,833 -1,362 -1,157 -1,765 -6,440 GR 6440.00 10. Different data sources usedFR -596 -597 60 -342 706 333 230 520 519 842 1,619 677 1,101 360 629 6,061 FR 6060.90 Unexplained differencePL : : : : : : : : : : : 729 -1,194 274 2,403 2,212 PL 2211.93 10 Different data sources usedSE : : : : : : : 707 712 46 111 93 234 -10 -1 1,892 SE 1892.17 12 Mistakes detected in BoP data GB -5 -8 -11 -33 -40 -53 -42 -3 0 0 0 0 0 -540 -350 -1,086 GB 1086.14 12 Mistakes detected in BoP data FI -38 -26 -41 0 0 -152 -145 -168 -162 : : : : : -198 -930 FI 929.98 Unexplained difference
NL : : : : : : : : : -107 -106 -165 -195 -170 -73 -816 NL 816.00 10 Different data sources used
DE 9 3 9 132 41 -106 426 85 -123 932 -62 -464 -213 -323 266 612 DE 612.00 10 Different data sources used for EU budget (ESF, EFRE)BE : : : : : : : : : -127 45 -152 50 -155 -10 -349 BE 349.50 10 (government data used in RoW)HU 225 198 211 -15 -6 -23 -8 -45 -17 -2 -10 0 -50 -99 -37 324 HU 323.53 4 Current or capital transfer? (other sector)SK : : : : : : : : : : : : : : 80 80 SK 80.47 1-Compilation practicesPT 0 -2 -2 -2 -1 -1 0 -2 -4 -9 -12 -2 47 46 -8 48 PT 48.10 9 Vintages and revisions differencesSI : : : : : : : : : : -19 -33 -86 21 94 -23 SI 23.00 1 Compilation practicesIT : : : : : : 0 0 0 0 4 1 0 1 5 11 IT 11.00 994 data not reportedLV : 0 -1 1 -1 -1 0 1 0 -2 0 -1 0 -1 1 -4 LV 4.25 Unexplained differenceAT : : : : : : : 0 1 -1 1 1 1 0 0 3 AT 2.60 Unexplained differenceES 0 0 0 0 0 -1 0 0 1 0 1 0 0 1 0 2 ES 2.00 Unexplained differenceDK : : : : : : 0 0 0 0 0 0 0 0 0 -2 DK 1.88 Unexplained differenceEE : : : : : : : : : : : 1 -1 -6 7 1 EE 0.71 1-Compilation practicesRO : : : : : : : : : 0 0 0 0 0 : 0 RO 0.08 Unexplained differenceLT : : : : : 0 0 0 0 0 0 0 0 0 0 0 LT 0.02 No differenceBG : : : : : : : : : : : : : : : 0 BG 0.00 No dataCY 0 CY 0.00 No dataHR 0 HR 0.00 No dataIE 0 IE 0.00 No dataLU 0 LU 0.00 No dataMT : : : : : : : : : : : : : : : 0 MT 0.00 No difference
Table A42 – D9N DebitsBoP/RoW survey November 2014 CA + KATable 1B - D9N - Debits/Resources
MS 1999 2000 2001 2002 2003 2004 2005 2006 2007 2008 2009 2010 2011 2012 2013 Total MS ABS(Total) Main ReasonEU 28 -3,172 -1,480 -1,487 -1,983 -4,199 -1,858 -547 -1,094 -1,573 -1,668 -1,522 230 -4,255 -5,405 -2,274 -32,288 EU 28 37838.36DE -597 -589 -591 -1,007 -3,626 -1,163 368 -257 -365 -1,185 -907 -818 -4,365 -1,379 -959 -17,440 DE 17440.00 Unexplained differenceFR -2,445 -735 -745 -707 -265 -398 -654 21 -324 -390 -316 -390 -241 -3,517 -966 -12,072 FR 12071.80 Unexplained differenceES -172 -182 -216 -255 -255 -256 -252 -299 -271 -327 -425 0 0 18 -58 -2,950 ES 2950.00 10 Different data sources usedNL : : : : : : : : : 279 80 1,054 176 79 237 1,905 NL 1905.00 10 Different data sources usedBE : : : : : : : : : 59 95 428 118 204 -84 820 BE 820.35 10 (government data used in RoW)
CZ : : : : : : : : : 4 -6 -32 2 -595 -186 -812 CZ 812.29 10 10, 1 Different data sources used
PT -4 -5 -6 -7 -2 -2 -5 -23 -29 -131 -128 -128 -119 -92 -107 -788 PT 787.85 9 Vintages and revisions differencesSE : : : : : : : -533 -558 57 93 91 216 18 31 -585 SE 585.49 12 Mistakes detected in BoP data LT : : : : : -6 -9 -10 -12 -20 -14 -7 -1 -36 -1 -117 LT 117.13 10 Different data sources usedSK : : : : : : : : : : : : : : -113 -113 SK 112.95 10 Different data sources usedHU 49 35 76 -8 -53 -25 11 15 5 -15 -9 21 -47 -98 -46 -89 HU 89.02 1 Compilation practiced (government)FI -3 -4 -5 0 0 -7 -11 -10 -20 : : -4 : : : -63 FI 63.15 Unexplained differenceGR : : : : : : : : : : 13 16 12 1 1 43 GR 43.00 1. Compilation PracticesRO : : : : : : : : : 0 0 0 0 0 -20 -20 RO 19.59 Unexplained differenceEE : : : : : : : : : : : 0 -4 -4 -5 -13 EE 12.97 1-Compilation practicesIT : : : : : : 4 2 1 0 0 0 0 0 0 7 IT 7.00 Mistakes detected in RoW data DK : : : : : : 0 0 0 0 0 0 0 0 0 -1 DK 0.54 Unexplained differenceAT : : : : : : : 1 1 1 0 0 -1 -2 0 0 AT 0.20 Unexplained differenceLV : 0 0 0 1 0 0 0 -1 1 0 -1 1 -1 0 0 LV 0.03 Unexplained differenceGB 0 0 0 0 0 0 0 0 0 0 0 0 0 0 0 0 GB 0.00 No differenceSI : : : : : : : : : : 0 0 0 0 0 0 SI 0.00 No differenceBG : : : : : : : : : : : : : : : 0 BG 0.00 No dataCY 0 CY 0.00 No dataHR 0 HR 0.00 No dataIE 0 IE 0.00 No dataLU 0 LU 0.00 No dataMT : : : : : : : : : : : : : : : 0 MT 0.00 No differencePL : : : : : : : : : : : : : : : 0 PL 0.00 No difference
58

Table A43 – NP NetBoP/RoW survey November 2014 CA + KATable 1B -NP NET
MS 1999 2000 2001 2002 2003 2004 2005 2006 2007 2008 2009 2010 2011 2012 2013 Total MS ABS(Total) Main ReasonEU 28 12 -13 -28 -13 -7 831 91 -242 1,121 -42 1,447 -589 2,613 -2,915 3,691 5,957 EU 28 8459.50NL : : : : : : : : : -46 1,265 -636 2,650 -2,746 4,052 4,539 NL 4539.00 10 Different data sources usedFR 12 -12 -28 -12 -7 832 89 -346 991 -32 2 10 0 28 77 1,604 FR 1604.00 Unexplained differencePL : : : : : : : : : : : -219 -191 -343 -337 -1,091 PL 1090.54 10 Different data sources usedAT : : : : : : : 108 120 59 276 180 166 154 -62 1,001 AT 1001.20 Mistakes detected in RoW data DK : : : : : : 0 0 0 0 0 0 0 -10 -76 -86 DK 85.83 Unexplained differenceSK : : : : : : : : : : : : : : 38 38 SK 37.88 9PT 0 -1 0 -1 0 0 1 0 0 -18 -11 -1 1 0 0 -32 PT 31.93 1 Compilation practicesHU 0 0 0 0 0 0 0 0 0 0 -28 0 0 0 0 -28 HU 28.26 10 Different data sources usedCZ : : : : : : : : : 0 -55 79 1 0 0 25 CZ 24.78 1 Compilation practicesLV : 0 0 0 0 1 2 -4 0 -4 0 1 0 1 -2 -6 LV 6.04 Unexplained differenceGR : : : : : : : : : : 0 -1 0 -1 -1 -3 GR 3.00 No differenceES 0 0 0 0 0 -1 0 1 0 -1 -1 -1 0 0 0 -3 ES 3.00 Unexplained differenceFI 0 0 0 0 0 0 0 0 11 0 0 0 -12 : : -1 FI 1.00 Unexplained differenceSI : : : : : : : : : : 0 -1 0 1 1 1 SI 1.00 1 Compilation practicesBE : : : : : : : : : 0 -1 1 -2 0 1 -1 BE 0.90 9RO : : : : : : : : : 0 0 0 0 0 : 1 RO 0.57 Unexplained difference
EE : : : : : : : : : : : 0 0 0 -1 0 EE 0.46 99-Discrepancy due to rounding
SE : : : : : : : 0 0 0 0 0 0 0 0 0 SE 0.11 Unexplained differenceDE 0 0 0 0 0 0 0 0 0 0 0 0 0 0 0 0 DE 0.00 No differenceGB 0 0 0 0 0 0 0 0 0 0 0 0 0 0 0 0 GB 0.00 No differenceIT : : : : : : 0 0 0 0 0 0 0 0 0 0 IT 0.00 No differenceLT : : : : : 0 0 0 0 0 0 0 0 0 0 0 LT 0.00 No differenceBG : : : : : : : : : : : : : : : 0 BG 0.00 No dataCY 0 CY 0.00 No dataHR 0 HR 0.00 No dataIE 0 IE 0.00 No dataLU 0 LU 0.00 No dataMT : : : : : : : : : : : : : : : 0 MT 0.00 No difference
Table A44 – CA+KA+B9 NetBoP/RoW survey November 2014 CA + KATable 1B - CA+KA-B9- NET
MS 1999 2000 2001 2002 2003 2004 2005 2006 2007 2008 2009 2010 2011 2012 2013 Total MS ABS(Total) Main ReasonEU 28 16,940 9,329 12,420 18,151 17,850 16,209 7,688 7,190 7,552 5,294 9,615 38,322 32,869 12,785 42,946 255,161 EU 28 442767.41FR 10,979 -2,806 1,153 455 2,050 325 7,074 12,136 16,708 9,754 16,977 19,325 26,078 24,269 13,270 157,747 FR 157747.00 Unexplained differenceIT 10,710 13,930 13,875 16,578 17,278 15,438 -68 -101 56 -3 5 -104 -14 -87 1,335 88,828 IT 88828.00 994 data not reportedBE : : : : : : : : : -8,556 -9,694 -3,735 -6,249 -16,412 6,376 -38,270 BE 38270.10 1001 G+S expl diff NetPL : : : : : : : : : : : 28,394 -1,158 1,472 4,231 32,938 PL 32938.42 1001 Net G+S explNL : : : : : : : : : -3,515 678 -1,540 13,620 5,411 15,289 29,943 NL 29943.00 995 IN1 expl CDE -933 -400 -850 -549 1,611 -504 -2,341 -4,098 -3,913 -22 -4,978 -5,187 777 -2,069 -2,184 -25,640 DE 25640.00 1001 Goods & Services (FISIM & Vintage)SE : : : : -4,279 -1,245 264 -2,734 -7,483 56 -2,462 -1,694 -384 -2,425 433 -21,953 SE 21952.81 1001 G+S net explGR : : : : : : : : : : 5,923 1,906 102 3,008 3,720 14,659 GR 14659.00 1 Compilation PracticesCZ : : : : : : : : : 4,487 1,268 910 1,817 1,442 -93 9,831 CZ 9831.16 1 Compilation PracticesPT -12 199 -249 398 349 724 536 48 525 940 -521 599 -873 1,136 1,730 5,529 PT 5529.00 1001 G+S expl diff NetFI -2,086 94 -32 79 -189 -81 -156 -273 -366 -786 -143 -380 -639 -27 1,345 -3,641 FI 3641.42 Unexplained differenceAT : : : : : : : 1,421 1,700 1,228 1,863 -465 -1,262 -3,252 -4,088 -2,855 AT 2854.80 Unexplained differenceHU 91 -135 19 354 251 675 1,254 193 36 -129 -30 14 -26 128 -54 2,639 HU 2639.17 1 Compilation practicedRO : : : : : : : : : 1,644 -138 626 109 -346 : 1,895 RO 1895.44 1001 Net G+S explainedLT : : : : : 64 132 123 162 178 226 180 196 223 357 1,841 LT 1840.92 1 Compilation practicesGB -5 -8 -11 -33 -40 -53 -42 -6 0 0 0 0 0 -540 -352 -1,091 GB 1091.43 12 Mistakes detected in BoP data ES -1,804 -1,609 -1,548 806 749 800 849 392 62 -68 708 -408 940 1,454 -279 1,044 ES 1044.00 1001 G+S Net explSK : : : : : : : : : : : : : : 1,007 1,007 SK 1006.51 10 Different data sources usedLV : 64 63 64 70 66 91 88 88 86 30 39 50 51 -22 828 LV 828.08 1001 G+S Net explSI : : : : : : : : : : -98 -129 -342 -105 392 -282 SI 282.00 1 Compilation practicesEE : : : : : : : : : : : -29 126 212 -74 234 EE 234.47 1 Compilation practicesDK : : : : : : 96 0 -20 0 1 1 2 -758 608 -71 DK 70.70 9 Vintage and revision differencesBG : : : : : : : : : : : : : : : 0 BG 0.00 No dataCY 0 CY 0.00 No dataHR 0 HR 0.00 No dataIE 0 IE 0.00 No dataLU 0 LU 0.00 No dataMT : : : : : : : : : : : : : : : 0 MT 0.00 No difference
59