1 VALUATION OF FIXED INCOME SECURITIES Bond: A debt instrument with periodic payments of interest...
29
1 VALUATION OF FIXED INCOME SECURITIES debt instrument with periodic s of interest and repayment of al at maturity rM rM rM rM rM rM+M __|____|____|____|...…..|___ | 2 3 4 5 n- on interest rate rity (par value) to maturity
-
date post
21-Dec-2015 -
Category
Documents
-
view
217 -
download
1
Transcript of 1 VALUATION OF FIXED INCOME SECURITIES Bond: A debt instrument with periodic payments of interest...

1
VALUATION OF FIXED INCOME SECURITIES
Bond: A debt instrument with periodic payments of interest and repayment of principal at maturity
rM rM rM rM rM rM rM+M|___|____|____|____|____|...…..|___ |0 1 2 3 4 5 n-1 n
r: coupon interest rateM: maturity (par value)n: term to maturity
2
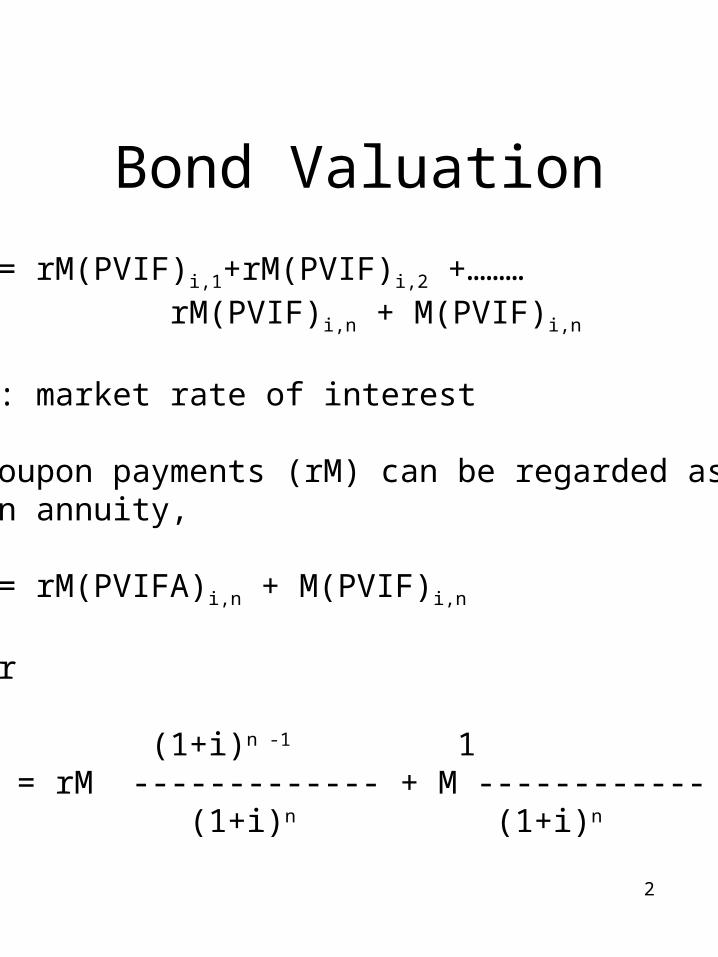
Bond Valuation
V= rM(PVIF)i,1+rM(PVIF)i,2 +………rM(PVIF)i,n + M(PVIF)i,n
i: market rate of interest
Coupon payments (rM) can be regarded asan annuity,
V= rM(PVIFA)i,n + M(PVIF)i,n
or
(1+i)n -1 1V = rM ------------- + M ------------
(1+i)n (1+i)n

3
Bond Valuation examplen=10 years, coupon rate: 8%M= $1,000 Market rate : 10%
$80 $80 $80 $80 $80 $80 $180|___|____|____|____|____|...…..|___ |0 1 2 3 4 5 9 10
V= $80x(PVIFA)10%,10 + $1,000x(PVIF)10%,10
= $877.11
If i > r V < M (discount)i < r V > M (premium)i = r V = M (par)
Yield-to-maturity: the rate of return on a bondIn the example, the YTM is 10%.
A bond’s YTM is the market rate of interest forthat risk group and maturity.

4
Valuation Between Interest Payment Dates
1
11/ )1()1()1(
1 n
tntgc i
M
i
rMrM
iV
V: invoice price of the bondc: days until first paymentg: number of days between two payment periods
P= quoted price = V - accrued interestAccrued Interest = rM (g-c)/g

5
Valuation Example
Eg. N=5 years,semiannual coupon r=8%, i=10%, first payment 2 months from today.
9
196/2 )05.01(
1000
)05.01(
4040
)05.01(
1
tt
V
V= Invoice Price = $953.29Accrued Interest = 40 x (4/6)
= $26.67
Quoted price = $926.62

6
Risks Faced by a Bond Investor
• Default risk
• Interest rate risk (price risk)
• Reinvestment risk
• Call risk
• Inflation risk
• Foreign exchange risk
• Liquidity risk

7
Rating
Category Moody’s S&P------------------------------------------High Grade Aaa AAA
Aa AA-------------------------------------------Investment A AGrade Baa BBB-------------------------------------------Speculative Ba BB
B B-------------------------------------------Default Caa CCC
Ca CC C C
D

8
Interest Rate Risk
Bond ValueMarket Rate of
InterestFirst Issue:N = 1 yr
Second Issue:N = 10 yrs
5% 100.00 100.006% 99.06 92.647% 98.13 85.958% 97.22 79.87
Example: Two bond issues of ABC Co.N1=1 yr N2= 10 yrs r = 5%
As term to maturity increases, value of the bond becomes more sensitive to movementsin market interest rate.

9
Bond Value and Coupon RatesExample:Two issues of ABC Co.
n=20 yrs, r1=10%, r2=6%
MarketInterest Rate
Bond 1R=10%
Percentchange
Bond 2R=6%
Percentchange
8% 119.64 80.369% 109.13 -8.78% 72.61 -9.64%10% 100.00 -8.36% 65.95 -9.17%11% 92.04 -7.96% 60.18 -8.75%12% 85.06 -7.58% 55.18 -8.31%
• Low coupon bonds are more sensitive to changes in market interest rates

10
Value of a Bond in Time
Example: Market rate stays at 10%, values oftwo bonds with coupon rates of 8% and 12%as the term to maturity approaches:
Maturity Bond 1R=8%
Bond 2R=12%
5 92.42 107.584 93.66 106.343 95.03 104.972 96.53 103.471 98.18 101.820 100.00 100.00
Assuming that interest rates remain the same,bond value approaches to par over time asterm to maturity shortens.
11
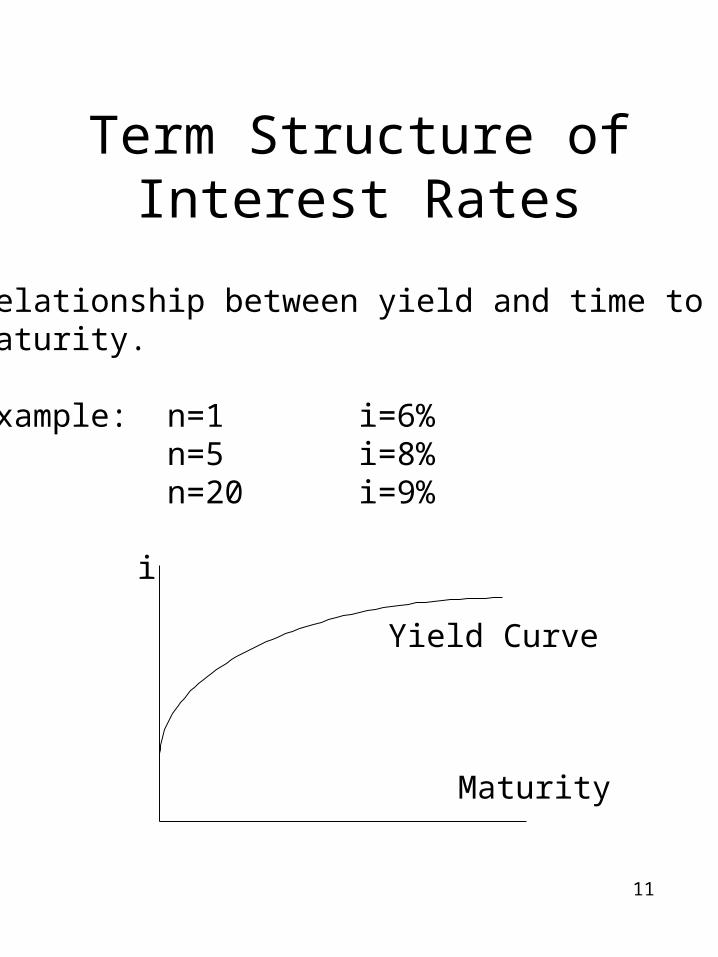
Term Structure of Interest Rates
Relationship between yield and time to maturity.
Example: n=1 i=6%n=5 i=8%n=20 i=9%
Maturity
i
Yield Curve

12
Possible Explanations of the Term Structure
1. Expectations Hypothesis
1 + in =[(1+ i1)(1+ 1i2)…….(1+n-1 in)]1/n
Example: i2=8% i1=6% 1i2=?
1 + 0.08 = [(1+ 0.06)(1+ 1i2)]1/2
1i2 = 0.1004 or 10%
2. Liquidity Preference Hypothesis
Slope of the yield curve is higher than specified in expectations hypothesis
3. Segmented Markets Hypothesis

13
Duration
Volatility in bond price is directly proportionalto term to maturity but inversely proportionalto coupon payments. Duration of a bond is a measure that incorporates both factors thataffect volatility.
n
ttt Vi
CtD
1 )1(
)(

14
Duration Examplen=5 yrs, r=8%, i=10%
(1)Year
(2)PMT
(3)PVIF
(4)(2)x(3)
(5)(4)/V
(6)(1)x(5)
1 8 0.9091 7.27 0.0787 0.0787
2 8 0.8264 6.61 0.0715 0.1430
3 8 0.7513 6.01 0.0650 0.1950
4 8 0.6830 5.46 0.0591 0.2364
5 108 0.6209 67.06 72.57 3.6284
Total 92.41 4.28
Bond Value = $92.41Macaulay Duration = 4.28 years

15
Hedging Interest Rate Risk
$12 $12 $12 $12 $12 $12 $112|___|____|____|____|____|...…..|___ |0 1 2 3 4 5 9 10
V0=$84.94 when i=15%
After i declines to 12%, V = $100V when term to maturity is 4 years:V6 = $100
Future value of the first 6 coupon paymentsreinvested at 12%: 12 x PVIFA 12%,6 = $97.38Total savings = $100 + $97.38 = $197.38
$84.94 in 6 years grows to $197.38Annual growth of 15%.
16
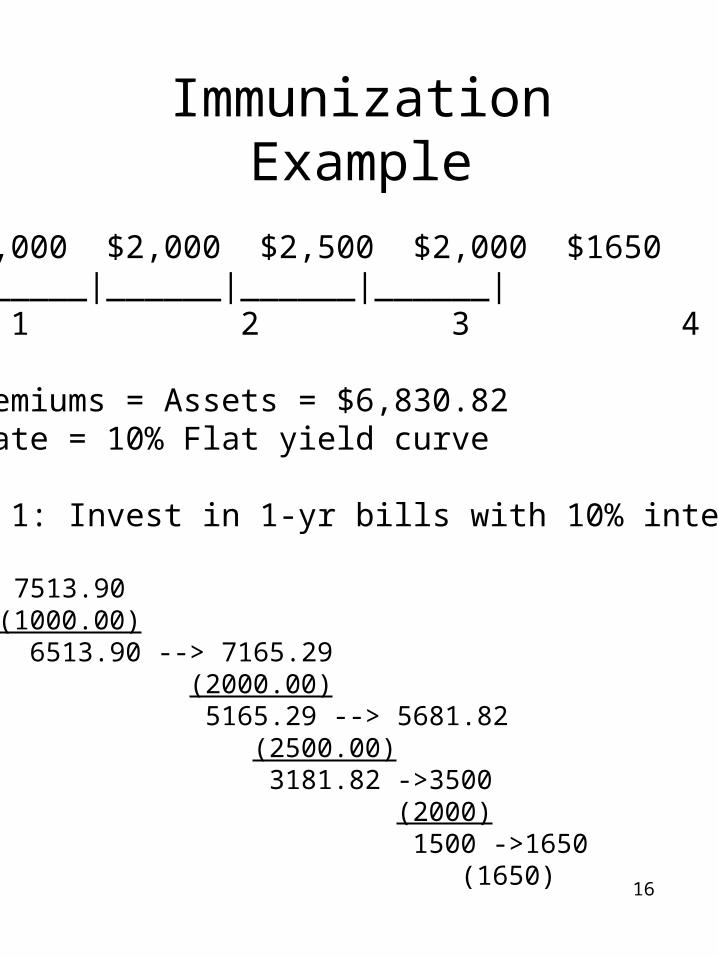
Immunization Example
$1,000 $2,000 $2,500 $2,000 $1650|_____|______|______|______|______|0 1 2 3 4 5
Total Premiums = Assets = $6,830.82Market rate = 10% Flat yield curve
Strategy 1: Invest in 1-yr bills with 10% interest
6830.82 -> 7513.90 (1000.00) 6513.90 --> 7165.29
(2000.00) 5165.29 --> 5681.82
(2500.00) 3181.82 ->3500
(2000) 1500 ->1650
(1650)

17
Immunization Example (Cont’d)
However, if interest rates fall, assets will be short of liabilities
Strategy 2: Invest in 3-yr zero coupon bondsyielding 10%
Duration of Liabilities:
1 1000 909.09 0.133 0.1332 2000 1652.89 0.242 0.4843 2500 1878.29 0.275 0.8254 2000 1366.03 0.200 0.8005 1650 1024.52 0.150 0.750
2.990
Duration = 2.99 years

18
Immunization Example (Cont’d)
Market rate 10%, V = $6,830.82M = $9,091.82 Duration = 3 years
If interest rates fall from 10% to 8%,V= $9,091.82 x PVIF 8%,3 = $7,217.38
7217.38 ->7794.77 (1000.00) 6794.77 ->7338.35
(2000.00) 5338.35->5765.42 (2500.00)
3265.42->3526.66 (2000.00) 1526.66->1650
(1650)

19
Modified Duration
DMD = -----------
(1 + i)
In the example above, MD = 4.28/1.10 = 3.89
Approximate Change in V = -MD x Change inyield
Example:If the yield decreases from 10% to 8%
% Change in V= -4.28 x (-2) = 8.56%
In fact when i=10% V = $92.41 i=8% V = $100 increase 8.21%

20
Convexity
Price-Yield Relationship
V
Yield
The shape of the curve depends on the coupon rate and term to maturity
High coupon + Short term -----> LinearLow coupon + Long term ------> Convex

21
Convexity (Cont’d)
Higher convexity means that when interestrates go up, bond value declines slowly; but when rates decline, increase in bond price is large
Therefore high convexity is a desirablefeature.
Factors that increase convexity:
* Low coupon* Long term to maturity* Low yield

22
Convexity (Cont’d)
n
tt
t tti
C
idi
Vd
VdiVd
1
222
2
2
2
)()1()1(
1
Convexity
(1) (2) (3) (4) (5)Year Ct PVIF(8%,n) (1) x (2) t2 + t (3) x (4)1 8 0.9091 7.27 2 14.552 8 0.8264 6.61 6 39.673 8 0.7513 6.01 12 72.134 8 0.6830 5.46 20 109.285 108 0.6209 67.06 30 2011.79
92.42 2247.41
Convexity = [1/(1.10)2][2247.41][1/92.42] = 20.10Appox. Change in V = -MD x i + K x (i)2

23
Alternative Measures of Yield
• Current Yield = rM / V
• Yield-to-maturity– Bond is held until maturity– All coupon and principal
repayments are made on time– Bond is not called before maturity– Coupon payments are reinvested
at yield-to-maturity
• Yield-to-call
• Holding period yield Vt+1 - Vt + rMHPY = -------------------- Vt

24
Approximate yield-to-maturity
2MVnVM
rMi
Example V= $877.11 n=3 yrs r=8% M=$1000
0983.0
2100011.877
1011.8771000
80
i

25
Bond Investment Strategies
I. Passive Strategies
Investing $100 in 1925T-billDepositsStock MarketAAA Corporate BondsGoldInflation
Passive Strategies are better when:Interest rate risk is low, andInflation is low and stable

26
II. Active Strategies
• Strategies based on maturity structure– Maturity matching - duration– Spreading the maturity– Investing only in short term bills and
long term bonds
• Strategies based on forecasting interest rate movements– Interest rate fluctuations
• Buy when rates are high, sell when low• Increase duration if higher rates are
forecast, reduce duration otherwise

27
- Riding the yield curve
• Investing in bonds assuming that the yield curve will not shift
i
Maturity
BA
Eg. 1 year bill i=6% V1 = $943.40 B 2 year zero coupon i=8% V2 = $857.34 A
Buy the 2-year bond at $857.34, sell it next yearat $943.40
HPY = (943.40 - 857.34) / 857.34 = 10.04%

28
Strategies based on lack of market efficiency
• Junk bonds
• Bond swaps– Yield swap : same coupon, rating,
maturity and industry, different yield
– Exchange swap: same rating, maturity, industry, yield, different coupon. Exchange current yield for capital gains
– Tax swap: Selling a bond to realize a loss, and replacing it with a similar bond
– Swapping bonds with different tax status: eg. AAA corporate bond vs. municipal bond

29
Strategies based on lack of market efficiency (cont’d)
• Possible shortcomings of bond swaps:– time to execute the swap– taxes– transaction costs– risk level of bonds
• Portfolio rebalancing: adjusting the bond portfolio for the changes in market conditions