
1 Using satellite data in joint CO 2 -CO inversion to improve CO 2 flux estimates Helen Wang 1,4,...
9
1 Using satellite data in joint CO 2 -CO inversion to improve CO 2 flux estimates Helen Wang 1,4 , Daniel J. Jacob 1 , Monika Kopacz 1 , Dylan B.A. Jones 2 , Parvadha Suntharalingam 3 , Jenny A. Fisher 1 1 1. Harvard University 2. University of Toronto 3. University of East Anglia 4. Harvard-Smithsonian Center For Astrophysics Submitted to ACP
-
date post
22-Dec-2015 -
Category
Documents
-
view
212 -
download
0
Transcript of 1 Using satellite data in joint CO 2 -CO inversion to improve CO 2 flux estimates Helen Wang 1,4,...

1
Using satellite data in joint CO2-CO inversion to
improve CO2 flux estimates
Helen Wang1,4,
Daniel J. Jacob1, Monika Kopacz1,
Dylan B.A. Jones2, Parvadha Suntharalingam3,
Jenny A. Fisher1
1
1. Harvard University2. University of Toronto3. University of East Anglia4. Harvard-Smithsonian Center For Astrophysics
Submitted to ACP

[Palmer et al., 2006]
Kg/m2
Jan 2006 model column CO2 Jan 2006 model column CO
g/m2
•CO and CO2 share common combustion sources and transport,indicating cross correlation in concentration and error.
•CO has stronger gradient, is more sensitive to transport error, can provide additional constraint.
Why CO2 : CO ?
•CO is relatively easy to measure from space; Multiple validated data sets have been used for CO source inversion.
•Joint CO – CO2 inversion using aircraft data in Asian outflow showed substantial improvement over CO2 – only inversion.

33
Joint CO2 – CO inversion
Coupling between CO2 and CO occurs through off-diagonal elements in error covariance matrices S
2
22
CO CO CO
COco co
S cov( , )S
cov( , ) S
2 2co co co cocov( , ) var( ) var( )r
correlation coefficient•Off diagonal elements increase information content•Negligible correlation in Sa due to CO emission factor uncertainty
Observation Vector: Column
concentration 2
CO
CO
xx
x
State Vector:
Sources
1 1( ) ( ) ( ) ( ) ( )T Ta a aJ x y Kx S y Kx x x S x x
Cost function Observational
error covariance
A priorierror covariance

4
OCO CO2 : important
MOPITT CO: dominant
I R M
Instrumenterror
Representationerror
Modelerror
Observationalerror
Components of observational error
Covaiance strucutre comes from the model error
5
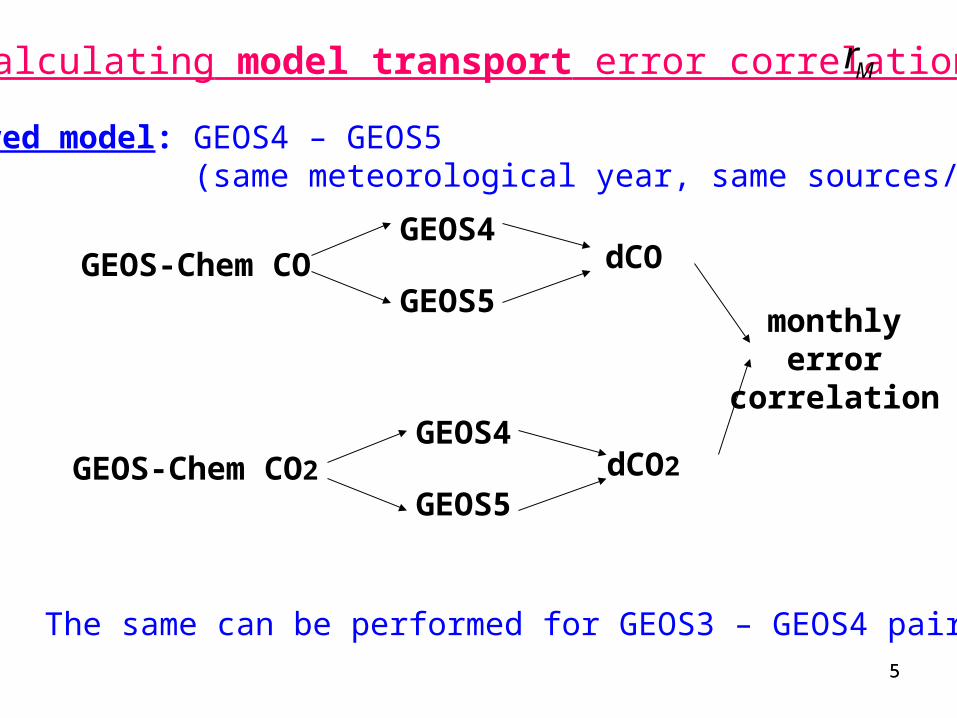
1. Paired model: GEOS4 – GEOS5 (same meteorological year, same sources/sinks)
Calculating model transport error correlation
GEOS-Chem COGEOS4
GEOS5dCO
GEOS-Chem CO2GEOS4
GEOS5dCO2
monthlyerror
correlation
The same can be performed for GEOS3 – GEOS4 pair5
Mr

6
Model error correlation 1:30 PM, no averaging kernel
Large scale error correlation patterns are robust Error correlation is different from concentration correlation
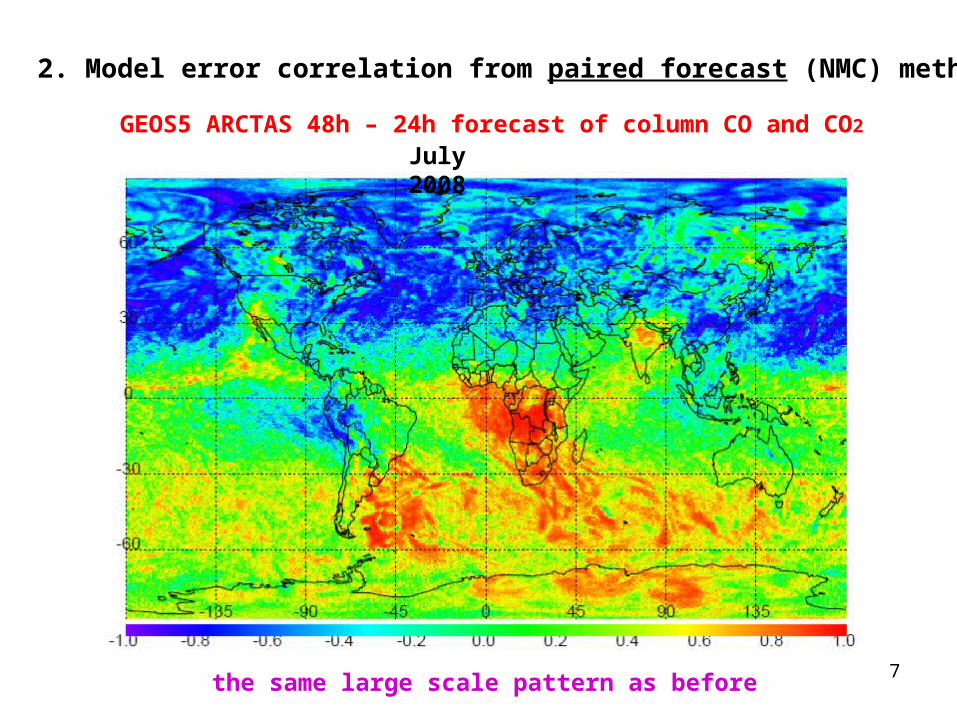
7the same large scale pattern as before
GEOS5 ARCTAS 48h – 24h forecast of column CO and CO2
July 2008
2. Model error correlation from paired forecast (NMC) method

8
Analytical inversion results for Europe with globally uniform model error correlation and no instrument or representation errors
•Substantial improvements when rM > 0.6
Model error correlation rM Model error correlation rM
biosphere
combustion
December 2005
A posteriori CO2 flux uncertaintyA posteriori biosphere -
combustion CO2 flux correlation
•14 days of pseudo column CO and CO2 data from GEOS-Chem 2x2.5 simulation sampled from A-train orbit
•With OCO-like averaging kernels for column CO and CO2
Co
rrel
atio
n c
oef
fici
ent
Co
rrel
ated
in
vers
ion
flu
x u
nce
rtai
nty
/U
nco
rrel
ated
in
vers
ion
un
cert
ain
ty

Results with model error correlation mapand no instrument or representation errors
CombustionBiosphere
1.0
0.6
0.0
0.2
0.8
0.4
US Europe N.Africa S. Africa E.Asia
Dec 2005
Rel
ativ
e a
po
ster
iori
un
cert
ain
ty
Importance of decreasing I R
1.0
0.6
0.0
0.2
0.8
0.4
15 - 55% improvements in a posteriori CO2 flux in winter10 - 30% improvements in summer
July 2005
M


![Constraints on aerosol sources using GEOS-Chem adjoint and ...henzed/pubs/jgrd50515.pdf · 2004; Kopacz et al., 2009;] and over the globe [e.g., Stavrakou and Müller, 2006; Kopacz](https://static.fdocuments.in/doc/165x107/613017d41ecc51586943dfba/constraints-on-aerosol-sources-using-geos-chem-adjoint-and-henzedpubsjgrd50515pdf.jpg)

![Stereoconvergent [1,2]- and [1,4]-Wittig Rearrangements of ...[1,4]-Wittig rearrangements to the corresponding α-silylcyclo-pentenols or (α-cyclopropyl)acylsilanes favor the [1,4]-path-way](https://static.fdocuments.in/doc/165x107/60e13dec732285091278ceb6/stereoconvergent-12-and-14-wittig-rearrangements-of-14-wittig-rearrangements.jpg)


![Cholesteric Liquid-Crystal Copolyester, Poly[oxycarbonyl- 1,4-phenylene- oxy - 1,4 terephthaloyl- oxy- 1,4-phenylenecarbonyloxy (1,2-dodecane)] [C34H36O8]n, Synthesized from Racemic](https://static.fdocuments.in/doc/165x107/577cb2a31a28aba7118c1f59/cholesteric-liquid-crystal-copolyester-polyoxycarbonyl-14-phenylene-oxy.jpg)

![DARCO: Infrastructure for Research on HW/SW co-designed ...arco.e.ac.upc.edu/wiki/images/d/df/Pavlou_amasbt11.pdf · HW/SW co-design paradigm, Crusoe [1,4] and Efficeon [8], academia](https://static.fdocuments.in/doc/165x107/5f9a9bb6048fda2f28633009/darco-infrastructure-for-research-on-hwsw-co-designed-arcoeacupceduwikiimagesddfpavlou.jpg)