1 Unemployment and Inflation Chapter 23 © 2006 Thomson/South-Western.
40
1 Unemployment and Inflation Chapter 23 © 2006 Thomson/South-Western
-
Upload
emory-murphy -
Category
Documents
-
view
214 -
download
2
Transcript of 1 Unemployment and Inflation Chapter 23 © 2006 Thomson/South-Western.

1
Unemployment and Inflation
Chapter 23
© 2006 Thomson/South-Western

2
Costs of Unemployment
Personal CostLoss of paycheckLoss of self-esteemIncrease in stress related psychological
problemsIncrease in incidence of crime, suicide, and
mental illness
Economic CostLoss in output

3
Measuring Unemployment
Civilian Noninstitutional Adult Population All civilians 16 years of age and older Excludes institutionalized in prisons or mental
hospitals Excludes those in military
Labor force Those in the adult population who are either working
or looking for work

4
Measuring Unemployment
Unemployed Those with no job who are looking for work
Unemployment rate Measures the percentage of those in the labor force
who are unemployed Equals the number unemployed divided by the
number in the labor force Does not include discouraged workers
Discouraged workers Those who are no longer looking for work but are
unemployed

5
Exhibit 1: The Adult Population Sums the Employed, the Unemployed, and Those Not in the Labor Force

6
Labor Force Participation Rate
The number in the labor force divided by the adult population
On average, two out of three adults are in the labor force
Increased from about 60% in 1970 to approximately 67% in 1990 and has remained relatively constant since
Convergence of the participation rates of men and women over last 40 years as more women enter the labor force

7
Trend of Unemployment Rate
Decline in the unemployment rate over last 20 years Overall growth in the economy Relatively fewer teenagers in the work force
Unemployment rate says nothing about who is unemployed or for how long – differs across
RaceGenderAgeGeographical areaOccupational group

8
Exhibit 2: The U.S. Unemployment Rate Since 1900

9
Exhibit 3: Unemployment Rates for Various Groups

10
Exhibit 3: Unemployment Rates for Various Groups
11
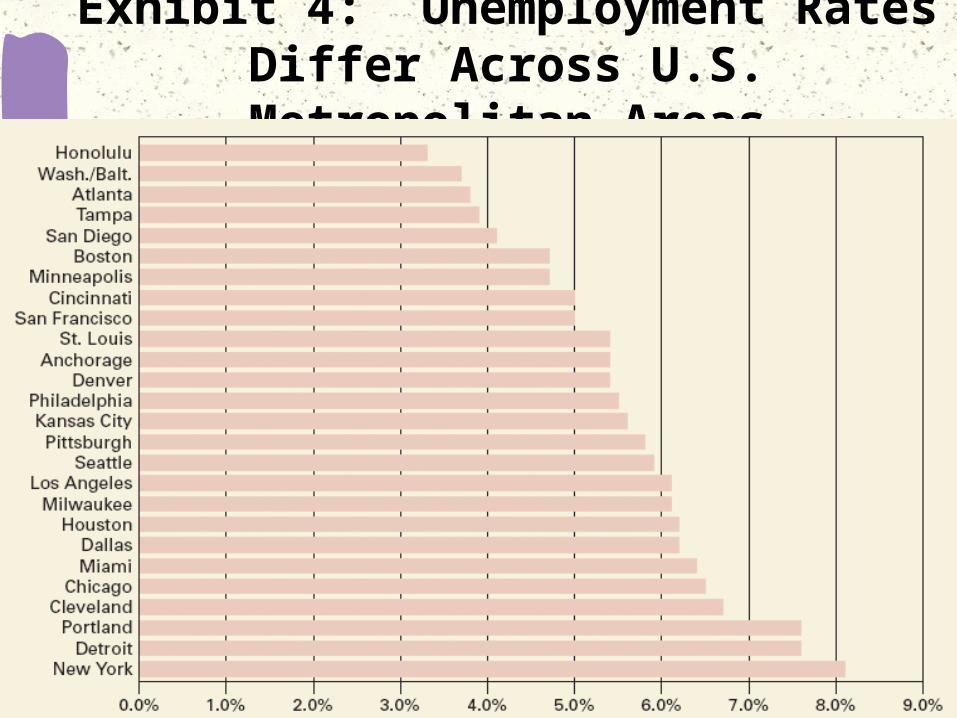
Exhibit 4: Unemployment Rates Differ Across U.S. Metropolitan Areas

12
Sources of Unemployment
FrictionalSeasonalStructuralCyclical

13
Frictional Unemployment
Caused by time required to bring together labor suppliers and labor demanders Employers need time to learn about the talent
available Job seekers need time to learn about employment
opportunities
Generally short-term and voluntary

14
Seasonal Unemployment
Caused by seasonal changes in labor demand during the year
To eliminate the impact of such changes, monthly unemployment statistics are seasonally adjusted, which smoothes out these factors

15
Structural Unemployment
Exists because unemployed workers often Do not have the skills demanded by employers, or Do not live where their skills are in demand
Occurs because changes in tastes, technology, taxes, or competition reduce the demand for certain skills and increase the demand for other skills

16
Cyclical Unemployment
Fluctuates with the business cycle, increasing during contractions and decreasing during expansions
Means the economy is operating inside its PPF
Government policies to stimulate aggregate demand recessions is aimed at reducing this type of unemployment

17
Full Employment
Occurs only if there is no cyclical unemployment Occurs when the only unemployment is
frictional, structural, or seasonalDoes not mean zero unemploymentFrictional, seasonal, and structural
unemployment can still occur
Occurs when from 4% to 6% of the labor force is unemployed

18
Unemployment Compensation
Cash transfers for those who lose their jobs and actively seek employment
Applies to unemployed workers who meet certain qualifications
Problems with unemployment compensation:Workers who receive benefits tend to search
less actively than those who don’tMay reduce the urgency of finding work

19
International Comparisons
Why are unemployment rates so high in Europe? Ratio of unemployment benefits to average pay is
higher Unemployment benefits last longer, sometimes
years, so workers have less incentive to find new jobs
Government regulations make employers in Europe reluctant to hire new workers because firing them is difficult

20
Exhibit 5: In the Last Two Decades, Unemployment Rates Fell in the United States, Rose in Japan, and
Remained High in Europe
21
Problems with Unemployment Figures
Understate the actual amount of unemployment because they do not include discouraged workers and underemployed
Underemployment occurs when people are counted as employed even if they
can find only part-time jobs orAre vastly overqualified for their job

22
Problems with Unemployment Figures
Tend to overstate unemployment because Employment insurance and most welfare programs
require recipients to seek employment Some who would prefer to work part time can find
only full-time work Some are forced to work overtime and weekends, but
would prefer to work fewer hours People in the underground economy may not readily
acknowledge such jobs because their intent is to evade taxes

23
Inflation
Inflation: a sustained increase in the average price level
Hyperinflation: extremely high inflation Deflation: a sustained decline in the
average price levelDisinflation: a reduction in the rate of
inflation

24
Inflation
Inflation is typically measured annually
Annual inflation rate is the percentage increase in the average price level from one year to the next
Two sources of inflationDemand-pull inflationCost-push inflation

25
Exhibit 6a: Inflation Caused by Shifts of AD and AS Curves
Increase in the AD curve pulls up the price level. To generate continuous demand-pull inflation, the AD curve must keep shifting outward along a given AS curve
Increase in costs of production push up the price level. To generate continuous cost-push inflation, the AS curve must keep shifting to the left along a given AD curve.

26
Exhibit 7a: Consumer Price Index Since 1913

27
Exhibit 7b: CPI Since 1913 – Annual Percentage Change

28
Anticipated versus Unanticipated Inflation
Unanticipated inflation creates more problems for the economy than does anticipated inflation
To the extent that inflation is higher or lower than anticipated, it arbitrarily creates winners and losers If it is higher than expected, the winners are all
those who had contracted to pay a price that anticipates lower inflation
The losers are all those who agreed to sell at that price
If inflation is lower is lower than expected, the situation is reversed

29
Transaction Costs of Inflation
When prices are stable, people correctly believe they can predict future prices and can plan accordingly But, if inflation changes unexpectedly, planning gets
harder which undermines the ability of money to serve as a link between the present and the future
When dealing with the rest of the world, they must also anticipate how the value of the dollar might change relative to foreign currencies

30
Obscures Relative Price Changes
Relative prices describe the exchange rate between goods—how much one good costs compared to another
Inflation does not necessarily cause the change in relative prices, but it can obscure them
Occurs because of the greater uncertainty about the price of one good relative to another

31
Inflation Across Metropolitan Areas
Inflation rates differ across regions mostly because of differences in housing prices, which grow faster in some places than in others
Federal government tracks separate CPIs for each of 26 metropolitan areas.

32
Exhibit 8: Average Annual Inflation from 1994 to 2004 Differed Across U.S. Metropolitan Areas
33
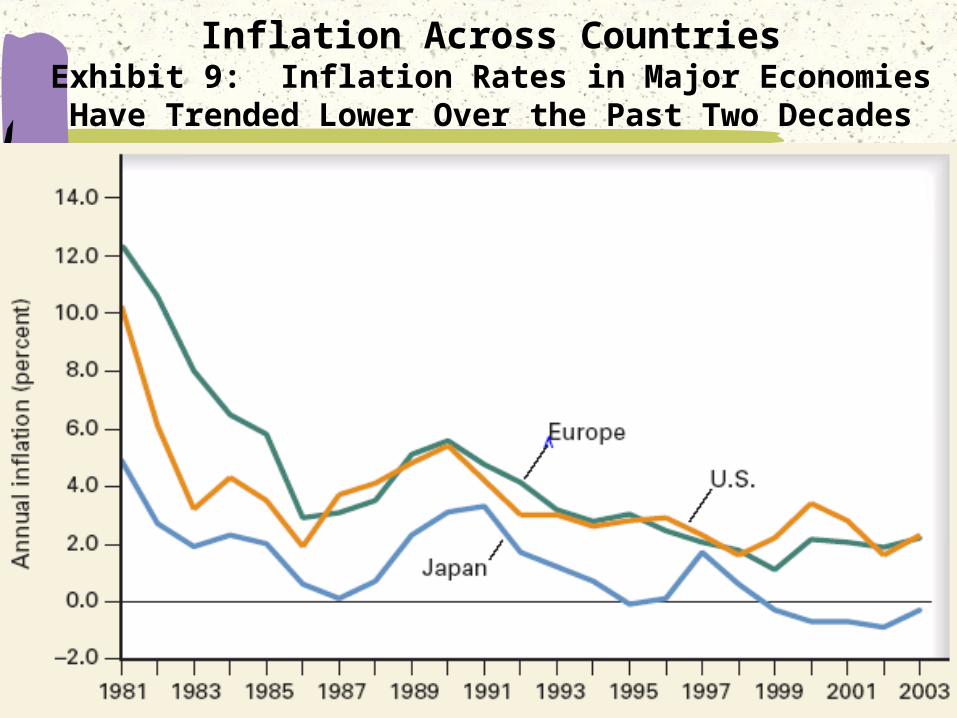
Inflation Across CountriesExhibit 9: Inflation Rates in Major Economies Have Trended
Lower Over the Past Two Decades

34
Inflation and Interest Rates
Interest is the dollar amount paid by borrowers to lenders because lenders must be rewarded for forgoing present consumption
The interest rate is the interest per year as a percentage of the amount loaned

35
Exhibit 10: The Market for Loanable Funds
Greater the interest rate, the greater the reward for loaning money: supply curve slopes downwardThe higher the interest rate, the higher cost of borrowing – the quantity of loanable funds demanded decreases as the interest rate increases, other things constant: demand curve for loanable funds is downward slopingEquilibrium interest rate is at the intersection of the supply of and demand for loanable funds
36
Interest Rates
Nominal interest rate Measures interest in terms of the current dollars
paid The interest rate that appears on the borrowing
agreement The rate quoted in the news media
Real interest rate Equals the nominal rate of interest minus the
inflation rate Expressed in dollars of constant purchasing power

37
Interest Rates
With no inflation, the nominal and real interest rates would be identical
With inflation, the nominal interest rate exceeds the real interest rate If the inflation rate is high enough, the real interest
rate can actually be negative The nominal interest would not even offset the loss
in spending power because of inflation – lenders would lose purchasing power
Why lenders and borrowers are concerned more about the real interest rate than the nominal interest rate

38
Interest Rates
The higher the expected rate of inflation, the higher the nominal rate of interest that lenders require and that borrowers are willing to pay
Expected real interest rate equals the nominal rate of interest minus the expected inflation rate

39
Why is Inflation Unpopular?
Problems with unanticipated inflationHits those whose incomes are fixed in
nominal termsArbitrarily redistributes income and wealth
from one group to anotherReduces the ability to make long-term plansForces buyers and sellers to pay more
attention to prices - less time for production - overall productivity of economy falls

40
COLA
Cost of Living Adjustment: the increase in a transfer payment or wage that reflects the increase in the price level