1 Ultrasonic Isolation of Buried Pipes - Spiral: Home Ultrasonic Isolation of Buried Pipes Eli...
45
1 Ultrasonic Isolation of Buried Pipes 1 Eli Leinov*, Michael JS Lowe and Peter Cawley 2 NDE Group, Department of Mechanical Engineering, Imperial College, London SW7 2AZ, 3 UK. 4 * Corresponding author: Tel. +44 207 594 7227 [email protected] 5 6 Abstract 7 Long-range guided wave testing (GWT) is used routinely for the monitoring and detection of 8 corrosion defects in above ground pipelines. The GWT test range in buried, coated pipelines 9 is greatly reduced compared to above ground configurations due to energy leakage into the 10 embedding soil. In this paper, the effect of pipe coatings on the guided wave attenuation is 11 investigated with the aim of increasing test ranges for buried pipelines. The attenuation of the 12 T(0,1) and L(0,2) guided wave modes is measured using a full-scale experimental apparatus 13 in a fusion-bonded epoxy (FBE)-coated 8” pipe, buried in loose and compacted sand. Tests 14 are performed over a frequency range typically used in GWT of 10-35 kHz and compared 15 with model predictions. It is shown that the application of a low impedance coating between 16 the FBE layer and the sand effectively decouples the influence of the sand on the ultrasound 17 leakage from the buried pipe. Ultrasonic isolation of a buried pipe is demonstrated by coating 18 the pipe with a Polyethylene (PE)-foam layer that has a smaller impedance than both the pipe 19 and sand, and has the ability to withstand the overburden load from the sand. The measured 20 attenuation in the buried PE-foam-FBE-coated pipe is found to be substantially reduced, in 21 the range of 0.3-1.2 dBm -1 for loose and compacted sand conditions, compared to measured 22 attenuation of 1.7-4.7 dBm -1 in the buried FBE-coated pipe without the PE-foam. The 23
Transcript of 1 Ultrasonic Isolation of Buried Pipes - Spiral: Home Ultrasonic Isolation of Buried Pipes Eli...

1
Ultrasonic Isolation of Buried Pipes 1
Eli Leinov*, Michael JS Lowe and Peter Cawley 2
NDE Group, Department of Mechanical Engineering, Imperial College, London SW7 2AZ, 3
UK. 4
* Corresponding author: Tel. +44 207 594 7227 [email protected] 5
6
Abstract 7
Long-range guided wave testing (GWT) is used routinely for the monitoring and detection of 8
corrosion defects in above ground pipelines. The GWT test range in buried, coated pipelines 9
is greatly reduced compared to above ground configurations due to energy leakage into the 10
embedding soil. In this paper, the effect of pipe coatings on the guided wave attenuation is 11
investigated with the aim of increasing test ranges for buried pipelines. The attenuation of the 12
T(0,1) and L(0,2) guided wave modes is measured using a full-scale experimental apparatus 13
in a fusion-bonded epoxy (FBE)-coated 8” pipe, buried in loose and compacted sand. Tests 14
are performed over a frequency range typically used in GWT of 10-35 kHz and compared 15
with model predictions. It is shown that the application of a low impedance coating between 16
the FBE layer and the sand effectively decouples the influence of the sand on the ultrasound 17
leakage from the buried pipe. Ultrasonic isolation of a buried pipe is demonstrated by coating 18
the pipe with a Polyethylene (PE)-foam layer that has a smaller impedance than both the pipe 19
and sand, and has the ability to withstand the overburden load from the sand. The measured 20
attenuation in the buried PE-foam-FBE-coated pipe is found to be substantially reduced, in 21
the range of 0.3-1.2 dBm-1 for loose and compacted sand conditions, compared to measured 22
attenuation of 1.7-4.7 dBm-1 in the buried FBE-coated pipe without the PE-foam. The 23
2
acoustic properties of the PE-foam are measured independently using ultrasonic 24
interferometry and incorporated into model predictions of guided wave propagation in buried 25
coated pipe. Good agreement is found between the experimental measurements and model 26
predictions. The attenuation exhibits periodic peaks in the frequency domain corresponding 27
to the through-thickness resonance frequencies of the coating layer. The large reduction in 28
guided wave attenuation for PE-coated pipes would lead to greatly increased GWT test 29
ranges; such coatings would be attractive for new pipeline installations. 30
31
32
33
Keywords: Guided wave testing; Buried pipes; Coated pipes; Sand; Ultrasonic isolation. 34
35
3
1. Introduction 36
The abundance of pipelines worldwide requires the use of inspection technologies to facilitate 37
integrity management for early detection of corrosion and possible leakage locations. Elastic 38
wave propagation along cylindrical shells has received comprehensive treatment in the 39
literature [e.g. 1-5] and has been utilised successfully in non-destructive evaluation for the 40
inspection of pipelines [6-11]. The long-range guided wave testing (GWT) method has been 41
routinely used for over a decade in the petrochemical, energy and nuclear industries [12-15]. 42
GWT offers rapid screening of pipework for the detection and monitoring of corrosion 43
defects from a single transducer position. The method typically employs torsional (T(0,1)) or 44
longitudinal (L(0,2)) wave modes in frequencies below 100 kHz. Waves are excited and 45
received either using a transducer ring comprising an array of dry-coupled piezoelectric 46
elements equally spaced around the circumference of the pipe [10, 16-20] or magnetostrictive 47
sensors [e.g. 21-22]. The method is commonly applied to bare- or thinly epoxy-painted pipes 48
in above-ground configurations, where a single transducer ring location provides coverage of 49
several tens of metres [e.g. 12]. However, for pipes buried in soil test ranges are drastically 50
reduced [15, 23]. Typically for modern pipeline engineering practices, coating materials, e.g. 51
fusion-bonded epoxy (FBE), coal-tar-enamel and high-density polyethylene (HDPE), are 52
either factory- or field-applied to pipes that are buried in the ground in order to provide 53
insulation from harsh environments and protection from corrosion. The guided wave 54
attenuation in coated or embedded waveguides is due to leakage of energy radiating out into 55
the embedding material, and damping by energy-absorbing materials of the waveguide 56
system, resulting in a severe reduction of the test range. The extent of leakage depends on the 57
material properties of both the pipe and the embedding material. For structures coated with 58
materials having internal damping, e.g. bitumen, the attenuation is also related to the fraction 59
4
of energy in the mode of interest that is carried in the coating layer and generally increases 60
with frequency. 61
Wave propagation in multi-layered systems has been described in the literature in the context 62
of geophysics and acoustics [e.g. 24-26]. Matrix techniques [e.g. 27 and references therein] 63
have been used for embedded and coated waveguides to yield dispersion curves and through-64
thickness wave mode-shapes for certain regular geometries, i.e. flat plate and cylindrical 65
structures. These were used to evaluate the guided wave mode properties, including 66
attenuation and sensitivity to target defect morphologies [27-28]. Leaky cylindrical 67
waveguides embedded in infinite media were studied in several configurations, including 68
steel bars embedded in cement grout [29], rock bolts embedded in rock strata [30], 69
reinforcing bars and anchor bolts embedded in concrete [31], steel bars embedded in soil 70
[32], and wires in epoxy resin [33-34]. Wave propagation in attenuative viscoelastic materials 71
was treated rigorously for plastic plates [35-36], elastic plates coated with viscoelastic 72
materials [37-39], and elastic hollow cylinders coated with viscoelastic material externally 73
[40] and internally [41]. Finite-element modeling and semi-analytical finite-element 74
formulations were utilised to address coated pipes [42-45] and coated pipes buried in soil [46-75
47], as well as the general case of arbitrary section waveguides embedded in solid media 76
[48]. Only limited measurements of the torsional guided wave attenuation in buried pipes 77
have ever been reported in the literature [49]. Recently, Leinov et al. [23, 50] studied 78
systematically guided wave propagation in a bare steel pipe buried in sand under a variety of 79
experimental conditions and examined the nature of the attenuation of the modes, which is 80
primarily due to leakage of energy. 81
Buried pipelines are currently accessed for GWT by digging a pit to expose the pipe at the 82
location where a transducer ring is to be attached (Figure 1). A very large fraction of the costs 83
involved in GWT of such buried-pipe systems is in gaining access to attach the transducer 84
5
ring and re-covering the pipeline after the inspection. Hence, maximizing the distance over 85
which the guided waves can propagate and defects can be detected from a single access 86
location is essential and has substantial economic implications. 87
In the present study, we investigate guided wave propagation in buried FBE-coated pipe 88
using a full-scale experimental apparatus and model simulations. Measurements of torsional 89
and longitudinal guided wave mode attenuation are compared to an earlier investigation 90
performed by the authors on bare pipe buried in sand [23]. We aim to investigate the effect of 91
the pipe coating on the guided wave attenuation and to determine whether a pipe coating can 92
be used to increase the test range in buried pipelines. Ultrasonic isolation of a buried pipe is 93
demonstrated by utilising a low impedance coating material which effectively decouples the 94
influence of the sand on the ultrasound leakage from the buried pipe. The acoustic properties 95
of the coating material are evaluated independently using ultrasonic interferometry. The 96
nature of the attenuation behaviour is examined, providing understanding of the phenomena 97
of generic value to cases of coated or embedded multilayer waveguides. 98
This paper is organised as follows. The theoretical model of guided wave propagation in 99
embedded and coated cylindrical shells is discussed in section 2.1 and the acoustic properties 100
of soils are reviewed in section 2.2. The experimental apparatus and measurement method are 101
described in section 3. The experimental and model results are reported and discussed in 102
section 4 and the conclusion are provided in section 5. 103
104
2. Background 105
2.1 Guided wave modelling 106
6
The propagation of a stress wave in an isotropic elastic medium is governed by Navier’s 107
equation of motion: 108
𝜇∇2𝒖 + (𝜆 + 𝜇)∇(∇ ∙ 𝒖) = 𝜌 𝜕2𝒖 𝜕𝑡2⁄ (1) 109
where 𝒖 is the displacement vector field, 𝜆 and 𝜇 are the Lamé constants for the material, and 110
𝜌 the density. Using Helmholtz’s decomposition the displacement vector in Eq. (1) is 111
replaced by a combination of the gradient of a scalar potential field, 𝜙, and the curl of a 112
vector potential field, 𝝍: 113
𝒖 = ∇𝜙 + ∇ × 𝝍 (2) 114
Substituting Eq. (2) into Eq. (1), along with ∇ ∙ 𝝍 = 0, yields the standard wave equations 115
describing longitudinal and shear propagation, respectively: 116
𝑐𝐿2∇2𝜙 = 𝜕2𝜙 𝜕𝑡2⁄ (3) 117
𝑐𝑆2∇2𝝍 = 𝜕2𝝍 𝜕𝑡2⁄ (4) 118
where 𝐶𝐿 = �(𝜆 + 2𝜇) 𝜌⁄ and 𝐶𝑆 = �𝜇 𝜌⁄ are the longitudinal and shear velocities. The 119
solutions of Equations (3-4) along with relevant boundary conditions represent all elastic 120
wave modes propagating in a structure. Considering an infinitely long homogeneous hollow 121
cylinder with its axis along the z-coordinate of a cylindrical system (𝑟, 𝜃, 𝑧) and assuming 122
harmonic wave propagation, it follows that Bessel functions of the first and second kind have 123
to be introduced into the scalar potential and into the three components of the vector potential 124
in order to satisfy Equations (3-4). The components of the displacement field are then 125
obtained in terms of the potentials from Equation (2). Boundary conditions of zero traction 126
need to be satisfied on both the external and inner surfaces of the hollow cylinder. Thus, there 127
are three equations for each of the stress components (𝜏𝑟𝑟; 𝜏𝑟𝑟; 𝜏𝑟𝑟) expressing the boundary 128
7
conditions on each of the two free surfaces, resulting in six unknown constants in total. 129
Setting the determinant of these six equations to zero yields the dispersion relation which can 130
only be solved using numerical techniques (see [1-2, 11, 27, 40, 51-52]). Three classes of 131
propagating wave modes are recognised in the solutions, namely, longitudinal axially 132
symmetric, torsional axially symmetric and flexural non-axially symmetric [e.g. 7]. 133
A system comprising a hollow cylindrical waveguide coated with a finite number of 134
cylindrical layers can be analysed using the same formalism of Equations (1-4), considering 135
different acoustic properties for each layer and additional boundary conditions to include the 136
additional boundary surfaces. For an infinite embedding medium, the exterior surface of the 137
waveguide is no longer a free surface and the boundary conditions change to allow radiating 138
waves from the waveguide out into the embedding material. The leakage of energy from the 139
waveguide results in attenuation of the guided wave modes. The acoustic properties of the 140
coating and embedding layers dictate the attenuation regime. For a pipe embedded in an 141
elastic medium having a lower acoustic impedance the attenuation is governed only by 142
leakage of energy. However, for attenuative viscoelastic materials, e.g. coal-tar-enamel [49], 143
HDPE [35] and bitumen [36, 40, 42-46], dissipation of energy also occurs due to internal 144
losses. The hysteretic nature of damping is taken into account under linear viscoelasticity 145
assumption by modifying the Lamé constants into the following operators: 146
𝜆 → 𝜆 + 𝜆�
𝜔𝜕𝜕𝜕
; 𝜇 → 𝜇 + 𝜇�𝜔
𝜕𝜕𝜕
(5) 147
where �̃� and 𝜇� represent the viscoelastic material constants and 𝜔 the frequency. The 148
equation of motion (Equation (1)) is modified accordingly, resulting in definition of 149
velocities which include complex parts: 150
𝐶𝐿′ = �𝜆+2𝜇−𝑖�𝜆�+2𝜇��𝜌
; 𝐶𝑆′ = �𝜇−𝑖𝜇�𝜌
(6) 151
8
The real parts of 𝐶𝐿′ and 𝐶𝑆′ are the longitudinal and shear velocities for a material without 152
damping. The bulk wave phase velocities are obtained from: 153
𝐶𝐿,𝑆 = 𝜔|𝑅𝑅(𝒌)| (7) 154
The formal solutions of the resulting wave equations are identical to those of the elastic case 155
(Equation (2)), except the harmonic wave formulation has to involve a complex wavenumber 156
vector, 𝒌 = 𝒌𝑅𝑅 + 𝑖𝒌𝐼𝐼. Waves propagate in the direction of the real wavenumber vector 157
𝒌𝑅𝑅, and the attenuation with propagation distance is described by the imaginary 158
wavenumber 𝒌𝐼𝐼. The angle between the relative orientation of the real and imaginary 159
wavenumber vectors dictates the attenuation regime. The acoustic properties of a viscoelastic 160
material are defined by considering a case where the real and the imaginary parts of 𝒌 are 161
parallel. The frequency dependent complex velocities are related to the acoustic properties 162
according to [27, 36]: 163
𝐶𝐿,𝑆′ = 𝐶𝐿,𝑆
1+𝑖𝛼𝐿,𝑆2𝜋
(8) 164
where 𝛼𝐿,𝑆 are the bulk attenuation in nepers per wavelength and corresponds to the ratio of 165
the imaginary wavenumber to the real wavenumber moduli. The attenuation per wavelength 166
is considered constant for all frequencies, and therefore the attenuation per unit distance 167
increases linearly with frequency [27]. For an elastic coating material 𝒌𝐼𝐼 is normal to 𝒌𝑅𝑅 168
and leakage occurs when the phase velocity in the inner cylindrical shell is larger than that in 169
the coating layer. When the phase velocity in the coating layer is larger than that in the inner 170
cylindrical shell the guided wave becomes non-leaky. 171
The guided wave attenuation exhibits periodic peaks and troughs in the frequency domain 172
which are related to the through-thickness resonance frequencies of the viscoelastic layer [37-173

9
38]. In turn, the shear cutoff frequencies of interest in this study depend on the thickness and 174
bulk shear velocity of the coating layer and can be approximated as [41]: 175
𝑓𝑟𝑅𝑟,𝑛 ≅𝐶𝑆4ℎ
(2𝑛 − 1); 𝑛 = 1,2, … (9) 176
where ℎ is the thickness of the coating layer. 177
In this study, we investigate wave propagation in a coated pipe embedded in sand. In 178
particular, we are interested in the zero-order torsional (T(0,1)) and longitudinal (L(0,2)) 179
modes. The displacement field associated with these axially symmetric modes propagating 180
along the axial direction in the embedded-coated-pipe system are analysed using the 181
formalism of Equations (1-8), considering different material properties of each of the layers 182
and modifying the boundary conditions. Specifically, continuity of displacements and stresses 183
is imposed at the interfaces between the pipe and the coating and between the coating and the 184
soil. The resulting characteristic dispersion relation is solved using the Disperse modelling 185
software [27-28]. 186
The Disperse software was used to predict the attenuation as a function of frequency for 187
different sand and coating acoustic properties to match the conditions covered in this study. 188
Figure 2 presents an example of dispersion curves of the zero-order modes for a Schedule-40, 189
8 inch pipe with and without FBE-coating embedded in soil with representative acoustic 190
properties. The group velocities are presented in Figure 2a and the corresponding attenuation 191
of the modes is presented in Figure 2b. The T(0,1) mode is non-dispersive for all frequencies, 192
while the L(0,2) mode is essentially non-dispersive over the ~20-100kHz range. The 193
attenuation values of the modes in the coated-embedded-pipe are slightly higher than the 194
bare-embedded pipe for low frequencies and increase with frequency. The attenuation values 195
depend on the bulk velocities of the embedding medium and will vary for different acoustic 196
properties of the soil. 197
10
2.2 Acoustic properties of soils 198
The acoustic properties of the embedding soil dictate the amount of energy leakage from the 199
wave modes guided along the pipe, and hence have a major role in the guided wave 200
inspection range obtained in practice. Wave velocities and attenuation depend on the wave 201
parameters, e.g. frequency, wavelength and mode of propagation, and on the material 202
acoustic parameters. The acoustic parameters are linked to a range of geophysical properties, 203
e.g. grain density and diameter, porosity, degree of saturation, skeleton stiffness and bulk and 204
shear moduli. Materials with internal spatial scales such as soils, i.e. consisting of grains, 205
clusters and layers, are inherently dispersive [53]. Hence, bulk velocities in porous and 206
particulate media are generally reported in the literature for low frequency applications within 207
the framework of exploration seismology, earthquake engineering and structural stability. 208
Measurement techniques and measured values of velocity and attenuation in shallow near 209
surface unconsolidated soils reported in the literature were recently reviewed and summarised 210
in a preceding paper [23 and references therein]. Leinov et al. [23] extracted the shear 211
velocity of sand for a range of conditions from full-scale GWT experiments on a buried bare 212
pipe. 213
The model used in this study treats the embedding sand as an elastic solid. The Biot theory 214
[54-56] predicts the propagation of two compressional (dilatation) waves and a shear 215
(rotational) wave in a fluid-saturated porous medium. However, in the infinite frame-rigidity 216
limit of the Biot theory, the pore fluid viscosity is negligible and the two compressional 217
waves become decoupled. The rigid-frame limit was found to be appropriate to the study of 218
acoustic wave propagation within air-filled natural rock samples [e.g. 57] as well as granular 219
media such as sand [e.g. 58]. At the low strains common to guided wave propagation, 220
frictional loss, arising from inter-particle displacement and leading to slippage in the sand, is 221
not expected to be significant. 222

11
223
3. Guided wave tests setup 224
A full-scale laboratory apparatus was used to allow well-controlled experimental conditions 225
for the measurement of ultrasound attenuation in the coated-pipe buried in sand. A detailed 226
description of the full-scale apparatus was provided in a preceding paper [23]. Here we 227
provide a short description of the significant features and the experimental set-up, followed 228
by a description of the measurement technique. 229
3.1 Full-scale experiments 230
The buried coated-pipe experimental apparatus consisted of a 6-meter long, 8 inch carbon 231
steel pipe (schedule-40, 9mm wall thickness), FBE-coated (Resicoat R4 AkzoNoble, 0.25mm 232
nominal thickness) embedded for 3-meters of its length in a rectangular container of 0.76m x 233
0.76m inner cross-section (Figure 3a-b). The container was constructed from 40mm-thick 234
plywood plates, reinforced with a system of inter-connected rectangular section steel beams 235
to support the load from the sand and was fitted with a tank-liner to contain the embedding 236
sand. The pipe was fitted to the container at the entry and exit positions through circular 237
openings in the corresponding wooden faces of the container, forming a 20mm gap around 238
the pipe from the opening edge, in order to allow the pipe to settle in the sand without making 239
contact with the openings in the wooden faces. A rectangular inflatable air-bladder (3m x 240
0.76m x 0.1m, Polyurethane fabric) was fitted between the sand surface and the container 241
covering plate in order to allow the application of different overburden pressure loads on the 242
sand corresponding to different depth conditions. The air-bladder was connected in-line with 243
an air compressor, needle valve regulator and air pressure gauge. Figure 3c presents a 244
photograph of the operating apparatus. Well-graded, dry clean sand (sand grain density of 245
2600 kgm-3) was used as the embedding medium. This type of sand is used as a structural 246
12
backfill material and complies with standardised practices for pipeline installation. The 247
particle size distribution of the sand was determined using a laboratory sieving test (See 248
[23]). 249
Ultrasonic guided waves were generated in the pipe using commercial transducer rings 250
(Guided Ultrasonics Ltd) and signals were transmitted and collected using the Wavemaker 251
G4 instrument (Guided Ultrasonics Ltd). The transducer ring consists of dry-coupled 252
piezoelectric transducer elements which are clamped to the pipe surface using an air-253
inflatable sleeve. Two independent transducer rings were attached in turn along the exposed 254
length of the pipe for the torsional (T(0,1)) and longitudinal (L(0,2)) modes. 255
Guided wave attenuation was measured in two different sets of sand conditions: loose and 256
compacted. The loose sand case was formed by pouring dry loose sand from bulk bags to 257
backfill the container up to a height of 0.76m (Figure 3b) and the compacted sand case was 258
obtained by application of overburden pressure up to 1bar on the sand, an equivalent to ca. 259
6m depth of dry sand with uniform density. The sand bulk densities associated with the cases 260
are presented in Table 1. The bulk densities were determined from measurement of the net 261
weight of sand used to fill the container and the volume it occupied in the container. A 262
detailed description of the set-up procedures of the loose and compacted sand conditions is 263
provided in [23], where similar conditions were undertaken to investigate buried bare pipe. 264
3.2 Measurement technique 265
The L(0,2) and T(0,1) guided wave modes were excited and recorded in separate independent 266
tests for each experimental condition using two different transducer rings. The transducer 267
rings were attached near the entrance to the container. Received raw signals obtained from 268
the transducer rings were applied with a Hilbert envelope in order to determine the 269
amplitudes of the reflections peaks; signals were converted to the frequency domain via 270
13
Fourier transform. Two different central frequencies, 16.5 kHz and 23.5 kHz, were used for 271
each mode to allow overlap of the frequencies in the range covered. 272
The attenuation characteristic was obtained from the ratio of the signal amplitudes measured 273
from the pipe end reflections: 274
𝛼 = −20𝑙𝑙𝑙10(𝐴1 𝐴0⁄ )2𝐿
(10) 275
where L is the length of the pipe embedded in sand, A0 is the reference reflection amplitude 276
and A1 is the measurement amplitude. The reference reflection signal is received echo from 277
the free end and the measurement signal is received echo from the pipe-end beyond the 278
buried section. The attenuation of both modes in air was found to be less than 0.1dBm-1 in 279
reference tests; hence the attenuation of the modes in the pipe section exposed to air is 280
considered to be negligible. 281
To interpret the data, a series of dispersion curves were produced for a coated steel pipe 282
embedded in an infinite layer of sand with a variety of possible values of acoustic parameters 283
using the Disperse modelling software [27-28]. The acoustic properties of the sand were 284
extracted from the best fit to the experiments. The use of two different modes for each 285
experimental condition provides a verification of the model predictions with a high degree of 286
confidence. 287
288
4. Results 289
4.1 Buried FBE-coated pipe 290
Results obtained from typical guided wave tests are shown in Figures 4a,b for the FBE-291
coated pipe buried in loose sand and in compacted sand (overburden pressure of 1 bar 292
14
applied), respectively. The mode of excitation was T(0,1) at a central frequency of 23.5 kHz. 293
The results are displayed as the amplitude of the Hilbert envelope of the recorded signal on a 294
logarithmic scale as a function of distance from the transducer ring position. Reflections from 295
both pipe-end locations are clearly evident, with the reflection from the free end of the pipe to 296
the left of the transducer ring location and the reflection from the pipe end past the embedded 297
section to the right of the transducer ring location. The attenuation is inferred from the 298
amplitudes of these reflections using Equation 10. Two reverberations from the two pipe ends 299
are also evident in the loose sand case (Figure 4a). The increase in the attenuation of the 300
signal is noticeable in the compacted sand case (Figure 4b), where the reflection from the 301
embedded pipe-end is much smaller than its counterpart in the loose sand case and the 302
reverberation from the pipe end past the embedded part cannot be distinguished from the 303
noise floor. 304
Figure 5 presents the attenuation measurements of the T(0,1) and L(0,2) modes as a function 305
of frequency in the FBE-coated pipe for the loose sand (no applied pressure) and compacted 306
sand (1 bar applied pressure) cases. The measured attenuation in a particular sand condition 307
at a particular frequency is the average of the values obtained from at least two different tests 308
performed at these conditions and from different excitation central frequencies; error bars 309
represent the variation between measurements at a certain frequency. The Disperse software 310
was used to predict the attenuation as a function of frequency for a variety of sand acoustic 311
velocities and the estimated density values (Table 1). Figure 5 presents the simulation best 312
fits to the measured attenuation in each mode for both sand cases. Also presented are 313
measurements and simulation fits reported in Leinov et al. [23] for bare steel pipe embedded 314
in similar conditions. The best fit curve is determined from the simultaneous fit to both the 315
torsional and longitudinal modes measured attenuation. Initially, the lower and higher 316
attenuation values of the torsional mode (Figure 5a and 5c) are fitted to find the range of 317
15
shear velocity values, then a single value of shear velocity within this range is found to match 318
the longitudinal mode measured attenuation (Figure 5b and 5d). The extracted best fit values 319
of the shear velocity are 93 ms-1 and 131 ms-1 for the loose and compacted sand cases, 320
respectively. The measured attenuation and the resulting shear velocity values are similar to 321
values obtained for bare pipe tests under similar loose and compacted sand conditions [23], 322
albeit the values in the FBE-coated pipe cases are slightly higher. However, the sand density 323
values for the FBE-coated pipe cases (Table 1) were higher than those reported in [23] for 324
both loose and compacted sand. The difference in sand density, resulting from variation in 325
sand packing between experiments, was 2 percent in the loose sand case and less than 1 326
percent in the compacted sand case. Hence, the FBE-coating does not cause a large increase 327
in the guided wave attenuation in buried pipes for the range of frequencies used. 328
The compaction of the sand significantly increases the attenuation of both modes. The 329
attenuation of the torsional mode is larger than the attenuation of the longitudinal mode for 330
both loose and compacted sand cases. These trends are similar to those found in [23]. 331
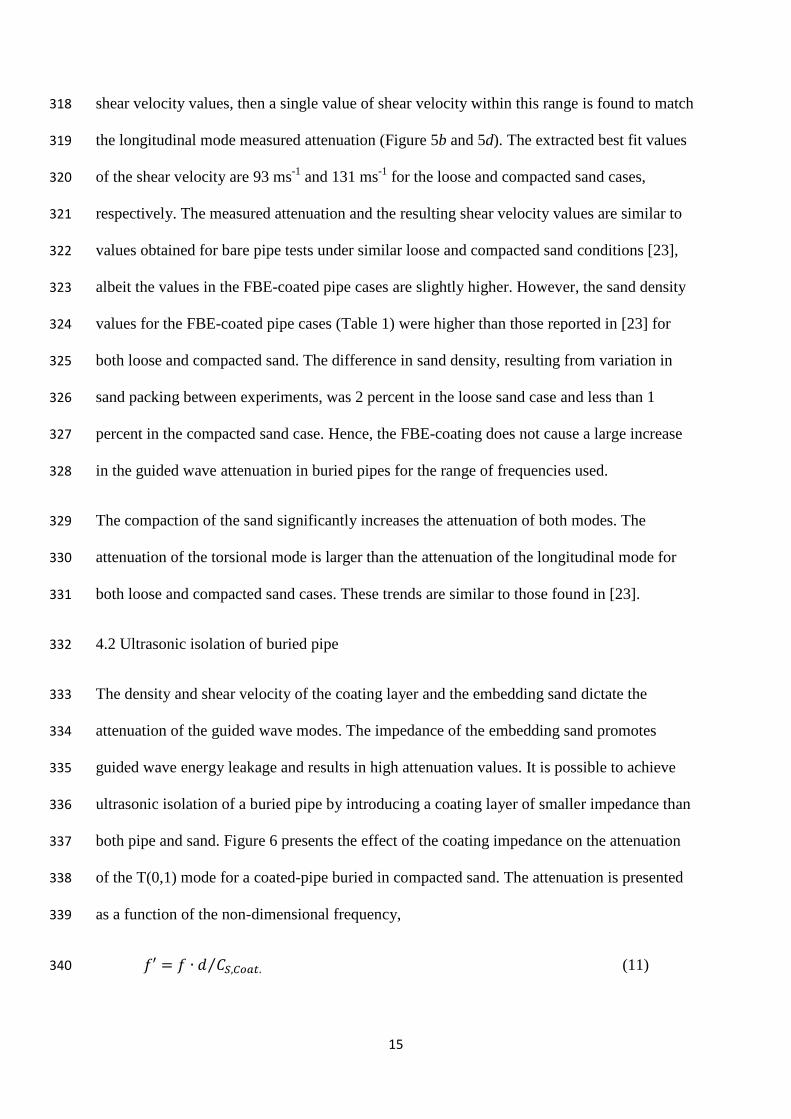
4.2 Ultrasonic isolation of buried pipe 332
The density and shear velocity of the coating layer and the embedding sand dictate the 333
attenuation of the guided wave modes. The impedance of the embedding sand promotes 334
guided wave energy leakage and results in high attenuation values. It is possible to achieve 335
ultrasonic isolation of a buried pipe by introducing a coating layer of smaller impedance than 336
both pipe and sand. Figure 6 presents the effect of the coating impedance on the attenuation 337
of the T(0,1) mode for a coated-pipe buried in compacted sand. The attenuation is presented 338
as a function of the non-dimensional frequency, 339
𝑓′ = 𝑓 ∙ 𝑑 𝐶𝑆,𝐶𝑙𝐶𝜕.⁄ (11) 340
16
where 𝑓 is the frequency, 𝑑 is the coating-layer thickness and 𝐶𝑆,𝐶𝑙𝐶𝜕. is the shear velocity in 341
the coating layer. When the impedance of the coating layer equals the impedance of the sand, 342
the attenuation of the torsional mode is non-dispersive, yielding a constant attenuation value. 343
As the impedance of the coating layer decreases from that of the sand impedance, the 344
torsional mode attenuation decreases with a minimum when the coating layer thickness is a 345
quarter wavelength; as the impedance of the coating layer increases from that of the sand, the 346
attenuation increases with a maximum at the same layer thickness. The minimum and 347
maximum values are a function of the shear velocity of the coating layer; the absolute 348
frequency at which these values are obtained is determined by the actual coating layer 349
thickness since it always occurs at a non-dimensional frequency of 0.25. 350
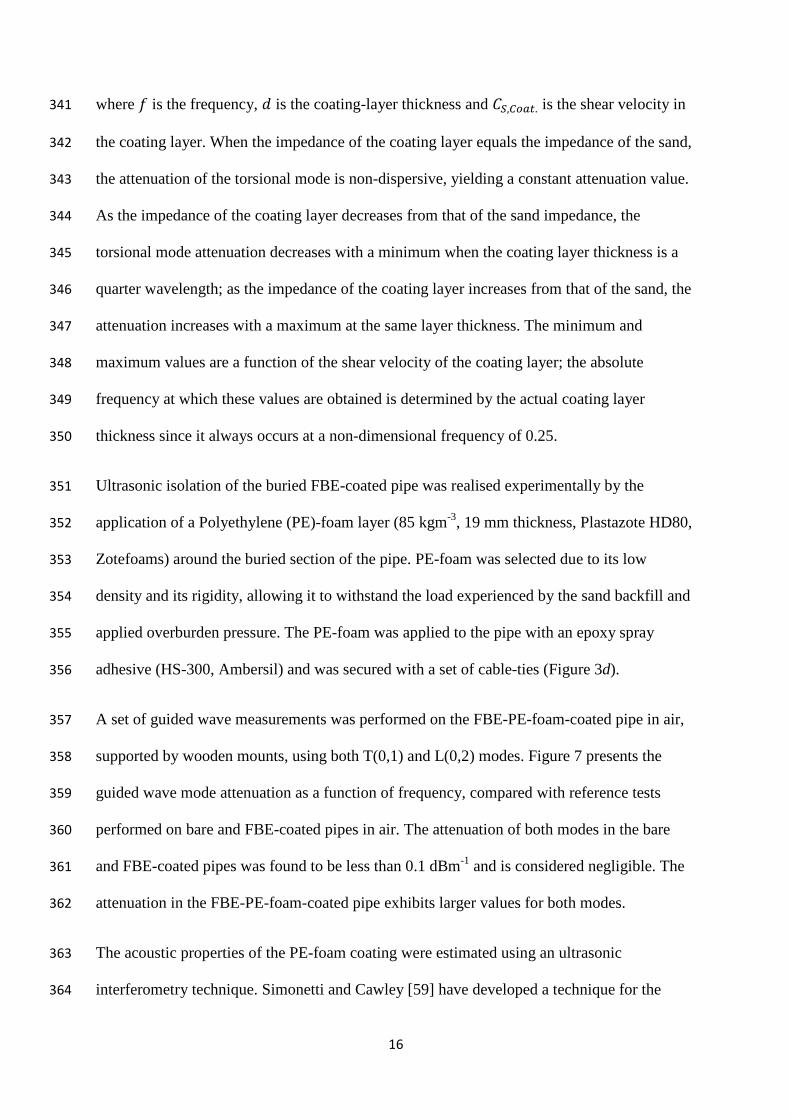
Ultrasonic isolation of the buried FBE-coated pipe was realised experimentally by the 351
application of a Polyethylene (PE)-foam layer (85 kgm-3, 19 mm thickness, Plastazote HD80, 352
Zotefoams) around the buried section of the pipe. PE-foam was selected due to its low 353
density and its rigidity, allowing it to withstand the load experienced by the sand backfill and 354
applied overburden pressure. The PE-foam was applied to the pipe with an epoxy spray 355
adhesive (HS-300, Ambersil) and was secured with a set of cable-ties (Figure 3d). 356
A set of guided wave measurements was performed on the FBE-PE-foam-coated pipe in air, 357
supported by wooden mounts, using both T(0,1) and L(0,2) modes. Figure 7 presents the 358
guided wave mode attenuation as a function of frequency, compared with reference tests 359
performed on bare and FBE-coated pipes in air. The attenuation of both modes in the bare 360
and FBE-coated pipes was found to be less than 0.1 dBm-1 and is considered negligible. The 361
attenuation in the FBE-PE-foam-coated pipe exhibits larger values for both modes. 362
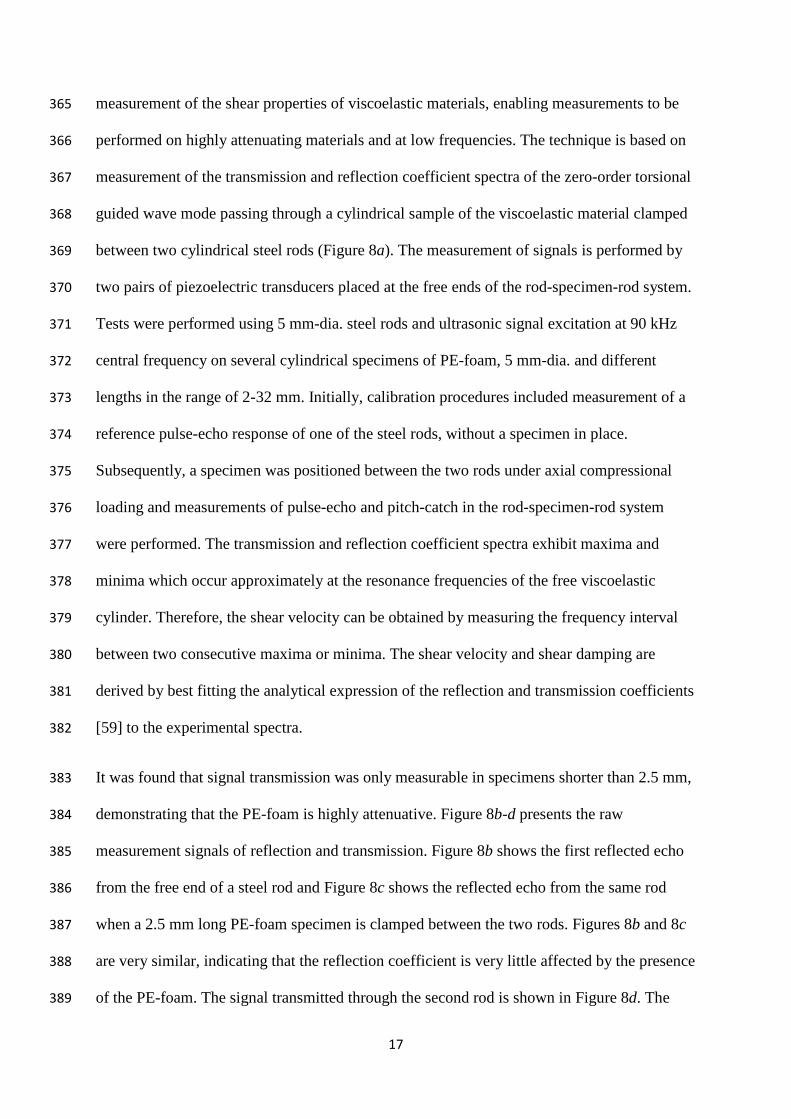
The acoustic properties of the PE-foam coating were estimated using an ultrasonic 363
interferometry technique. Simonetti and Cawley [59] have developed a technique for the 364
17
measurement of the shear properties of viscoelastic materials, enabling measurements to be 365
performed on highly attenuating materials and at low frequencies. The technique is based on 366
measurement of the transmission and reflection coefficient spectra of the zero-order torsional 367
guided wave mode passing through a cylindrical sample of the viscoelastic material clamped 368
between two cylindrical steel rods (Figure 8a). The measurement of signals is performed by 369
two pairs of piezoelectric transducers placed at the free ends of the rod-specimen-rod system. 370
Tests were performed using 5 mm-dia. steel rods and ultrasonic signal excitation at 90 kHz 371
central frequency on several cylindrical specimens of PE-foam, 5 mm-dia. and different 372
lengths in the range of 2-32 mm. Initially, calibration procedures included measurement of a 373
reference pulse-echo response of one of the steel rods, without a specimen in place. 374
Subsequently, a specimen was positioned between the two rods under axial compressional 375
loading and measurements of pulse-echo and pitch-catch in the rod-specimen-rod system 376
were performed. The transmission and reflection coefficient spectra exhibit maxima and 377
minima which occur approximately at the resonance frequencies of the free viscoelastic 378
cylinder. Therefore, the shear velocity can be obtained by measuring the frequency interval 379
between two consecutive maxima or minima. The shear velocity and shear damping are 380
derived by best fitting the analytical expression of the reflection and transmission coefficients 381
[59] to the experimental spectra. 382
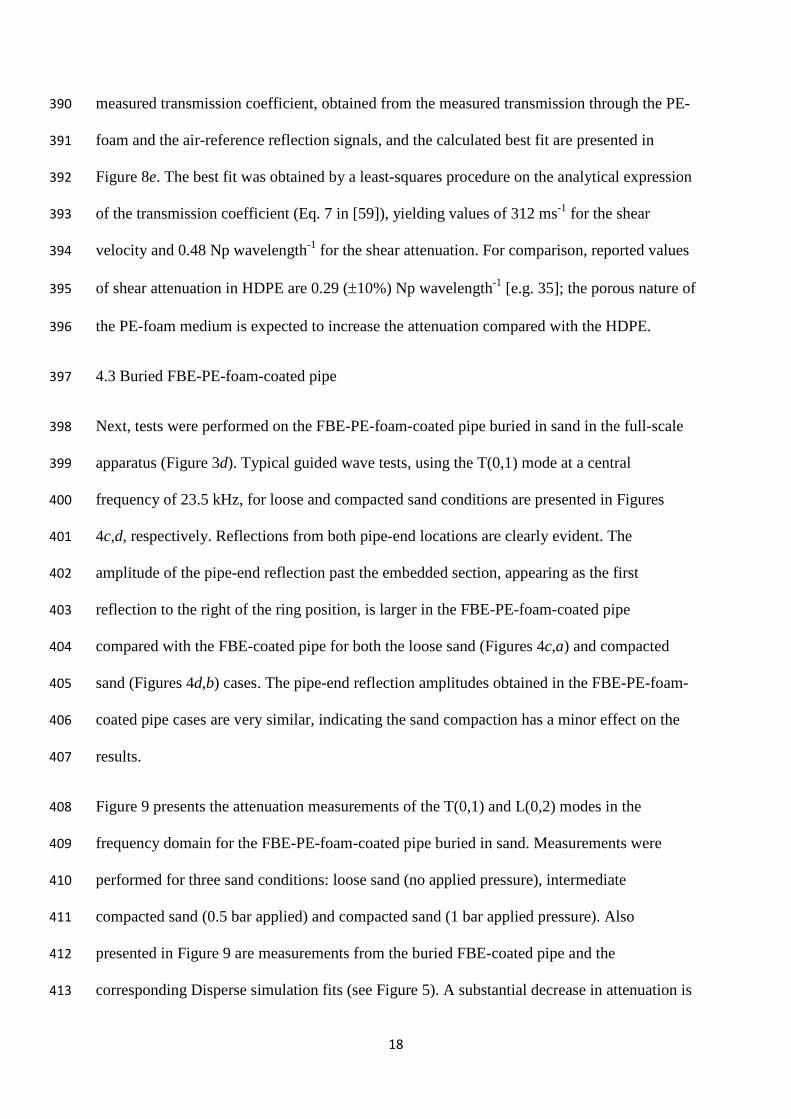
It was found that signal transmission was only measurable in specimens shorter than 2.5 mm, 383
demonstrating that the PE-foam is highly attenuative. Figure 8b-d presents the raw 384
measurement signals of reflection and transmission. Figure 8b shows the first reflected echo 385
from the free end of a steel rod and Figure 8c shows the reflected echo from the same rod 386
when a 2.5 mm long PE-foam specimen is clamped between the two rods. Figures 8b and 8c 387
are very similar, indicating that the reflection coefficient is very little affected by the presence 388
of the PE-foam. The signal transmitted through the second rod is shown in Figure 8d. The 389
18
measured transmission coefficient, obtained from the measured transmission through the PE-390
foam and the air-reference reflection signals, and the calculated best fit are presented in 391
Figure 8e. The best fit was obtained by a least-squares procedure on the analytical expression 392
of the transmission coefficient (Eq. 7 in [59]), yielding values of 312 ms-1 for the shear 393
velocity and 0.48 Np wavelength-1 for the shear attenuation. For comparison, reported values 394
of shear attenuation in HDPE are 0.29 (±10%) Np wavelength-1 [e.g. 35]; the porous nature of 395
the PE-foam medium is expected to increase the attenuation compared with the HDPE. 396
4.3 Buried FBE-PE-foam-coated pipe 397
Next, tests were performed on the FBE-PE-foam-coated pipe buried in sand in the full-scale 398
apparatus (Figure 3d). Typical guided wave tests, using the T(0,1) mode at a central 399
frequency of 23.5 kHz, for loose and compacted sand conditions are presented in Figures 400
4c,d, respectively. Reflections from both pipe-end locations are clearly evident. The 401
amplitude of the pipe-end reflection past the embedded section, appearing as the first 402
reflection to the right of the ring position, is larger in the FBE-PE-foam-coated pipe 403
compared with the FBE-coated pipe for both the loose sand (Figures 4c,a) and compacted 404
sand (Figures 4d,b) cases. The pipe-end reflection amplitudes obtained in the FBE-PE-foam-405
coated pipe cases are very similar, indicating the sand compaction has a minor effect on the 406
results. 407
Figure 9 presents the attenuation measurements of the T(0,1) and L(0,2) modes in the 408
frequency domain for the FBE-PE-foam-coated pipe buried in sand. Measurements were 409
performed for three sand conditions: loose sand (no applied pressure), intermediate 410
compacted sand (0.5 bar applied) and compacted sand (1 bar applied pressure). Also 411
presented in Figure 9 are measurements from the buried FBE-coated pipe and the 412
corresponding Disperse simulation fits (see Figure 5). A substantial decrease in attenuation is 413
19
clearly evident for both guided wave modes in the FBE-PE-foam-coated pipe. The 414
attenuation is found to be smaller than 1 dBm-1 for the T(0,1)-mode and smaller than 0.5 415
dBm-1 for the L(0,2)-mode. The attenuation measured in the compacted sand case was only 416
slightly larger than the loose sand, up to 0.3 dBm-1 for the T(0,1)-mode and up to 0.1 dBm-1 417
for the L(0,2)-mode. The compacted sand conditions were kept for over three months for 418
monitoring purposes, with periodic measurements performed. The attenuation values for both 419
modes remained within 0.1 dBm-1 of the initially measured values. The estimated values of 420
sand density for the loose and compacted cases for this pipe configuration were less than 1 421
percent different compared to those in the FBE-coated pipe configuration (Table 1). 422
The guided wave propagation in a buried FBE-PE-foam-coated pipe system was simulated 423
with the Disperse software using the material properties given in Table 1. Figure 10 presents 424
the effect of internal damping of the PE-foam layer on the attenuation of the modes in the 425
frequency domain. The peaks occur at three frequency values within the range of 10-40 kHz, 426
16.6, 24.8 and 33.2 kHz, which correspond to the through-thickness resonance frequencies of 427
the PE-foam layer and depend on the ratio of the shear velocity to thickness of the layer 428
(Equation 9). The troughs occur at frequency values equal to midway between two 429
consecutive through-thickness resonance frequencies of the layer. Strong frequency 430
dependence is evident. As the internal damping in the PE-foam layer increases, the difference 431
between the peaks and the troughs decreases. This behaviour is expected since material 432
absorption depresses the through-thickness resonance phenomenon [37]. 433
The amplitude spectra of the two end reflections for the torsional mode in the FBE-PE-foam-434
coated pipe buried in compacted sand case were computed via Fourier analysis and the 435
attenuation spectrum was computed from Equation (10); this is shown in Figure 11 along 436
with the corresponding simulation from Disperse. The measured curve was obtained from a 437
superposition of measurements performed at the different central frequencies. These 438
20
correspond to higher spectral resolution of the measurements presented in Fig. 9a (notice the 439
different ordinate scale). The simulation curve was calculated using the measured acoustic 440
properties of the PE-foam. The measured and predicted curves are qualitatively very similar 441
with peaks occurring at similar frequencies. The attenuation values at the peaks are somewhat 442
different and this is probably due to inaccuracies in the measurement of the PE-foam 443
attenuation which was difficult in such a low impedance, high attenuation material. The 444
Disperse prediction for a pipe surrounded by an infinite layer of PE-foam is also shown in 445
Figure 11. Since the infinite layer has no through-thickness resonances, this is a constant 446
value and the experimental curve is tending towards this value at higher frequencies as the 447
resonances are heavily attenuated. This indicates that the pipe is increasingly decoupled from 448
the sand; effectively, minimisation of the influence of the sand on the attenuation behaviour 449
was accomplished. 450
451
5. Conclusions 452
The attenuation of the T(0,1) and L(0,2) guided wave modes has been studied in a FBE-453
coated pipe buried in loose and compacted sand conditions over the frequency range 454
commonly used in GWT of 10-35 kHz. The attenuation of the guided wave modes in buried 455
pipes is largely due to energy leakage into the embedding sand. The thin FBE pipe coating 456
was found to slightly increase the attenuation of the modes compared to buried bare pipe. The 457
large values of attenuation measured for both guided wave modes dictate a significant 458
reduction of GWT test ranges for buried pipes compared with above-ground pipes. The 459
feasibility of ultrasonic isolation of the buried FBE-coated pipe using an additional coating 460
layer has been investigated. Ultrasonic isolation has been demonstrated by the application of 461
a PE-foam coating layer between the FBE-coated pipe and the sand. A PE-foam coating layer 462
21
was selected since its impedance is smaller than that of both pipe and sand, and due to its 463
ability to withstand the load from the sand and the applied overburden pressure. The 464
measured guided wave attenuation values in the buried PE-foam-FBE-coated pipe were 465
found to be substantially smaller than those measured in the buried FBE-coated pipe for both 466
loose and compacted sand conditions. The measured attenuation was found to be 0.5-1.2 467
dBm-1 for the T(0,1) mode and 0.3-0.5 dBm-1 for the L(0,2) mode in the pipe buried with the 468
PE-foam coating, compared to 2.8-4.7 dBm-1 for the T(0,1) mode and 1.7-2.8 dBm-1 for the 469
L(0,2) mode in the pipe buried without the PE-foam coating. 470
The shear velocity and attenuation in the PE-foam were measured independently using an 471
ultrasonic interferometry technique. The measured values were used to model the attenuation 472
behaviour of the modes in the buried FBE-PE-foam-coated pipe, good agreement being found 473
between the experimental measurements and model predictions. The torsional mode 474
attenuation showed periodic peaks in the frequency domain which correspond to the through-475
thickness resonance frequencies of the PE-foam coating layer and depend on the ratio of the 476
shear velocity to thickness of the layer. The attenuation peak values depend on the 477
attenuation in the coating layer, and decrease with increasing coating layer attenuation. 478
The large reduction in guided wave attenuation of the ultrasonically isolated buried pipe due 479
to the low impedance coating yields a substantial increase of guided wave inspection range. 480
The guided wave attenuation measurements can be used to estimate the inspection pipe-481
length for a pipe buried in sand. Given minimum signal to coherent noise ratio of 40 dB 482
generated by a GWT instrument (see [12]), propagation distances for the torsional mode in a 483
buried pipe without ultrasonic isolation would be limited to ~10m, corresponding to a test 484
range in a pulse-echo configuration of ~5m; however, for an ultrasonically isolated pipe the 485
torsional mode pulse-echo test range would increase to ~15-30 m. 486

22
487
488
Acknowledgments 489
The authors gratefully acknowledge support from the UK Engineering and Physical Sciences 490
Research Council (EPSRC) in this work, under research grant EP/J01284X/1 and the UK 491
Research Centre in Nondestructive Evaluation (RCNDE). This work was carried out in 492
collaboration with BP Exploration Operating Company Ltd, EDF Energy, EDF R&D and 493
Shell Global Solutions International BV. 494
The authors would like to thank Dr. David Alleyne, Dr. Brian Pavlakovic and Dr. Thomas 495
Vogt at Guided Ultrasonics Ltd for the loan of equipment and advice. The authors would also 496
like to thank Mr. Leslie Clark and Mr. Bob Hewitt at the Structures Laboratory, Dept. of 497
Civil and Environmental Engineering, Imperial College, for the excellent technical support. 498
E.L. would like to thank Mr. Tim Karaiskos for his help with the ultrasonic interferometry 499
measurements. 500
23
References 501
[1] Gazis DC. 1958 Exact analysis of the plain-strain vibrations of thick-walled hollow 502
cylinders. J. Acoust. Soc. Am., vol. 30(8), 786-794. (doi:10.1121/1.1909761) 503
[2] Gazis DC. 1959 Three-dimensional investigation of the propagation of waves in 504
hollow circular cylinders. I. analytical foundation. J. Acoust. Soc. Am., vol. 31(5), 505
568-573. (doi:10.1121/1.1907753) 506
[3] Mirsky I. 1965 Wave propagation in transversely isotropic circular cylinders part I. 507
theory. J. Acoust. Soc. Am., vol. 37(6), 1016-1021. (doi:10.1121/1.1909508) 508
[4] Zemanek J. 1972 An experimental and theoretical investigation of elastic wave 509
propagation in a cylinder. J. Acoust. Soc. Am., vol. 51(1), 265-283. 510
(doi:10.1121/1.1912838) 511
[5] Auld BA. 1990 Acoustic fields and waves in solids, vol. I and II. 2nd edition. Florida: 512
Krieger. (ISBN 0-89874-782-1) 513
[6] Mohr W, Holler P. 1976 On inspection of thin-walled tubes for transverse and 514
longitudinal flaws by guided ultrasonic waves. IEEE Trans. Ultrasonics, Ferroelec., 515
Freq. Control, vol. 23(5), 369-374. (doi:10.1109/T-SU.1976.30893) 516
[7] Silk MG, Bainton KF. 1979 The propagation in metal tubing of ultrasonic wave 517
modes equivalent to Lamb waves. Ultrasonics, vol. 17(1), 11-19. (doi:10.1016/0041-518
624X(79)90006-4) 519
[8] Alleyne DN, Cawley P. 1992 The interaction of Lamb waves with defects. IEEE 520
Trans. Ultrasonics, Ferroelec., Freq. Control, vol. 39(3), 381-397. 521
(doi:10.1109/58.143172) 522
24
[9] Ditri JJ. 1994 Utilization of guided elastic waves for the characterization of 523
circumferential cracks in hollow cylinders. J. Acoust. Soc. Am., vol. 96, 3769-3775. 524
(doi:10.1121/1.410565) 525
[10] Lowe MJS, Alleyne DN, Cawley P. 1998 Defect detection in pipes using 526
guided waves. Ultrasonics, vol. 36, 147-154. (doi:10.1016/S0041-624X(97)00038-3) 527
[11] Rose JL. 2014 Ultrasonic guided waves in solid media. Cambridge: 528
Cambridge University Press. (ISBN 978-110-704-8959) 529
[12] Alleyne DN, Pavlakovic B, Lowe MJS, Cawley P. 2001 Rapid long-range 530
inspection of chemical plant pipework using guided waves. Insight, vol. 43(2), 93-531
101. (ISSN1354-2575) 532
[13] Mudge P. 2001 Field application of the Teletest long-range ultrasonic testing 533
technique. Insight, vol. 43, 74-77. (ISSN1354-2575) 534
[14] Sheard M, McNulty A. 2001 Field experience of using long-range ultrasonic 535
testing. Insight, vol. 43, 79-83. (ISSN1354-2575) 536
[15] Nunez Ledesma VM, Perez Baruch E, Demma A, Lowe MJS. 2009 Guided 537
wave testing of an immersed gas pipeline. Materials Evaluation, vol. 67(2), 102-115. 538
(ISSN0025-5327) 539
[16] Alleyne DN, Cawley P. 1996 The excitation of Lamb waves in pipes using 540
dry-coupled piezoelectric transducers. J. Nondestruct. Eval., vol. 15(1), 11-20. 541
(doi:10.1007/BF00733822) 542
[17] Alleyne DN, Lowe MJS, Cawley P. 1998 The reflection of guided waves from 543
circumferential notches in pipes. J. App. Mech., vol. 65(3), 635-641. 544
(doi:10.1115/1.2789105) 545
25
[18] Cawley P. 2003 Practical long range guided wave inspection – managing 546
complexity. In Rev. Prog. in Quant. Nondestruct. Eval. (ed. Thompson DO & 547
Chimenti DE), vol. 22, 22-37, AIP Conf. Proceedings vol. 657, New York: AIP. 548
(doi:10.1063/1.1570116) 549
[19] Demma A, Cawley P, Lowe MJS, Roosenbrand AG, Pavlakovic B. 2004 The 550
reflection of guided waves from notches in pipes: a guide to interpreting corrosion 551
measurements. NDT&E Intl., vol. 37, 167-180. (doi:10.1016/j.ndteint.2003.09.004) 552
[20] Alleyne DN, Vogt T, Cawley P. 2009 The choice of torsional or longitudinal 553
excitation in guided wave pipe inspection. Insight vol. 51(7), 373-377. 554
(doi:10.1784/insi.2009.51.7.373) 555
[21] Vinogradov S. 2009 Magnetostricive Transducer for Torsional Mode Guided 556
Wave in Pipes and Plates, Materials Evaluation, vol. 67(3), pp. 333–34. (ISSN0025-557
5327) 558
[22] Kwun H, Hanley JJ, Holt AE. 1995 Detection of corrosion in pipe using the 559
magnetostrictive sensor technique, Proc. SPIE 2459: Nondestructive Evaluation of 560
Aging Maritime Applications, vol. 140. (doi:10.1117/12.212549) 561
[23] Leinov E, Lowe MJS, Cawley P. 2015 Investigation of guided wave 562
propagation and attenuation in pipe buried in sand. J. Sound & Vib, vol. 347, 96-563
114.(doi:10.1016/j.jsv.2015.02.036) 564
[24] Brekhovskikh LM. 1980 Waves in layered media, 2nd Edition, New York: 565
Academic Press. (ISBN: 0-12-130560-0) 566
26
[25] Nayfeh AH. 1989 The propagation of horizontally polarized shear waves in 567
multilayered anisotropic media. J. Acoust. Soc. Am., vol. 86(5), 2007-2012. 568
(doi:10.1121/1.398580) 569
[26] Nayfeh AH, Nagy PB. 1996 General study of axisymmetric waves in layered 570
anisotropic fibres and their composites. J. Acoust. Soc. Am., vol. 99(2), 931-941. 571
(doi:10.1121/1.414621) 572
[27] Lowe MJS. 1995 Matrix techniques for modelling ultrasonic waves in multi-573
layered media. IEEE Trans. Ultrasonics, Ferroelec., Freq. Control, vol. 42(4), 525-574
542. (doi:10.1109/58.393096) 575
[28] Pavlakovic B, Lowe MJS, Alleyne D, Cawley P. 1997 Disperse: a general 576
purpose program for creating dispersion curves. In Rev. Prog. in Quant. Nondestruct. 577
Eval. (ed. Thompson DO & Chimenti DE), vol. 16A, 185–192, New York: Springer. 578
(doi:10.1007/978-1-4615-5947-4_24) 579
[29] Pavlakovic BN, Lowe MJS, Cawley P. 2001 High-frequency low-loss 580
ultrasonic modes in imbedded bars. J. Applied Mech., vol. 68, 67-75. 581
(doi:10.1115/1.1347995) 582
[30] Beard MD, Lowe MJS. 2003 Non-destructive testing of rock bolts using 583
guided ultrasonic waves. Int. J. Rock Mech. & Mining Sci., vol. 40, 527-536. 584
(doi:10.1016/S1365-1609(03)00027-3) 585
[31] Beard MD, Lowe MJS, Cawley P. 2003 Ultrasonic guided waves for 586
inspection of grouted tendons and bolts. J. Mat. Civil Eng., vol. 15(3), 212-218. 587
(doi:10.1061/(ASCE)0899-1561(2003)15:3(212)) 588
27
[32] Long R, Vogt T, Lowe MJS, Cawley P. 2003 Measurement of acoustic 589
properties of near-surface soils using an ultrasonic waveguide. Geophys., vol. 69(2), 590
460-465. (doi:10.1190/1.1707065) 591
[33] Vogt T, Lowe M, Cawley P. 2003 The scattering of guided waves in partly 592
embedded cylindrical structures. J. Acoust. Soc. Am., vol. 113(3), 1258-1272. 593
(doi:10.1121/1.1553463) 594
[34] Vogt T, Lowe M, Cawley P. 2003 Cure monitoring using ultrasonic guided 595
waves in wires. J. Acoust. Soc. Am., vol. 114(3), 1303-1313. (doi:10.1121/1.1589751) 596
[35] Chan CW, Cawley P. 1998 Lamb wave in highly attenuative plastic plates. J. 597
Acoust. Soc. Am., vol. 104(2), 874-881. (doi:10.1121/1.423332) 598
[36] Simonetti F, Cawley P. 2003 A guided wave technique for the characterization 599
of highly attenuative viscoelastic materials. J. Acoust. Soc. Am., vol. 114(1), 158-165. 600
(doi:10.1121/1.1575749) 601
[37] Simonetti F, Cawley P. 2004 On the nature of shear horizontal wave 602
propagation in elastic plates coated with viscoelastic materials. Proc. R. Soc. Lond. A, 603
vol. 460, 2197-2221. (doi:10.1098/rspa.2004.1284) 604
[38] Simonetti F. 2004 Lamb waves propagation in elastic plates coated with 605
viscoelastic materials. J. Acoust. Soc. Am., vol. 115(5), 2041-2053. 606
(doi:10.1121/1.1695011) 607
[39] Bernard A, Lowe MJS, Deschamps M. 2001 Guided waves energy velocity in 608
absorbing and non-absorbing plates. J. Acoust. Soc. Am., vol. 110(1), 186-196. 609
(doi:10.1121/1.1375845) 610
28
[40] Barshinger JN, Rose JL. 2004 Guided wave propagation in elastic hollow 611
cylinder coated with a viscoelastic material. IEEE Trans. Ultrasonics, Ferroelec., 612
Freq. Control, vol. 51(11), 1547-1556. (doi:10.1109/TUFFC.2004.1367496) 613
[41] Ma J, Simonetti F, Lowe MJS. 2006 Scattering of the fundamental torsional 614
mode by an axisymmetric layer inside a pipe. J. Acoust. Soc. Am., vol. 120(4), 1871-615
1880. (doi: 10.1121/1.2336750) 616
[42] Luo W, Rose JL. 2007 Phased array focusing with guided waves in a 617
viscoelastic coated hollow cylinder. J. Acoust. Soc. Am., vol. 121(4), 1945-1955. 618
(doi:10.1121/1.2711145) 619
[43] Mu J, Rose JL. 2008 Guided wave propagation and mode differentiation in 620
hollow cylinders with viscoelastic coatings. J. Acoust. Soc. Am., vol. 124(2), 866-874. 621
(doi:10.1121/1. 2940586) 622
[44] Kirby R, Zlatev Z, Mudge P. 2012 On the scattering of torsional elastic waves 623
from axisymmetric defects in coated pipes. J. Sound & Vibr., vol. 331(17), 3989-624
4004. (doi:10.1016/j.jsv.2012.04.013) 625
[45] Kirby R, Zlatev Z, Mudge P. 2013 On the scattering of longitudinal elastic 626
waves from axisymmetric defects in coated pipes. J. Sound & Vibr., vol. 332(20), 627
5040-5058. (doi: 10.1016/j.jsv.2013.04.039) 628
[46] Hua J, Mu J, Rose JL. 2011 Guided wave propagation in single and double 629
layer hollow cylinders embedded in infinite media. J. Acoust. Soc. Am., vol. 129(2), 630
691-700. (doi: 10.1121/1.3531807) 631
29
[47] Hua J, Mu J, Rose JL. 2013 Guided wave propagation and focusing in multi-632
layer pipe with viscoelastic coating and infinite soil media. Mat. Eval., vol. 71(3), 633
369-377. (ISSN0025-5327) 634
[48] Castaings M, Lowe MJS. 2008 Finite element model for waves guided along 635
solid systems of arbitrary section coupled to infinite solid media. J. Acoust. Soc. Am., 636
vol. 123(2), 696-708. (doi:10.1121/1. 2821973) 637
[49] Kwun H, Kim SY, Choi MS, Walker SM. 2004 Torsional guided-wave 638
attenuation in coal-tar-enamel-coated, buried piping. NDT&E International, vol. 37, 639
663-665. (doi:10.1016/j.ndteint.2004.05.003) 640
[50] Leinov E, Cawley P, Lowe MJS. 2014 Investigation of guided waves 641
propagation in pipe buried in sand. In 40th Annual Rev. Prog. in Quant. Nondestruct. 642
Eval. (ed. Chimenti DE, LJ Bond & Thompson DO), vol. 33A, 271-278, AIP Conf. 643
Proceeding vol. 1581, New York: AIP. (doi:10.1063/1.4864830) 644
[51] Royer D, Dieulesaint, E. 2000 Elastic Waves in Solids I. Free and Guided 645
propagation. pp 321-331. Berlin: Springer-Verlag. (ISBN 3-540-65932-3) 646
[52] Nicholson NC, McDicken WN. 1991 Mode propagation of ultrasound in 647
hollow waveguides. Ultrasonics, vol. 29, 411-416 (doi:10.1016/0041-648
624X(91)90094-O) 649
[53] Santamarina JC, Klein KA, Fam MA. 2001 Soils and waves. Chichester: 650
Wiley. (ISBN 0-471-49058-X) 651
[54] Biot MA, 1956. Theory of propagation of elastic waves in a fluid-saturated 652
porous solid. I. Low-frequency range. J. Acoust. Soc. Am., vol. 28(2), 168-178. (doi: 653
10.1121/1.1908239) 654
30
[55] Biot MA, 1956. Theory of propagation of elastic waves in a fluid-saturated 655
porous solid. II. Higher frequency range. J. Acoust. Soc. Am., vol. 28(2), 179-191. 656
(doi: 10.1121/1.1908241) 657
[56] Stoll RD, Bryan GM, 1970. Wave attenuation in saturated sediments. J. 658
Acoust. Soc. Am., vol. 47(5), 1440-1447. (doi: 10.1121/1.1912054) 659
[57] Nagy P, Adler L, Bonner BP. 1990 Slow wave propagation in air-filled porous 660
materials and natural rocks. Appl. Phys. Lett., vol. 56, 2504-2506. 661
(doi:10.1063/1.102872) 662
[58] Attenborough K, 1987. On the acoustic slow wave in air-filled granular media. 663
J. Acoust. Soc. Am., vol. 81(1), 93-102. (doi: 10.1121/1.394938) 664
[59] Simonetti F, Cawley P. 2004 Ultrasonic interferometry for the measurement of 665
shear velocity and attenuation in viscoelastic solids. J. Acoust. Soc. Am., vol. 115(1), 666
157-164. (doi: 10.1121/1.1631944) 667
668
669
31
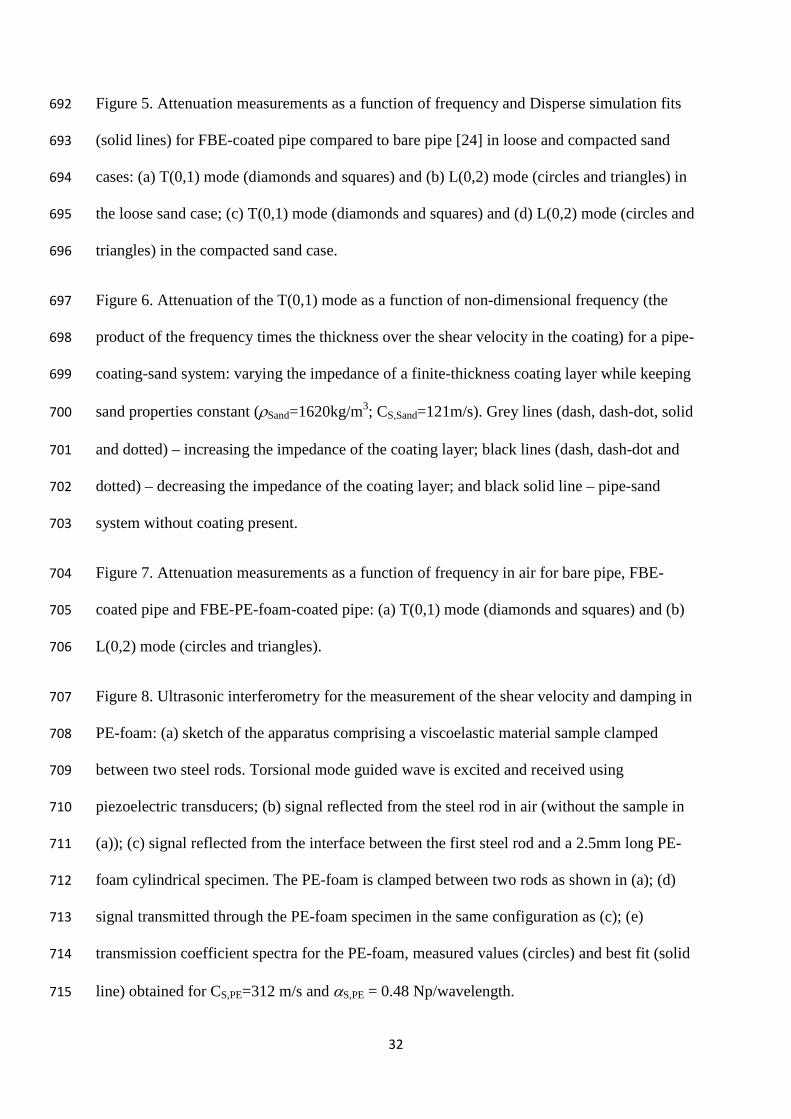
Figure captions 670
Figure 1. Schematic of a coated pipe buried in soil. An access pit is excavated in order to 671
perform guided wave inspection, where a guided wave transducer ring is attached to the pipe. 672
(Online version in colour) 673
Figure 2. Dispersion curves of the zero-order guided wave modes of interest in this study: (a) 674
group velocity, and (b) attenuation. Solid lines: 8” carbon steel pipe (Schedule 40, 9 mm 675
wall thickness, ρSteel=7932 kgm-3; CL,Steel=5960 ms-1; CS,Steel=3260 ms-1), coated with fusion-676
bonded epoxy (0.3 mm thickness, ρFBE=1170 kgm-3; CL,FBE=2610 ms-1; CS,FBE=1100 ms-1) 677
and embedded in sand (ρSand=1620 kgm-3; CL,Sand=500 ms-1; CS,Sand=120 ms-1); and dashed 678
lines: 8” carbon steel pipe without coating embedded in sand (properties of the pipe and sand 679
are identical to properties in coated case). (Online version in colour) 680
Figure 3. Full-scale experimental apparatus: (a) Side view drawing, (b) front view drawing, 681
(c) photograph of the operating apparatus with the FBE-coated pipe embedded in sand in the 682
container, the transducer ring attached to the pipe and the data acquisition system, (d) 683
photograph of the FBE-coated pipe with additional layer of PE-foam coating being embedded 684
in sand; sand is poured from a bulk bag. (Online version in colour) 685
Figure 4. Typical experimental results from the coated buried pipe tests: amplitudes (in 686
arbitrary units) as a function of distance from the transducer ring, located adjacent to the 687
container entrance, using T(0,1) mode at central frequency of 23.5 kHz. FBE-coated pipe in 688
(a) loose sand, and (b) compacted sand (1bar applied pressure); and FBE-coated pipe (same 689
as used in (a-b)) with PE-foam coating layer in (c) loose sand, and (d) compacted sand (1bar 690
applied pressure). Grey shaded area represents near field. 691
32
Figure 5. Attenuation measurements as a function of frequency and Disperse simulation fits 692
(solid lines) for FBE-coated pipe compared to bare pipe [24] in loose and compacted sand 693
cases: (a) T(0,1) mode (diamonds and squares) and (b) L(0,2) mode (circles and triangles) in 694
the loose sand case; (c) T(0,1) mode (diamonds and squares) and (d) L(0,2) mode (circles and 695
triangles) in the compacted sand case. 696
Figure 6. Attenuation of the T(0,1) mode as a function of non-dimensional frequency (the 697
product of the frequency times the thickness over the shear velocity in the coating) for a pipe-698
coating-sand system: varying the impedance of a finite-thickness coating layer while keeping 699
sand properties constant (ρSand=1620kg/m3; CS,Sand=121m/s). Grey lines (dash, dash-dot, solid 700
and dotted) – increasing the impedance of the coating layer; black lines (dash, dash-dot and 701
dotted) – decreasing the impedance of the coating layer; and black solid line – pipe-sand 702
system without coating present. 703
Figure 7. Attenuation measurements as a function of frequency in air for bare pipe, FBE-704
coated pipe and FBE-PE-foam-coated pipe: (a) T(0,1) mode (diamonds and squares) and (b) 705
L(0,2) mode (circles and triangles). 706
Figure 8. Ultrasonic interferometry for the measurement of the shear velocity and damping in 707
PE-foam: (a) sketch of the apparatus comprising a viscoelastic material sample clamped 708
between two steel rods. Torsional mode guided wave is excited and received using 709
piezoelectric transducers; (b) signal reflected from the steel rod in air (without the sample in 710
(a)); (c) signal reflected from the interface between the first steel rod and a 2.5mm long PE-711
foam cylindrical specimen. The PE-foam is clamped between two rods as shown in (a); (d) 712
signal transmitted through the PE-foam specimen in the same configuration as (c); (e) 713
transmission coefficient spectra for the PE-foam, measured values (circles) and best fit (solid 714
line) obtained for CS,PE=312 m/s and αS,PE = 0.48 Np/wavelength. 715
33
Figure 9. Attenuation measurements as a function of frequency for FBE-PE-foam-coated pipe 716
in loose and compacted sand: (a) T(0,1) mode (diamonds) and (b) L(0,2) mode (circles), 717
compared to attenuation measurements (squares and triangles) and Disperse simulation fits 718
(solid lines) for FBE-coated pipe. 719
Figure 10. Attenuation as a function of frequency for FBE-PE-foam-coated pipe buried in 720
compacted sand (ρSand= 1635kg/m3; CS,Sand= 131m/s). Simulated for various values of shear 721
damping (αS,PE-foam= 0-0.75 Neper/wavelength) in the PE-foam layer (19 mm thickness; ρPE-722
foam= 85kg/m3; CS,PE-foam= 312m/s): (a) T(0,1) mode and (b) L(0,2) mode. Vertical grey 723
dashed lines represent the through-thickness resonant frequencies. 724
Figure 11. Attenuation of the T(0,1) mode from the FBE-PE-foam-coated pipe buried in 725
compacted sand (ρSand=1635kg/m3; CS,Sand=131m/s), obtained by experimental measurement 726
(black solid line) and Disperse simulation (grey solid line). Also shown Disperse simulation 727
for a case of infinite layer of PE-foam (grey dashed line). Measured acoustic properties of 728
PE-foam (see Figure 8) were used in the simulations (ρPE-foam=85kg/m3; CS,PE-foam=312m/s; 729
αS,PE-foam=0.48 Np/λ). 730
Table 1. Material properties and thickness dimensions used in Disperse simulations. 731
Figure 1.
Schematic of a coated pipe buried in soil. An access pit is excavated in order to perform
guided wave inspection, where a guided wave transducer ring is attached to the pipe.
(Online version in colour)

Figure 2.
(a) (b)
Dispersion curves of the zero-order guided wave modes of interest in this study: (a) group
velocity, and (b) attenuation. Solid lines: 8” carbon steel pipe (Schedule 40, 9 mm wall
thickness, ρSteel=7932 kgm-3; CL,Steel=5960 ms-1; CS,Steel=3260 ms-1), coated with fusion-
bonded epoxy (0.3 mm thickness, ρFBE=1170 kgm-3; CL,FBE=2610 ms-1; CS,FBE=1100 ms-1)
and embedded in sand (ρSand=1620 kgm-3; CL,Sand=500 ms-1; CS,Sand=120 ms-1); and dashed
lines: 8” carbon steel pipe without coating embedded in sand (properties of the pipe and sand
are identical to properties in coated case).
(Online version in colour)
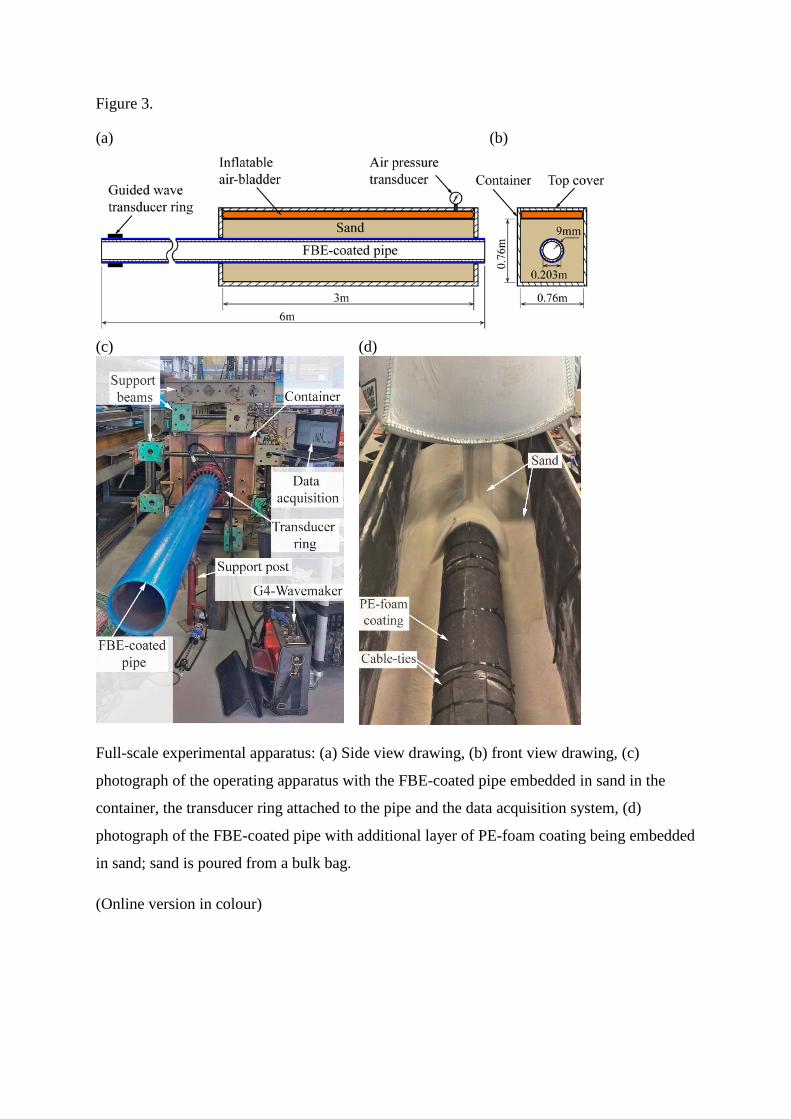
Figure 3.
(a) (b)
(c) (d)
Full-scale experimental apparatus: (a) Side view drawing, (b) front view drawing, (c)
photograph of the operating apparatus with the FBE-coated pipe embedded in sand in the
container, the transducer ring attached to the pipe and the data acquisition system, (d)
photograph of the FBE-coated pipe with additional layer of PE-foam coating being embedded
in sand; sand is poured from a bulk bag.
(Online version in colour)

Figure 4.
(a) (b)
(c) (d)
Typical experimental results from the coated buried pipe tests: amplitudes (in arbitrary units)
as a function of distance from the transducer ring, located adjacent to the container entrance,
using T(0,1) mode at central frequency of 23.5 kHz. FBE-coated pipe in (a) loose sand, and
(b) compacted sand (1bar applied pressure); and FBE-coated pipe (same as used in (a-b))
with PE-foam coating layer in (c) loose sand, and (d) compacted sand (1bar applied pressure).
Grey shaded area represents near field.
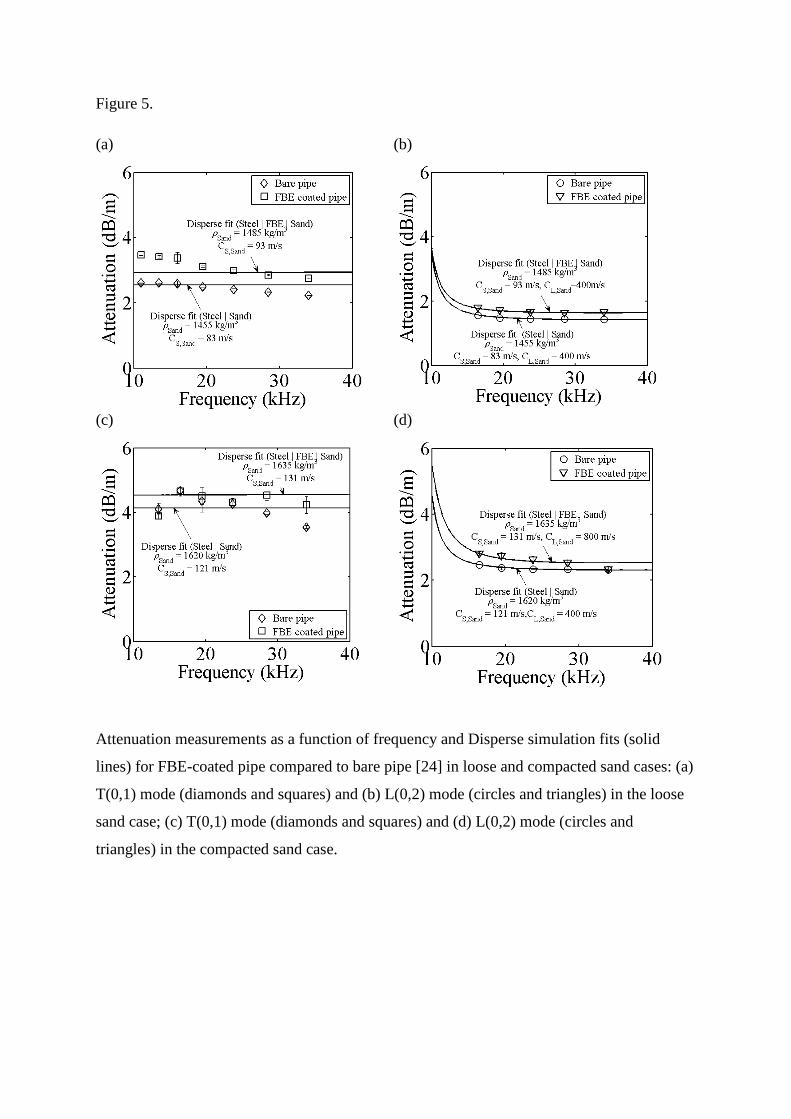
Figure 5.
(a) (b)
(c) (d)
Attenuation measurements as a function of frequency and Disperse simulation fits (solid
lines) for FBE-coated pipe compared to bare pipe [24] in loose and compacted sand cases: (a)
T(0,1) mode (diamonds and squares) and (b) L(0,2) mode (circles and triangles) in the loose
sand case; (c) T(0,1) mode (diamonds and squares) and (d) L(0,2) mode (circles and
triangles) in the compacted sand case.
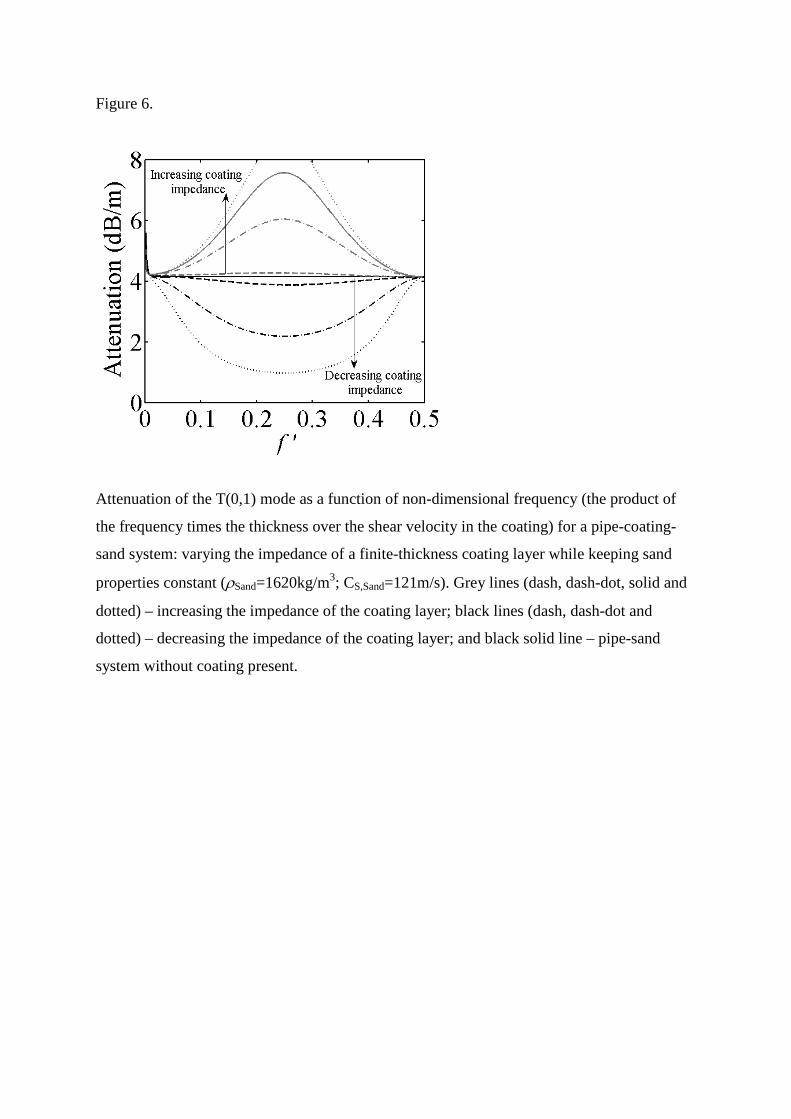
Figure 6.
Attenuation of the T(0,1) mode as a function of non-dimensional frequency (the product of
the frequency times the thickness over the shear velocity in the coating) for a pipe-coating-
sand system: varying the impedance of a finite-thickness coating layer while keeping sand
properties constant (ρSand=1620kg/m3; CS,Sand=121m/s). Grey lines (dash, dash-dot, solid and
dotted) – increasing the impedance of the coating layer; black lines (dash, dash-dot and
dotted) – decreasing the impedance of the coating layer; and black solid line – pipe-sand
system without coating present.
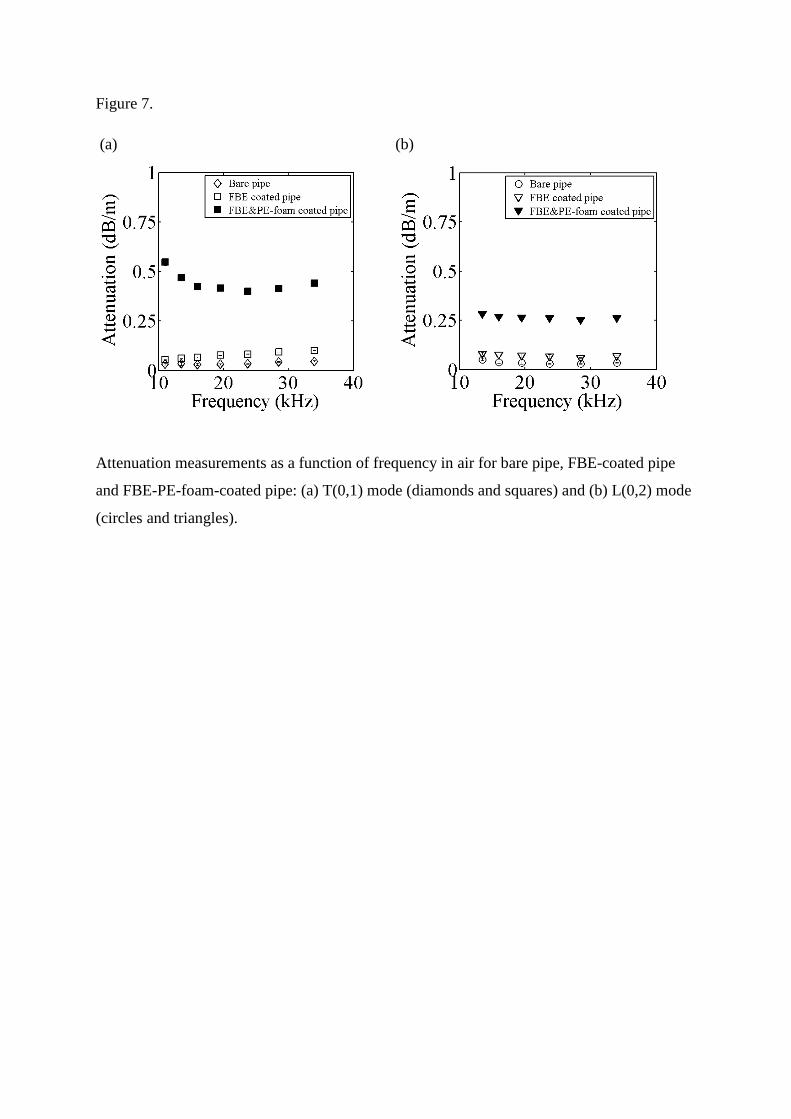
Figure 7.
(a) (b)
Attenuation measurements as a function of frequency in air for bare pipe, FBE-coated pipe
and FBE-PE-foam-coated pipe: (a) T(0,1) mode (diamonds and squares) and (b) L(0,2) mode
(circles and triangles).
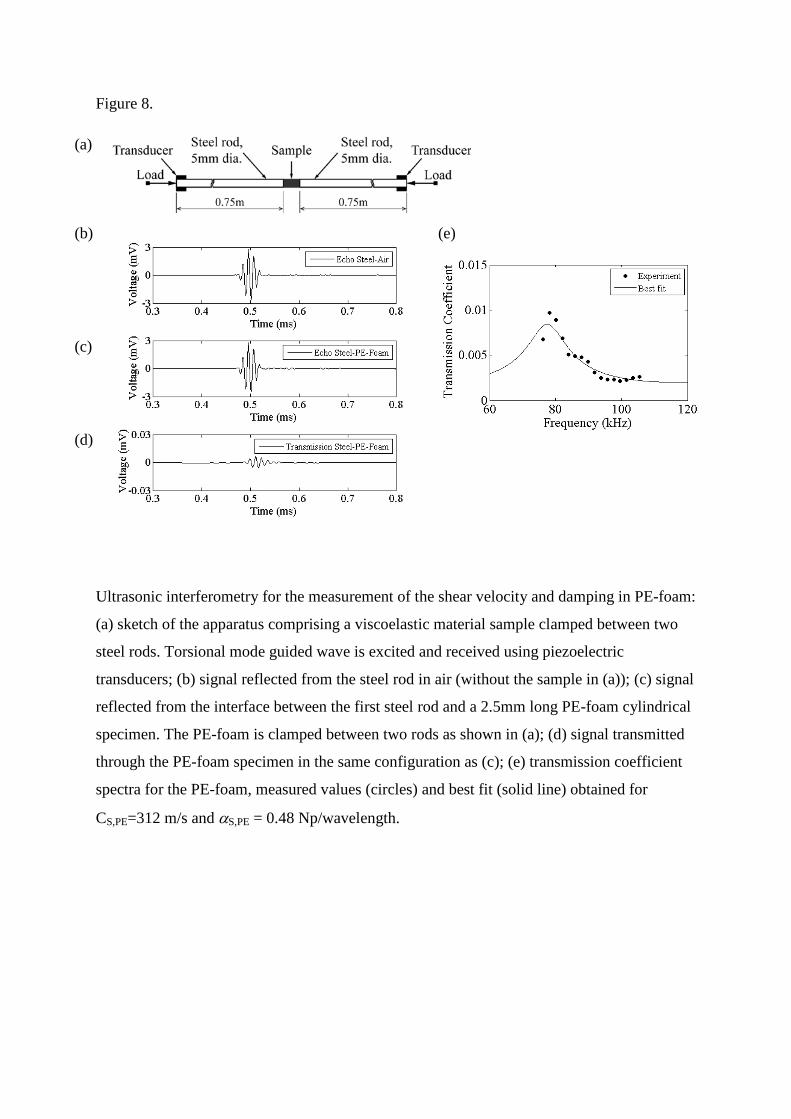
Figure 8.
(a)
(b)
(e)
(c)
(d)
Ultrasonic interferometry for the measurement of the shear velocity and damping in PE-foam:
(a) sketch of the apparatus comprising a viscoelastic material sample clamped between two
steel rods. Torsional mode guided wave is excited and received using piezoelectric
transducers; (b) signal reflected from the steel rod in air (without the sample in (a)); (c) signal
reflected from the interface between the first steel rod and a 2.5mm long PE-foam cylindrical
specimen. The PE-foam is clamped between two rods as shown in (a); (d) signal transmitted
through the PE-foam specimen in the same configuration as (c); (e) transmission coefficient
spectra for the PE-foam, measured values (circles) and best fit (solid line) obtained for
CS,PE=312 m/s and αS,PE = 0.48 Np/wavelength.
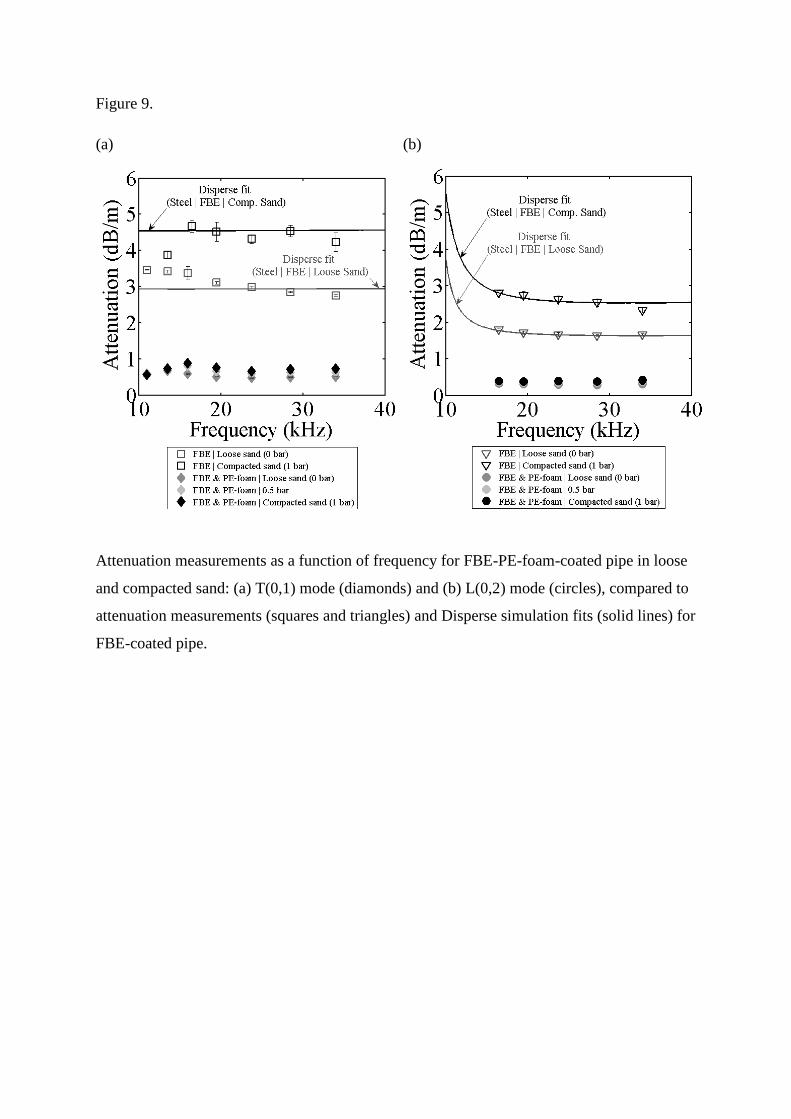
Figure 9.
(a) (b)
Attenuation measurements as a function of frequency for FBE-PE-foam-coated pipe in loose
and compacted sand: (a) T(0,1) mode (diamonds) and (b) L(0,2) mode (circles), compared to
attenuation measurements (squares and triangles) and Disperse simulation fits (solid lines) for
FBE-coated pipe.
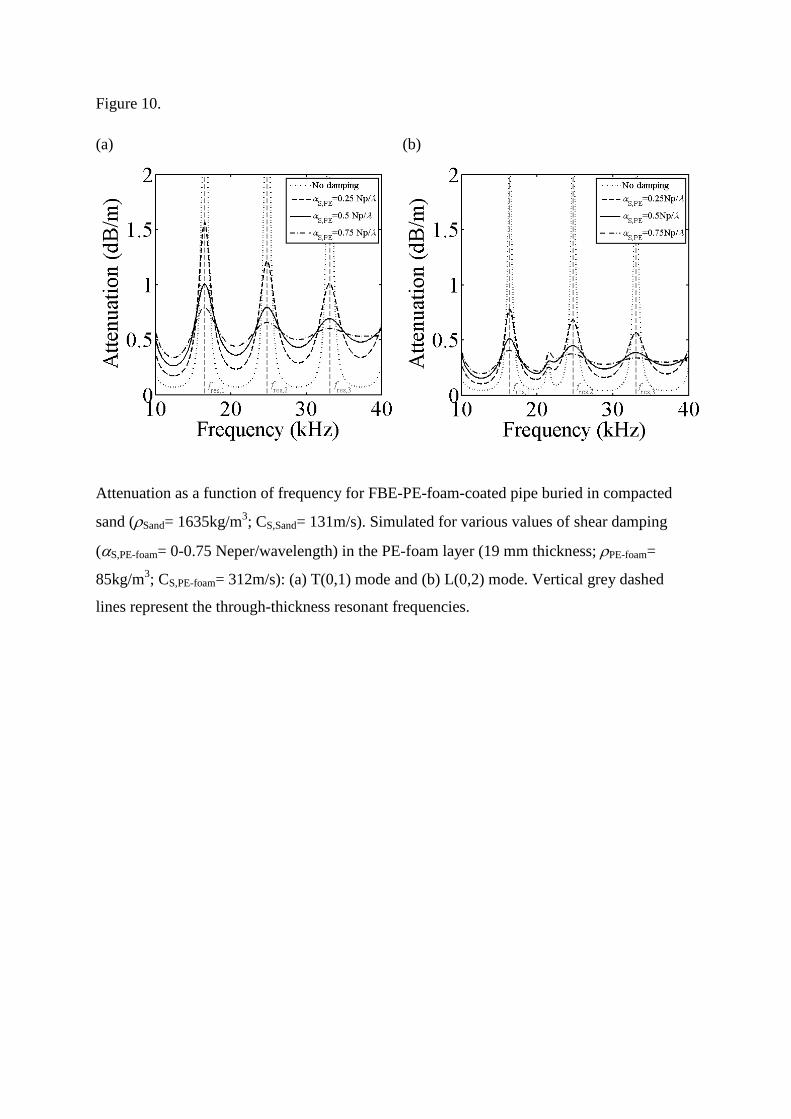
Figure 10.
(a) (b)
Attenuation as a function of frequency for FBE-PE-foam-coated pipe buried in compacted
sand (ρSand= 1635kg/m3; CS,Sand= 131m/s). Simulated for various values of shear damping
(αS,PE-foam= 0-0.75 Neper/wavelength) in the PE-foam layer (19 mm thickness; ρPE-foam=
85kg/m3; CS,PE-foam= 312m/s): (a) T(0,1) mode and (b) L(0,2) mode. Vertical grey dashed
lines represent the through-thickness resonant frequencies.
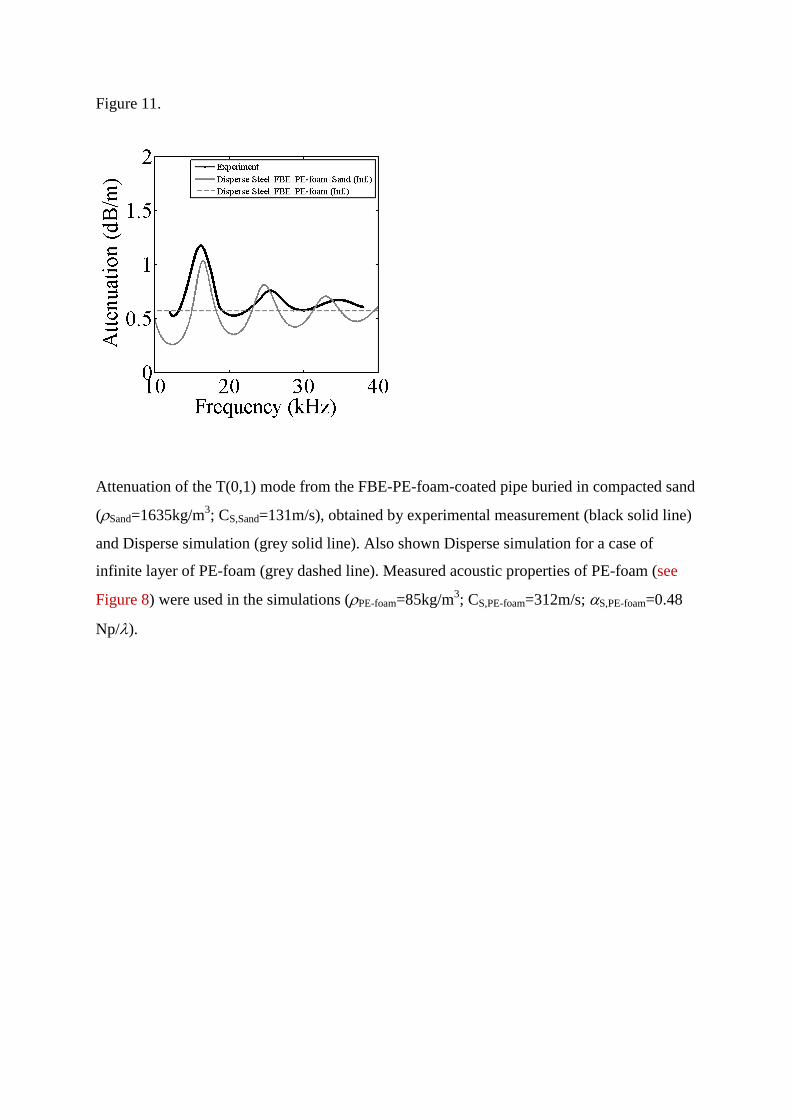
Figure 11.
Attenuation of the T(0,1) mode from the FBE-PE-foam-coated pipe buried in compacted sand
(ρSand=1635kg/m3; CS,Sand=131m/s), obtained by experimental measurement (black solid line)
and Disperse simulation (grey solid line). Also shown Disperse simulation for a case of
infinite layer of PE-foam (grey dashed line). Measured acoustic properties of PE-foam (see
Figure 8) were used in the simulations (ρPE-foam=85kg/m3; CS,PE-foam=312m/s; αS,PE-foam=0.48
Np/λ).

Table 1. Material properties and thickness dimensions used in Disperse simulations.
Material Thickness mm
Density kgm-3
CS ms-1
CL ms-1
Steel 9 7932 3260 5960 Fusion-Bonded Epoxy 0.3 1200 1100 2610 Sand (loose)* ∞ 1485 93 400 Sand (compacted)* ∞ 1635 131 800 PE-Foam 19 85 313 500 Sand (loose)† ∞ 1475 93 400 Sand (compacted)† ∞ 1630 131 800 *In buried FBE-coated pipe case. †In buried FBE- PE-foam-coated pipe case.