1 “Tracking the Evolution of Web Traffic: 1995-2003 Felix Hernandez-Campos, Kevin Jeffay, F....
30
1 “Tracking the Evolution of Web Traffic: 1995- 2003 Felix Hernandez-Campos, Kevin Jeffay, F. Donelson Smith IEEE/ACM International Symposium on Modeling, Analysis and Simulation of Computer and Telecommunication Systems (MASCOTS) Orlando, FL, October 2003
-
Upload
godfrey-stanley -
Category
Documents
-
view
216 -
download
0
Transcript of 1 “Tracking the Evolution of Web Traffic: 1995-2003 Felix Hernandez-Campos, Kevin Jeffay, F....

1
“Tracking the Evolution of Web Traffic: 1995-2003
Felix Hernandez-Campos, Kevin Jeffay, F. Donelson Smith
IEEE/ACM International Symposium on Modeling, Analysis and Simulation of Computer and Telecommunication
Systems (MASCOTS)
Orlando, FL, October 2003

Distributed Computing Systems 2
Outline
Introduction Related Work Data Sets Collected at UNC. Analysis of UNC Data Sets Comparison with Mah, Barford and
Crovella Studies Sampling Issues Conclusions

Distributed Computing Systems 3
Introduction
Web traffic has been the dominant traffic type on the Internet since mid-1990s.
The Web (implying HTTP and HTML) is the de facto user-interface for many distributed applications.
Goal:: To discover and document the evolving nature and structure of Web traffic.

Distributed Computing Systems 4
Introduction
What the authors did: Analyzed 1 terabyte of TCP/IP header
traces collected in 1999, 2001 and 2003 at UNC at Chapel Hill.
Compared results to similar measurements made from 1995 to 1998.

Distributed Computing Systems 5
Introduction
Contributions of this research: Empirical data for traffic generating
models of Web traffic. Characterization of TCP usage including
the effects of HTTP 1.1 Characterization of Web usage that
includes “new influences” such as banner ads, server load balancing and content distribution.

Distributed Computing Systems 6
HTTPserver
HTTPclient
Request
Response
Figure 2.1Leon-Garcia & Widjaja: Communication NetworksCopyright ©2000 The McGraw Hill Companies
HTTP client/server interaction

Distributed Computing Systems 7
HTTP SMTP RTP
TCP UDP
IP
Network
Interface 1
Network
Interface 3
Network
Interface 2
DNS
Figure 2.12Leon-Garcia & Widjaja: Communication NetworksCopyright ©2000 The McGraw Hill Companies

Distributed Computing Systems 8
HTTPserver
HTTPclient
TCP TCP
GET 80, #
#, 80 STATUS
Port 80Ephemeral
Port #
Figure 2.2Leon-Garcia & Widjaja: Communication NetworksCopyright ©2000 The McGraw Hill Companies

Distributed Computing Systems 9
Related Work Bruce Mah [10] captured 1.7 million TCP
traces from UC Berkeley grad student population in 1995.
Barford and Crovella, et al, [2,4,7] collected in aggregate around 1 million references to Web objects from undergrad CS students at BU in 1995 and 1998.
Considering the evolution of the Web, this data is old and before the deployment of HTTP 1.1

Distributed Computing Systems 10
Data Collected
1.6 billion TCP segments generated by a user population of 35,000 users and the transfer of almost 200 million Web objects.
Analyzed unidirectional traces sent from Web servers to client browsers.
Used TCP sequence and ACK numbers to determine request and response sizes.
Distributed Computing Systems 11
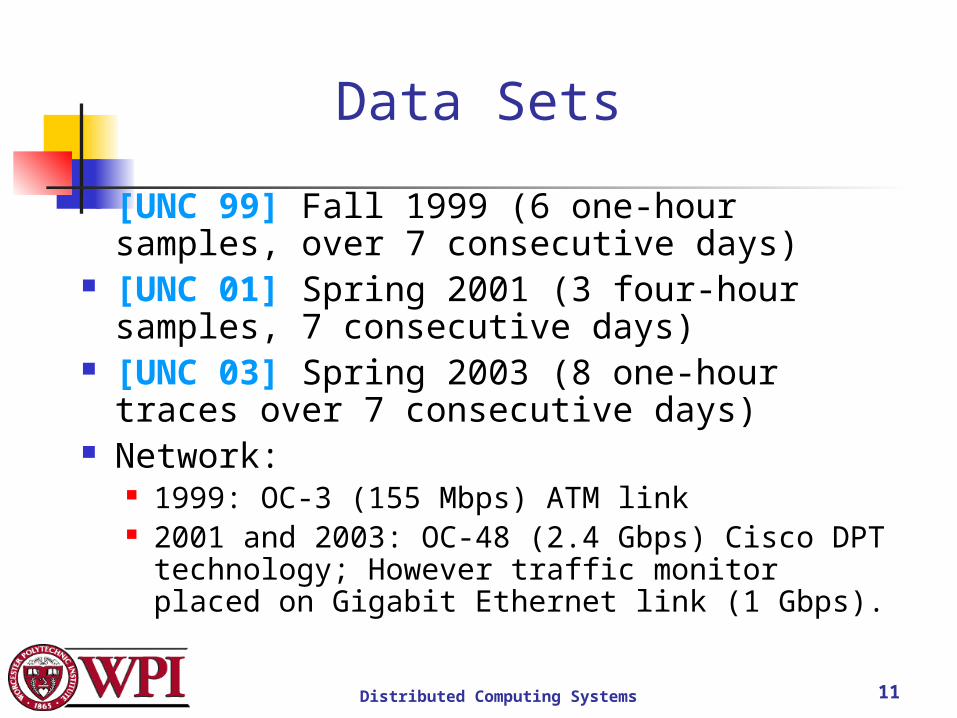
Data Sets
[UNC 99] Fall 1999 (6 one-hour samples, over 7 consecutive days)
[UNC 01] Spring 2001 (3 four-hour samples, 7 consecutive days)
[UNC 03] Spring 2003 (8 one-hour traces over 7 consecutive days)
Network: 1999: OC-3 (155 Mbps) ATM link 2001 and 2003: OC-48 (2.4 Gbps) Cisco DPT
technology; However traffic monitor placed on Gigabit Ethernet link (1 Gbps).
Distributed Computing Systems 12
Analysis of UNC Data Sets
TCP Request and Response Data Sizes User and Web Content
Characterizations Distribution of number of objects per page. Distinction between primary and non-
primary servers with respect to number of objects requested and size of response objects.

Distributed Computing Systems 13
Figure 1: Request Sizes
• Requests becoming larger over time.• But, still typically fit in one packet.

Distributed Computing Systems 14
Figure 3: Response Sizes
• Responses becoming smaller over time.• Median fits in one packet.

Distributed Computing Systems 15
Figure 4: Response Size Tail
•CCDF shows long-tailed responses.• There is a slight increase in the tail over time.

Distributed Computing Systems 16
User and Browser Characteristics
Without HTTP headers, authors “infer” HTTP behavior from TCP connections.
Aggregate by unique client IP address and then time-sorted all flows between clients and servers.
Assume each IP address is one user (fewer NATs on campus).
Used previous researcher’s heuristic approach to estimate the first request is “page”.

Distributed Computing Systems 17
User and Browser Characteristics
An “object” is synonymous with a server response. Note – this includes error reports.
A threshold of 1 second is used to distinguish “idle time” ( or “think time”).
Note – all Web traffic observed does not include objects from the local browser cache.

Distributed Computing Systems 18
Figure 7: Number of Consecutive Requests to Same Server
•Most requests go to one page per server.•This trend is increasing over time.•Results are attributed to load balancing in server farms and CDNs.

Distributed Computing Systems 19
Figure 9: Number of Objects per Page
• 40% are simple pages with no imbedded objects.• Some pages are quite complex with 100 objects•Both trends increasing•Data “fuzzy” due to browser caches.
Distributed Computing Systems 20
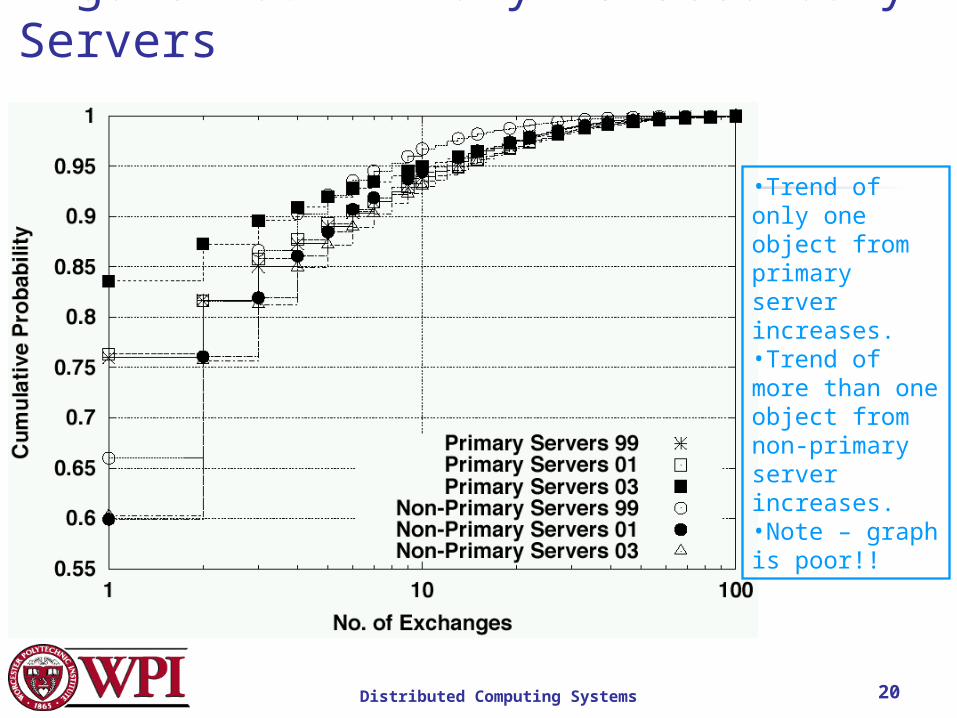
Figure 10: Primary vs Secondary Servers
•Trend of only one object from primary server increases.•Trend of more than one object from non-primary server increases.•Note – graph is poor!!

Distributed Computing Systems 21
Figure 13: Response Sizes Primary vs. Non-Primary
•There are only minor differences in the object sizes from different servers.
Distributed Computing Systems 22
Limitations of Methodology
TCP analysis solid (inferences about the number of packets and flows are reasonable.)
HTTP analysis less certain due to: Pipelined exchanges User/browser interactions (Stop and Reload) Browser and proxy caches TCP processing dealing with loss, duplication
and re-ordering of packets in the network.

Distributed Computing Systems 23
Comparison with Mah, Barford and Crovella, et al. Studies
Distribution of response sizes has evolved over time.
Data fits Barford’s lognormal-Pareto models of response times.
Change in distribution of objects per page reflect increased complexity in Web page layout.

Distributed Computing Systems 24
Figure 15: SURGE (BU) vs UNC
•A clear reflection of the evolution of Web objects•Figure 17 with Mah data is very similar.

Distributed Computing Systems 25
Table 1: Summary Data
Notice decreasing trend in median response sizes.
Caveat - larger sizes in some experiments are partially due to larger samples.

Distributed Computing Systems 26
Sampling Issues
Number and duration of trace intervals bring up important analysis issues.
1 hour of only 68 byte TCP headers consumes 30 Gigabytes of storage at UNC.
90-second trace only requires 200MB for each of inbound and outbound traces.
Processing takes hours. Capturing can slow down routers.
Questions Do lengths of traces affect the distribution shape? Do incomplete TCP connections affect the
distribution shapes?

Distributed Computing Systems 27
Figure 23: Response Sizes for Sub-Samples
•90-second intervals work fine.•Although Fig 24 shows slight difference in the tail.

Distributed Computing Systems 28
Figure 25: Complete and Partial Connections
•Partial connections do not hurt as long as you are NOT characterizinguser activity.

Distributed Computing Systems 29
Conclusions
Captured and analyzed Web traffic for 35,000 UNC people, three data sets from 3 years
General Results: HTTP request sizes are increasing. HTTP response sizes are decreasing. Largest HTTP responses are increasing. Web pages complexity is increasing
(more objects per page).

Distributed Computing Systems 30
Future Work
Effects of persistent connections and pipelining?
What about other (non-port 80) traffic over HTTP? About ½ of all TCP traffic “other”
Are all objects Web objects? As opposed to re-direction requests, error
messages This may help understand Web structure.