1 © Tim Pettry, 2008 How do you spell SUCCESS? The Benefits of Workgroups and Workplace...
43
1 © Tim Pettry, 2008 How do you spell SUCCESS? The Benefits of Workgroups and Workplace Organization Training Simulation PEOPLE PERFORMANCE P R O C E S S E S P R O D U C T S ©
-
Upload
isaac-wiggins -
Category
Documents
-
view
212 -
download
0
Transcript of 1 © Tim Pettry, 2008 How do you spell SUCCESS? The Benefits of Workgroups and Workplace...

1 © Tim Pettry, 2008
How do you spell SUCCESS?The Benefits of Workgroups and
Workplace OrganizationTraining Simulation
PEOPLE
PERFORMANCE
PROCESSES
PRODUCTS
©
2 © Tim Pettry, 2008
Table of Contents
Subject Matter Page• Materials Needed 4• Preparation for Workgroups 6• Workgroups 9• Workplace Organization 13• Visual Controls - Integrating Standards into the Workplace. 15• Measuring Success 20• In-Station Process Control - Production Simulation 21
• Round 1 - Identifying the need 22• Round 2 - Workplace Organization, Visual Controls, Mistake-Proofing 24• Round 3 - Quick Changeover, Inventory Reduction 26
• Measurable Impact 28• Opportunities for expanding the exercises. 30• Exhibits 31
3 © Tim Pettry, 2008
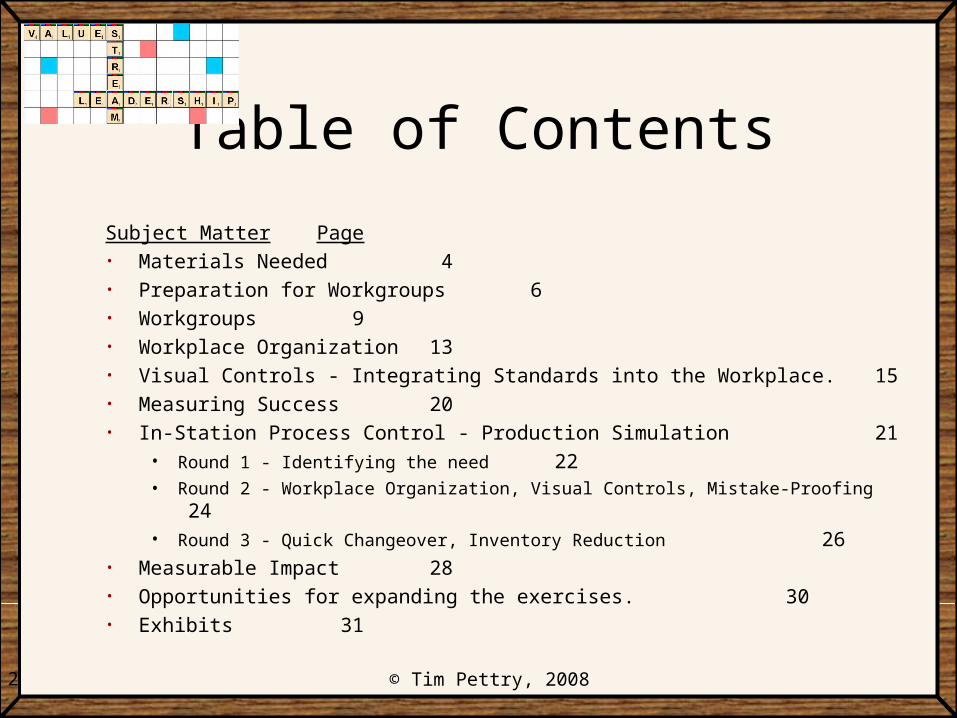
Exhibits
A. Differentiating “Traditional” from “Red Dot” letters.B. Organized layout of “Red Dot” letters and Production Round 2 plant layout.C. Production round 2 phrase holders - Stabilizing the Process.D. Production round 2 phrase holders – Error-Proofing the Phrases.E. Production round 3 plant layout - Maximizing Production Floor Space.F. Scrabble® box bottom setup utilizing Velcro for “Red Dot” letter return and Round 2 Plant layout.G. Score card for Workgroups.H. “Red Dot” and “Traditional” returned letter signs.I. Score card for Production simulation.J. “Red Dot” inventory sheet - Standard Letter Distribution.
SCRABBLE®, the game board design, tiles and other indicia are trademarks of Hasbro in the United States and Canada. ©1998 Hasbro. All Rights Reserved. Used with permission in the United States and Canada
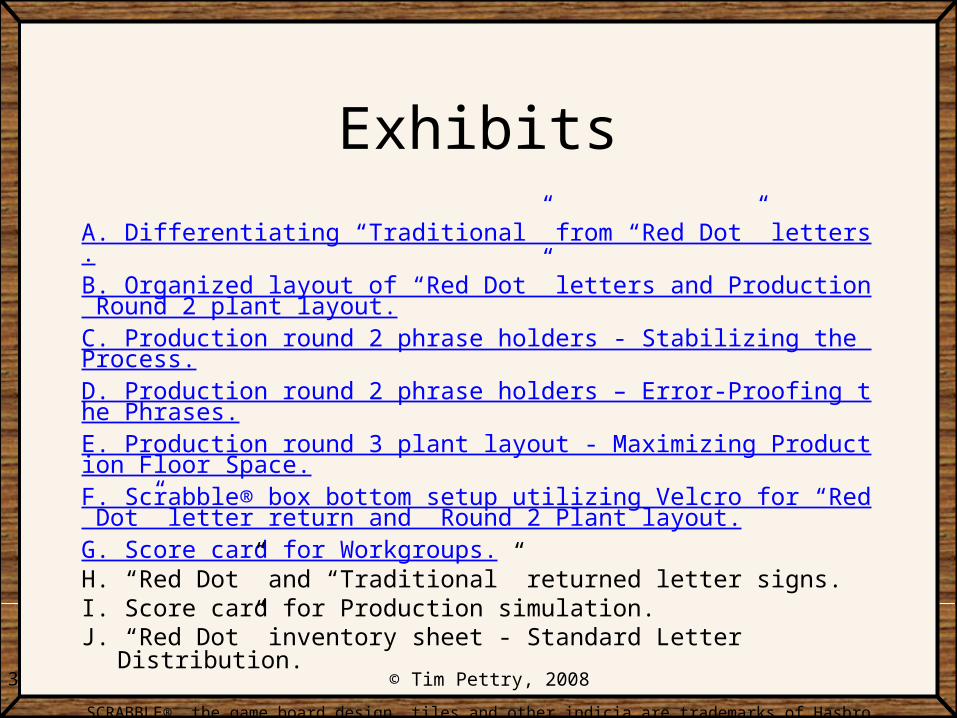
4 © Tim Pettry, 2008
Materials Needed(Double materials for groups of 16 or more)
• One complete Scrabble® game.• One additional set of Scrabble® letters. This set of letters should have
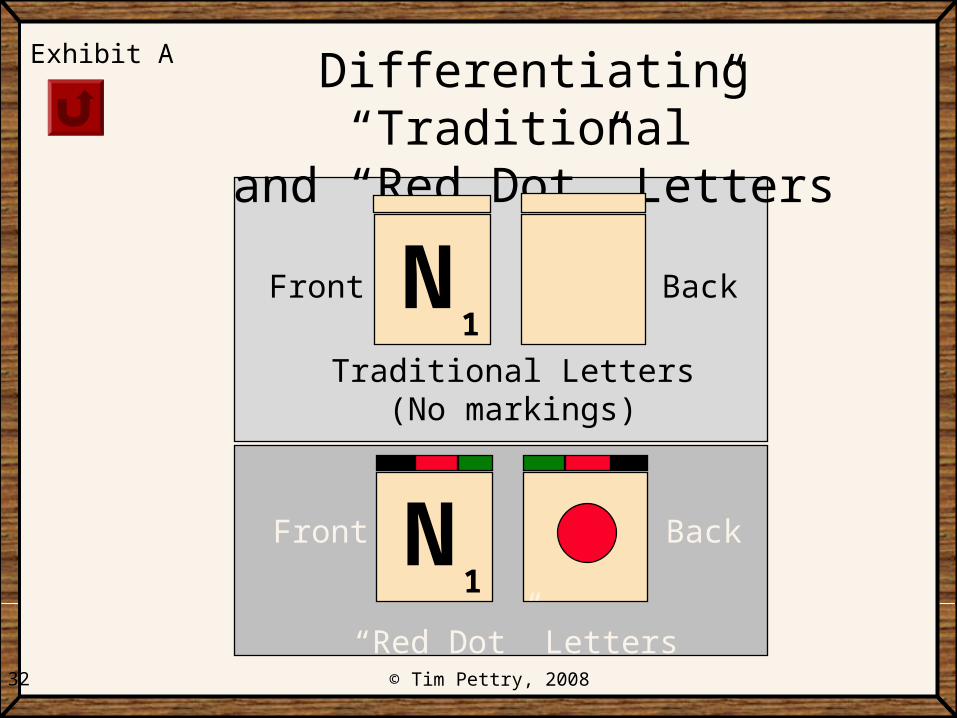
a red marking on the back of each letter. See Exhibit A - Differentiating “Traditional” and “Red Dot” Letters)
• Twenty-four Scrabble® letter holders. (4 each included in regular Scrabble game x 6 games needed) • Twelve letter holders should have labels representing each of the 100
Scrabble® letter tiles in alphabetical order.• Two letter holders labeled “Window of Opportunity”. (Exhibit D)• Two letter holders labeled “Elimination of Waste”. (Exhibit D)
• Two letter holders labeled “Continuous Improvement”. (Exhibit D)• Two letter holders unlabeled. • Four letter holders labeled for reduced inventory exercise. (Exhibit E)
• Available from: Milton-Bradley Company, Attn: Customer Service Department 443 Shaker Road, East Longmeadow, MA 01028.

5 © Tim Pettry, 2008
Materials, continued
• Velcro® tape to attach the 12 alphabetical letter holders onto the back of one-half of the Scrabble® game board. (Exhibit F)
• Four one-inch hinges to connect letter holders with phrases. ( Heavy duty tape stapled to letter holders will also work) (Exhibit C)
• Top of Scrabble® game box (empty).• Bottom of Scrabble® game box with alphabetical
letter holders attached to the game board. (Exhibits B and E)
• A watch with a second hand.

6 © Tim Pettry, 2008
Preparation for Workgroups
• Facilitation time: 15 minutes.• Place complete set of 100 letters with “red dots” (Exhibit A) in one letter tile bag.
Place the second complete set of letters in a separate letter tile bag.• Instruct each participant to choose two letters from each bag.
(Participants should have a total of four letters - two with “red dots”, two without).
• Instruct each participant to individually make as many words as possible given the four letters they have. Count the number of words formed.
• Have each individual identify the highest scoring word they can form using the points identified on each letter.
• Facilitator’s Note: Prepare a score card on a flip chart (Exhibit G) to capture information.

7 © Tim Pettry, 2008
Discussion Questions
• Each individual possesses the same number of “tools” (letters).
• Why were some individuals able to make more words or higher scoring words?• Possible responses
• Right combination of letters.• Higher scoring letters - Value.• Increased vocabulary - Skills.
• Who had letters that went unused? Why?• Is there a “cost” associated with unused or underutilized
“tools” and “resources”?
8 © Tim Pettry, 2008
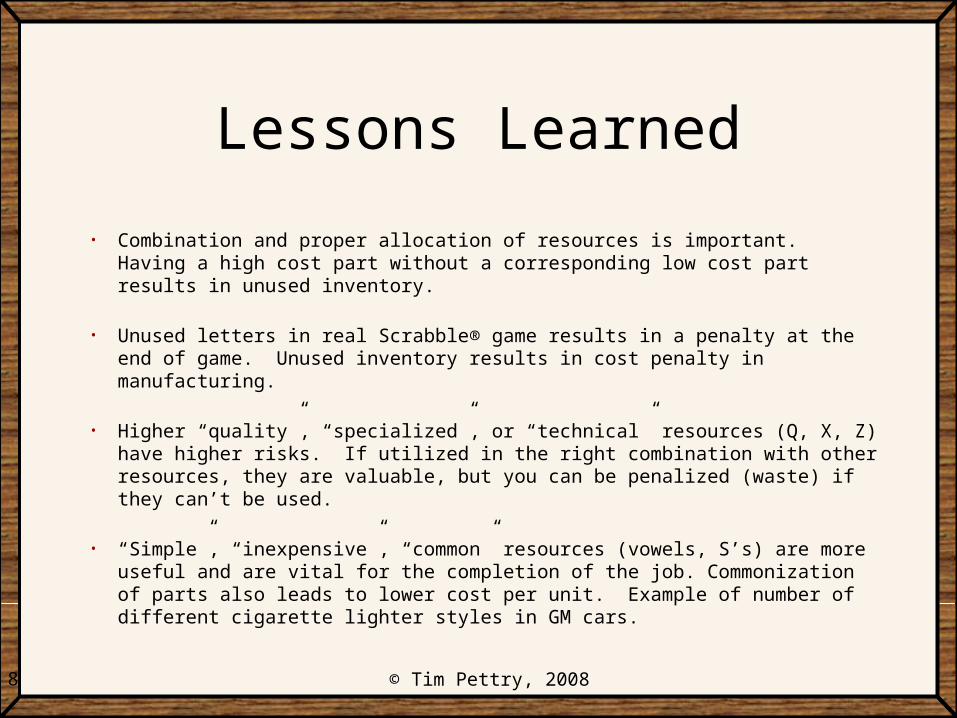
Lessons Learned
• Combination and proper allocation of resources is important. Having a high cost part without a corresponding low cost part results in unused inventory.
• Unused letters in real Scrabble® game results in a penalty at the end of game. Unused inventory results in cost penalty in manufacturing.
• Higher “quality”, “specialized”, or “technical” resources (Q, X, Z) have higher risks. If utilized in the right combination with other resources, they are valuable, but you can be penalized (waste) if they can’t be used.
• “Simple”, “inexpensive”, “common” resources (vowels, S’s) are more useful and are vital for the completion of the job. Commonization of parts also leads to lower cost per unit. Example of number of different cigarette lighter styles in GM cars.

9 © Tim Pettry, 2008
Workgroups Exercise Facilitation Methodology.
• Facilitation time: 15 minutes.
• Form groups of four to five individuals.• Instruct the groups to pool their resources by placing all letters into the center
of the group.• The “goal” of the exercise is to determine which work group can create the
highest scoring word.• Explain that each work group member will have 30 seconds to form a new
word. Emphasis should be on “quality” (high score), not “quantity”.• After 30 seconds, the next person in the group will form a word.• There will be a total of ten cycles with some individuals receiving two turns,
depending on the number of people in each group.

10 © Tim Pettry, 2008
Workgroups Exercise Facilitation Methodology, cont.
• At the end of 30 seconds, the facilitator should say “Write the word and the score and pass it on!”
• After ten cycles, ask each work group for the number of words produced and their highest scoring word and post it.
• Facilitator’s note: While the Work groups are forming words, place the leftover “red dot” letters into the Scrabble® game box top in their appropriate place as marked on the letter holders. Place the unmarked “traditional” letters in the box bottom.
• Facilitator’s note: Place a sign with a big red dot on it and the words “Red dot” next to the red dot letters. Place a sign with the words “Traditional - Normal” next to the unmarked letters. (Exhibit H).
11 © Tim Pettry, 2008
Discussion Questions
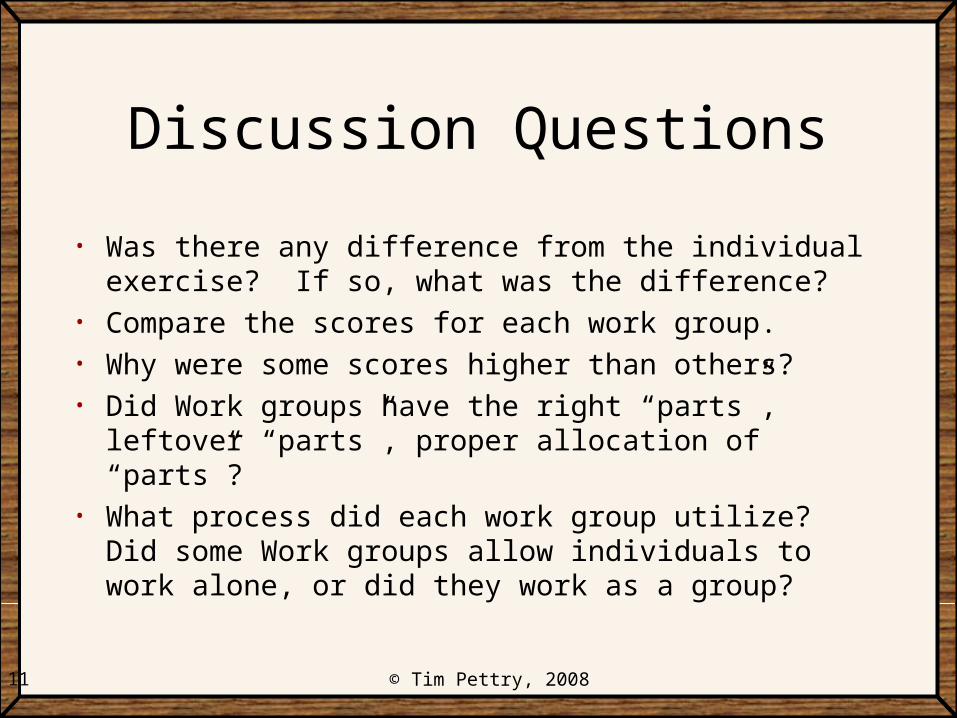
• Was there any difference from the individual exercise? If so, what was the difference?
• Compare the scores for each work group.• Why were some scores higher than others?• Did Work groups have the right “parts”, leftover “parts”,
proper allocation of “parts”?• What process did each work group utilize? Did some
Work groups allow individuals to work alone, or did they work as a group?
12 © Tim Pettry, 2008
Lessons Learned
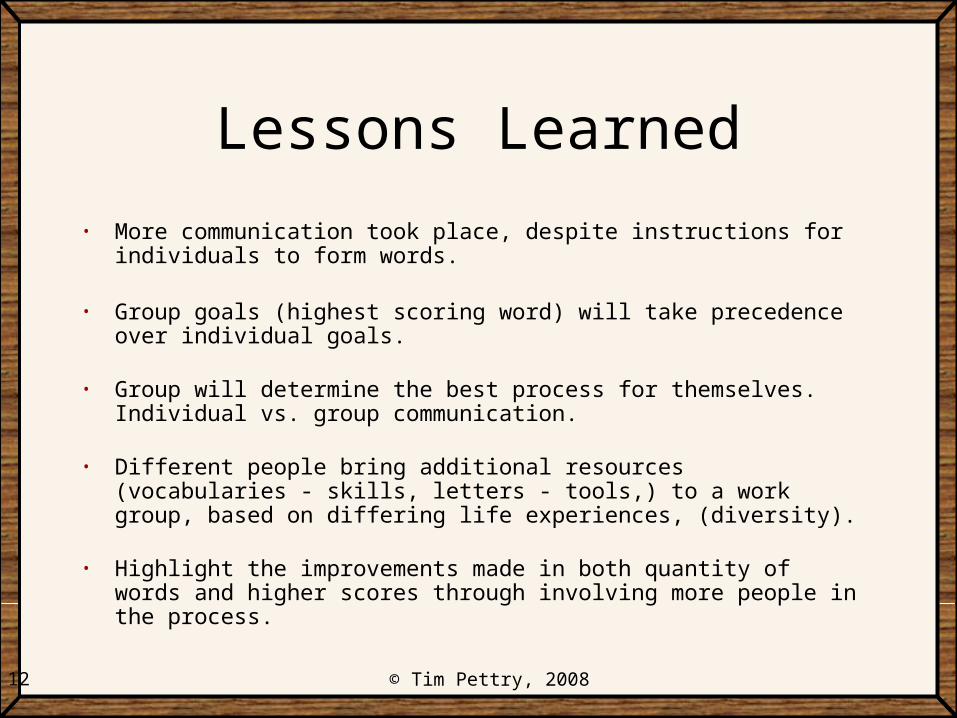
• More communication took place, despite instructions for individuals to form words.
• Group goals (highest scoring word) will take precedence over individual goals.
• Group will determine the best process for themselves. Individual vs. group communication.
• Different people bring additional resources (vocabularies - skills, letters - tools,) to a work group, based on differing life experiences, (diversity).
• Highlight the improvements made in both quantity of words and higher scores through involving more people in the process.

13 © Tim Pettry, 2008
Workplace Organization Facilitation Methodology
• Instruct individuals to each retrieve two (2) “red dot” letters and two (2) “normal” letters from the group’s pile of letters.
• Facilitator’s note: Prepare two box tops for returning letters - One will have the Scrabble® game box top for the “traditional” letters, the other table will have the Scrabble® game box bottom with the alphabetically labeled tile holders. Post a sign labeled “Traditional” at the box top and a sign labeled “Red Dot” at the box bottom. (See Exhibits B, H)
• Instruct each individual to return the “traditional” letters to the box top and the “Red Dot” letters to the box bottom. “Do not instruct the participants to put the letters back in their designated spot.”
• Observe how the process works.

14 © Tim Pettry, 2008
Discussion Questions and Lessons Learned
• What differences did you encounter while returning the letters?• Possible responses
• “Quick and easy to just throw ‘traditional’ letters in box top.• “It took a little more time to put away the “Red Dot” letters.
• Was the time difference noticeable? Discuss the times.
• Lesson - With workplace organization, nobody has to instruct people where to return things - the workplace speaks for itself and has an influence on individual’s behavior.
• Incorporate standards into the workplace - Signs for each box (Traditional and “Red Dot” are posted at each box, where the work is being done, not behind the table.
15 © Tim Pettry, 2008
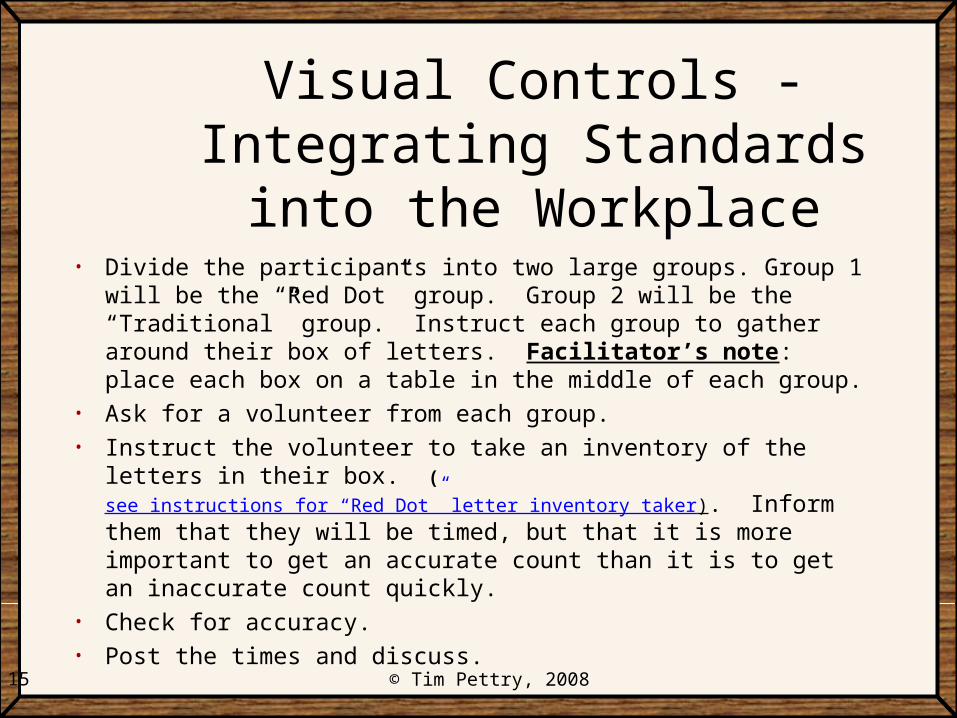
Visual Controls - Integrating Standards into the Workplace
• Divide the participants into two large groups. Group 1 will be the “Red Dot” group. Group 2 will be the “Traditional” group. Instruct each group to gather around their box of letters. Facilitator’s note: place each box on a table in the middle of each group.
• Ask for a volunteer from each group.• Instruct the volunteer to take an inventory of the letters in their box. (
see instructions for “Red Dot” letter inventory taker). Inform them that they will be timed, but that it is more important to get an accurate count than it is to get an inaccurate count quickly.
• Check for accuracy.• Post the times and discuss.

16 © Tim Pettry, 2008
Instructions for “Red Dot”Letter Inventory Taker.
• Provide the inventory taker with the count sheet of “Standardized Letter Distribution”. (Exhibit J).
• Inform them that the number of spaces on the letter holders for each letter match exactly with the number of letters indicated on the count sheet.
• They only need to verify that the letters are in alphabetical order and should only document “exceptions” to the standard letter distribution and mark on the sheet.
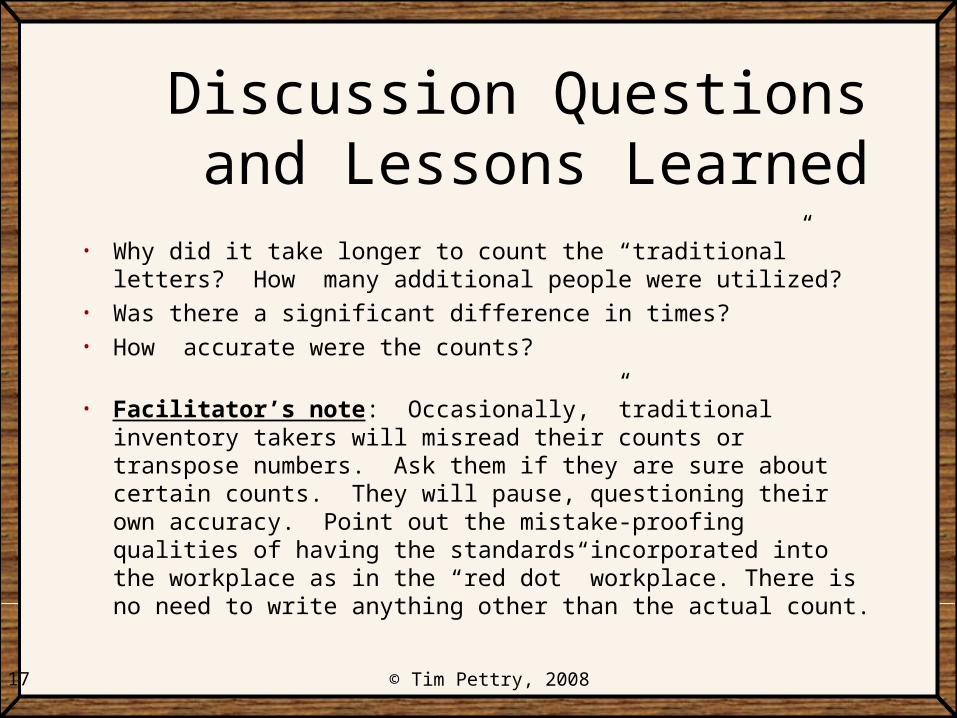
17 © Tim Pettry, 2008
Discussion Questions and Lessons Learned
• Why did it take longer to count the “traditional” letters? How many additional people were utilized?
• Was there a significant difference in times?• How accurate were the counts?
• Facilitator’s note: Occasionally, ”traditional inventory takers will misread their counts or transpose numbers. Ask them if they are sure about certain counts. They will pause, questioning their own accuracy. Point out the mistake-proofing qualities of having the standards incorporated into the workplace as in the “red dot” workplace. There is no need to write anything other than the actual count.
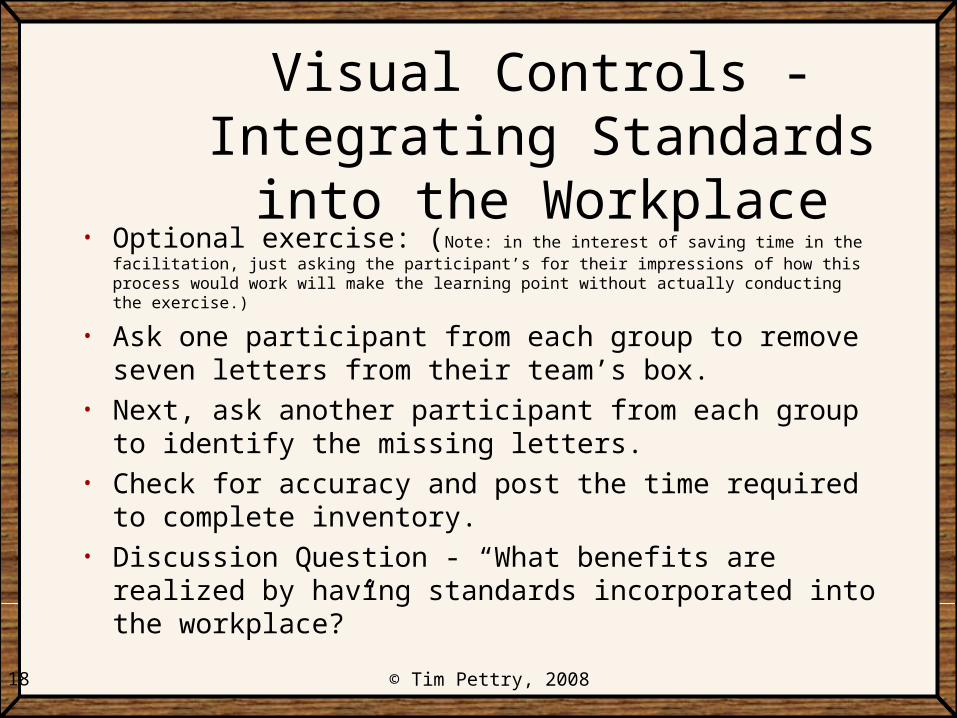
18 © Tim Pettry, 2008
Visual Controls - Integrating Standards into the Workplace
• Optional exercise: (Note: in the interest of saving time in the facilitation, just asking the participant’s for their impressions of how this process would work will make the learning point without actually conducting the exercise.)
• Ask one participant from each group to remove seven letters from their team’s box.
• Next, ask another participant from each group to identify the missing letters.
• Check for accuracy and post the time required to complete inventory.
• Discussion Question - “What benefits are realized by having standards incorporated into the workplace?”

19 © Tim Pettry, 2008
Manufacturing Simulation
The second phase of this training involves “assembling” the phrases:“Window of Opportunity”“Elimination of Waste” and“Continue to Improve” in a series of three rounds. At the conclusion of each round, data is collected and performance metrics are calculated. The resulting metrics are used to point participants to the proper lean tool to implement to improve performance.

20 © Tim Pettry, 2008
Measuring the business.
• Explain to the group that they are now going to enter into the production phase of the simulation.
• Ask the group the following question: If you were in charge of your own business, what would you most be interested in knowing to determine if you were successful and if you determine that you are not as successful as you wish, what would you be interested in measuring that would indicate opportunities for improvement?
• Post their responses on a flip chart.• Typical responses should include: # of good parts, # of bad parts and
reasons, scheduled production, duration and cause of downtime, costs, profits, time required to produce parts, etc.

21 © Tim Pettry, 2008
In-station process control tools Facilitation Methodology
• Keep class separated into two groups.• Provide each group with the Scrabble box top containing the
“traditional”, unorganized set of letters and two, unattached, blank letter holders.
• Assign three members from each group to be production workers and assign one additional person to be the customer.
• The “customer” determines the quality of the product. Potential defects include misspelled phrases, letters like “I” or “O” being used upside down (i.e.- point value on top, not bottom).
• Explain that each person is being asked to produce a phrase with the given letters in the box.
• The phrases must be made within the “four walls of the plant” - the box top.

22 © Tim Pettry, 2008
Production simulation Facilitation
• The process will involve each participant to arrange the letters to spell a phrase on the blank letter holders provided, receive approval from the customer, return the letters to the appropriate box, and start the cycle over with a new participant. The first phrase is “Window of Opportunity”, second phrase is “Elimination of Waste” and the third phrase is “Continue to Improve”.
• Each worker will be timed to determine the average cycle time to complete a phrase.
• The three data points that are necessary to complete the measurables spreadsheet are: Average cycle time in seconds, # of Defects, Downtime in minutes.
• Post the date for each group in the measurables spreadsheet and proceed to calculate the data necessary to complete the spreadsheet.
• Facilitator’s Note: Average cycle times should be somewhere between 120 - 210 seconds per worker or 360-630 seconds for the complete three phrases..
23 © Tim Pettry, 2008
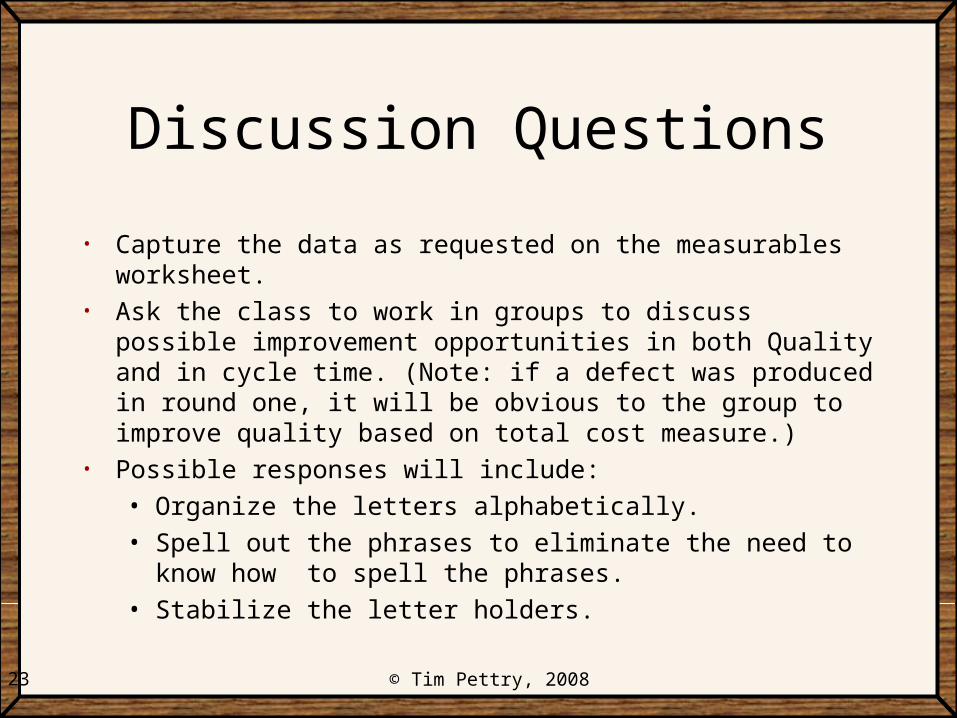
Discussion Questions
• Capture the data as requested on the measurables worksheet.• Ask the class to work in groups to discuss possible improvement
opportunities in both Quality and in cycle time. (Note: if a defect was produced in round one, it will be obvious to the group to improve quality based on total cost measure.)
• Possible responses will include:
• Organize the letters alphabetically.
• Spell out the phrases to eliminate the need to know how to spell the phrases.
• Stabilize the letter holders.

24 © Tim Pettry, 2008
Round 2
• Introduce the organized workplace. (5 S’s) (Exhibit B).• Introduce the labeled phrase holders.(TPM, Error Proofing) (Exhibits C,
D).• Note that the phrases are color coded - blue, red and green.• Place the first phrase holder into the workplace. (Exhibit C).• Remind participants that all phrases must be assembled within the “four
wall of the plant” - the box top.• Ask the class to identify a “target” cycle time. (Remind them that
returning the letters to their proper spot after completing the phrase is still part of the overall process).
• Instruct the participants that the customer will now tell them what to produce just prior to their turn. Workers must replace the labeled phrase holder when customer changes.

25 © Tim Pettry, 2008
Round 2, continued
• Time each worker.• Post cycle times, number of errors and downtime estimates
to spreadsheet and discuss impact on measurables.• Recognize the improvements.• Ask the workers and other class participants for further
improvement opportunities.• Possible responses:
• Eliminate unnecessary inventory.
• Eliminate need to changeover.
26 © Tim Pettry, 2008
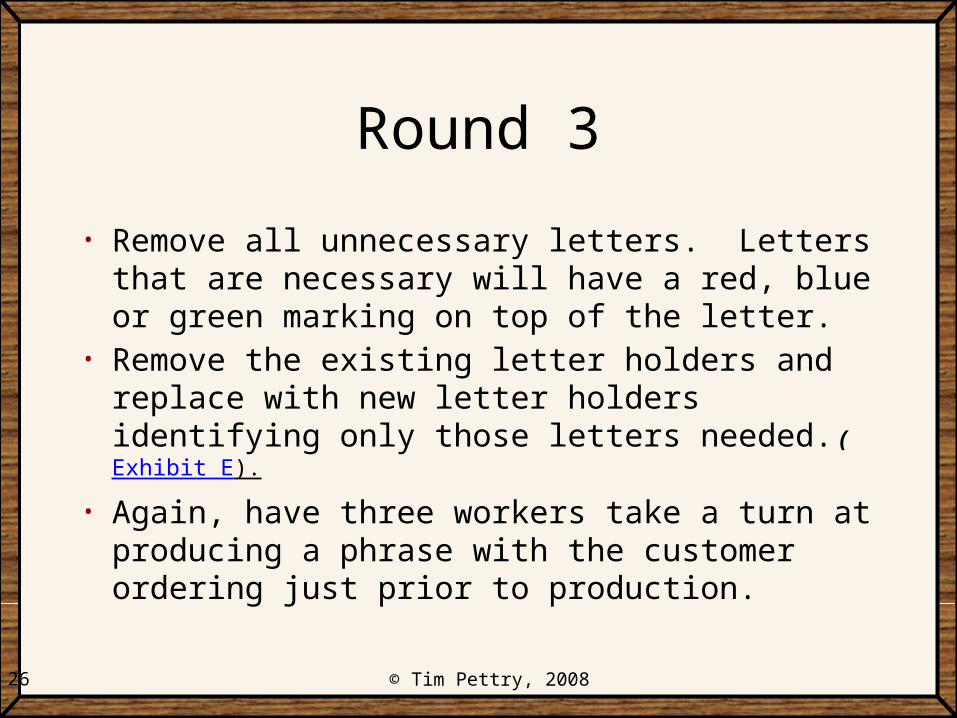
Round 3
• Remove all unnecessary letters. Letters that are necessary will have a red, blue or green marking on top of the letter.
• Remove the existing letter holders and replace with new letter holders identifying only those letters needed. (Exhibit E).
• Again, have three workers take a turn at producing a phrase with the customer ordering just prior to production.
27 © Tim Pettry, 2008
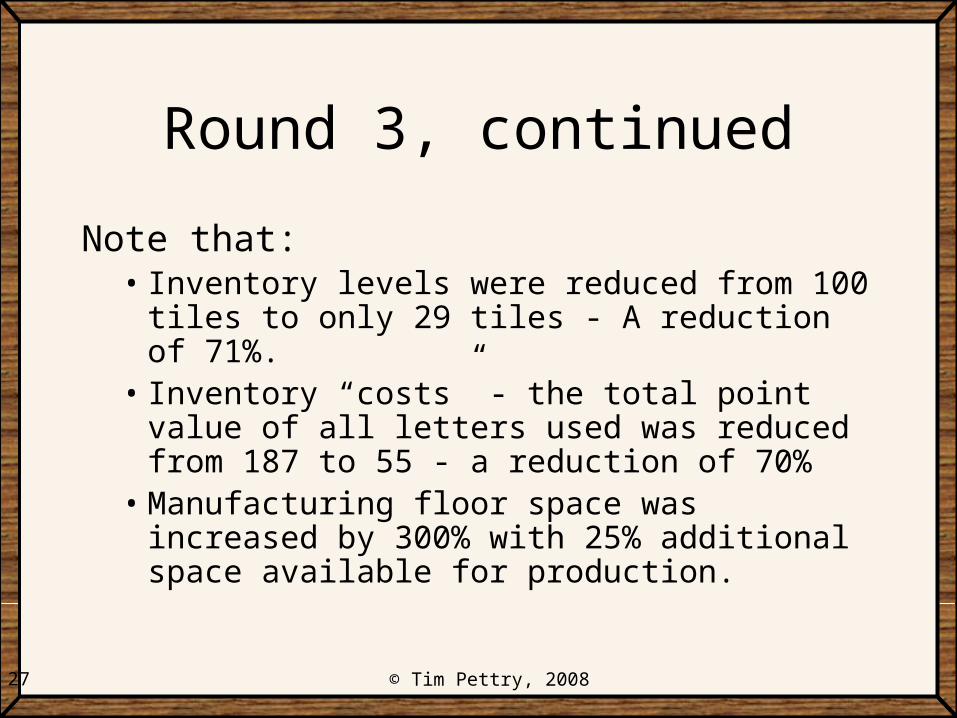
Round 3, continued
Note that:• Inventory levels were reduced from 100 tiles to
only 29 tiles - A reduction of 71%.• Inventory “costs” - the total point value of all
letters used was reduced from 187 to 55 - a reduction of 70%
• Manufacturing floor space was increased by 300% with 25% additional space available for production.
28 © Tim Pettry, 2008
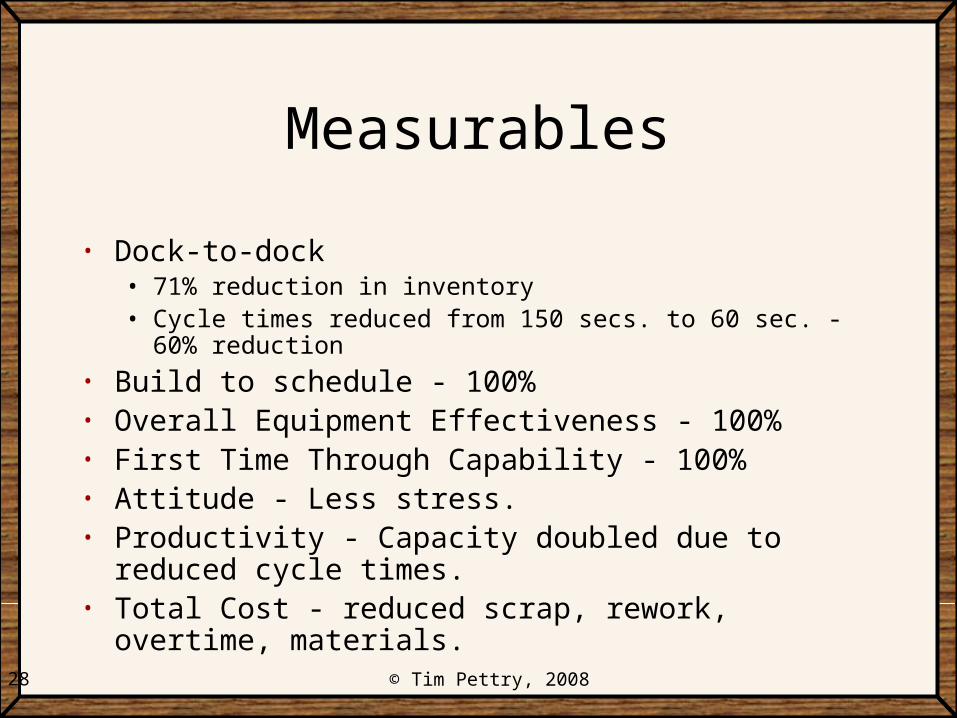
Measurables
• Dock-to-dock• 71% reduction in inventory• Cycle times reduced from 150 secs. to 60 sec. - 60% reduction
• Build to schedule - 100%• Overall Equipment Effectiveness - 100%• First Time Through Capability - 100%• Attitude - Less stress.• Productivity - Capacity doubled due to reduced cycle
times.• Total Cost - reduced scrap, rework, overtime, materials.
29 © Tim Pettry, 2008
Lessons Learned
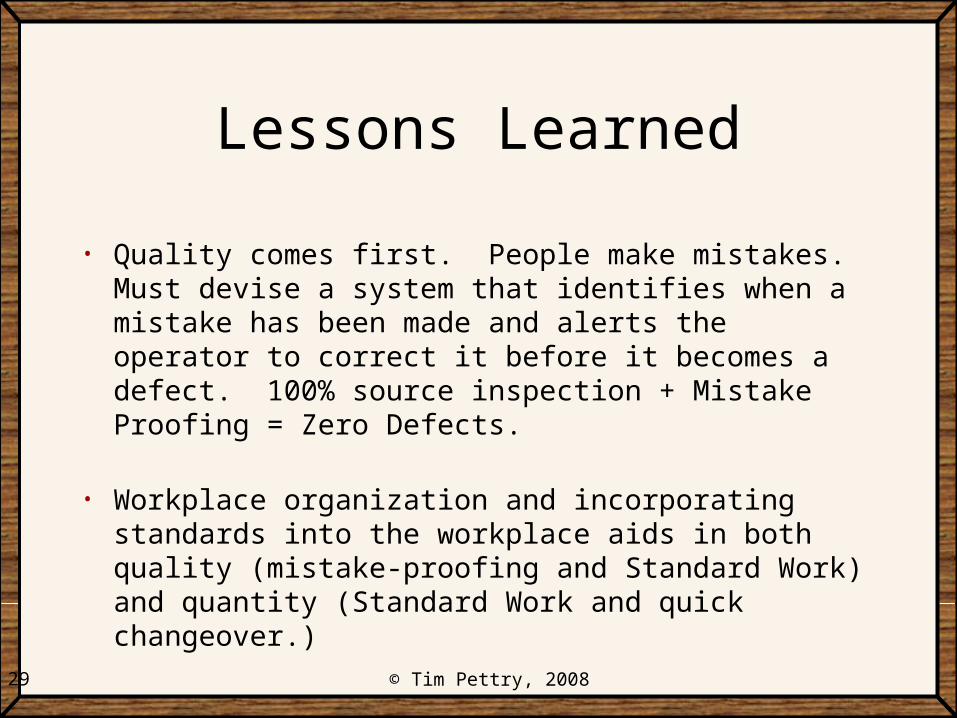
• Quality comes first. People make mistakes. Must devise a system that identifies when a mistake has been made and alerts the operator to correct it before it becomes a defect. 100% source inspection + Mistake Proofing = Zero Defects.
• Workplace organization and incorporating standards into the workplace aids in both quality (mistake-proofing and Standard Work) and quantity (Standard Work and quick changeover.)
30 © Tim Pettry, 2008
Expanding the Simulation
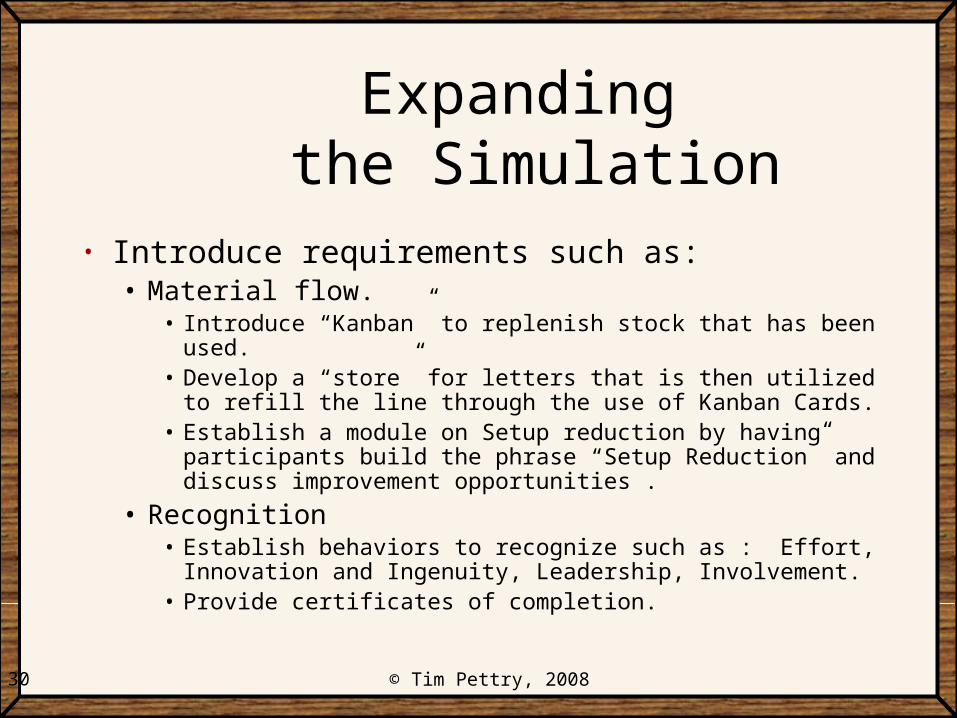
• Introduce requirements such as:• Material flow.
• Introduce “Kanban” to replenish stock that has been used. • Develop a “store” for letters that is then utilized to refill the
line through the use of Kanban Cards.• Establish a module on Setup reduction by having participants
build the phrase “Setup Reduction” and discuss improvement opportunities .
• Recognition• Establish behaviors to recognize such as : Effort, Innovation
and Ingenuity, Leadership, Involvement.• Provide certificates of completion.

31 © Tim Pettry, 2008
Exhibits
32 © Tim Pettry, 2008
Differentiating “Traditional”and “Red Dot” Letters
1N
1N
Traditional Letters(No markings)
“Red Dot” Letters
Front Back
Front Back
Exhibit A
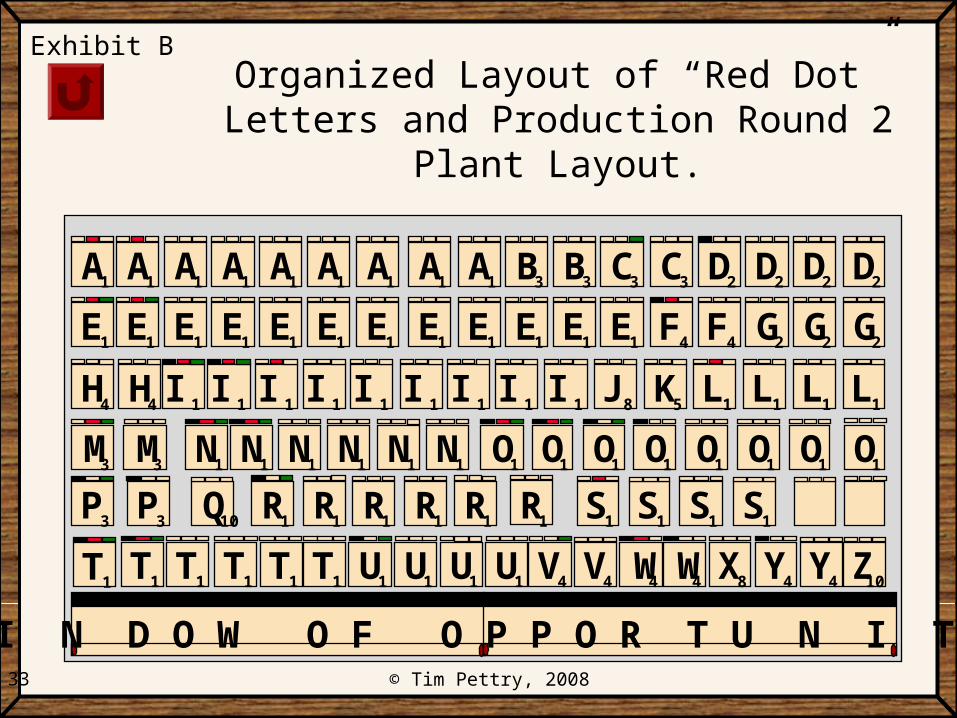
33 © Tim Pettry, 2008
Organized Layout of “Red Dot” Letters and Production Round 2 Plant Layout.
Exhibit B
A1 A1A1 A1 A1 A1 A1 A1 A1 B3 B3 C3 C3 D2 D2 D2 D2
E1 E1E1 E1 E1 E1 E1 E1 E1 E1 E1 E1 F4 F4 G2 G2 G2
H4 I 1H4 I 1 I 1 I 1 I 1 I 1 I 1 I 1 I 1 J8 K5 L1 L1 L1 L1
M3 N1 N1 N1 N1 O1 O1 O1 O1
Q10 R1 R1 R1 R1 R1 S1 S1 S1
T1 T1 T1 T1 U1 U1 U1 V4 X8 Y4
3M N1 N1 O1 O1 O1O1
P3 P3 R1 1S
T1T1 U1 V4 W4 W4 Z10Y4
W I N D O W O F O P P O R T U N I T Y
34 © Tim Pettry, 2008
Production Round 2 Phrase HoldersStabilizing the Process
HINGE
Back View Back View
Bottom View Bottom View
Velcro Tape
Exhibit C
Velcro Tape, Stapled
Back View Back View
OR
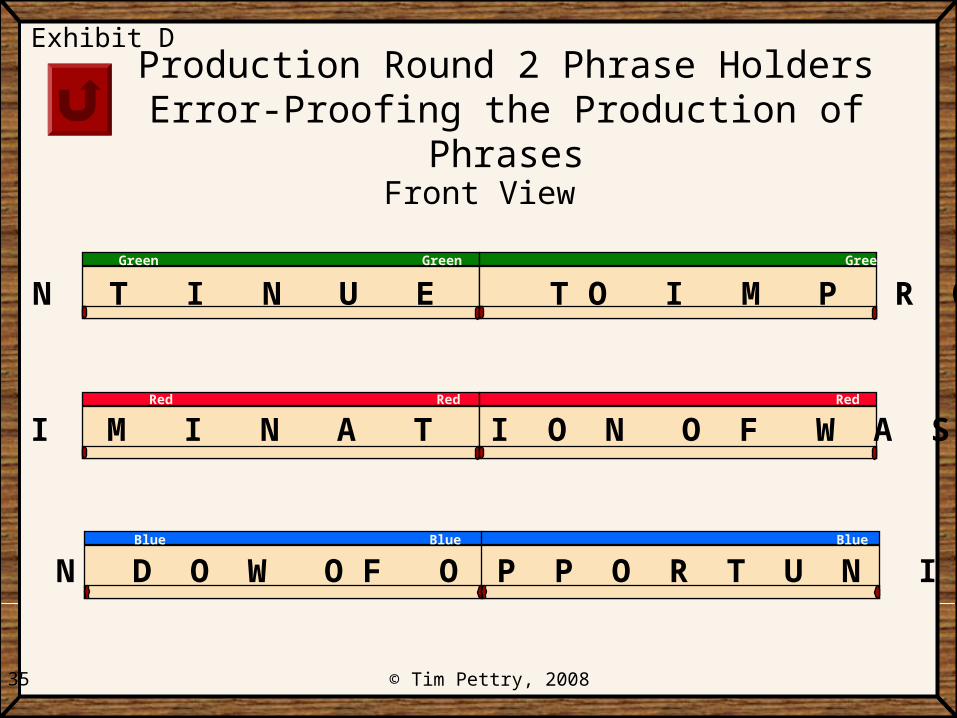
35 © Tim Pettry, 2008
Production Round 2 Phrase HoldersError-Proofing the Production of Phrases
C O N T I N U E T O I M P R O V EGreen Green Green
W I N D O W O F O P P O R T U N I T YBlue Blue Blue
E L I M I N A T I O N O F W A S T E Red Red Red
Exhibit D
Front View

36 © Tim Pettry, 2008
Production Round 3 Plant Layout - Maximizing Floor Space
Exhibit E
A1
A1
C3
D2
E1
E1
F4
I1
I1
I1
L1 3
M N1
N1
O1
O1
O1
O1 1
S T1
T1
V4
W4
W4
Y4
P3
P3
R1
U1
W I N D O W O F O P P O R T U N I T Y
E L I M I N A T I O N O F W A S T E
C O N T I N U E T O I M P R O V EGreen Green Green
Blue Blue Blue
Red Red Red
N1
Blue, Red, Green
Positioning of colorcodes for phrases.
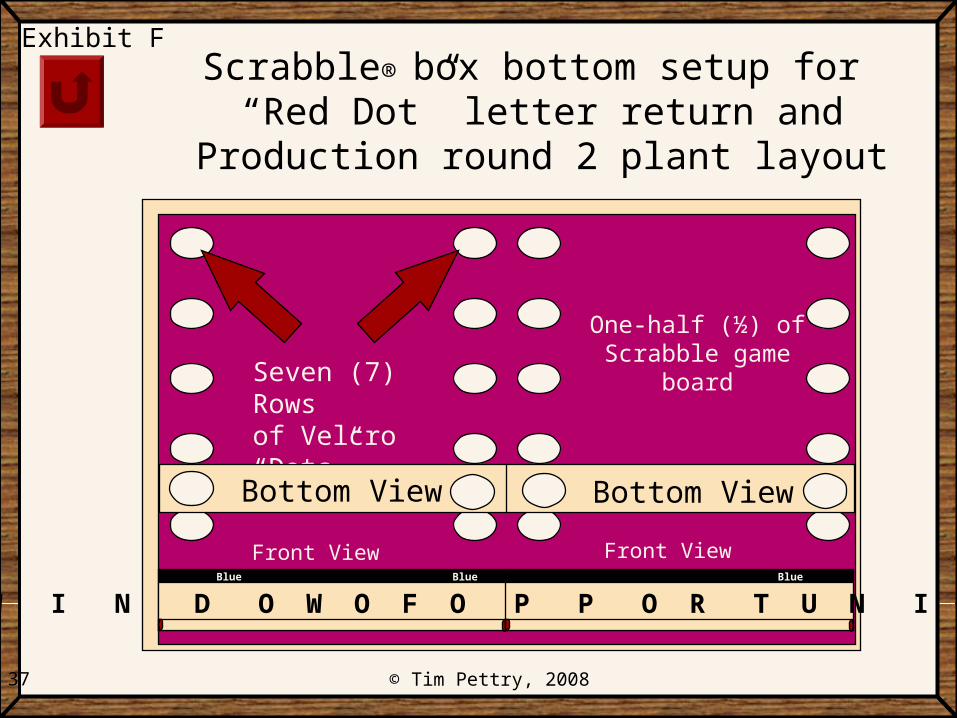
37 © Tim Pettry, 2008
Scrabble® box bottom setup for “Red Dot” letter return and
Production round 2 plant layout
Exhibit F
Seven (7) Rowsof Velcro “Dots”
Bottom View Bottom View
W I N D O W O F O P P O R T U N I T YBlue Blue Blue
Front View Front View
One-half (½) ofScrabble game
board

38 © Tim Pettry, 2008
Workgroups Score Card
On a flip chart write the following headings and post the results from the individual and work group exercise.
Table # Individual Work group # of words High Score Word High Score Word
1
2
3
4
Exhibit G

39 © Tim Pettry, 2008
Inventory Return Signs
“Red Dot”
Letters
“Traditional”
Normal
Letters
Exhibit H
Red

"Window of Opportunity"Measurables Worksheet
Round 1 Round 2 Round 3Schedule Actual Schedule Actual Schedule Actual
A Weekly Schedule 1600 1600 1600 1600 1600 1600
Data Gathering and calculation sequence = H, I, J, E, B, C, D, F, M, GProducts Daily Mix Daily Mix Daily Mix
5 B "Window of Opportunity" (E/3) 107 72 107 93 107 1076 C "Elimination of Waste" (E/3) 107 72 107 93 107 1077 D "Continue to Improve" (E/3) 106 72 106 93 106 1074 E Total Daily Volume (I*8) 320 216 320 280 320 320 Round 28 F Defects (# of errors x I x 8) / 3 0 1 72 0 0 0 0 0 0 Continue to Improve
Pcs. $ Pcs. $ Pcs. $ 610 G Inventory 100 187 Ave. 100 187 Ave. 29 187 Ave. Overtime hrs. worked1 H Ave. Cycle Time (secs.) 90 400 133 90 310 103 90 250 83
2 I End of line rate/hr. ((100% = (60 min./1:30 min.) 40 27 40 35 40 43 Round 33 J Operating Hours per week (A/I) 40 59 40 46 40 37 Stop the line
K Total Hours per week (24*7) 168 168 168 3L Available operating time (mins) (60 * 8) 480 480 480 480 480 480 hr(s). available to trainM Downtime (Changeover + equipment + misc.)*8/3 0 3 8 0 3 8 0 3 8
9 N Time in Automatic (L-M) 480 472 480 472 480 472
Measurables CalculationsBuild to Schedule 0.68 x 1 x 1 0.88 x 1 x 1 1.00 x 1 x 1
Volume (E(A) / E(S)) x Mix x Sequence = 68% = 88% = 100%
First Time Through = 216 / 216 + 72 = 280 / 280 + 0 = 320 / 320 + 0E / (E + F) 75% 100% 100%
Dock to Dock 3.70 x 2.85 2.86 x 3.65 0.67 x 4.54(G / I) / (K / J) = 10.55 = 10.44 = 3.04
Overall Equipment Effectiveness A x E x Q A x E x Q A x E x QAvailability x Effeciency x Quality 0.98 x 0.68 x 0.75 0.98 x 0.88 x 1.00 0.98 x 1.08 x 1.00 (N / L) x (I(A) / I(S)) x (E / (E+F)) = 50% = 86% = 105%
Total Cost O + I + S O + I + S O + I + SOvertime + Inventory + Scrap 665 + 187 + 10,440 210 + 187 + - - + 187 + -
(J(A) - J(S)($35) + $G + F(Ave. cost of product =
$29)x 5 days = 11,292$ = 397$ = 187$ Cost per piece (Total cost/actual units) 7.06$ 0.25$ 0.12$
Attitude Survey Take this job and ...... Not Bad Fun
Safety
Total Cost
$11,292
$397$187
$-
$2,000
$4,000
$6,000
$8,000
$10,000
$12,000
1 2 3
Round
Production Simulation Score CardExhibit I

41 © Tim Pettry, 2008
“Red Dot” Inventory Sheet Standard Letter Distribution
A1
B3
C3
D2
E1
F4
G2
H4
I1
J8
K5
L1 3
M N1
P3
Q10
R1
O1
Standard:Actual:
Standard:Actual:
Standard:Actual:
9 2 2 4 12 2 3 2 9
1 1 4 2 6 8 2 1 6
S1
T1
U1
V4
W4
X8
Z10
Y4
4 6 4 2 2 1 2 12
Exhibit J
42 © Tim Pettry, 2008
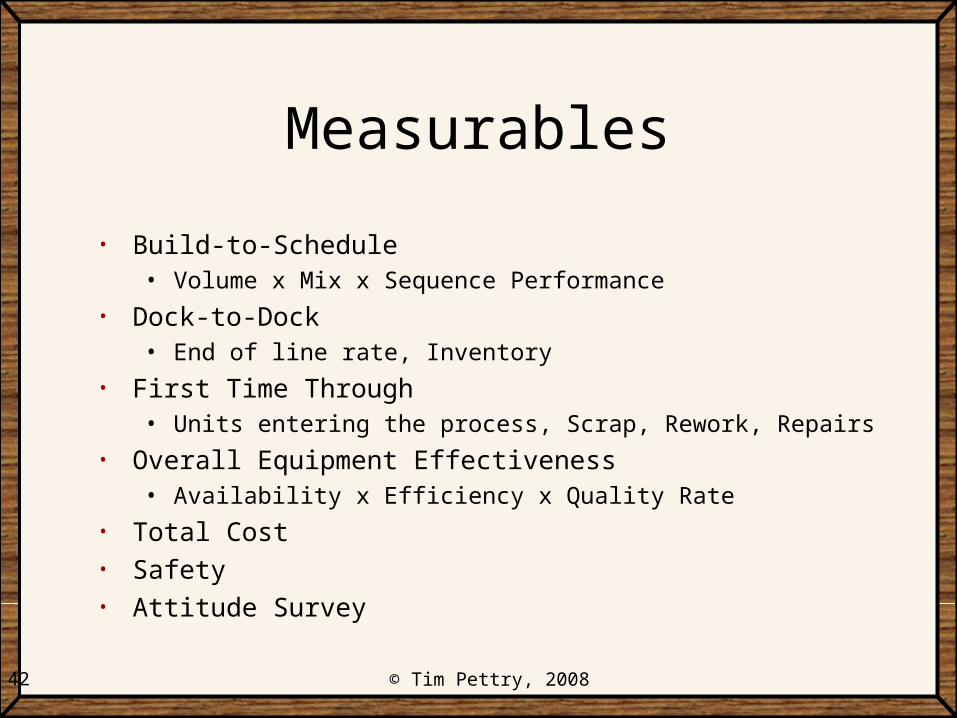
Measurables
• Build-to-Schedule• Volume x Mix x Sequence Performance
• Dock-to-Dock• End of line rate, Inventory
• First Time Through• Units entering the process, Scrap, Rework, Repairs
• Overall Equipment Effectiveness• Availability x Efficiency x Quality Rate
• Total Cost• Safety• Attitude Survey
43 © Tim Pettry, 2008
For additional information, suggestions, or comments,
Please contact:Tim Pettry
E-mail: [email protected]
http://www.linkedin.com/in/timpettry