
1 Tilting at Windmills? Renewable power in New York City Stephen A. Hammer, PhD Director, Urban...
14
1 Tilting at Tilting at Windmills? Windmills? Renewable power Renewable power in New York City in New York City Stephen A. Hammer, PhD Stephen A. Hammer, PhD Director, Urban Energy Program Director, Urban Energy Program [email protected] [email protected]
-
Upload
angela-barker -
Category
Documents
-
view
216 -
download
0
Transcript of 1 Tilting at Windmills? Renewable power in New York City Stephen A. Hammer, PhD Director, Urban...
11
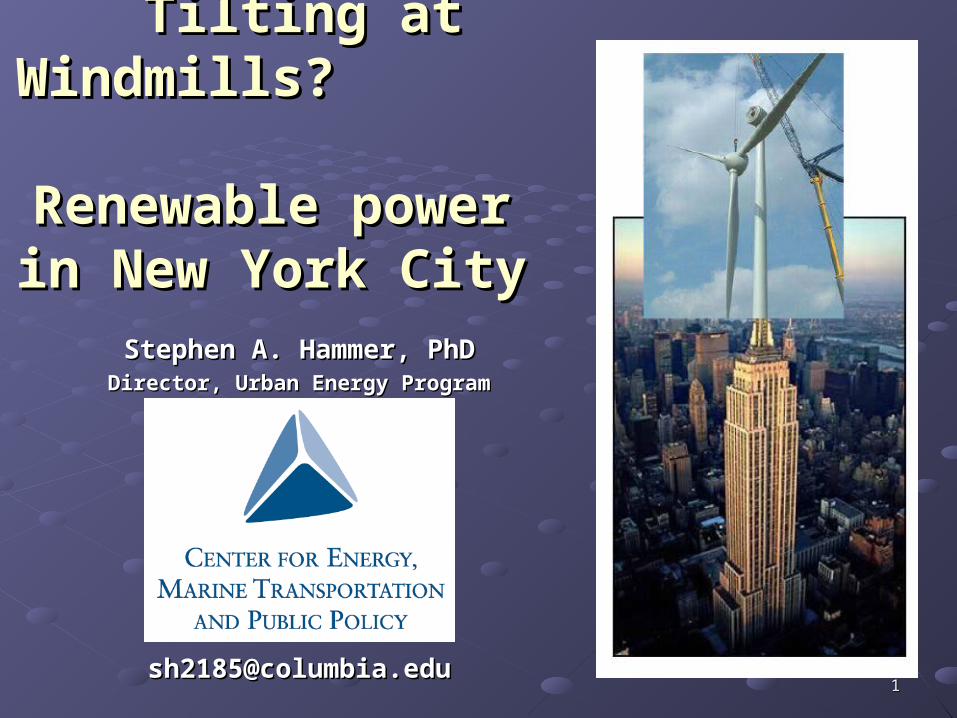
Tilting at Windmills? Tilting at Windmills?
Renewable power Renewable power in New York Cityin New York City
Stephen A. Hammer, PhDStephen A. Hammer, PhDDirector, Urban Energy ProgramDirector, Urban Energy Program
[email protected]@columbia.edu
22
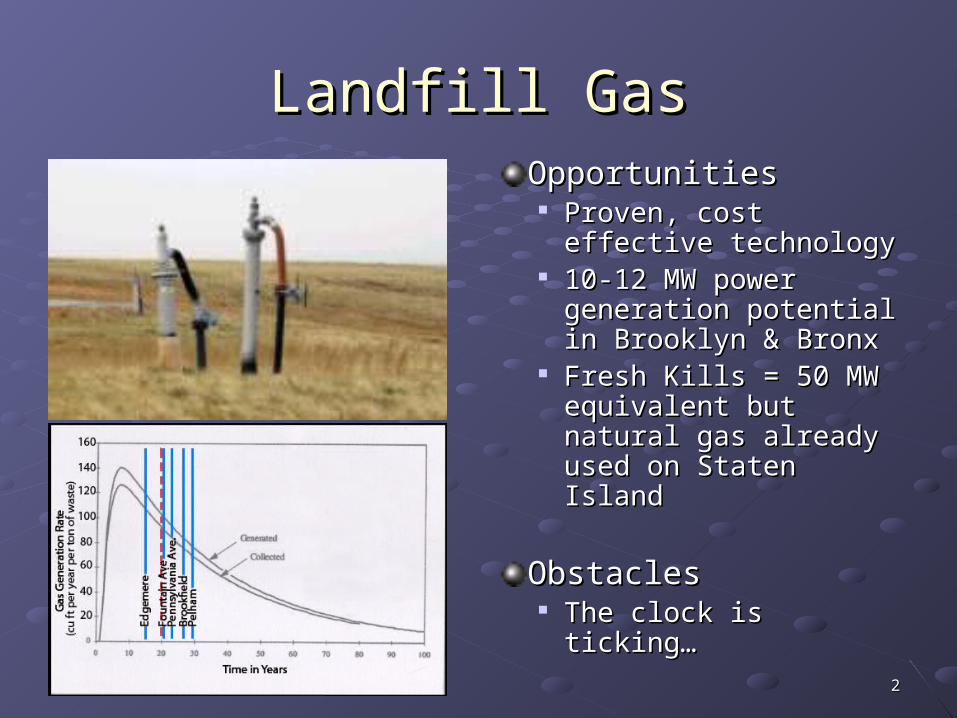
Landfill GasLandfill GasOpportunitiesOpportunities Proven, cost effective Proven, cost effective
technologytechnology 10-12 MW power 10-12 MW power
generation potential in generation potential in Brooklyn & BronxBrooklyn & Bronx
Fresh Kills = 50 MW Fresh Kills = 50 MW equivalent but natural equivalent but natural gas already used on gas already used on Staten IslandStaten Island
ObstaclesObstacles The clock is ticking… The clock is ticking…
33
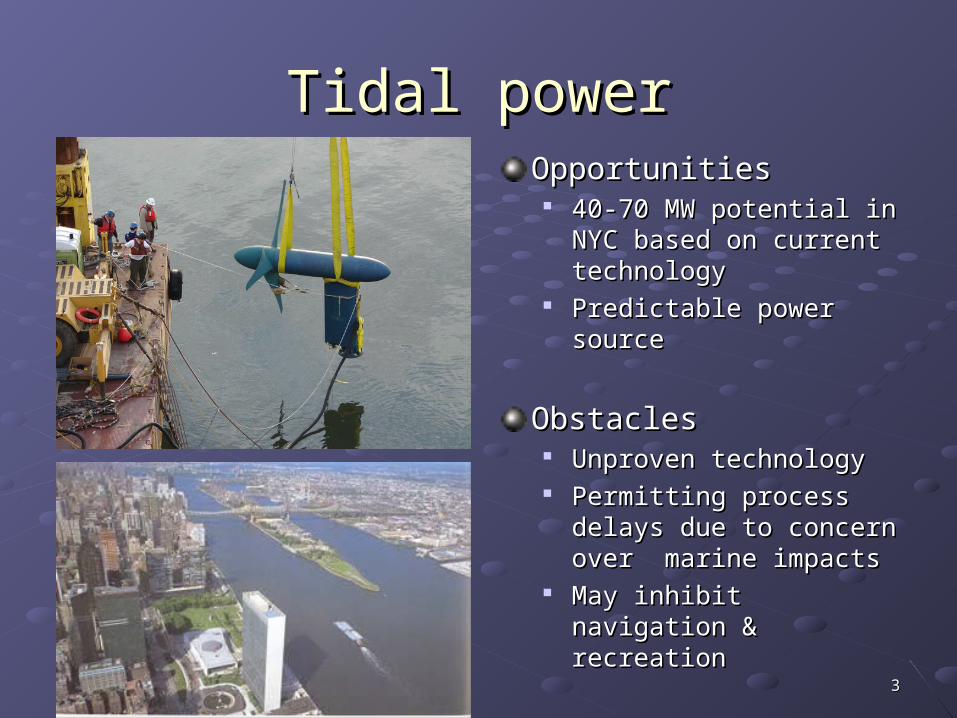
Tidal powerTidal powerOpportunitiesOpportunities
40-70 MW potential in NYC 40-70 MW potential in NYC based on current based on current technologytechnology
Predictable power sourcePredictable power source
ObstaclesObstacles Unproven technology Unproven technology Permitting process delays Permitting process delays
due to concern over due to concern over marine impacts marine impacts
May inhibit navigation & May inhibit navigation & recreation recreation
44
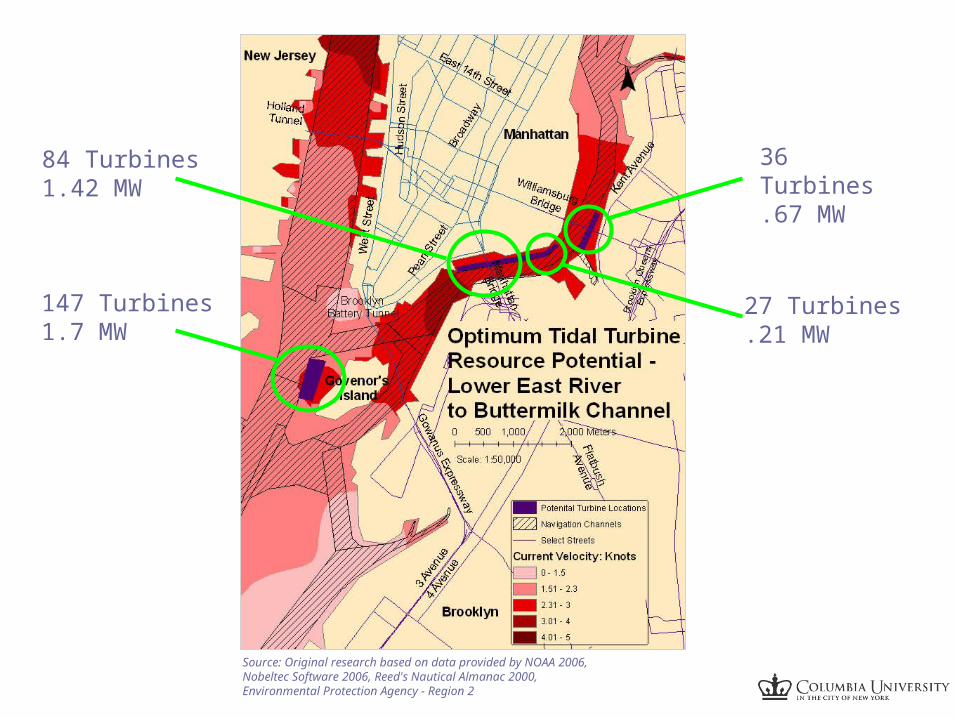
Source: Original research based on data provided by NOAA 2006,Nobeltec Software 2006, Reed's Nautical Almanac 2000, Environmental Protection Agency - Region 2
147 Turbines1.7 MW
36 Turbines.67 MW
84 Turbines1.42 MW
27 Turbines.21 MW
55
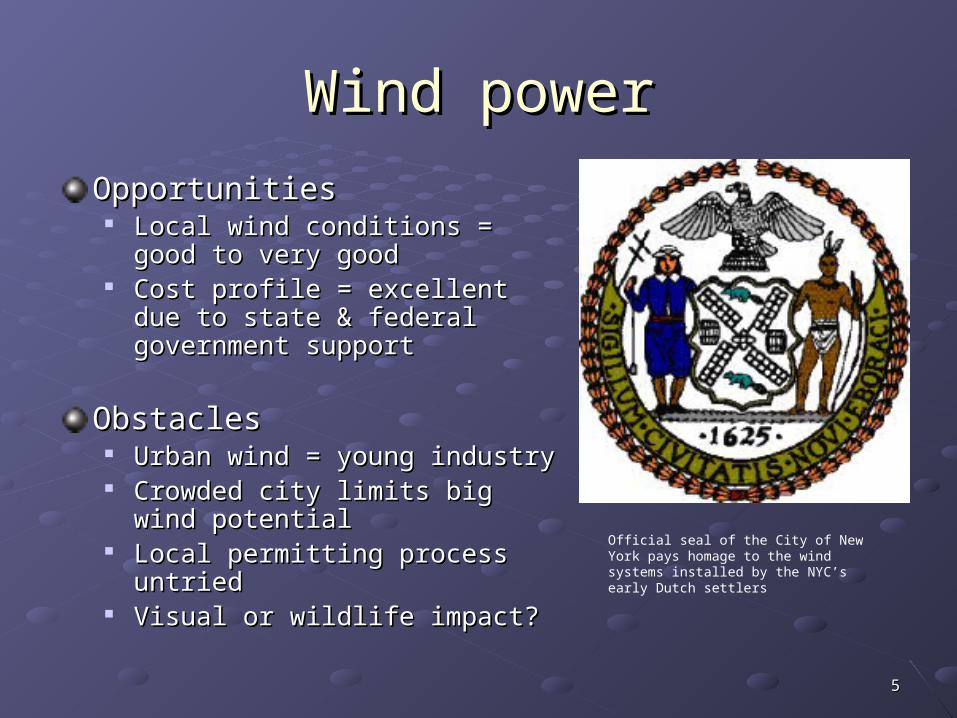
Wind powerWind power
OpportunitiesOpportunities Local wind conditions = good to Local wind conditions = good to
very goodvery good Cost profile = excellent due to state Cost profile = excellent due to state
& federal government support & federal government support
ObstaclesObstacles Urban wind = young industryUrban wind = young industry Crowded city limits big wind Crowded city limits big wind
potentialpotential Local permitting process untried Local permitting process untried Visual or wildlife impact?Visual or wildlife impact?
Official seal of the City of New York pays homage to the wind systems installed by the NYC’s early Dutch settlers
66
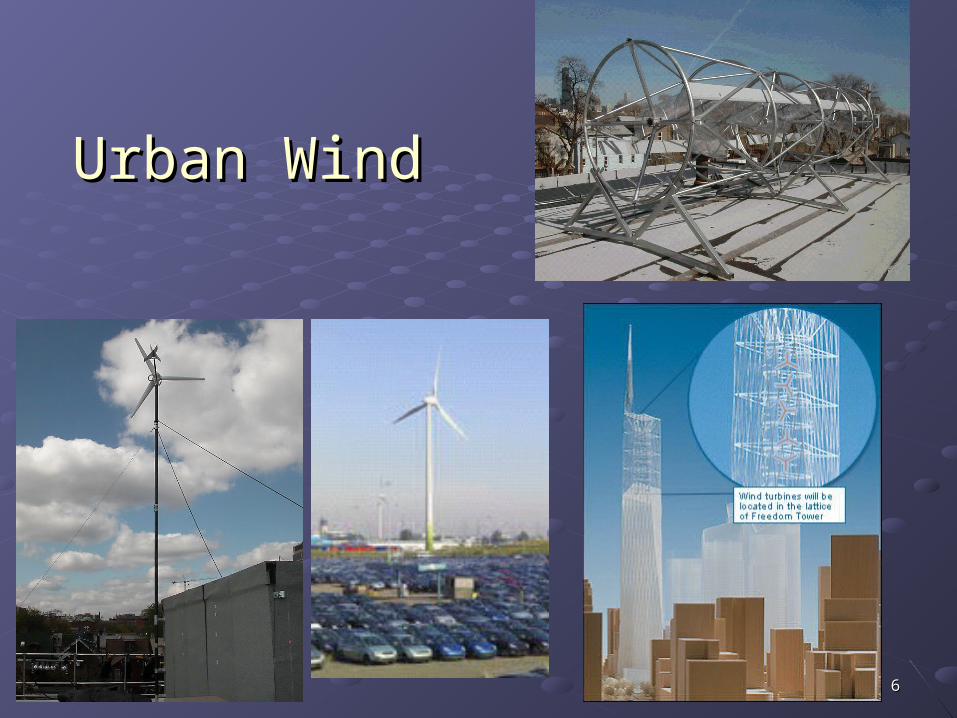
Urban WindUrban Wind
77
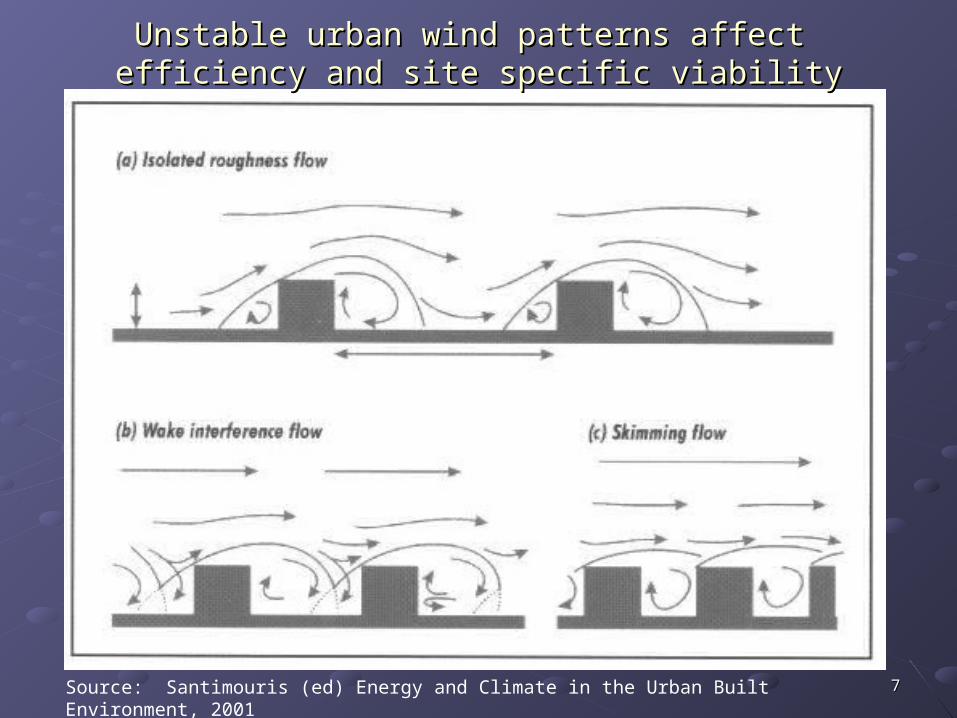
Unstable urban wind patterns affect Unstable urban wind patterns affect efficiency and site specific viabilityefficiency and site specific viability
Source: Santimouris (ed) Energy and Climate in the Urban Built Environment, 2001
88
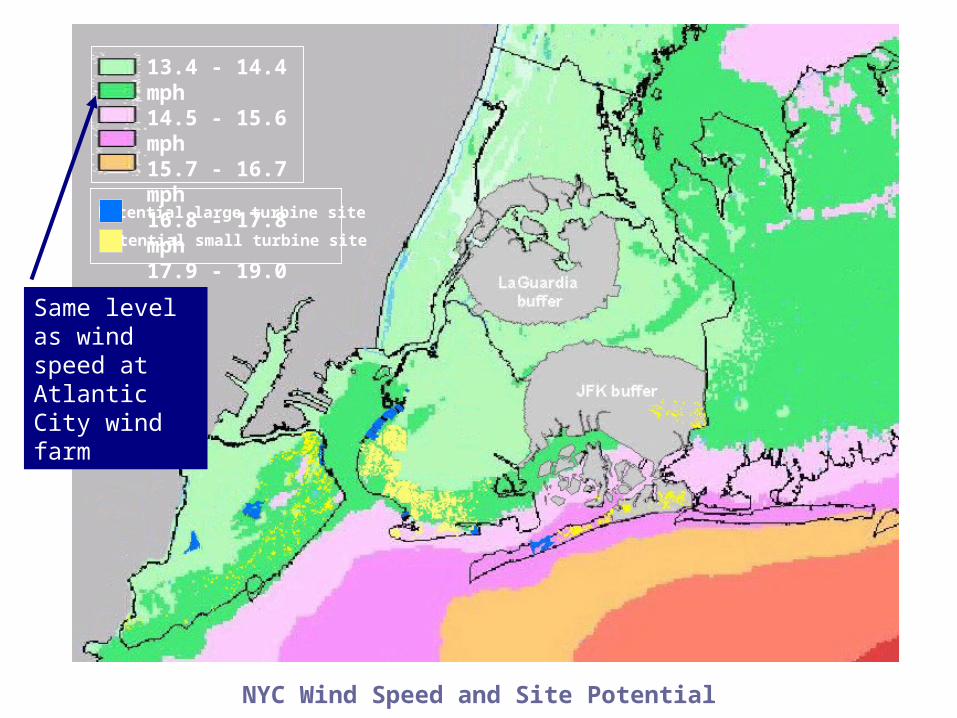
Resource PotentialResource Potential13.4 - 14.4 mph14.5 - 15.6 mph15.7 - 16.7 mph16.8 - 17.8 mph17.9 - 19.0 mph
Potential large turbine site
Potential small turbine site
NYC Wind Speed and Site Potential
Same level as wind speed at Atlantic City wind farm
99
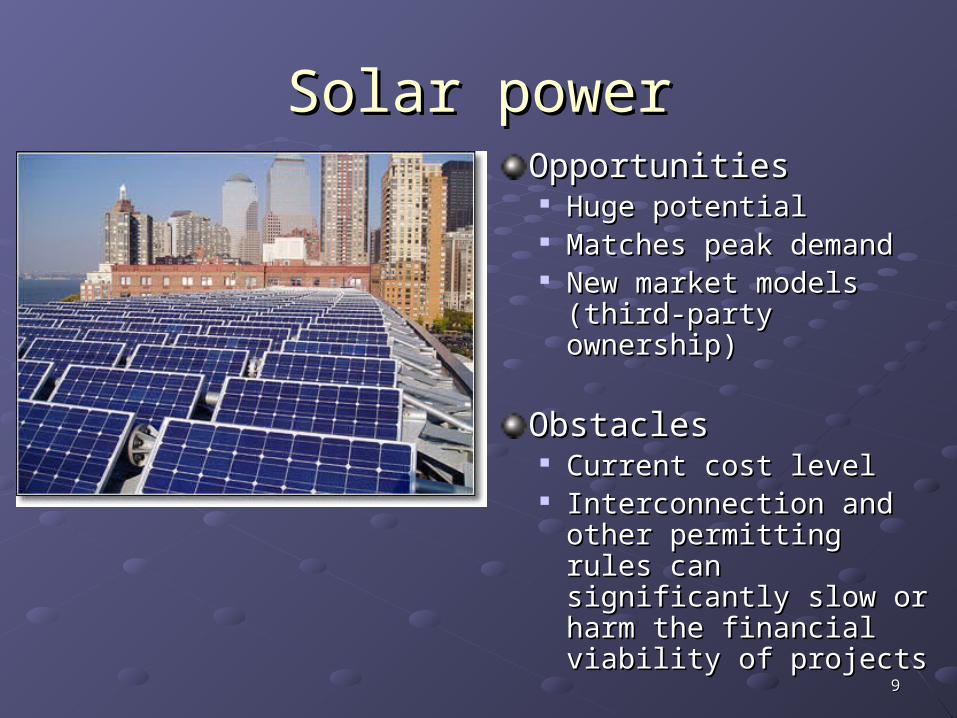
Solar powerSolar powerOpportunitiesOpportunities Huge potentialHuge potential Matches peak demandMatches peak demand New market models New market models
(third-party ownership) (third-party ownership)
ObstaclesObstacles Current cost levelCurrent cost level Interconnection and Interconnection and
other permitting rules other permitting rules can significantly slow or can significantly slow or harm the financial harm the financial viability of projects viability of projects
1010
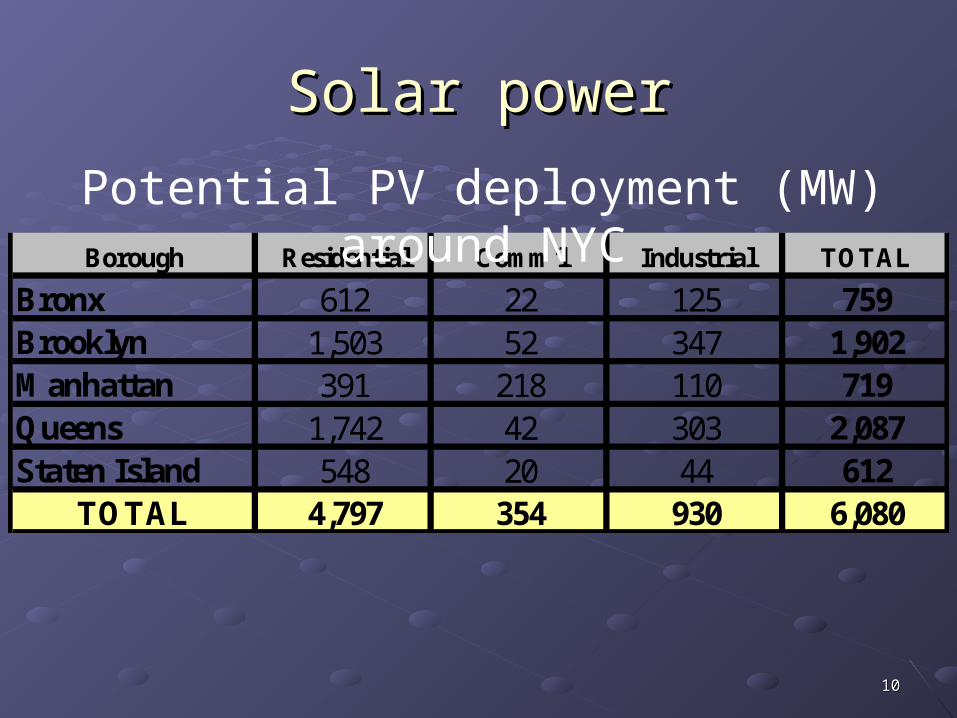
Solar powerSolar power
Borough Residential Comm'l Industrial TOTAL
Bronx 612 22 125 759Brooklyn 1,503 52 347 1,902Manhattan 391 218 110 719Queens 1,742 42 303 2,087Staten Island 548 20 44 612
TOTAL 4,797 354 930 6,080
Potential PV deployment (MW) around NYC
1111
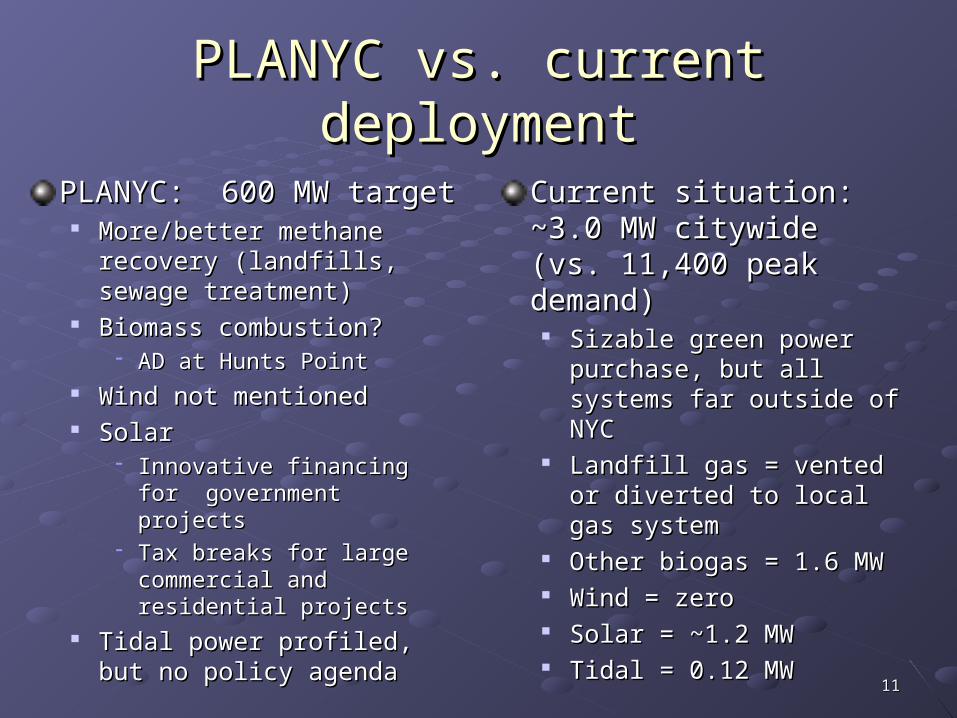
PLANYC vs. current deploymentPLANYC vs. current deployment
PLANYC: 600 MW targetPLANYC: 600 MW target More/better methane recovery More/better methane recovery
(landfills, sewage treatment)(landfills, sewage treatment) Biomass combustion?Biomass combustion?
AD at Hunts PointAD at Hunts Point Wind not mentioned Wind not mentioned SolarSolar
Innovative financing for Innovative financing for government projects government projects
Tax breaks for large Tax breaks for large commercial and residential commercial and residential projects projects
Tidal power profiled, but no Tidal power profiled, but no policy agendapolicy agenda
Current situation: ~3.0 Current situation: ~3.0 MW citywide (vs. 11,400 MW citywide (vs. 11,400 peak demand)peak demand)
Sizable green power Sizable green power purchase, but all systems purchase, but all systems far outside of NYCfar outside of NYC
Landfill gas = vented or Landfill gas = vented or diverted to local gas diverted to local gas system system
Other biogas = 1.6 MWOther biogas = 1.6 MW Wind = zero Wind = zero Solar = ~1.2 MWSolar = ~1.2 MW Tidal = 0.12 MWTidal = 0.12 MW
1212
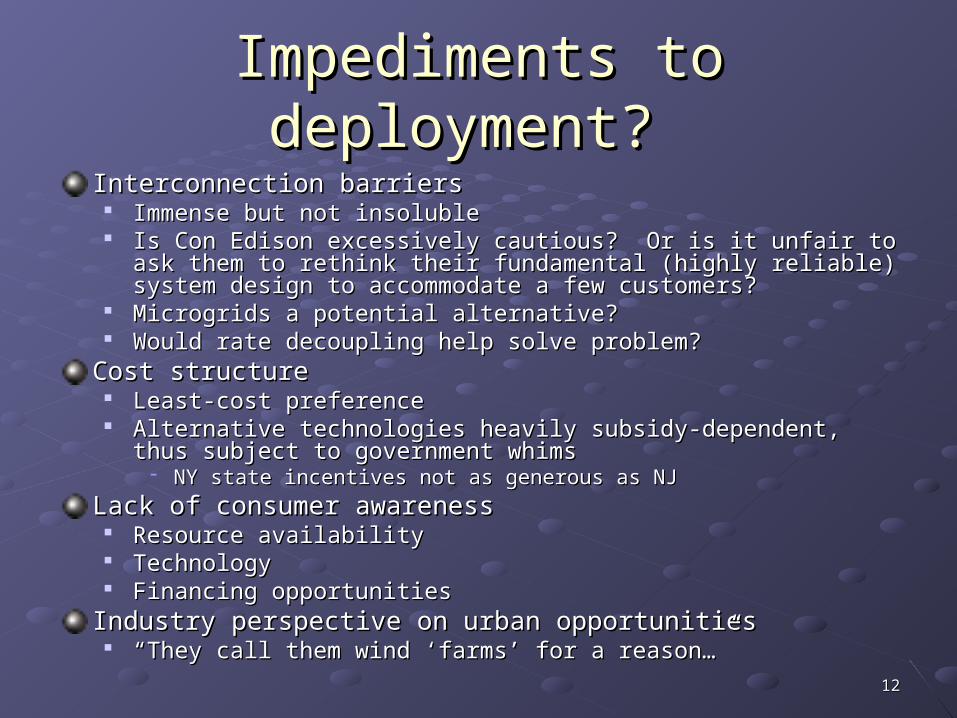
Impediments to deployment? Impediments to deployment?
Interconnection barriersInterconnection barriers Immense but not insolubleImmense but not insoluble Is Con Edison excessively cautious? Or is it unfair to ask them to Is Con Edison excessively cautious? Or is it unfair to ask them to
rethink their fundamental (highly reliable) system design to rethink their fundamental (highly reliable) system design to accommodate a few customers?accommodate a few customers?
Microgrids a potential alternative?Microgrids a potential alternative? Would rate decoupling help solve problem?Would rate decoupling help solve problem?
Cost structureCost structure Least-cost preferenceLeast-cost preference Alternative technologies heavily subsidy-dependent, thus subject to Alternative technologies heavily subsidy-dependent, thus subject to
government whimsgovernment whims NY state incentives not as generous as NJ NY state incentives not as generous as NJ
Lack of consumer awarenessLack of consumer awareness Resource availabilityResource availability TechnologyTechnology Financing opportunitiesFinancing opportunities
Industry perspective on urban opportunitiesIndustry perspective on urban opportunities ““They call them wind ‘farms’ for a reason…”They call them wind ‘farms’ for a reason…”
1414
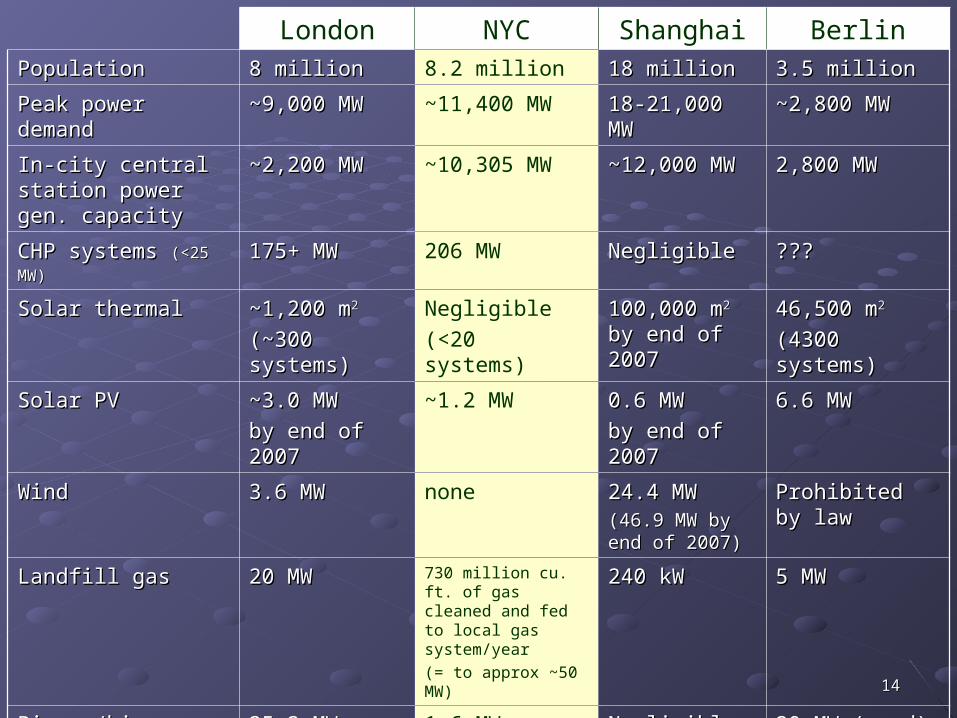
London NYC Shanghai Berlin
PopulationPopulation 8 million8 million 8.2 million 18 million18 million 3.5 million3.5 million
Peak power demandPeak power demand ~9,000 MW~9,000 MW ~11,400 MW 18-21,000 MW18-21,000 MW ~2,800 MW~2,800 MW
In-city central station In-city central station power gen. capacitypower gen. capacity
~2,200 MW~2,200 MW ~10,305 MW ~12,000 MW~12,000 MW 2,800 MW2,800 MW
CHP systems CHP systems (<25 MW)(<25 MW) 175+ MW 175+ MW 206 MW NegligibleNegligible ??????
Solar thermalSolar thermal ~1,200 m~1,200 m22
(~300 systems)(~300 systems)
Negligible
(<20 systems)
100,000 m100,000 m22 by by end of 2007end of 2007
46,500 m46,500 m22
(4300 systems)(4300 systems)
Solar PVSolar PV ~3.0 MW ~3.0 MW
by end of 2007by end of 2007
~1.2 MW 0.6 MW 0.6 MW
by end of 2007by end of 2007
6.6 MW6.6 MW
WindWind 3.6 MW3.6 MW none 24.4 MW24.4 MW(46.9 MW by end (46.9 MW by end of 2007)of 2007)
Prohibited by lawProhibited by law
Landfill gasLandfill gas 20 MW20 MW 730 million cu. ft. of gas cleaned and fed to local gas system/year
(= to approx ~50 MW)
240 kW240 kW 5 MW5 MW
Biogas/bio-combust?Biogas/bio-combust? 35.3 MW biogas35.3 MW biogas 1.6 MW biogas NegligibleNegligible 20 MW (wood)20 MW (wood)
Other WTEOther WTE 61 MW61 MW NYC does not receive any energy generated from the combustion of NYC waste at Newark and Hempstead WTE
NoneNone
GeothermalGeothermal ???? <10 systems ???? 1400 systems1400 systems


![tilting@windmills - · PDF filemaking sure they harness it and then sell it on to us ... “We can see two [turbines] from here, ... for people to conserve energy](https://static.fdocuments.in/doc/165x107/5ab1861d7f8b9a1d168cc67a/tiltingwindmills-sure-they-harness-it-and-then-sell-it-on-to-us-we-can.jpg)