1 Thinking Visually. 2 Diagramming for change Change produces opportunities for organisations, but...
23
1 Thinking Visually
-
date post
19-Dec-2015 -
Category
Documents
-
view
213 -
download
0
Transcript of 1 Thinking Visually. 2 Diagramming for change Change produces opportunities for organisations, but...

1
Thinking Visually

2
Diagramming for change
• Change produces opportunities for organisations, but it can also provides numerous problems.
• When evaluating new ideas the “pros” and “cons” must be identified and considered thoroughly.
• Some diagrams which aid the evaluation are:– Force Field diagram
– SWOT diagram

3
Force Field Diagram
• The force field diagram has proved to be of enormous benefit to industries faced with major change.
• It can be very useful when making a decision about the introduction of a new product or service.
• Here the aim is to highlight valid reasons for the introduction and to be alerted to possible restraining forces, some of which if not taken into account could lead to the failure of a planned venture or innovation.

4
Force Field Diagram continued
• There are two types of forces affecting change: driving forces and restraining forces.
• Driving forces: People who are committed to a plan, and who see valid reasons for moving away from the established way of doing things.
• Restraining forces: People who question change, or who are totally opposed to it. They will give reasons for serious questioning or outright opposition.

5
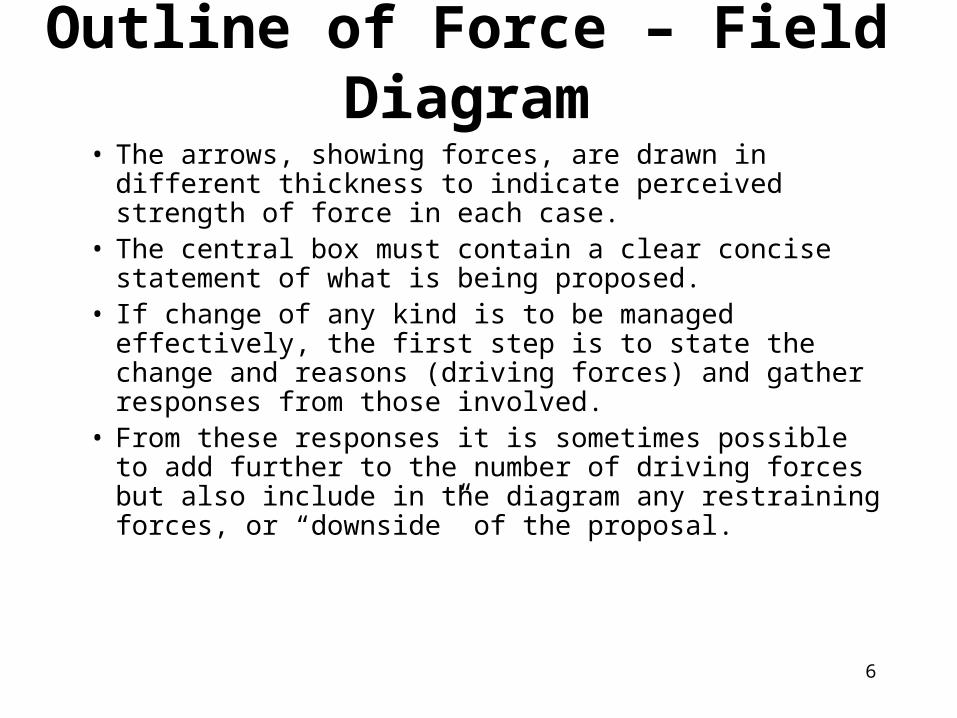
Outline of Force – Field Diagram
The proposed change or new idea (opportunity)
Driving forces
Restraining forces
6
• The arrows, showing forces, are drawn in different thickness to indicate perceived strength of force in each case.
• The central box must contain a clear concise statement of what is being proposed.
• If change of any kind is to be managed effectively, the first step is to state the change and reasons (driving forces) and gather responses from those involved.
• From these responses it is sometimes possible to add further to the number of driving forces but also include in the diagram any restraining forces, or “downside” of the proposal.
Outline of Force – Field Diagram
7
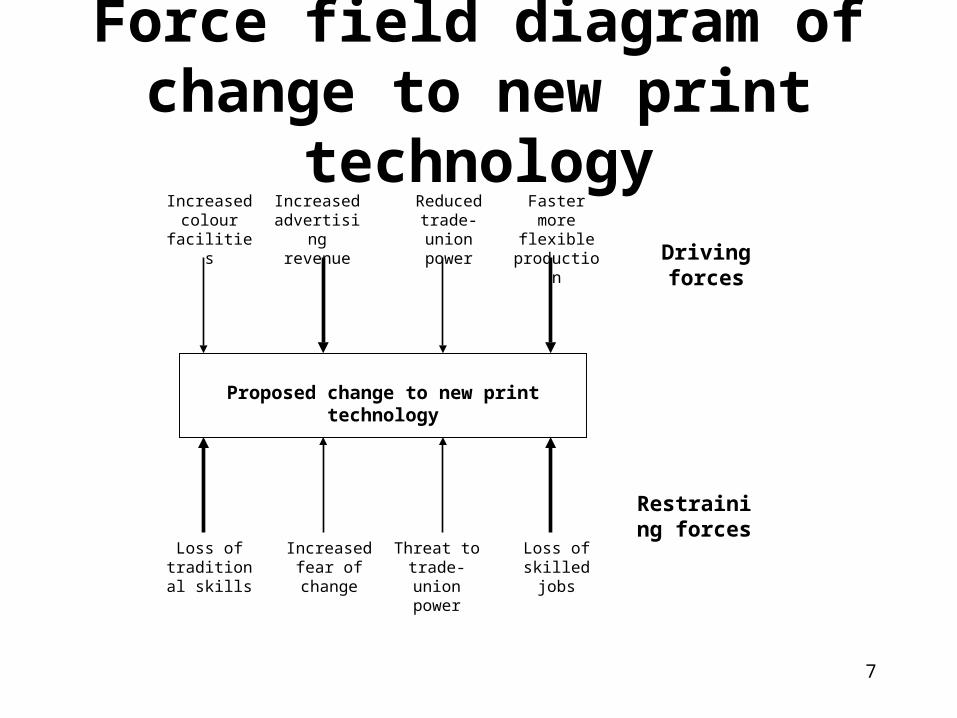
Force field diagram of change to new print technology
Proposed change to new print technology
Driving forces
Restraining forces
Increased colour
facilities
Increased advertising
revenue
Reduced trade-union
power
Faster more flexible
production
Loss of traditional
skills
Increased fear of change
Threat to trade-union
power
Loss of skilled jobs

8
Force field diagram of change to new print technology
• The diagram clearly shows the dynamics of the proposed change.
• The same issue, such as the reduction in union power, can be both a driving and restraining force.

9
Business purposes of the Force-Field diagram
• The force-field diagram has a number of uses, but probably its widest application is in the area of change management.
• It has applications also in the development of new products, or for helping people decide upon important moves in their lives.

10
SWOT Diagram
• SWOT stands for strengths, weaknesses, opportunities, and threats.
• SWOT is a form of window diagram, which is often of the four-pane model.
• The SWOT diagram has a very wide variety of uses such as design decisions, analysis of new products and technology etc.

11
SWOT Diagram Layout
SWOT
Strengths Weaknesses
Opportunities Threats

12
SWOT Diagram continued
• The spaces within the box represent an area, and when a threat has been recognized alternatively as an opportunity it can be transferred into the opportunities box.
• Thus nothing is absolute and over time the diagram has to be reevaluated.
• The SWOT diagram is a very versatile tool because of the wide range of circumstances can be captured within the area of each window.

13
SWOT: sales team working remotely
•Effective, reliable product lines
•Respect of customers
•Relatively secure markets
•Stable workforce
•Poor networking skills
•Inadequate training
•Competition between sales areas leading to little sharing of ideas
•Too little personal contact
•To decentralize more responsibility to gain quicker customer response
•To generate new markets by more sharing of ideas between areas
•Build more on idea of virtual team-working
•Lack of emergency cover when isolated member absent
•Little obvious corporate image
•Garbled network information leads to lost sales
Strengths Weaknesses
Opportunities Threats

14
Organisation Chart
• Organisation charts are diagrams that show how people, operations, functions, equipment, and activities are organized, arranged, structured and/or interrelated.
• Charts generally progress from top to bottom.

15
Organsation Chart Type 1
• This chart contains information on major organisational units.
• Charts with this type of information show the fundamental structure of an organisation.
• They are applicable to any type of organisation, whether a corporation, a government, a nonprofit organisation, or the military.

16
17
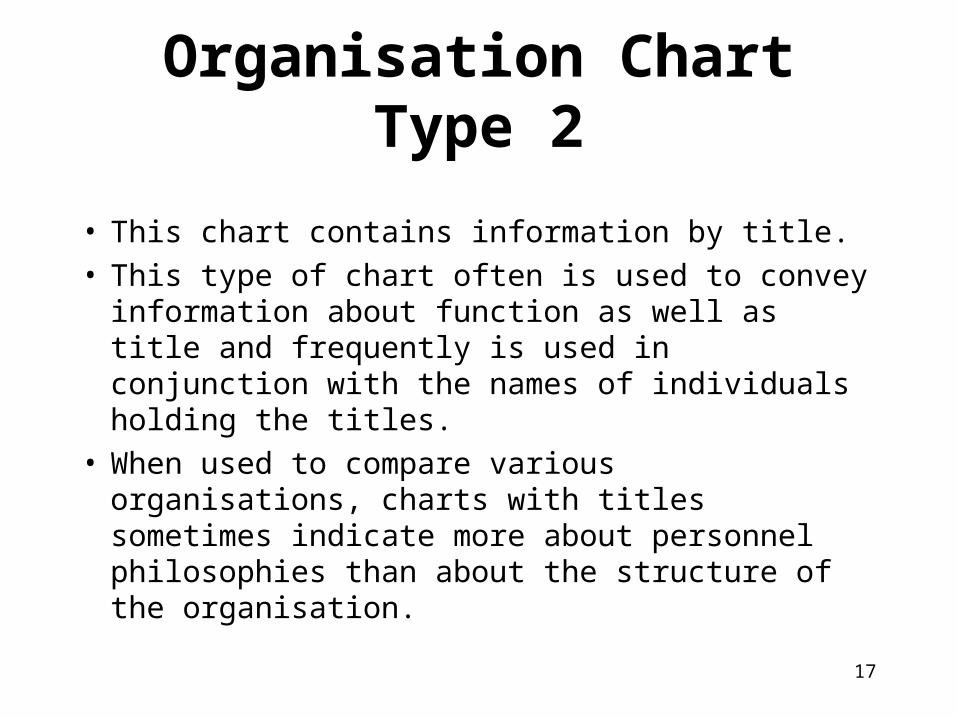
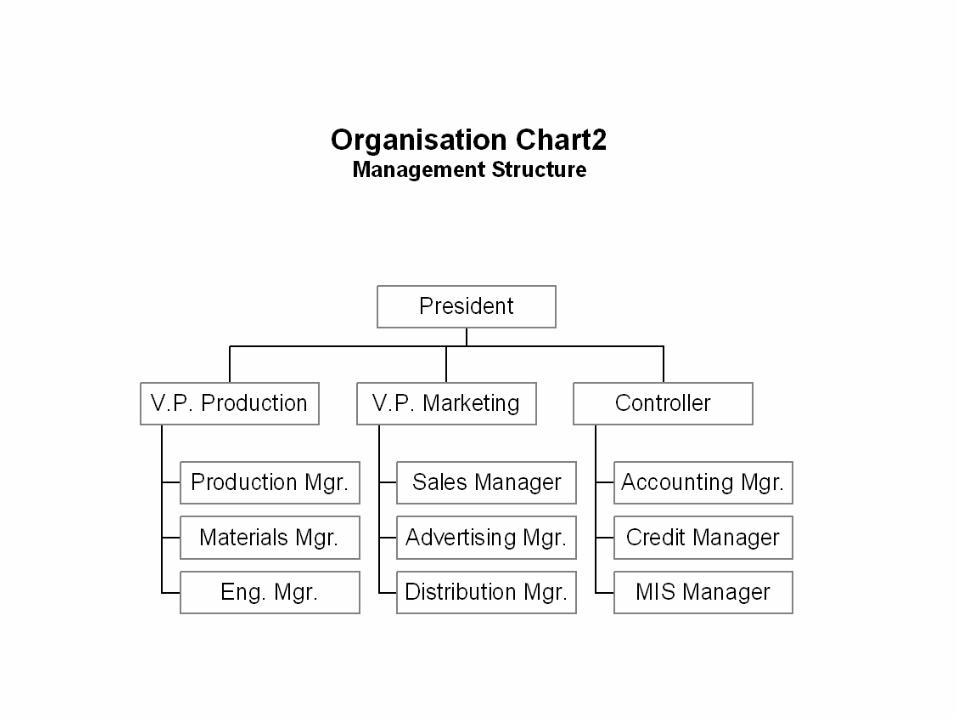
Organisation Chart Type 2
• This chart contains information by title.• This type of chart often is used to convey
information about function as well as title and frequently is used in conjunction with the names of individuals holding the titles.
• When used to compare various organisations, charts with titles sometimes indicate more about personnel philosophies than about the structure of the organisation.
18

19
Organisation Chart Type 3
• In some cases individuals report to two or more people for various aspects of their responsibilities.
• A widely accepted method to depict this on an organisation chart is to show the direct relationship with a solid line and the indirect relationship with a dotted line.

20

21
Organisation Chart Type 4
• When a key topic is strategy, organisation charts can be used to condense a large amount of data into a concise, single-page format.
• Corporate strategies have many components that balance the competing interests of customers, employees, and shareholders.
• These components are held together by single vision or “driving force” that usually is articulated by the CEO and that might include strategies for finance, marketing, manufacturing, and research and development.

22

23
Organisation Chart Type 4• The strategic plan should articulate clear long-term
objectives from which specific near-term goals are derived.• The way to achieve these goals and objectives most
effectively is by using an organisation chart. • It helps to sort related ideas into groupings.• The visual display of relationships helps ensure that the
corporate vision together with the related objectives and strategies are in alignment.
• The organisation chart format ensures completeness, tests for reasonableness, and highlights interrelationships and dependencies among the elements of the strategic plan.


![Diagramming Review II - WCUSD15 · about sentence diagramming. classes are excited ... -ed, -d, -t, or ... Diagramming Review II [Compatibility Mode]](https://static.fdocuments.in/doc/165x107/5af7254d7f8b9a9271913b29/diagramming-review-ii-sentence-diagramming-classes-are-excited-ed-d-t.jpg)