1 The Web: some jargon r Web page: m consists of “objects” m addressed by a URL r Most Web pages...
94
1 The Web: some jargon Web page: consists of “objects” addressed by a URL Most Web pages consist of: base HTML page, and several referenced objects. URL has two components: host name and path name: User agent for Web is called a browser: MS Internet Explorer Netscape Communicator Server for Web is called Web server: Apache (public domain) MS Internet Information Server www.someSchool.edu/someDept/pic.gif
-
Upload
erika-knight -
Category
Documents
-
view
218 -
download
0
Transcript of 1 The Web: some jargon r Web page: m consists of “objects” m addressed by a URL r Most Web pages...

1
The Web: some jargon
Web page: consists of “objects” addressed by a URL
Most Web pages consist of: base HTML page, and several referenced
objects.
URL has two components: host name and path name:
User agent for Web is called a browser: MS Internet Explorer Netscape
Communicator
Server for Web is called Web server: Apache (public
domain) MS Internet
Information Server
www.someSchool.edu/someDept/pic.gif

2
The Web: the http protocol
http: hypertext transfer protocol
Web’s application layer protocol
client/server model client: browser that
requests, receives, “displays” Web objects
server: Web server sends objects in response to requests
http1.0: RFC 1945 http1.1: RFC 2068
PC runningExplorer
Server running
NCSA Webserver
Mac runningNavigator
http request
http re
quest
http response
http re
sponse

3
The http protocol: more
http: TCP transport service:
client initiates TCP connection (creates socket) to server, port 80
server accepts TCP connection from client
http messages (application-layer protocol messages) exchanged between browser (http client) and Web server (http server)
TCP connection closed
http is “stateless” server maintains no
information about past client requests
Protocols that maintain “state” are complex!
past history (state) must be maintained
if server/client crashes, their views of “state” may be inconsistent, must be reconciled
aside
4
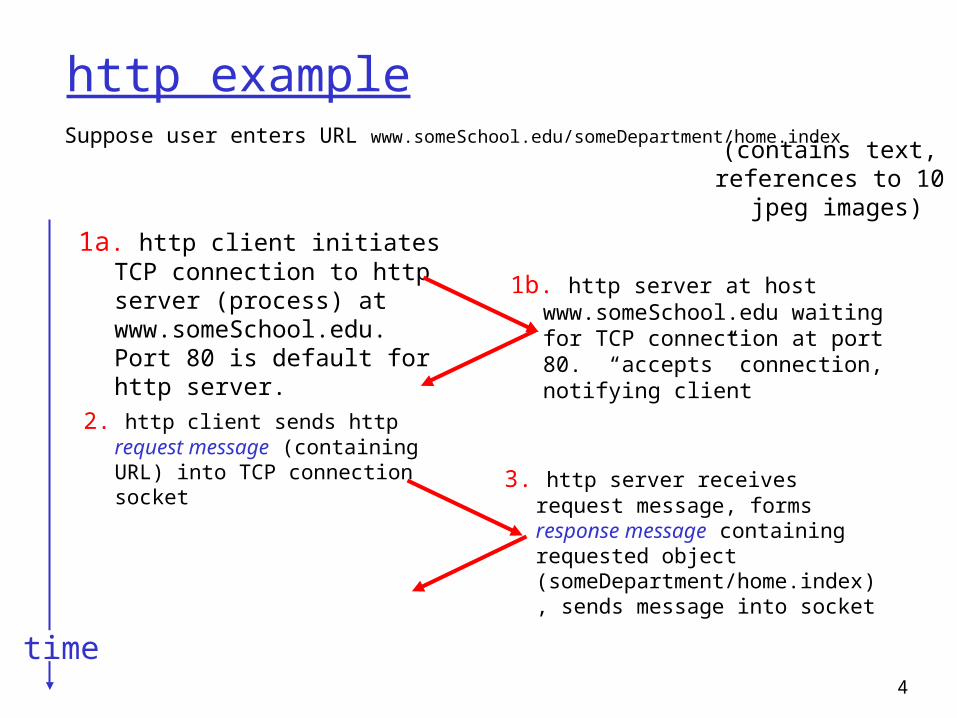
http exampleSuppose user enters URL www.someSchool.edu/someDepartment/home.index
1a. http client initiates TCP connection to http server (process) at www.someSchool.edu. Port 80 is default for http server.
2. http client sends http request message (containing URL) into TCP connection socket
1b. http server at host www.someSchool.edu waiting for TCP connection at port 80. “accepts” connection, notifying client
3. http server receives request message, forms response message containing requested object (someDepartment/home.index), sends message into socket
time
(contains text, references to 10
jpeg images)
5
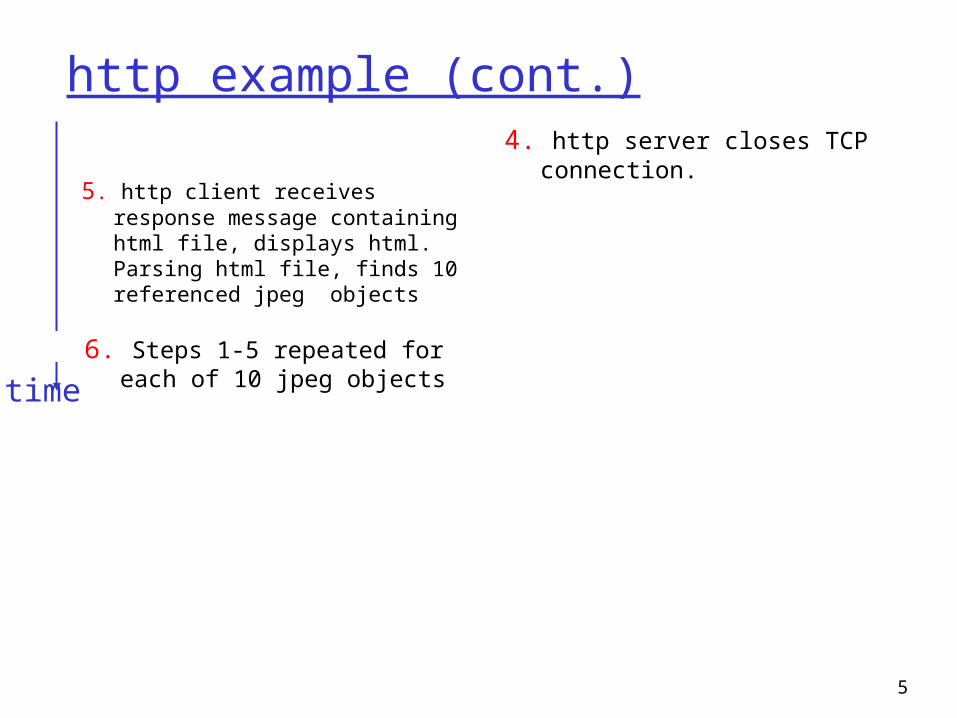
http example (cont.)
5. http client receives response message containing html file, displays html. Parsing html file, finds 10 referenced jpeg objects
6. Steps 1-5 repeated for each of 10 jpeg objects
4. http server closes TCP connection.
time

6
Non-persistent and persistent connections
Non-persistent HTTP/1.0 server parses
request, responds, and closes TCP connection
2 RTTs to fetch each object
Each object transfer suffers from slow start
Persistent default for HTTP/1.1 on same TCP
connection: server, parses request, responds, parses new request,..
Client sends requests for all referenced objects as soon as it receives base HTML.
Fewer RTTs and less slow start.But most 1.0 browsers use
parallel TCP connections.

7
http message format: request
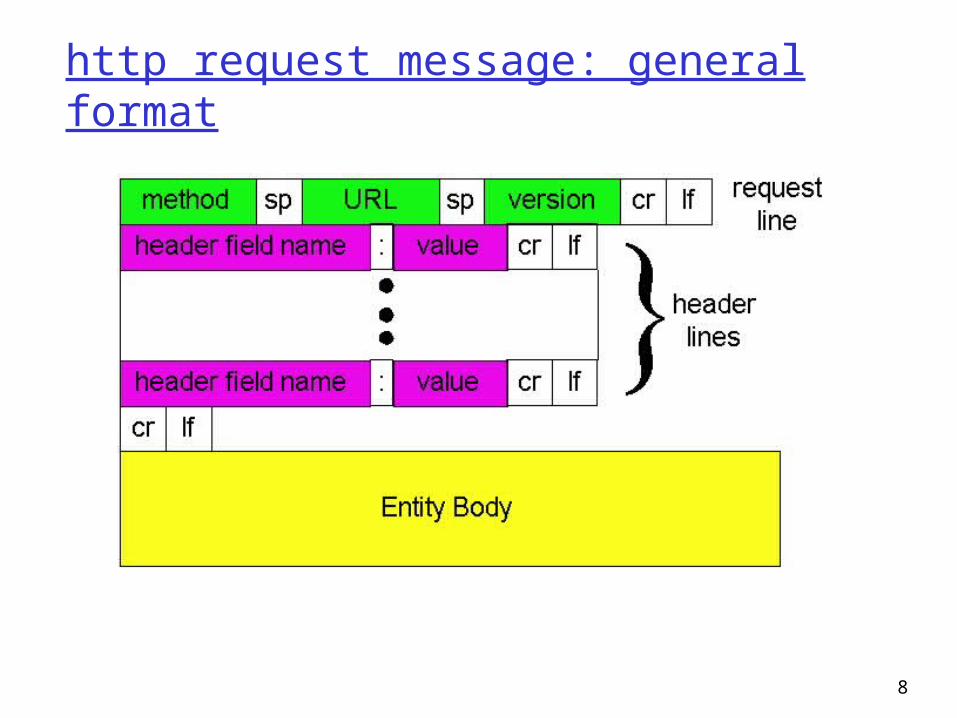
two types of http messages: request, response http request message:
ASCII (human-readable format)
GET /somedir/page.html HTTP/1.0 User-agent: Mozilla/4.0 Accept: text/html, image/gif,image/jpeg Accept-language:fr
(extra carriage return, line feed)
request line(GET, POST,
HEAD commands)
header lines
Carriage return, line feed
indicates end of message
8
http request message: general format
9
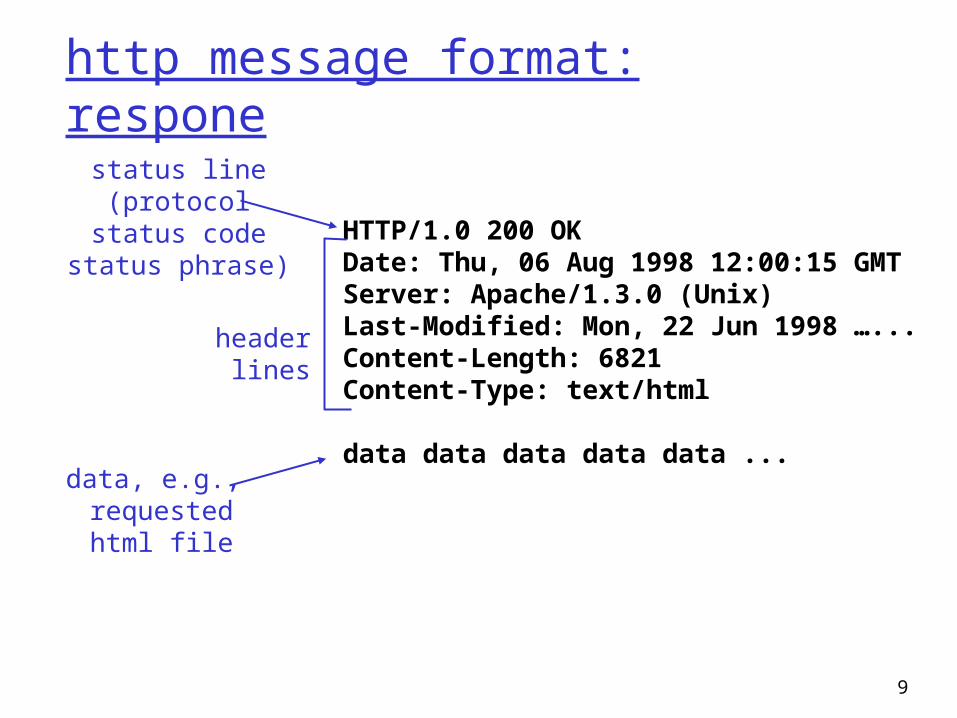
http message format: respone
HTTP/1.0 200 OK Date: Thu, 06 Aug 1998 12:00:15 GMT Server: Apache/1.3.0 (Unix) Last-Modified: Mon, 22 Jun 1998 …... Content-Length: 6821 Content-Type: text/html data data data data data ...
status line(protocol
status codestatus phrase)
header lines
data, e.g., requestedhtml file

10
http response status codes
200 OK request succeeded, requested object later in this
message
301 Moved Permanently requested object moved, new location specified later
in this message (Location:)
400 Bad Request request message not understood by server
404 Not Found requested document not found on this server
505 HTTP Version Not Supported
In first line in server->client response message.A few sample codes:

11
Trying out http (client side) for yourself
1. Telnet to your favorite Web server:
Opens TCP connection to port 80(default http server port) at www.eurecom.fr.Anything typed in sent to port 80 at www.eurecom.fr
telnet www.eurecom.fr 80
2. Type in a GET http request:
GET /~ross/index.html HTTP/1.0 By typing this in (hit carriagereturn twice), you sendthis minimal (but complete) GET request to http server
3. Look at response message sent by http server!

12
User-server interaction: authentication
Authentication goal: control access to server documents
stateless: client must present authorization in each request
authorization: typically name, password authorization: header
line in request if no authorization
presented, server refuses access, sendsWWW authenticate:
header line in response
client server
usual http request msg401: authorization req.
WWW authenticate:
usual http request msg
+ Authorization:lineusual http response
msg
usual http request msg
+ Authorization:lineusual http response
msg
time
Browser caches name & password sothat user does not have to repeatedly enter it.

13
User-server interaction: cookies
server sends “cookie” to client in response mstSet-cookie: 1678453
client presents cookie in later requestscookie: 1678453
server matches presented-cookie with server-stored info authentication remembering user
preferences, previous choices
client server
usual http request msgusual http response
+Set-cookie: #
usual http request msg
cookie: #usual http response
msg
usual http request msg
cookie: #usual http response msg
cookie-spectificaction
cookie-spectificaction

14
User-server interaction: conditional GET
Goal: don’t send object if client has up-to-date stored (cached) version
client: specify date of cached copy in http requestIf-modified-since:
<date> server: response contains
no object if cached copy up-to-date: HTTP/1.0 304 Not
Modified
client server
http request msgIf-modified-since:
<date>
http responseHTTP/1.0
304 Not Modified
object not
modified
http request msgIf-modified-since:
<date>
http responseHTTP/1.1 200 OK
…
<data>
object modified
15
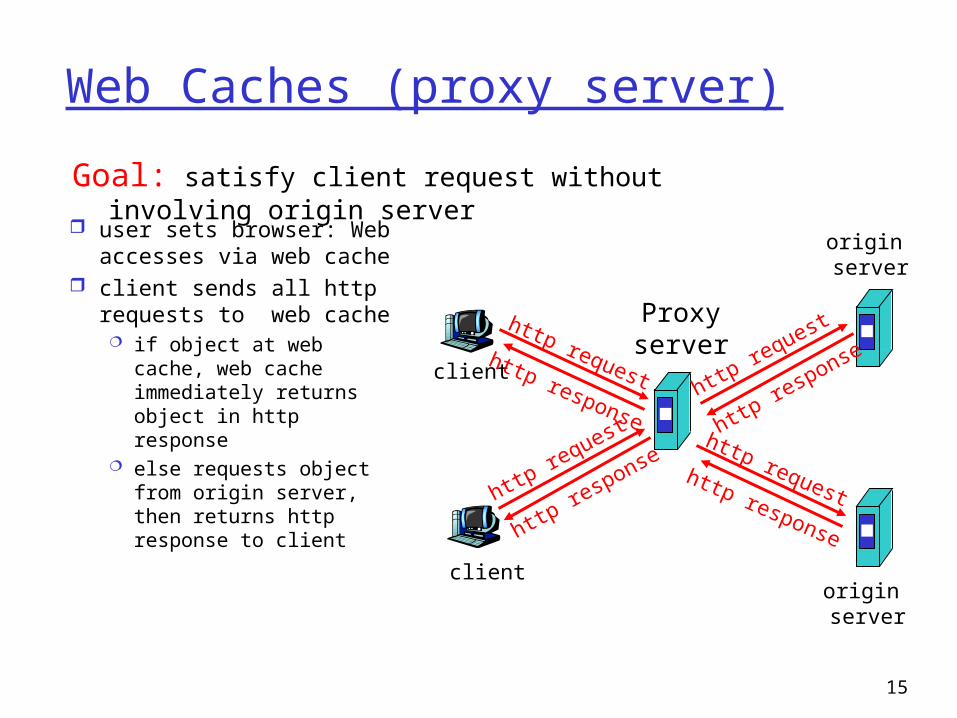
Web Caches (proxy server)
user sets browser: Web accesses via web cache
client sends all http requests to web cache if object at web cache,
web cache immediately returns object in http response
else requests object from origin server, then returns http response to client
Goal: satisfy client request without involving origin server
client
Proxyserver
client
http request
http re
quest
http response
http re
sponse
http re
quest
http re
sponse
http requesthttp response
origin server
origin server

16
Why Web Caching?
Assume: cache is “close” to client (e.g., in same network)
smaller response time: cache “closer” to client
decrease traffic to distant servers link out of
institutional/local ISP network often bottleneck
originservers
public Internet
institutionalnetwork 10 Mbps LAN
1.5 Mbps access link
institutionalcache
17
참고 자료 1: web caching

18
Large-Scale Web Caching and Content Delivery
Jeff Chase

19
Caching for a Better Web
Performance is a major concern in the Web
Proxy caching is the most widely used method to improve Web performance Duplicate requests to the same document
served from cache Hits reduce latency, network utilization,
server load Misses increase latency (extra hops)
Clients Proxy Cache Servers
Hits
Misses Misses
Internet
[Source: Geoff Voelker]

20
Cache Effectiveness
Previous work has shown that hit rate increases with population size [Duska et al. 97, Breslau et al. 98]
However, single proxy caches have practical limits Load, network topology, organizational
constraints One technique to scale the client
population is to have proxy caches cooperate
[Source: Geoff Voelker]

21
Cooperative Web Proxy Caching
Sharing and/or coordination of cache state among multiple Web proxy cache nodes
Effectiveness of proxy cooperation depends on:
Inter-proxy communication distance Size of client population served
Proxy utilization and load balance
Clients
ClientsProxy
Clients
Internet
[Source: Geoff Voelker]

22
Resolve misses through the parent.
Hierarchical Caches
INTERNET
clients
origin Web site(e.g., U.S. Congress)
clientsclients
Idea: place caches at exchange or switching points in the network, and cache at each level of the hierarchy.
upstream
downstream
23
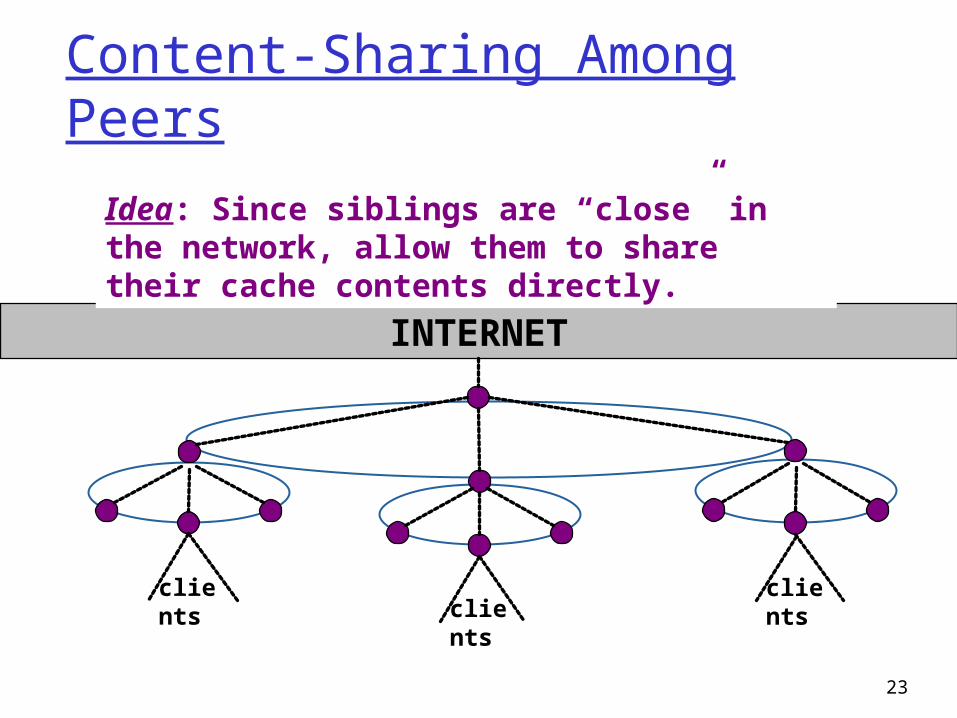
Content-Sharing Among Peers
INTERNET
clientsclients
clients
Idea: Since siblings are “close” in the network, allow them to share their cache contents directly.
24
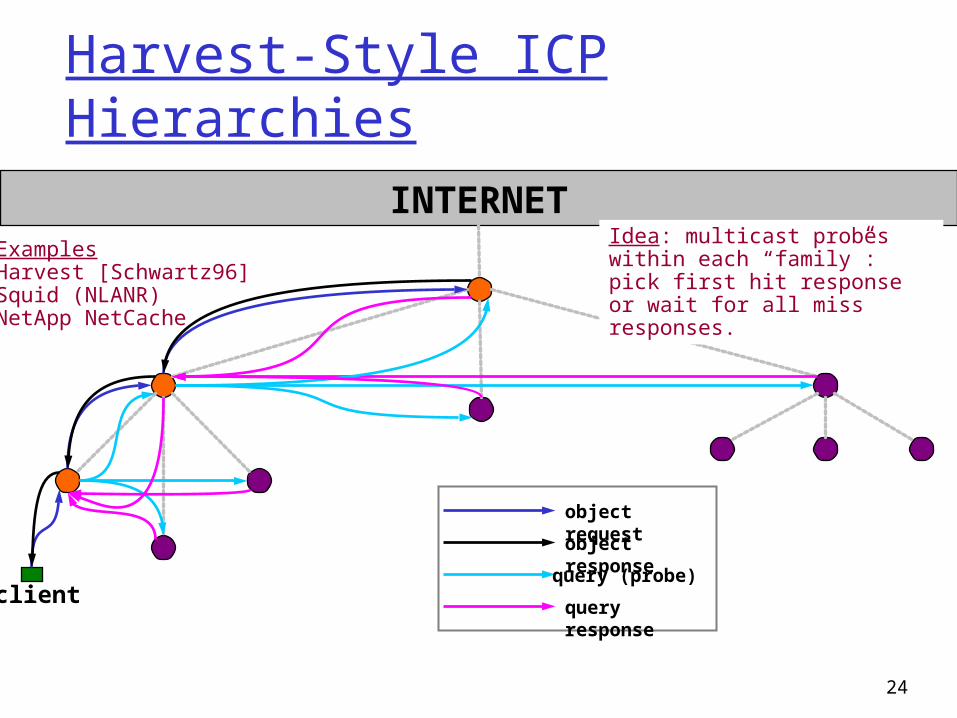
Harvest-Style ICP Hierarchies
INTERNET
clientquery (probe)
query response
object request
object response
ExamplesHarvest [Schwartz96]Squid (NLANR)NetApp NetCache
Idea: multicast probes within each “family”: pick first hit response or wait for all miss responses.

25
Issues for Cache Hierarchies
With ICP: query traffic within “families” (size n)• Inter-sibling ICP traffic (and aggregate overhead) is quadratic
with n.• Query-handling overhead grows linearly with n.
miss latency• Object passes through every cache from origin to
client: deeper hierarchies scale better, but impose higher latencies.
storage• A recently-fetched object is replicated at every level of
the tree. effectiveness
• Interior cache benefits are limited by capacity if objects are not likely to live there long (e.g., LRU).
26
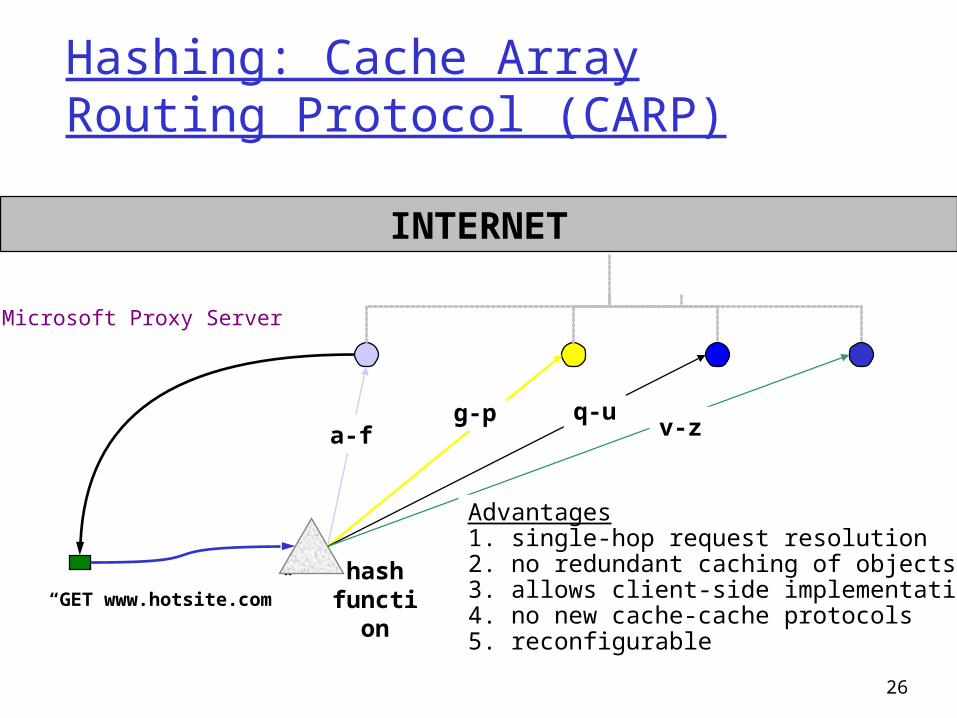
Hashing: Cache Array Routing Protocol (CARP)
INTERNET
“GET www.hotsite.com”
Microsoft Proxy Server
g-pv-z
q-ua-f
Advantages1. single-hop request resolution2. no redundant caching of objects3. allows client-side implementation4. no new cache-cache protocols5. reconfigurable
hashfunction

27
Issues for CARP
no way to exploit network locality at each level• e.g., relies on local browser caches to absorb repeats
load balancing hash can be balanced and/or weighted with a load factor
reflecting the capacity/power of each server must rebalance on server failures
• Reassigns (1/n)th of cached URLs for array size n.• URLs from failed server are evenly distributed among the
remaining n-1 servers.
miss penalty and cost to compute the hash• In CARP, hash cost is linear in n: hash with each node
and pick the “winner”.

28
Directory-based: Summary Cache for ICP Idea: each caching server replicates the cache
directory (“summary”) of each of its peers (e.g., siblings).
• [Cao et. al. Sigcomm98]
Query a peer only if its local summary indicates a hit. To reduce storage overhead for summaries, implement
the summaries compactly using Bloom Filters.– May yield false hits (e.g., 1%), but not false misses.
– Each summary is three orders of magnitude smaller than the cache itself, and can be updated by multicasting just the flipped bits.
29
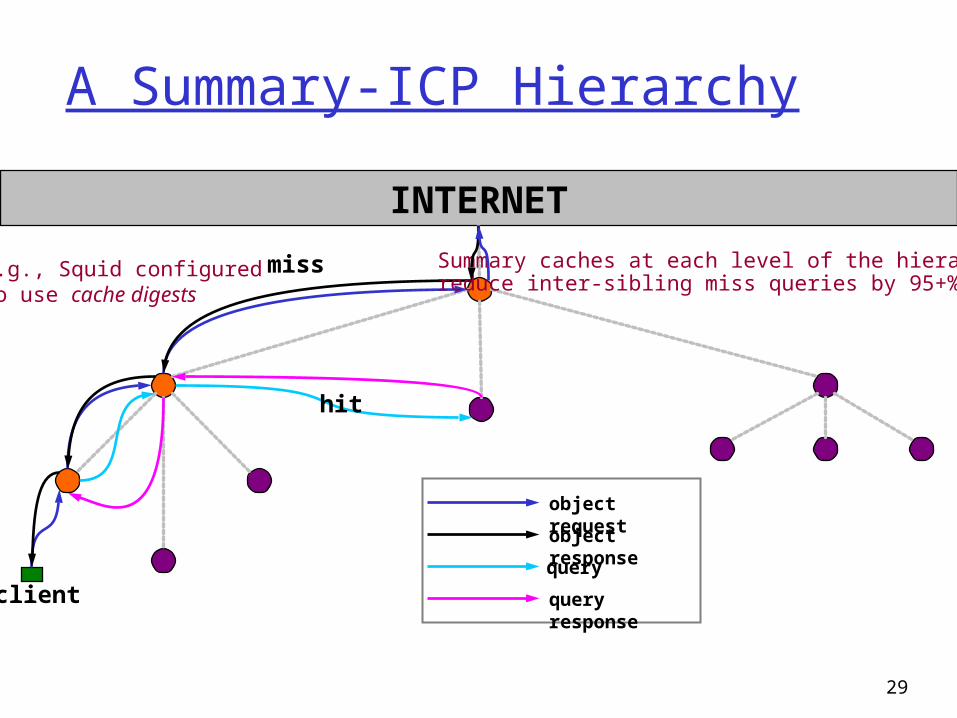
A Summary-ICP Hierarchy
INTERNET
clientquery
query response
object request
object response
Summary caches at each level of the hierarchyreduce inter-sibling miss queries by 95+%.
hit
misse.g., Squid configuredto use cache digests

30
Issues for Directory-Based Caches
Servers update their summaries lazily.• Update when “new” entries exceed some
threshold percentage.• Update delays may yield false hits and/or false
misses. Other ways to reduce directory size?
• Vicinity cache [Gadde/Chase/Rabinovich98]• Subsetting by popularity
[Gadde/Chase/Rabinovich97] What are the limits to scalability?
• If we grow the number of peers?• If we grow the cache sizes?

31
On the Scale and Performance.... [Wolman/Voelker/.../Levy99] is a key paper in
this area over the last few years. first negative result in SOSP (?) illustrates tools for evaluating wide-area systems
• simulation and analytical modeling illustrates fundamental limits of caching
• benefits dictated by reference patterns and object rate of change
• forget about capacity, and assume ideal cooperation ties together previous work in the field
• wide-area cooperative caching strategies• analytical models for Web workloads
best traces
32
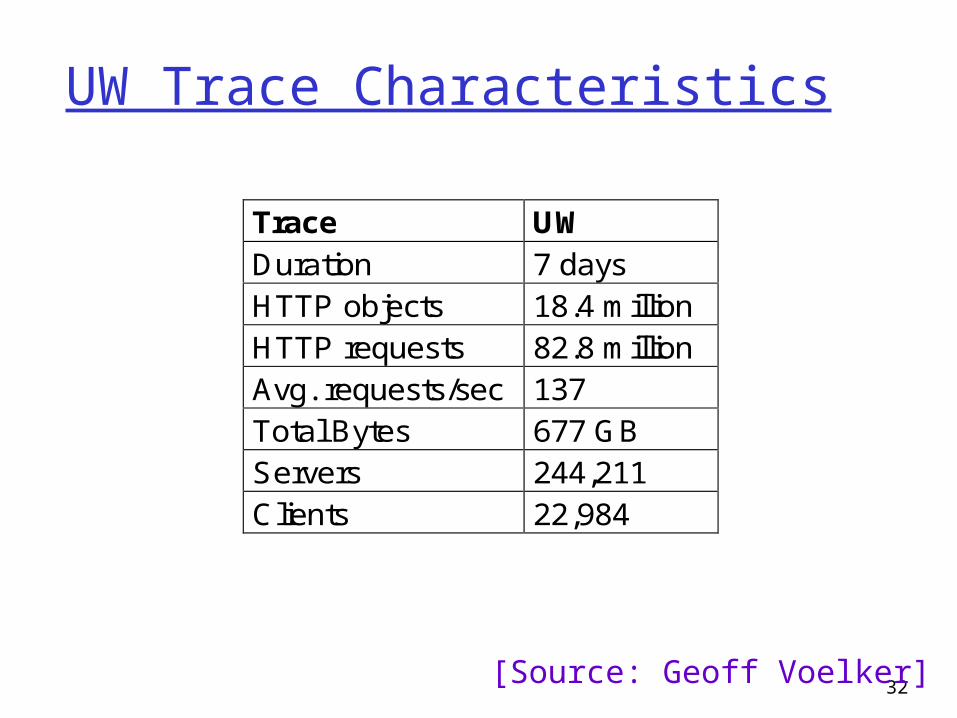
UW Trace Characteristics
Trace UW
Duration 7 daysHTTP objects 18.4 millionHTTP requests 82.8 millionAvg. requests/sec 137Total Bytes 677 GBServers 244,211Clients 22,984
[Source: Geoff Voelker]

33
A Multi-Organization Trace
University of Washington (UW) is a large and diverse client population
• Approximately 50K people
UW client population contains 200 independent campus organizations
• Museums of Art and Natural History• Schools of Medicine, Dentistry, Nursing• Departments of Computer Science, History, and Music
A trace of UW is effectively a simultaneous trace of 200 diverse client organizations Key: Tagged clients according to their organization in trace
[Source: Geoff Voelker]
34
Cooperation Across Organizations
Treat each UW organization as an independent “company”
Evaluate cooperative caching among these organizations
How much Web document reuse is there among these organizations? Place a proxy cache in front of each
organization. What is the benefit of cooperative caching
among these 200 proxies?
[Source: Geoff Voelker]

35
Ideal Hit Rates for UW proxies
Ideal hit rate - infinite storage, ignore cacheability, expirations
Average ideal local hit rate: 43%
[Source: Geoff Voelker]

36
Ideal Hit Rates for UW proxies
Ideal hit rate - infinite storage, ignore cacheability, expirations
Average ideal localhit rate: 43%
Explore benefits of perfect cooperation rather than a particular algorithm
Average ideal hit rate increases from 43% to 69% with cooperative caching
[Source: Geoff Voelker]

37
Sharing Due to Affiliation
UW organizational sharing vs. random organizations Difference in weighted averages across all orgs is ~5%
[Source: Geoff Voelker]
38
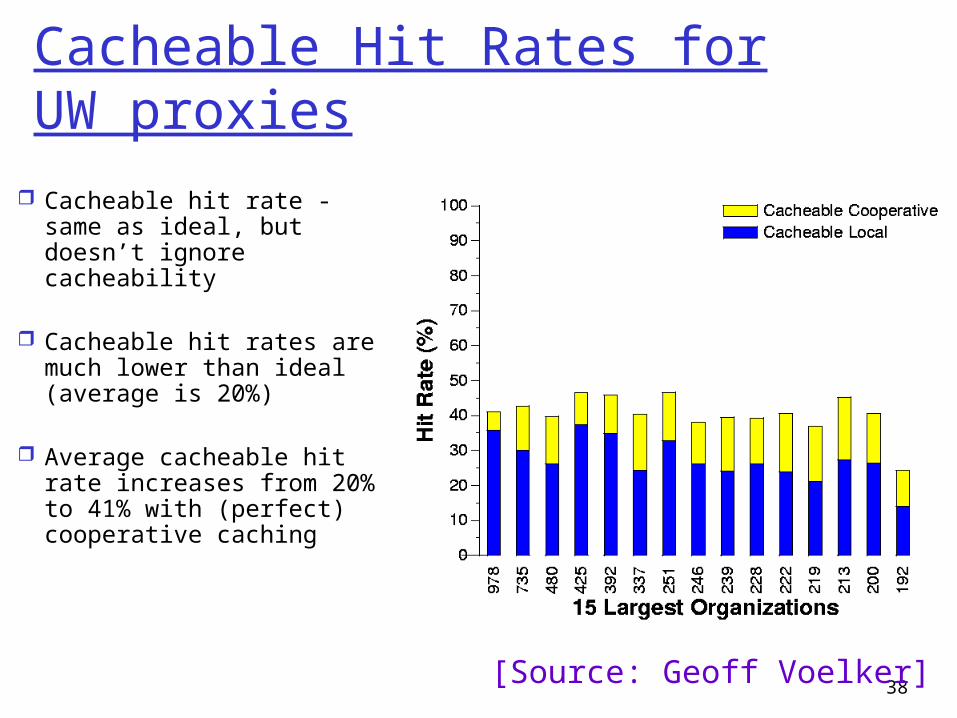
Cacheable Hit Rates forUW proxies
Cacheable hit rate - same as ideal, but doesn’t ignore cacheability
Cacheable hit rates are much lower than ideal (average is 20%)
Average cacheable hit rate increases from 20% to 41% with (perfect) cooperative caching
[Source: Geoff Voelker]
39
Scaling Cooperative Caching
Organizations of this size can benefit significantly from cooperative caching
But…we don’t need cooperative caching to handle the entire UW population size A single proxy (or small cluster) can handle this
entire population! No technical reason to use cooperative caching
for this environment In the real world, decisions of proxy placement
are often political or geographical
How effective is cooperative caching at scales where a single cache cannot be used?
[Source: Geoff Voelker]

40
Hit Rate vs. Client Population
Curves similar to other studies [e.g., Duska97, Breslau98]
Small organizations Significant increase in hit
rate as client population increases
The reason why cooperative caching is effective for UW
Large organizations Marginal increase in hit rate
as client population increases
[Source: Geoff Voelker]

41
In the Paper...
1. Do we believe this? What are some possible sources of error in this tracing/simulation study?
• What impact might they have?
2. Why are “ideal” hit rates so much higher for the MS trace, but the cacheable hit rates are the same?
• What is the correlation between sharing and cacheability?
3. Why report byte hit rates as well as object hit rates?
• Is the difference significant? What does this tell us about reference patterns?
4. How can it be that byte hit rate increases with population, while bandwidth consumed is linear?
42
Trace-Driven Simulation: Sources of Error 1. End effects: is the trace interval long enough?
• Need adequate time for steady-state behavior to become apparent.
2. Sample size: is the population large enough?• Is it representative?
3. Completeness: does the sample accurately capture the client reference streams?
• What about browser caches and lower-level proxies? How would they affect the results?
4. Client subsets: how to select clients to represent a subpopulation?
5. Is the simulation accurate/realistic?• cacheability, capacity/replacement, expiration, latency
43
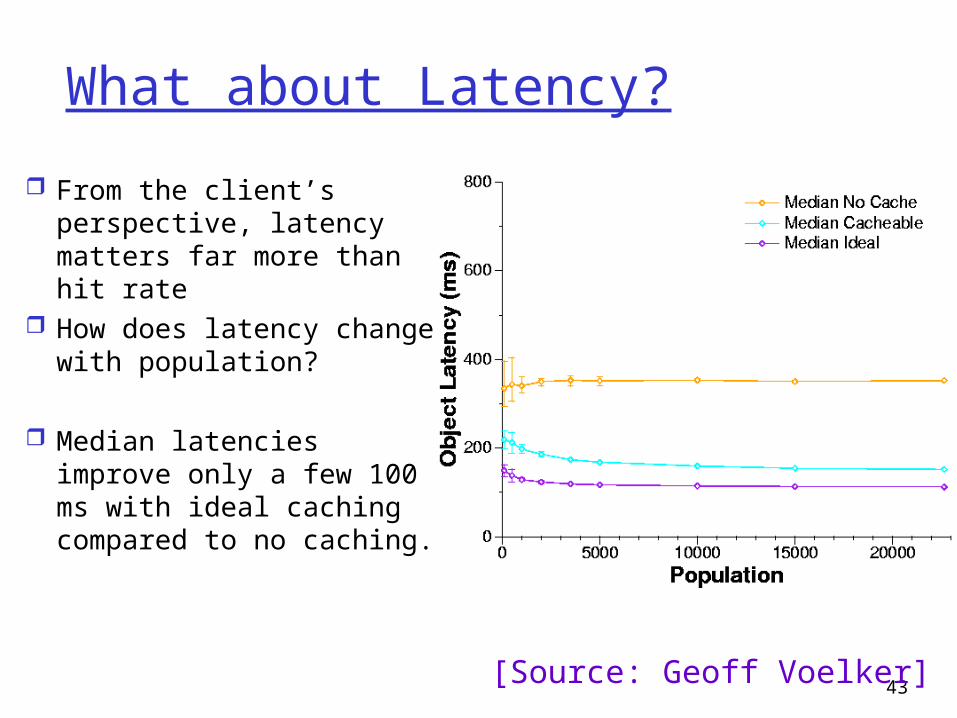
What about Latency?
From the client’s perspective, latency matters far more than hit rate
How does latency change with population?
Median latencies improve only a few 100 ms with ideal caching compared to no caching.
[Source: Geoff Voelker]
44
Questions/Issues
1. How did they obtain these reported latencies?
2. Why report median latency instead of mean?
• Is the difference significant? What does this tell us? Is it consistent with the reported byte hit ratios?
3. Why does the magnitude of the possible error decrease with population?
4. What about the future?• What changes in Web behavior might lead to different
conclusions in the future?• Will latency be as important? Bandwidth?

45
Large Organization Cooperation What is the benefit of cooperative
caching among large organizations?
Explore three ways Linear extrapolation of UW trace Simultaneous trace of two large
organizations (UW and MS) Analytic model for populations beyond trace
limits
[Source: Geoff Voelker]

46
Extrapolation to Larger Client Populations
Use least squares fit to create a linear extrapolation of hit rates
Hit rate increases logarithmically with client population, e.g., to increase hit rate by 10%:
Need 8 UWs (ideal) Need 11 UWs (cacheable)
“Low ceiling”, though: 61% at 2.1M clients (UW
cacheable)
A city-wide cooperative cache would get all the benefit [Source: Geoff Voelker]

47
UW & Microsoft Cooperation
Use traces of two large organizations to evaluate caching systems at medium-scale client populations
We collected a Microsoft proxy trace during same time period as the UW trace Combined population is ~80K clients Increases the UW population by a factor of 3.6 Increases the MS population by a factor of 1.4
Cooperation among UW & MS proxies… Gives marginal benefit: 2-4% Benefit matches “hit rate vs. population”
curve[Source: Geoff Voelker]

48
UW & Microsoft TracesTrace UW MS
Duration 7 days 6.25 days
HTTP objects 18.4 million 15.3 million
HTTP requests 82.8 million 107.7 million
Avg. requests/sec 137 199
Total Bytes 677 GB N/A
Servers 244,211 360,586
Clients 22,984 60,233
Population ~50,000 ~40,000
[Source: Geoff Voelker]

49
UW & MS Cooperative Caching
Is this worth it?[Source: Geoff Voelker]

50
Analytic Model
Use an analytic model to evaluate caching systems at very large client populations Parameterize with trace data, extrapolate beyond
trace limits
Steady-state model Assumes caches are in steady state, do not start cold Accounts for document rate of change Explore growth of Web, variation in document
popularity, rate of change
Results agree with trace extrapolations 95% of maximum benefit achieved at the scale of a
medium-large city (500,000)
[Source: Geoff Voelker]

51
Inside the Model
[Wolman/Voelker/Levy et. al., SOSP 1999] refines [Breslau/Cao et. al., 1999], and others
Approximates asymptotic cache behavior assuming Zipf-like object popularity caches have sufficient capacity
Parameters: = per-client request rate = rate of object change pc = percentage of objects that are cacheable = Zipf parameter (object popularity)

52
Zipf [Breslau/Cao99] and others observed that Web
accesses can be modeled using Zipf-like probability distributions. Rank objects by popularity: lower rank i ==> more
popular. The probability that any given reference is to the ith most
popular object is pi
• Not to be confused with pc, the percentage of cacheable objects.
Zipf says: “pi is proportional to 1/i, for some with 0 < < 1”. Higher gives more skew: popular objects are way popular. Lower gives a more heavy-tailed distribution. In the Web, ranges from 0.6 to 0.8 [Breslau/Cao99]. With =0.8, 0.3% of the objects get 40% of requests.

53
n
n
N
dxx
C
dx
nCxCx
C
1
1
1
1
11
Cacheable Hit Ratio: the Formula
CN is the hit ratio for cacheable objects achievable by population of size N with a universe of n objects.
N

54
n
n
N
dxx
C
dx
nCxCx
C
1
1
1
1
11
Inside the Hit Ratio Formula
Approximates a sum over a universe of n objects...
...of the probability of access to each object x...
…times the probability x was accessed since its last change.
C is just a normalizing constant for the Zipf-like popularity distribution,
which must sum to 1. C is not to be confused with CN.
C = 1/in [Breslau/Cao 99]
0 < < 1
N

55
n
n
N
dxx
C
dx
nCxCx
C
1
1
1
1
11
Inside the Hit Ratio Formula, Part 2
What is the probability that i was accessed since its last invalidate?
= (rate of accesses to i)/(rate of accesses or changes to i)
= Npi / (Npi + )
NDivide through by Npi.
Note: by Zipf pi = 1/Ci
so: 1/(Npi) = Ci/N

56
Hit Rates From Model
Cacheable Hit Rate Focus on
cacheable objects Four curves
correspond to different rate of change distributions Believe even Slow
and Mid-Slow are generous
Knee at 500K – 1M
[Source: Geoff Voelker]

57
Extrapolating UW & MS Hit Rates
[Graph from Geoff Voelker]
These are from the simulation results, ignoring rate of change (compare to graphs from analytic model).
What is the significance of slope ?
58
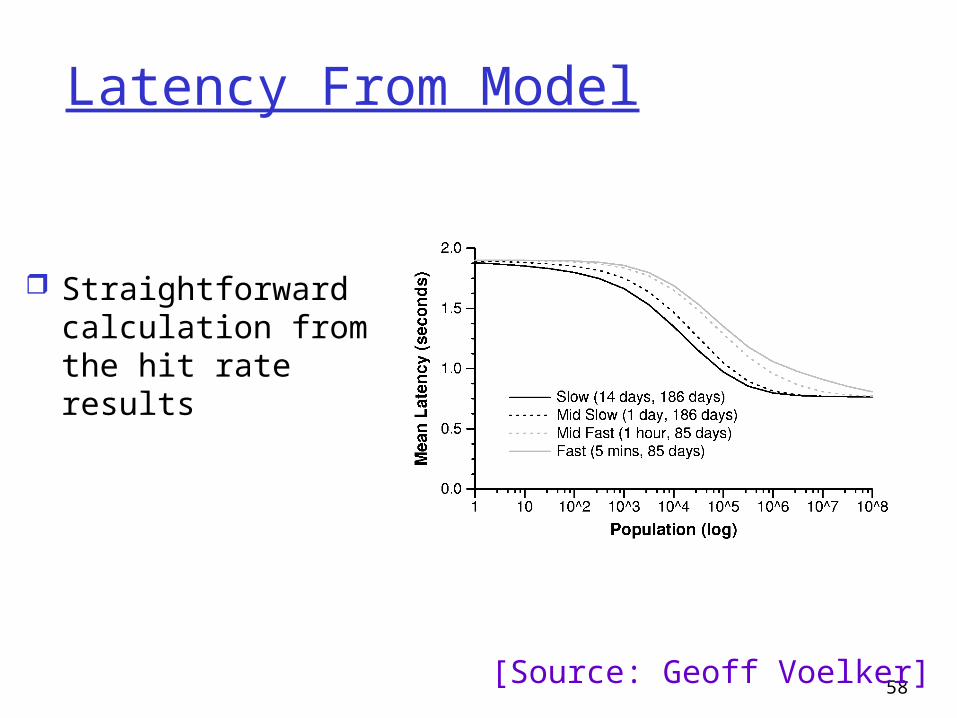
Latency From Model
Straightforward calculation from the hit rate results
[Source: Geoff Voelker]

59
Rate of Change
What is more important, the rate of change of popular objects or the rate of change of unpopular objects?
Separate popular from unpopular objects
Look at sensitivity of hit rate to variations in rate of change
[Source: Geoff Voelker]

60
Rate of Change Sensitivity
Popular docs sensitivity Top curve Unpopular low R-of-C Issue is minutes to
hoursUnpopular docs sensitivity
Bottom curve Popular low R-of-C Days to weeks to month
Unpopular more sensitive than popular!
Compare differences in hit rates between A,C and B,C
[Source: Geoff Voelker]
61
참고자료 2: Content Distribution Networks and Quality of Service

62
What is a CDN?
A system (often overlay network to Internet) for high-performance delivery of multimedia content.
A CDN maintains multiple locations with mirrors of the same content (known as surrogates) and redirects users to the most appropriate content location.
This distributes the load and also moves the content closer to the user, avoiding potential congestion and reducing response times (latency).

63
Need for CDNs
Multimedia such as videoconferences and streaming broadcasts. Sensitive to response-time delays Require large amounts of bandwidth
CDNs address these requirements by minimizing the number of backbone routers that content must traverse and distributing the bandwidth load
64
Victoria’s Secret
As an example of CDN’s scalability: Once a year the Victoria’s Secret Lingerie
Company broadcasts their Fashion Parade. 1,000,000+ viewers watching live @ 25 Kbps
The first year they tried it the enormous load crashed their centralized servers and many missed the show
Since then they have started using Yahoo and Akamai for their CDN. As many as 2 million watched the show in
2001 without any hiccups.

65
CDNs and Cache
Caches are used in the Internet to move content closer to the user. Reduces load on origin servers Eliminates redundant data traversal Reduces latency
CDNs make heavy use of cache Origin servers are fully or partially cached at
surrogate servers close to the users

66
Infrastructure
Request-routing Initiates communication between client and
a surrogate server. Content Distribution
Mechanisms that move content from origin servers to surrogates.
Content-delivery Consists of surrogate servers to delivery
copies of content to users.
67
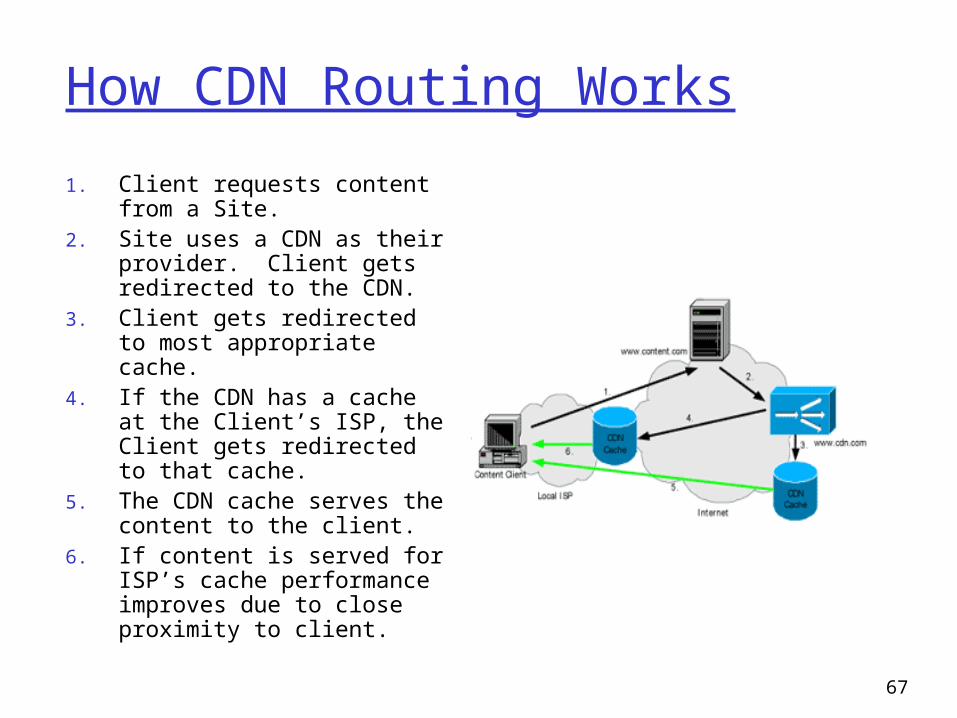
How CDN Routing Works
1. Client requests content from a Site.
2. Site uses a CDN as their provider. Client gets redirected to the CDN.
3. Client gets redirected to most appropriate cache.
4. If the CDN has a cache at the Client’s ISP, the Client gets redirected to that cache.
5. The CDN cache serves the content to the client.
6. If content is served for ISP’s cache performance improves due to close proximity to client.
68
Request Routing
Direct a client’s request for objects served by a CDN to the most appropriate server.
Two commonly used methods:1. DNS Redirection2. URL Rewriting

69
DNS Redirection
Authoritative DNS server redirects client request by resolving CDN server to IP address of one content server.
A number of factors determine which content server is used in final resolution. Availability of resources, network conditions
etc Load balancing can be implemented by
specifying a low TTL field in a DNS reply.

70
DNS Redirection…
Two types of CDNs using redirection:1. Full site content delivery2. Partial site content delivery
71
Full Site Content Delivery
All requests for origin-server are redirected by DNS, to a CDN server.
Companies include: Adero NetCaching UniTech’s Networks IntelliDNS

72
Partial Site Content Delivery
Origin site alters an object’s URL so that it’s resolved by the CDN’s DNS server.eg: www.foo.com/bar.gif becomes
foo.cdn.com/www.foo.com/bar.gif Companies include:
Akamai Digital Island MirrorImage Speedera

73
URL Rewriting
Origin server dynamically generates pages to redirect clients to different content servers.
Page is dynamically rewritten with the IP address of a mirror server.
Clearway CDN is one such company.

74
Content Distribution
Mechanisms that move content from origin servers to surrogates.
Two different methods to get content to surrogates:
1. Pre-caching2. Just-in-time

75
Pre-Caching
Content is delivered to cache before requests are generated.
Used for highly distributed usage. Caches can be updated during off-hours
to reduce network load.

76
Just-In-Time
Content is pulled from the origin server to the cache when a request is received from a client.
The object is delivered to the client and simultaneously stored on the cache for later perusal.
Can implement multicasting for efficient content transfer between caches.
Leased lines may be used between servers to ensure QoS.

77
Content Delivery
Consists of servers placed around the Internet with each server caching the central content.
Transparent to end user – looks like it’s coming from central server.
Distributed structure means less load on all servers. Can support QoS for customers with differing needs.
Eg: Gold class, Silver class, Bronze class scheme Costs becomes cheaper
Cost of buying new servers is relatively cheaper than trying to obtain higher output from just one server.
78
CDN Usage in the Real World
Allow organisations to put on large multimedia events Internal: Company announcements, video
conferencing meetings, instructor-led staff training
External: Event hosting such as concerts, fashion shows
Allow organisations to improve internal data flows Decentralised intranet system to reduce WAN
traffic

79
CDN Options
Companies can choose to outsource or build their own network Outsource: setup and maintenance costs much
lower, no need for inhouse experts, providers may also have additional services such as live event management and extensive usage statistics
Own network: greater control, privacy
80
CDN Providers
Some of the largest companies include Akamai Digital Island Yahoo (mainly streaming media)
Extensive networks covering large areas Akamai has over 13000 servers in more than
60 countries

81
Tested Performance
How good are these networks? Largest companies tested for streaming live
broadcast capabilities as well as on-demand Each provider sent 1 hour MPEG-2 stream via
satellite and needed to encode at 100kbps in real-time before transmission
Yahoo achieved average packet loss rate of 0.006%
Another study found internet packet loss of > 9% for similar bandwidth and distance
However, this is upper end of results

82
Tested Performance (cont)
After September 11 many web sites flooded with traffic
Typical sites that experienced massive increases in traffic were airline and news sites
Akamai used to serve 80% of MSNBC.com’s traffic, including around 12.5 million streams of video
Akamai also used by MSNBC.com for Winter Olympics

83
Performance Issues
Many design aspects can affect performance Capabilities of infrastructure Location of equipment DNS Redirection
DNS Redirection is crucial in obtaining optimal performance, but is also one of the hardest areas to perfect
84
DNS Redirection Issues
Study found that neither Akamai nor Digital Island could redirected the client to the optimal server in their content distribution networks consistently
In a small fraction of cases performance was far from optimal
Due to difficulty in determining user’s exact location and the best server at the time

85
Summary
Using a number of mechanisms including load balancing and caching servers, content delivery networks aim to distribute internet content towards the network edge
Avoids bottlenecks involved in centralized architecture, and reduces latency between end user and content
Common uses for these networks is support for a large number of users to access popular web sites, or as a delivery means for streaming multimedia

86
CDN
Analysis
87
Hierarchical Caches and CDNS What are the implications of this study for
hierarchical caches and Content Delivery Networks (e.g., Akamai)? Demand-side proxy caches are widely deployed and
are likely to become ubiquitous. What is the marginal benefit from a supply-side CDN
cache given ubiquitous demand-side proxy caching? What effect would we expect to see in a trace
gathered at an interior cache?
CDN interior caches can be modeled as upstream caches in a hierarchy, given some simplifying assumptions.

88
Level 2
Level 1 (Root)
N2 clients N2 clients
N1 clients
An Idealized Hierarchy
Assume the trees are symmetric to simplify the math.
Ignore individual caches and solve for each level.

89
Hit Ratio at Interior Level i
CN gives us the hit ratio for a complete subtree covering population N
The hit ratio predicted at level i or at any cache in level i over R requests is given by:
11
)(1
level to requests
level at hits
ii
NNc
i
i
hr
CCRp
r
hii
i
i
“the hits for Ni (at level i) minus the hits captured by level i+1, over the miss stream from level i+1”

90
Root Hit Ratio
Predicted hit ratio for cacheable objects, observed at root of a two-level cache hierarchy (i.e. where r2=Rpc):
2
21
11
1
N
NN
C
CC
r
h

91
NL clients NL clients
N clients
Generalizing to CDNs
Request Routing Function
Interior Caches(supply side “reverse proxy”)
NI clients
ƒ(leaf, object, state)
Leaf Caches(demand side)
NL clients
Symmetry assumption: ƒ is stable and “balanced”.
ƒ
92
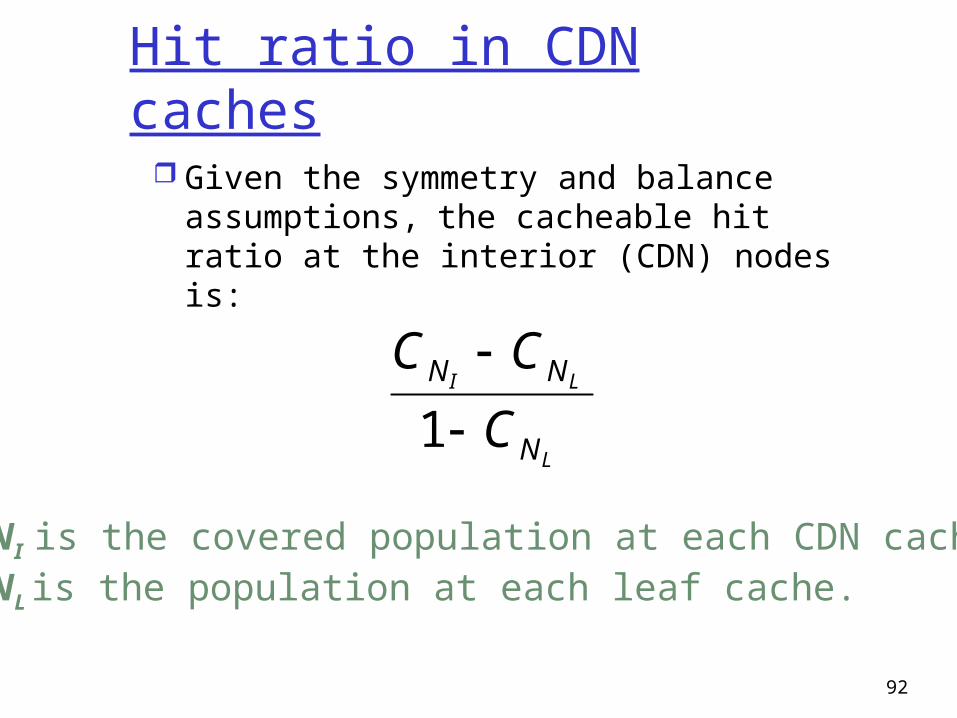
Hit ratio in CDN caches
Given the symmetry and balance assumptions, the cacheable hit ratio at the interior (CDN) nodes is:
L
LI
N
NN
C
CC
1
NI is the covered population at each CDN cache.NL is the population at each leaf cache.

93
Cacheable interior hit ratio
cacheable
hit
ratio
increasing NI and NL -->
fixed fanout NI /NL
Interior hit rates improve as leaf populations increase....
94
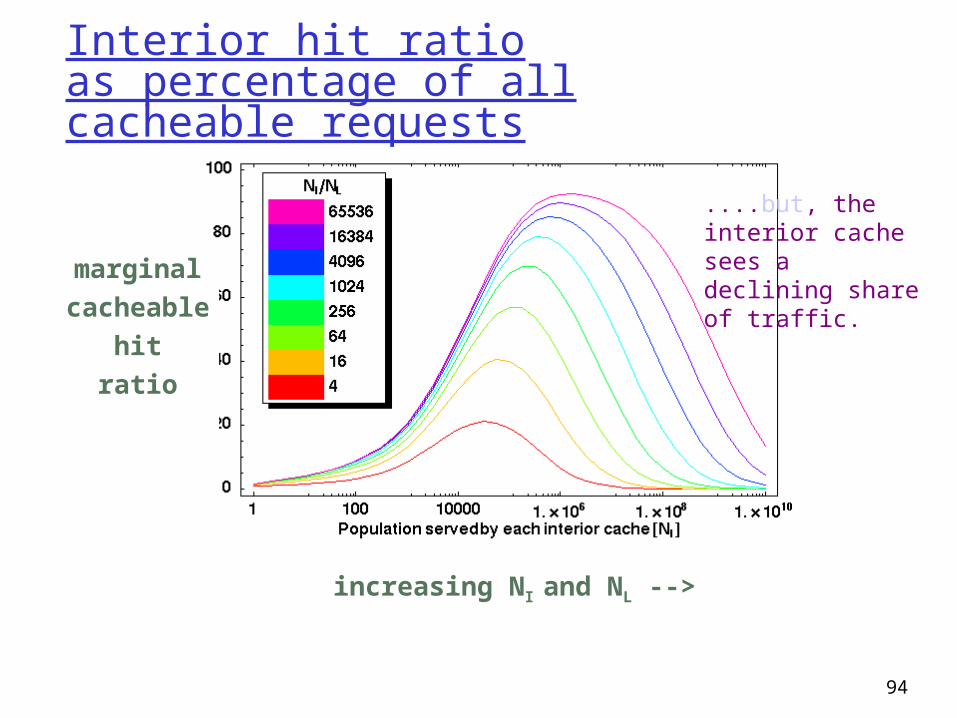
Interior hit ratioas percentage of all cacheable requests
marginal
cacheable
hit
ratio
increasing NI and NL -->
....but, the interior cache sees a declining share of traffic.