1 The Economics of Crime and Justice 2 Crime in California w Causality and Control w Corrections:...
84
1 The Economics of Crime and Justice
-
date post
21-Dec-2015 -
Category
Documents
-
view
226 -
download
1
Transcript of 1 The Economics of Crime and Justice 2 Crime in California w Causality and Control w Corrections:...

1
The Economics of Crime and Justice

2
Crime in California
Causality and Control Corrections: Dynamics and Economics Correctional Bureaucracy

3
Use the California Experience
Apply the conceptual tools developed prior to the midterm• Criminal justice system schematic• crime control technology

4
Crime Generation
Crime Control
OffenseRate PerCapita
ExpectedCost ofPunishment
Schematic of the Criminal Justice System: Coordinating CJS
Causes ?!!
(detention,deterrence)
Expenditures
Weak Link
“The Driving Force”

5
What are the facts?
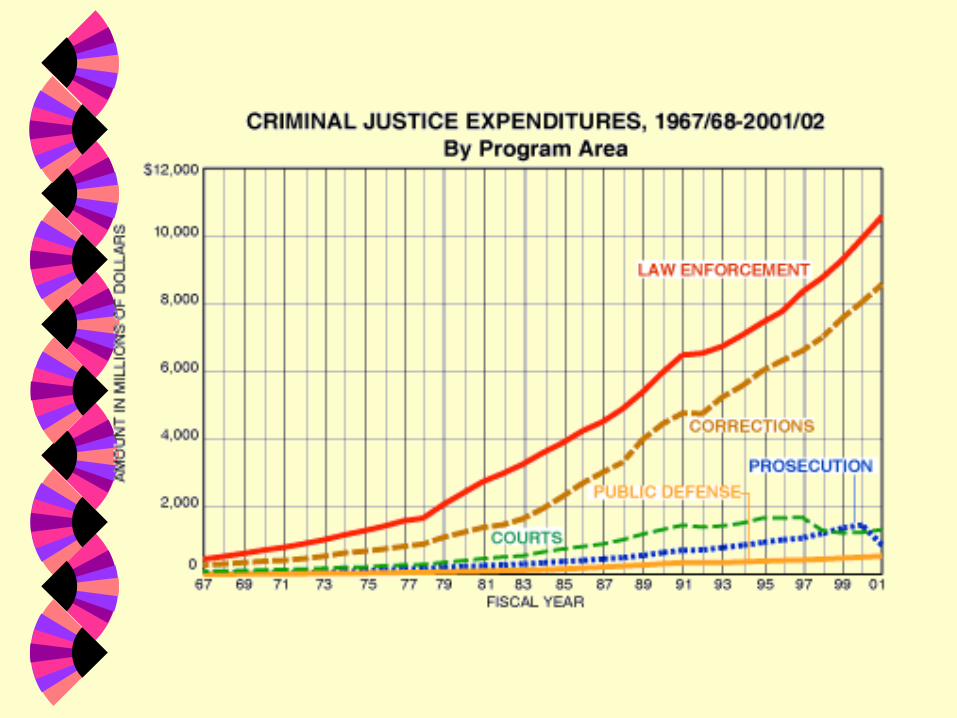
Expenditures per capita on the CA criminal justice system

6
Expenditures Per Capita in 92 $, California .Criminal Justice System, 1967-68 to 1997-98 . .
0
100
200
300
400
500
600
Fiscal Year
$ P
er
Capita
7

8
What are the facts?
Expenditures per capita on the CA criminal justice system• Expenditures per capita in real $ are rising
steadily• The big ticket items are enforcement and
corrections
Offenses per capita
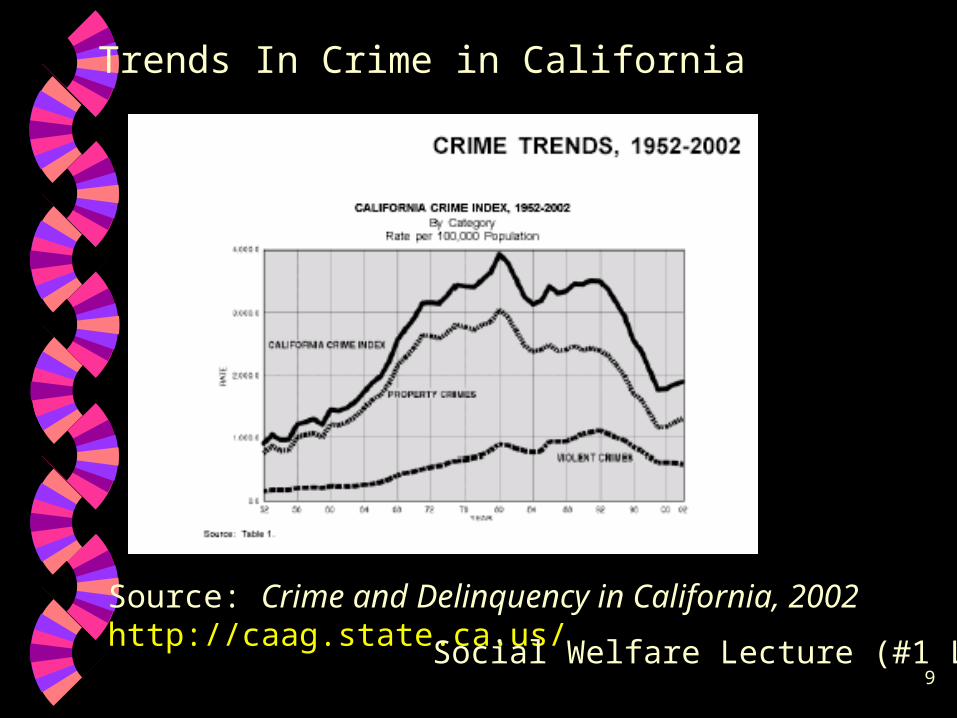
9
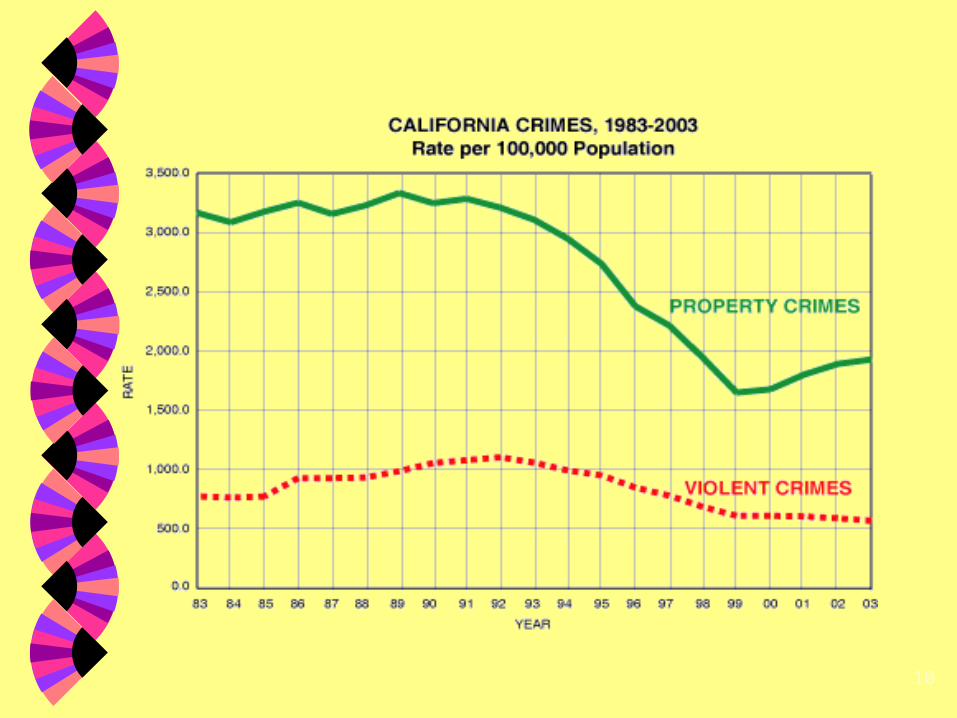
Trends In Crime in California
Source: Crime and Delinquency in California, 2002http://caag.state.ca.us/ Social Welfare Lecture (#1 LP)
10

11
What are the facts?
Offense rates per capita rose rapidly until 1980
Leveled off in the 1980’s Declined in the nineties Are rising again

12
California Index Offenses and Criminal Justice System .Expenditures, Both Per Capita, 1967-68 to 1997-98 .
1997-98
1980-81
1967-68
0
100
200
300
400
500
600
0 0.005 0.01 0.015 0.02 0.025 0.03 0.035 0.04 0.045
CA Index Offenses Per Capita
1992 $
Per
Capita

13
Can we identify the causes?
The factors that cause crime might have been getting better in the latter 90’s
14
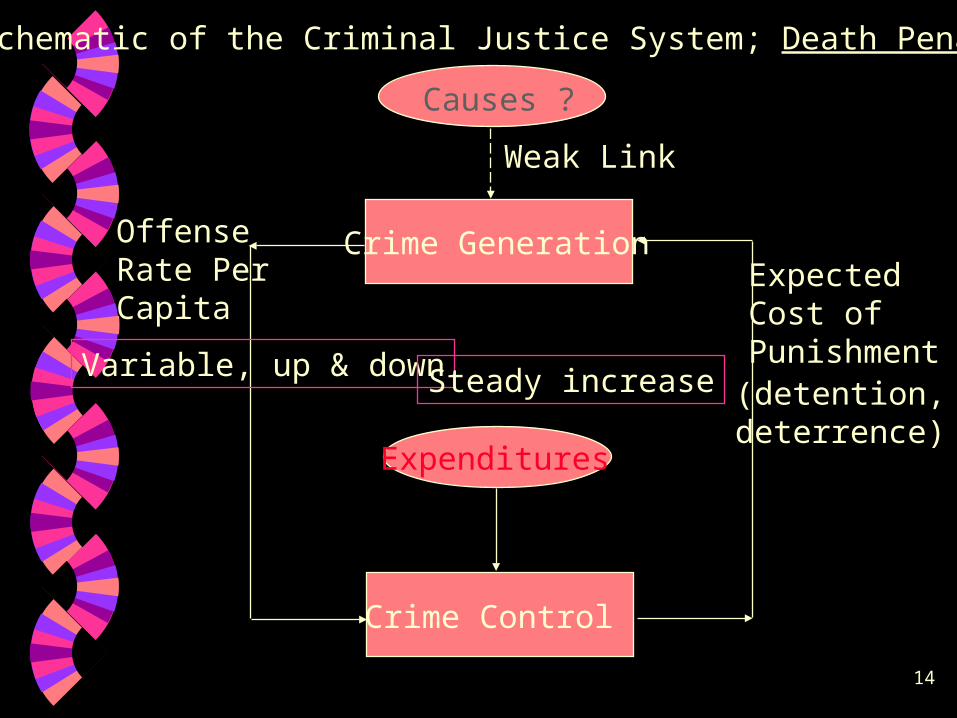
Crime Generation
Crime Control
OffenseRate PerCapita
ExpectedCost ofPunishment
Schematic of the Criminal Justice System; Death Penalty
Causes ?
(detention,deterrence)
Expenditures
Weak Link
Variable, up & down Steady increase
15
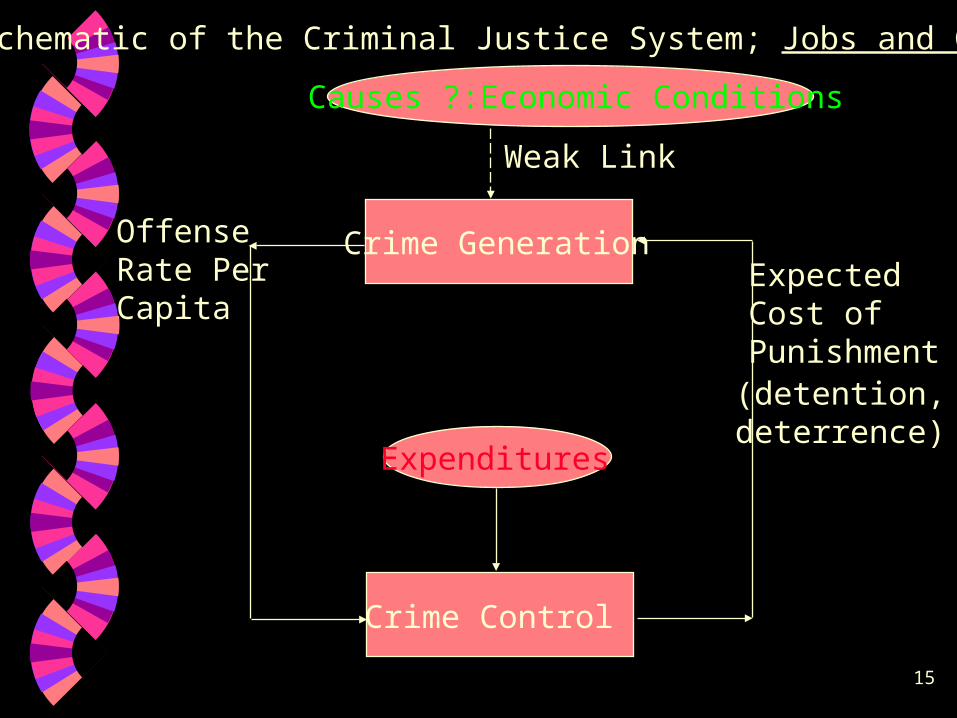
Crime Generation
Crime Control
OffenseRate PerCapita
ExpectedCost ofPunishment
Schematic of the Criminal Justice System; Jobs and Crime
Causes ?:Economic Conditions
(detention,deterrence)
Expenditures
Weak Link

16
Misery Index, California 1952-2003
-5.00
0.00
5.00
10.00
15.00
20.00
25.00
1950 1960 1970 1980 1990 2000 2010
year
Rat
e
unemployment rate
inflation rate
misery index
Jobs and Crime Lec(#2 LP)
17
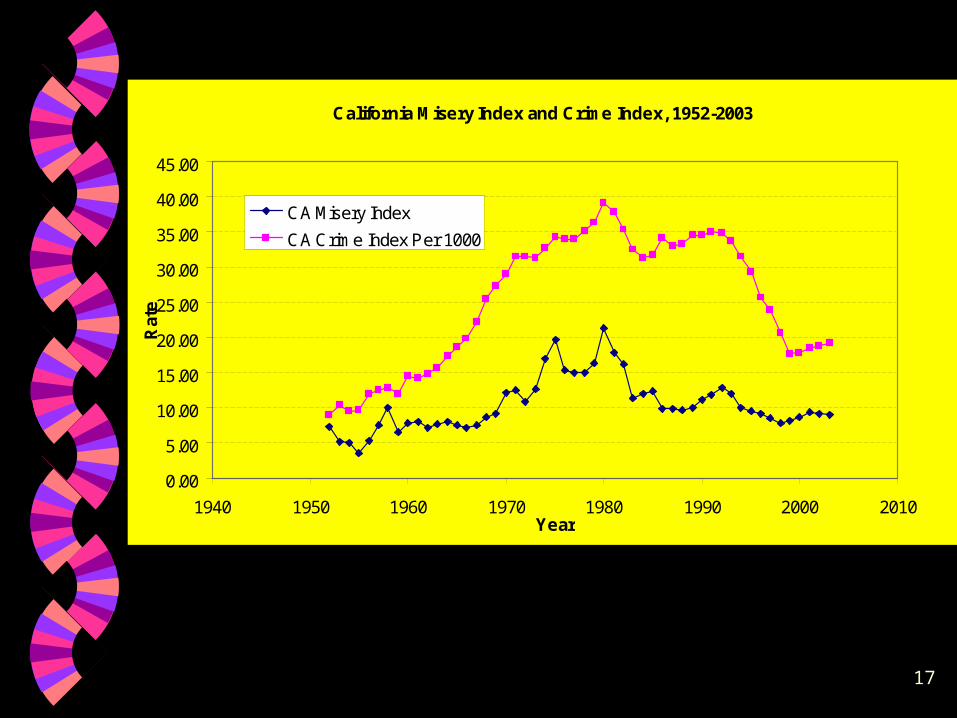
California Misery Index and Crime Index, 1952-2003
0.00
5.00
10.00
15.00
20.00
25.00
30.00
35.00
40.00
45.00
1940 1950 1960 1970 1980 1990 2000 2010Year
Rat
e
CA Misery Index
CA Crime Index Per 1000

18
Note:
The misery rate is turning up and so is the crime rate in 2002
There is visual evidence that there may be a connection

California: Crime Index Versus Misery Index .
1970
1992
1975
1998
1980
1952
0
5
10
15
20
25
30
35
40
0.00 5.00 10.00 15.00 20.00 25.00
Misery Index
Cri
me I
nd
ex
Jobs and Crime

20
CA Crime Index Per 1000 Vs. Misery Index
0
5
10
15
20
25
30
35
40
45
0.00 5.00 10.00 15.00 20.00 25.00
Misery Index
Cri
me
Ind
ex
2002
1952
1980
1954
Jobs and Crime Lec #2 LP
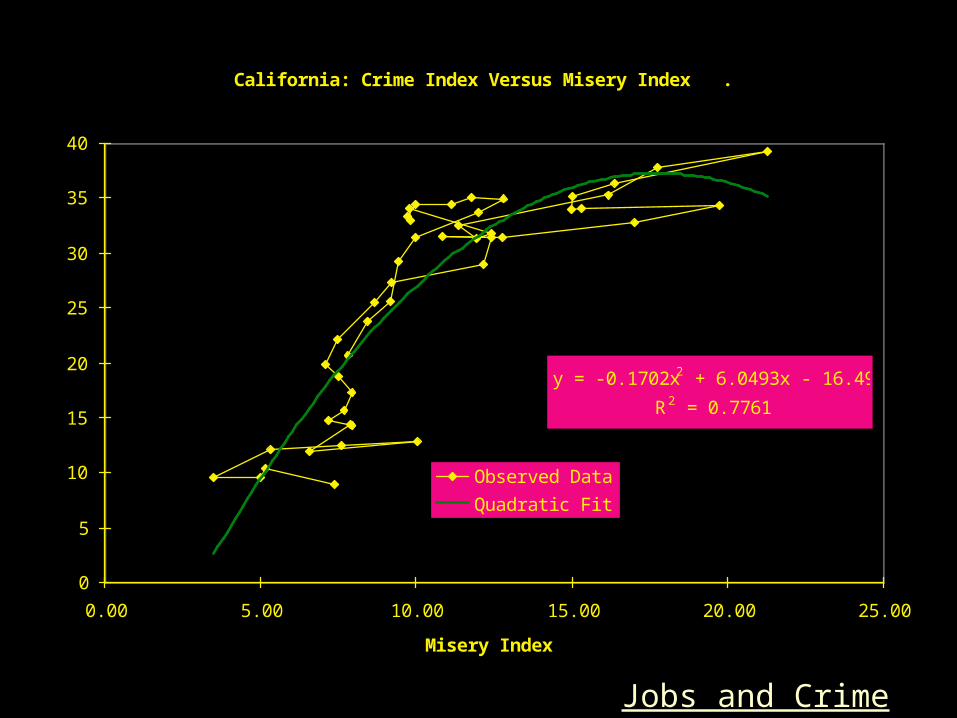
California: Crime Index Versus Misery Index .
y = -0.1702x 2 + 6.0493x - 16.491
R2 = 0.7761
0
5
10
15
20
25
30
35
40
0.00 5.00 10.00 15.00 20.00 25.00
Misery Index
Cri
me I
nd
ex
Observed Data
Quadratic Fit
Jobs and Crime
22
What are the facts?
Control variables• Imprisonment as a measure of detention and
deterrence
23
Crime Generation
Crime Control
OffenseRate PerCapita
ExpectedCost ofPunishment
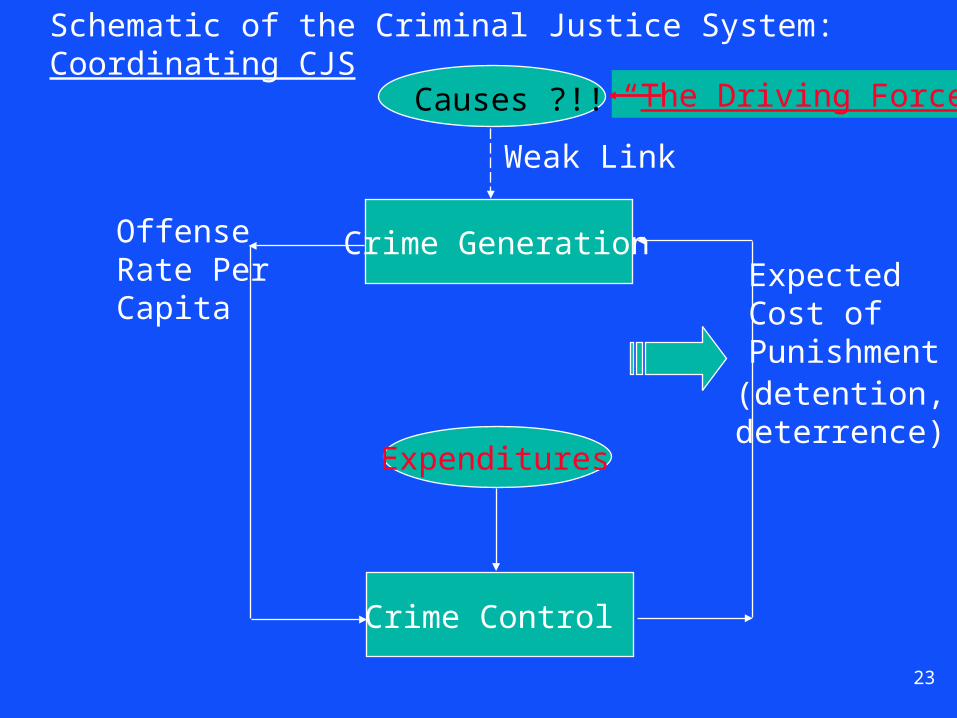
Schematic of the Criminal Justice System: Coordinating CJS
Causes ?!!
(detention,deterrence)
Expenditures
Weak Link
“The Driving Force”

24
California Prisoners Per Capita .
0
0.0005
0.001
0.0015
0.002
0.0025
0.003
0.0035
0.004
0.0045
0.005
1940 1950 1960 1970 1980 1990 2000 2010
Year
Ra
te
25
The number of prisoners per capita is leveling off Is this why the crime rate is turning up?

26
Prisoners and Offenses, Per Capita, 1952-2000 .
0.0001
0.001
0.01
0.1
1
1940 1950 1960 1970 1980 1990 2000 2010
Year
Ra
te
CA Prisoners Per Capita
Ca Index offenses Per Capita

27
Note
When prisoners per capita was flat, offenses per capita was growing
When prisoners per capita started growing, offenses per capita leveled off and then declined

28
California: Offenses Per Capita Vs. Prisoners Per Capita .
1980
2000
1952
0
0.005
0.01
0.015
0.02
0.025
0.03
0.035
0.04
0.045
0 0.0005 0.001 0.0015 0.002 0.0025 0.003 0.0035 0.004 0.0045 0.005
Prisoners Per Capita
Off
en
se
s P
er
Ca
pit
a
29
What is Affecting Crime Rates?
Economic Conditions? Imprisonment Rates?

30
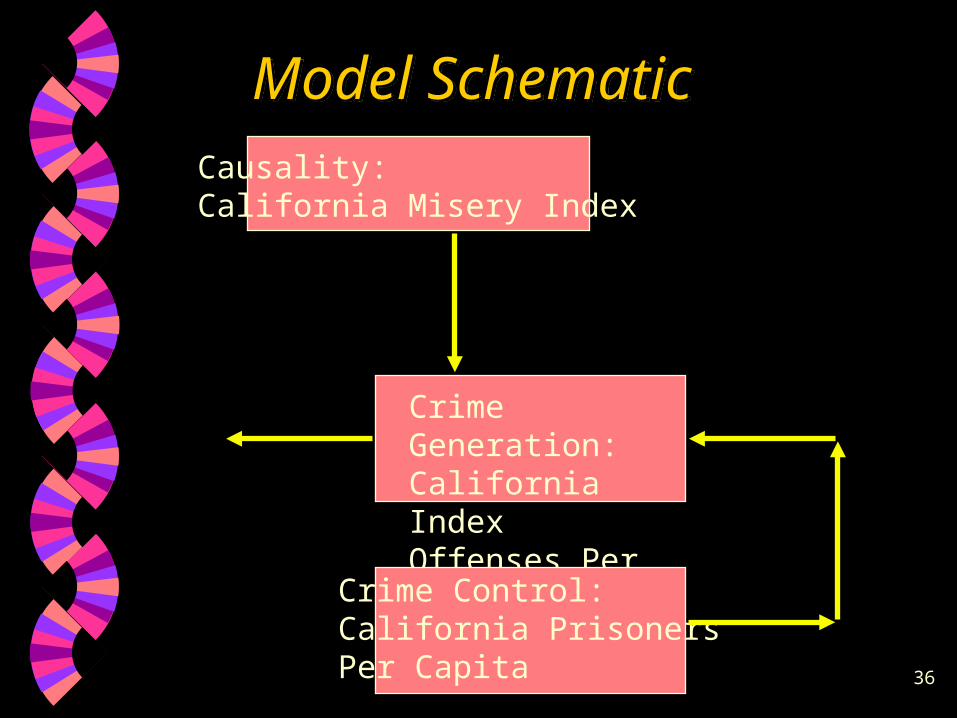
Model SchematicModel Schematic
Crime Generation: California IndexOffenses Per Capita
Causality:California Misery Index
Crime Control: California Prisoners Per Capita
1955
1998
1980

1955
1998
1980

19551980
1998
34
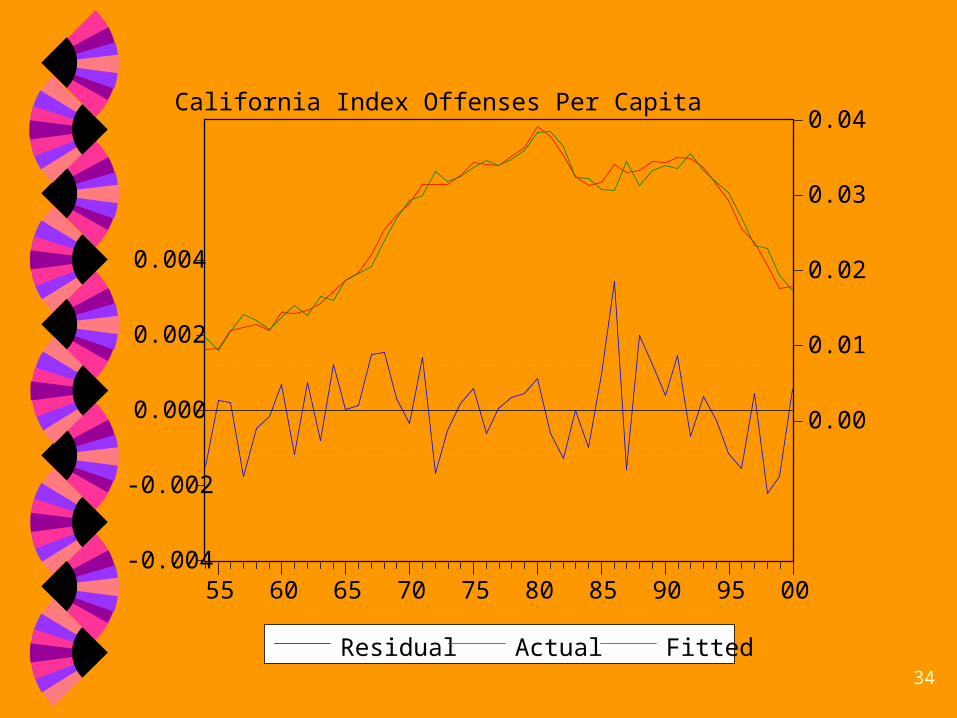
-0.004
-0.002
0.000
0.002
0.004
0.00
0.01
0.02
0.03
0.04
55 60 65 70 75 80 85 90 95 00
Residual Actual Fitted
California Index Offenses Per Capita

35
California Forecasts
Using the Fitted Model to Forecast
36
Model SchematicModel Schematic
Crime Generation: California IndexOffenses Per Capita
Causality:California Misery Index
Crime Control: California Prisoners Per Capita
37
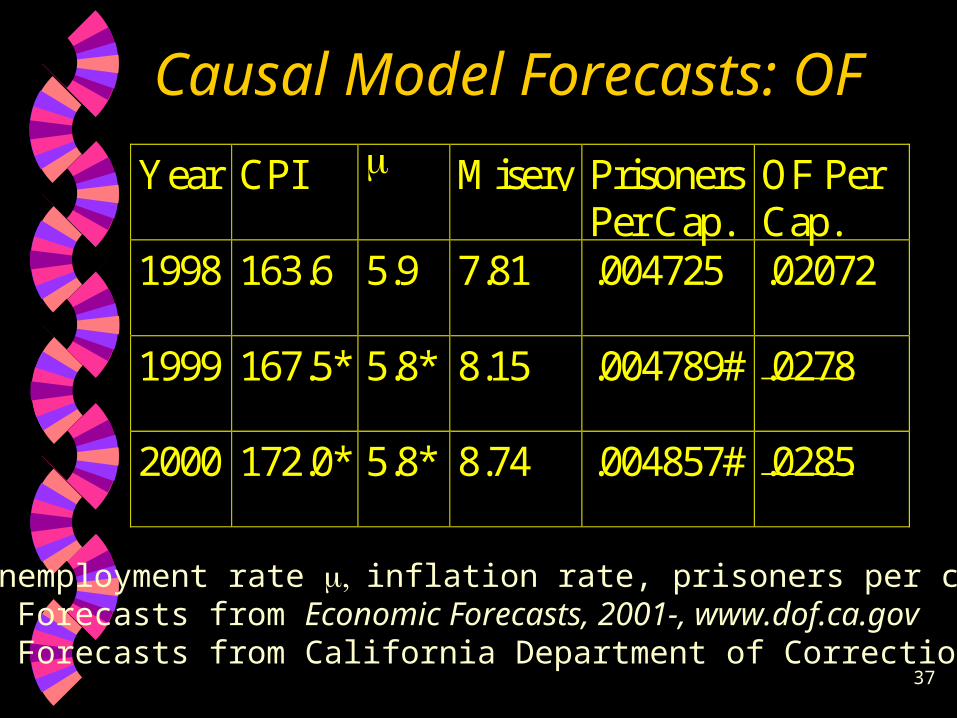
Causal Model Forecasts: OF
Year CPI Misery PrisonersPer Cap.
OF PerCap.
1998 163.6 5.9 7.81 .004725 .02072
1999 167.5* 5.8* 8.15 .004789# .0278
2000 172.0* 5.8* 8.74 .004857# .0285
Unemployment rate inflation rate, prisoners per capita* Forecasts from Economic Forecasts, 2001-, www.dof.ca.gov# Forecasts from California Department of Corrections

38
0.00
0.01
0.02
0.03
0.04
55 60 65 70 75 80 85 90 95 00
CAINDXPCFORECAST
UPPERLOWER
California Index Offenses Per Capita & Forecasts for 2001-2

39
California Misery Index and Crime Index, 1952-2002
0.00
5.00
10.00
15.00
20.00
25.00
30.00
35.00
40.00
45.00
1950 1960 1970 1980 1990 2000 2010
Year
Ra
te
CA Misery Index
CA Crime Index Per 1000
40
Forecasting Prisoners Per Capita
Model Schematic• Close the loop: 2-way causality

41
Model SchematicModel Schematic
Crime Generation: California IndexOffenses Per Capita
Causality:California Misery Index
Causality:Time Trend
Crime Control: California Prisoners Per Capita

-0.0003
-0.0002
-0.0001
0.0000
0.0001
0.0002
0.0003
0.0004
55 60 65 70 75 80 85 90 95 00
Change in Prisoners per Capita Forecast
Forecasts for 1999 and 2000 for Annual Increase in Prisoners per Capita

43
Forecasts of California Prisoners Per Capita, 1952-2001
0
0.001
0.002
0.003
0.004
0.005
0.006
1952 1957 1962 1967 1972 1977 1982 1987 1992 1997
Year
California Prisoners Per Capita
My Forecast

44
California Department of Corrections:
Institutional Population
http://www.cdc.state.ca.us/reports/populatn.htm

45
Crime in California
Causality and Control Corrections: Dynamics and Economics

46
Prison Dynamics and Economics
Admissions * mean years served = prisoners

47
Relationships Between Stocks and Flows: Coordinating CJSRelationships Between Stocks and Flows: Coordinating CJS In equilibrium:
• Inflow = Outflow
The outflow is proportional to the stock• Outflow = k * Stock
• constant of proportionality, k, equals one divided by mean time served
– Admits * mean years served = stock of prisoners

48
The Stock of Prisoners
Inflow OutflowStock of PrisonersNew
Admissionsfrom Court
Released toParole
Coordinating CJS

49
45 degrees
Constraint: Admits per year*Average years served =Prisoners
Average Years Served
Admitsper Year
Coordinating CJS

50
California New Admissions from Court, Per Capita .
0
0.0002
0.0004
0.0006
0.0008
0.001
0.0012
0.0014
0.00165
2
55
58
61
64
67
70
73
76
79
82
85
88
91
94
97
Year
Rate
51
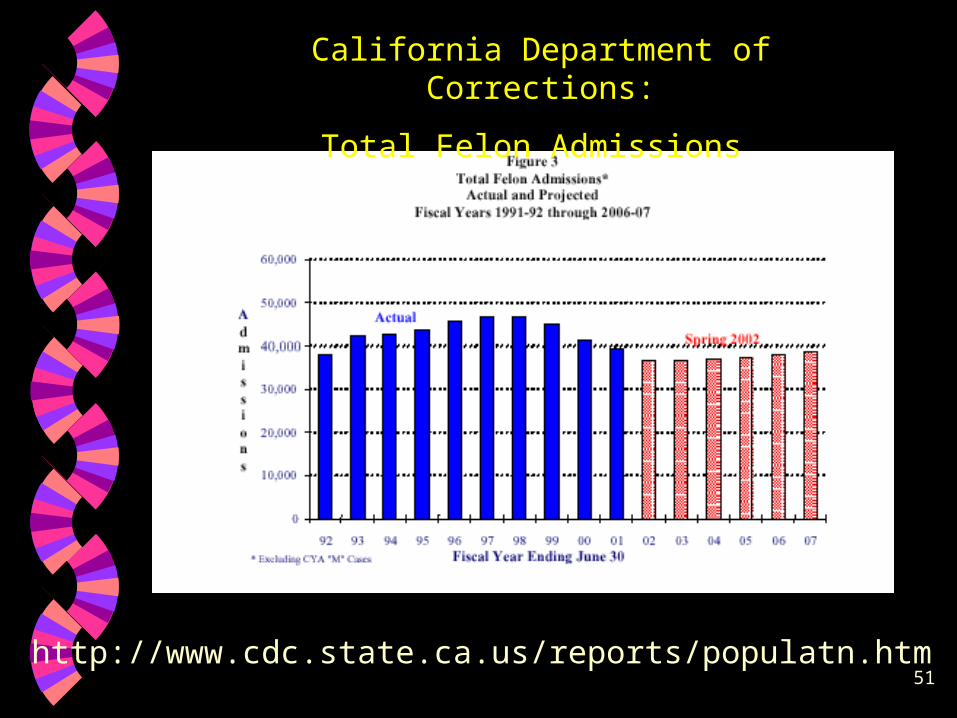
California Department of Corrections:
Total Felon Admissions
http://www.cdc.state.ca.us/reports/populatn.htm
52
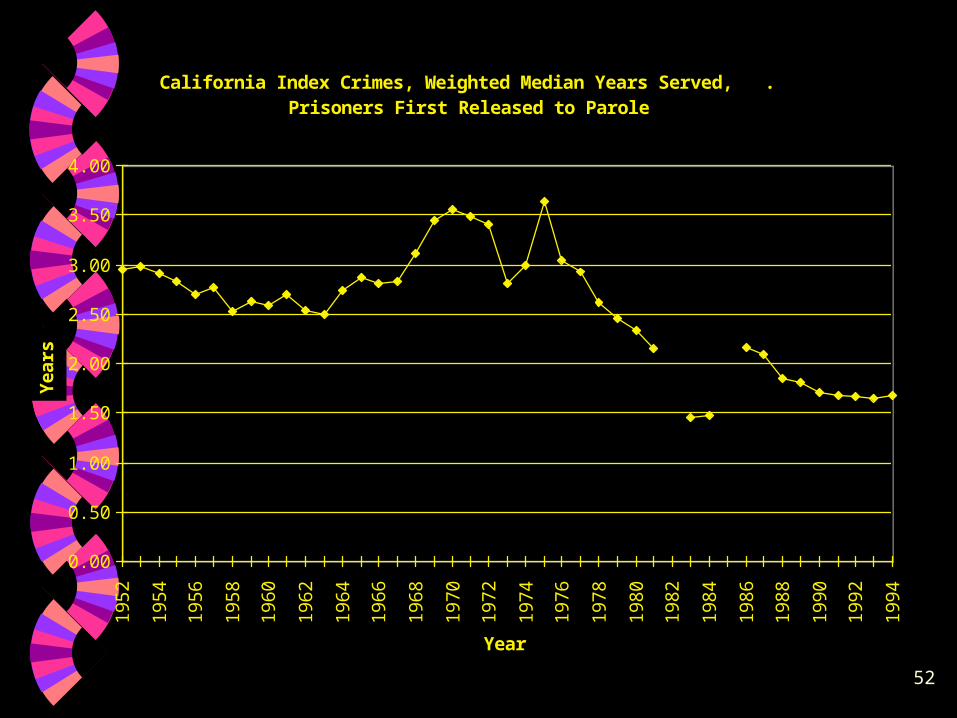
California Index Crimes, Weighted Median Years Served, . Prisoners First Released to Parole
0.00
0.50
1.00
1.50
2.00
2.50
3.00
3.50
4.00
19
52
19
54
19
56
19
58
19
60
19
62
19
64
19
66
19
68
19
70
19
72
19
74
19
76
19
78
19
80
19
82
19
84
19
86
19
88
19
90
19
92
19
94
Year
Years

53
Prison Realities
We can not build prisons fast enough to increase capacity soon enough
The public wants more convicts sent to prison
But prisons are full So, what happens?

54
Consequence
Release violent offenders Innocent children are kidnapped, raped and
murdered: example-Polly Klass

55
Consequence
Polly’s father campaigns for three strikes law
56
Consequence
More convicts are sent to prison

57
58
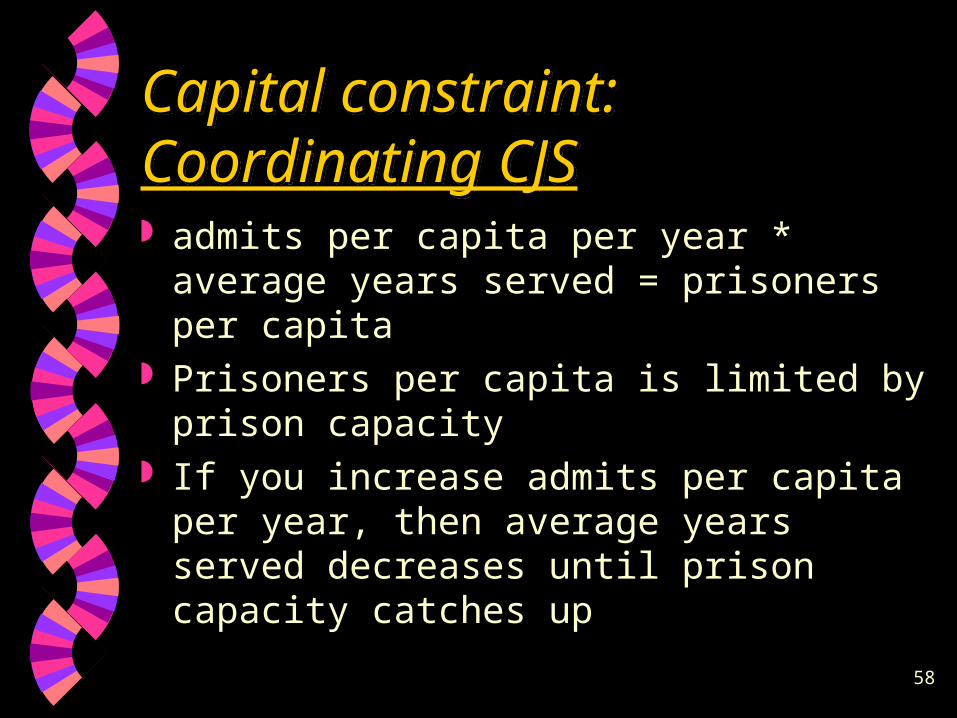
Capital constraint: Coordinating CJSCapital constraint: Coordinating CJS admits per capita per year * average years
served = prisoners per capita Prisoners per capita is limited by prison
capacity If you increase admits per capita per year,
then average years served decreases until prison capacity catches up

59
Prison Dynamics and Economics
Admissions * mean years served = prisoners• Dynamics
Production Possibility Frontier• Economics

60
Abstraction (Model) of the Criminal Justice System
EnforcementProsecutionDefenseCourts
State Prisons
NewAdmits
Mean Years Served

61
Admitsper Yearper capita
average years served
Tradeoff Between Criminal Justice System Outputs
tan = admits per year per capita/average years served

62
Resource constraintResource constraint
expenditure per capita on CJS = expenditure per capita on enforcement, prosecution, and adjudication plus expenditure per capita on corrections
admits per year per capita depends on expenditures per capita on enforcement, etc.
average years served depends on expenditures per capita on corrections

63
AdmitsperCapita
Expenditures per capita on Enforcement
AverageYearsServed
Expenditures percapita on Corrections
productionfunction
productionfunction
Expenditures percapita on Corrections
Expenditures per capita on Enforcement
Total Expenditures per capita on Criminal Justice System
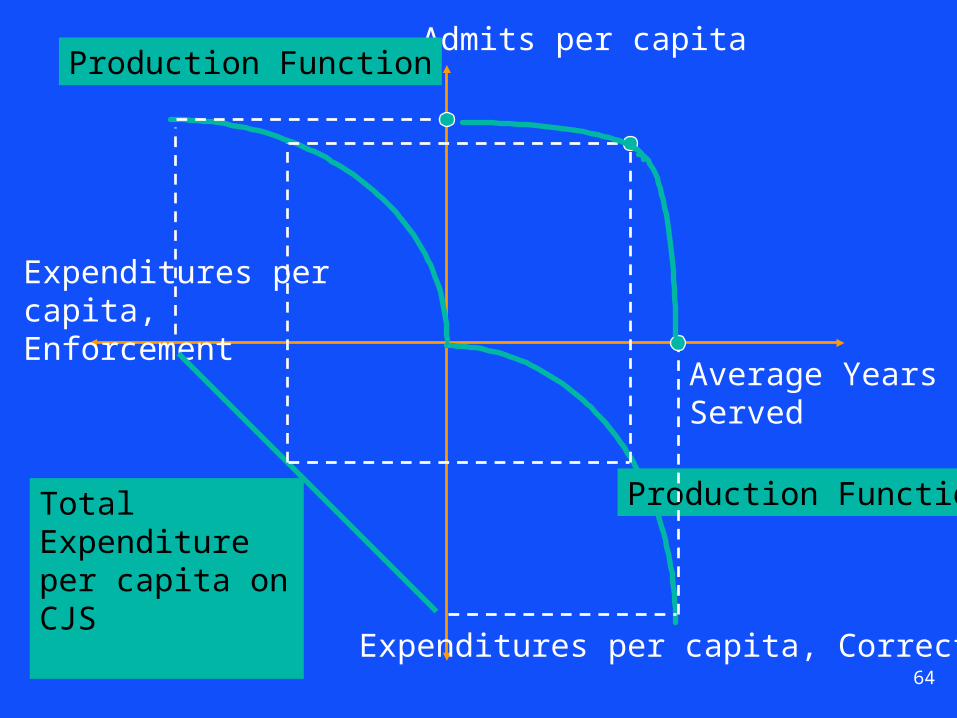
64
Total Expenditureper capita on CJScapita on CJS
Expenditures per capita, Corrections
Expenditures per capita, Enforcement
Admits per capita
Average YearsServed
Production Function
Production Function

65
Abstraction (Model) of the Criminal Justice System
EnforcementProsecutionDefenseCourts
State Prisons
NewAdmits
Mean Years Served

66
Total Expenditureper capita on CJScapita on CJS Expenditures per capita, Corrections
Expenditures per capita, Enforcement
Admits per capita
Average YearsServed
Production Function
67
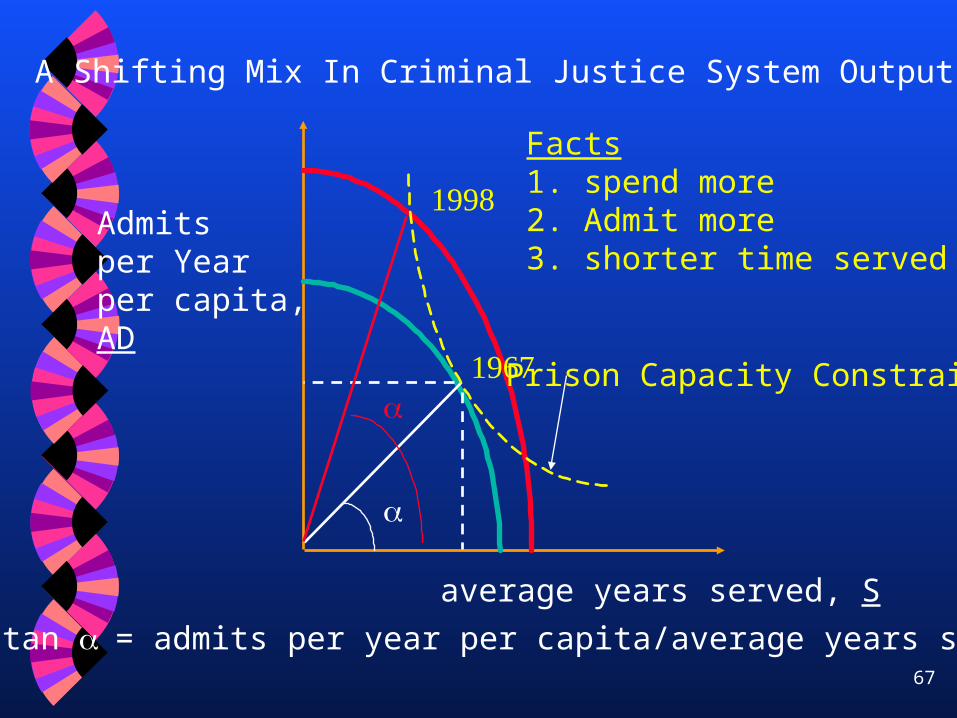
Admitsper Yearper capita,AD
average years served, S
A Shifting Mix In Criminal Justice System Outputs
tan = admits per year per capita/average years served
Facts1. spend more2. Admit more3. shorter time served
Prison Capacity Constraint

California: New Admits per Capita Vs. Median Years Males .
0
0.0002
0.0004
0.0006
0.0008
0.001
0.0012
0.0014
0.00 0.50 1.00 1.50 2.00 2.50 3.00 3.50 4.00
Median Years Sered
New
Ad
mit
s P
er
Cap
ita
1952
1986
1994
1975
69
Crime in California
Causality and Control Corrections: Dynamics and Economics Correctional Bureaucracy

70
California Corrections BureaucracyCalifornia Corrections Bureaucracy Prisoner and Parole Populations
• Stocks
Felon New Admissions From Court• Inflow to Prison
Prisoners Released to Parole• Outflow from Prison/Inflow to Parole
Parole Violators• Outflow from Parole
Discharges from Parole and Deaths• Outflow from Parole

71
California Department of Corrections
1996
California Department of Corrections
1996
Prisoners145,565
Parolees100,935
Felon NewAdmits46,487
Releases to Parole111,532
Dischargedand Died27,691
57,984Parole Violators Returned to Custody
Parole Violators With a New Term 17,525
Parolees AtLarge18,034
Discharged and Died3,984
Absconded29,376

72
Correctional Trends in California: Custodial Populations
Correctional Trends in California: Custodial Populations
Prisoners Per Capita• Institutional Population
• Felons
• Civil Narcotics Addicts
Parolees Per Capita• Parole and Outpatient Population Supervised in
California
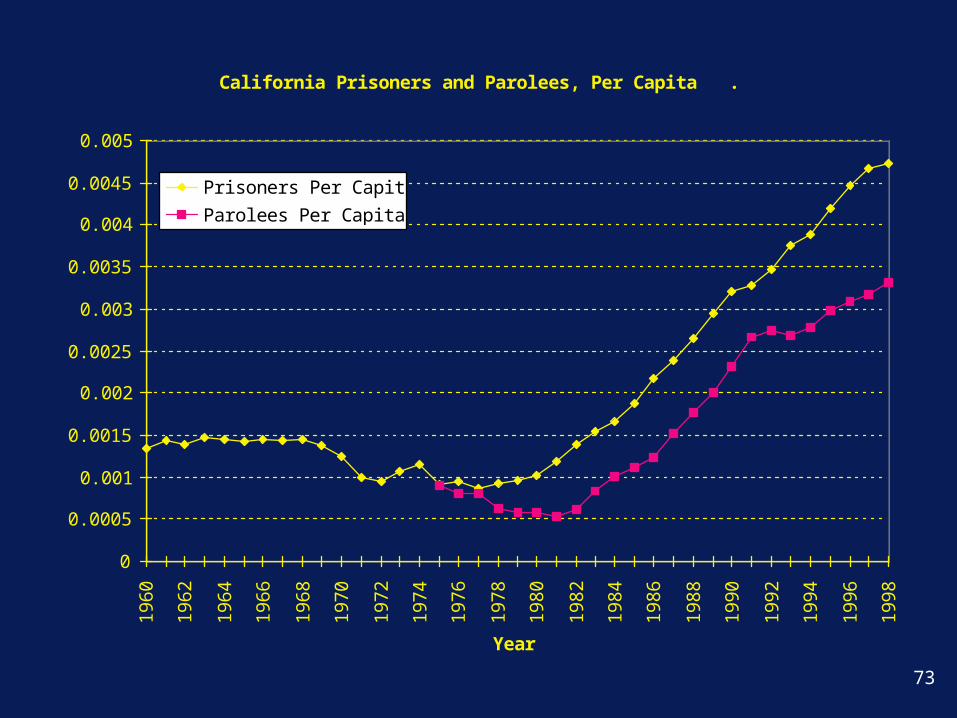
73
California Prisoners and Parolees, Per Capita .
0
0.0005
0.001
0.0015
0.002
0.0025
0.003
0.0035
0.004
0.0045
0.0051
96
0
19
62
19
64
19
66
19
68
19
70
19
72
19
74
19
76
19
78
19
80
19
82
19
84
19
86
19
88
19
90
19
92
19
94
19
96
19
98
Year
Rate
Prisoners Per Capita
Parolees Per Capita

74
California Department of Corrections:
Total Parole and Outpatient Population

California Correctional and Parole Officers .
0
2000
4000
6000
8000
10000
12000
14000
160001
97
4
19
75
19
76
19
77
19
78
19
79
19
80
19
81
19
82
19
83
19
84
19
85
19
86
19
87
19
88
19
89
19
90
19
91
19
92
Year
Nu
mb
er
Correctional Officers
Parole Officers

76
Correctional Trends in California: Inflows to Prison
Correctional Trends in California: Inflows to Prison
Felon New Admissions from Court Parole Violators Returned to Custody Parole Violators With a New Term

77
California: Inflows to Prison .
0
10000
20000
30000
40000
50000
60000
70000
800001
96
0
19
62
19
64
19
66
19
68
19
70
19
72
19
74
19
76
19
78
19
80
19
82
19
84
19
86
19
88
19
90
19
92
19
94
19
96
19
98
Year
Nu
mb
er
Felon New Admissions to Prison
Parole Violators Returned to Custody
Parole Violators With New Term

78
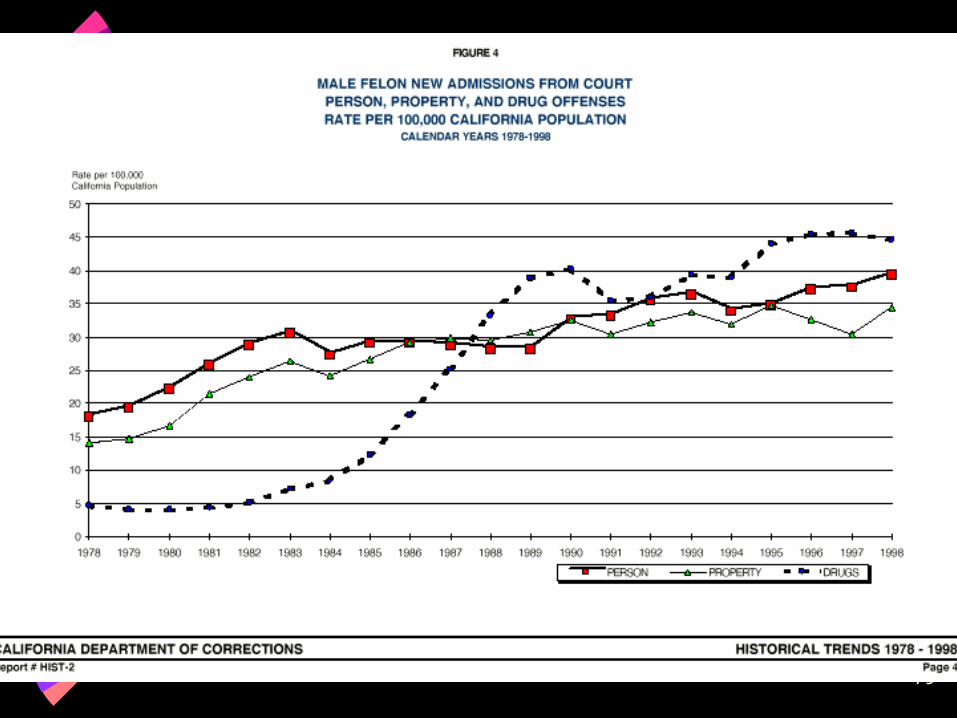
Two Policy IssuesTwo Policy Issues
Composition of New Admissions from Court Large Volume of Parole Violators Returned to
Prison
79
80

81

82
83
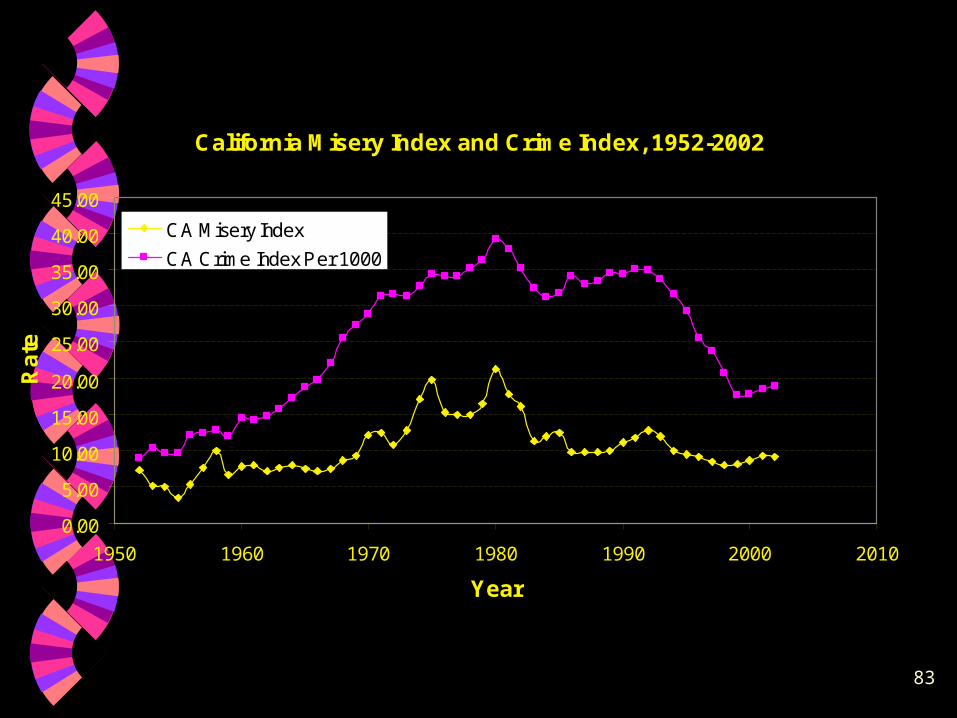
California Misery Index and Crime Index, 1952-2002
0.00
5.00
10.00
15.00
20.00
25.00
30.00
35.00
40.00
45.00
1950 1960 1970 1980 1990 2000 2010
Year
Ra
te
CA Misery Index
CA Crime Index Per 1000

84