1. The Determinants of Corporate Venture Capital Success
38
- The Determinants of Corporate Venture Capital Success Organizational Structure, Incentives, and Complementarities Paul A. Gompers and Josh Lerner The structure of private equity organizations-in particular, the reliance on limited partnerships of finite life with substantial profit sharing-has been identified as critical to their success. Jensen (1993) and Shleifer and Vishny (1997b), among others, have attributed the rapid growth of private equity organizations to the ways in which their design addresses moral haz- ard and information-asymmetry problems. These claims, however, have received little empirical scrutiny. This paper addresses this omission by comparing investments made by traditional venture capital organizations with those of venture funds spon- sored by corporations. These corporate funds have similar missions and are staffed by individuals with backgrounds resembling those in indepen- dent organizations. But the organizational and incentive structures in cor- porate funds are very different: most are structured as corporate subsidi- aries and have much lower incentive-based compensation. In this respect, corporate funds differ dramatically from both independent venture organ- izations and funds associated with commercial and investment banks. (Many bank-affiliated funds retain the autonomous partnership structure Paul A. Gompers is associate professor of business administration at the Harvard Business School and a faculty research fellow of the National Bureau of Economic Research. Josh Lerner is professor of business administration at the Harvard Business School and a research associate of the National Bureau of Economic Research. The authors thank Ventureone for making this project possible through generous access to their database of venture financings. The authors also thank conference and preconfer- ence participants (especially Randall Morck, Krishna Palepu, Michael Weisbach, Luigi Zin- gales, and two anonymous reviewers) and the Harvard Business School lunchtime finance workshop for helpful comments. Rob Bhargava and Amy Burroughs provided research assis- tance; Sanjeev Verma contributed to the design of this project. The authors thank the Har- vard Business School’s Division of Research for financial support. 17
Transcript of 1. The Determinants of Corporate Venture Capital Success

-
The Determinants of Corporate Venture Capital Success Organizational Structure, Incentives, and Complementarities
Paul A. Gompers and Josh Lerner
The structure of private equity organizations-in particular, the reliance on limited partnerships of finite life with substantial profit sharing-has been identified as critical to their success. Jensen (1993) and Shleifer and Vishny (1997b), among others, have attributed the rapid growth of private equity organizations to the ways in which their design addresses moral haz- ard and information-asymmetry problems. These claims, however, have received little empirical scrutiny.
This paper addresses this omission by comparing investments made by traditional venture capital organizations with those of venture funds spon- sored by corporations. These corporate funds have similar missions and are staffed by individuals with backgrounds resembling those in indepen- dent organizations. But the organizational and incentive structures in cor- porate funds are very different: most are structured as corporate subsidi- aries and have much lower incentive-based compensation. In this respect, corporate funds differ dramatically from both independent venture organ- izations and funds associated with commercial and investment banks. (Many bank-affiliated funds retain the autonomous partnership structure
Paul A. Gompers is associate professor of business administration at the Harvard Business School and a faculty research fellow of the National Bureau of Economic Research. Josh Lerner is professor of business administration at the Harvard Business School and a research associate of the National Bureau of Economic Research.
The authors thank Ventureone for making this project possible through generous access to their database of venture financings. The authors also thank conference and preconfer- ence participants (especially Randall Morck, Krishna Palepu, Michael Weisbach, Luigi Zin- gales, and two anonymous reviewers) and the Harvard Business School lunchtime finance workshop for helpful comments. Rob Bhargava and Amy Burroughs provided research assis- tance; Sanjeev Verma contributed to the design of this project. The authors thank the Har- vard Business School’s Division of Research for financial support.
17

18 Paul A. Gompers and Josh Lerner
employed by independent venture organizations, albeit with a lower share of the profits accruing to the venture investors.)
Thus, the contrast between corporate and independent venture funds provides a natural test case for examining the effect of organizational structure on investment performance. The arguments regarding the im- portance of the structure of independent private equity organizations sug- gest that corporate programs would prove less successful. Either their pro- cess of selecting or overseeing investments would be distorted, or else the programs would prove unstable. It may be, however, that corporate pro- grams enjoy benefits that offset some of these costs. A lengthy literature on complementarities in the strategy literature argues that corporations can benefit from closely related activities (for a review and formalization, see Athey and Stern [1997]). Corporations may be able to select better ventures using the information from their related lines of business or may add greater value to the firms once the investments are made.
Before turning to the empirical analysis, we consider the experience of Xerox Technology Ventures, which illustrates both these points. This cor- porate venture fund compiled excellent financial returns between 1988 and 1996 by aggressively exploiting the technology and knowledge of the cor- porate parent. Nonetheless, the corporate parent dissolved the fund before the ending date originally intended. The case highlights the fact that- contrary to both popular wisdom and academic arguments-corporate venture programs can still be successful without the traditional partner- ship structure. The case also suggests, however, some of the difficulties that these efforts encounter and the apparent importance of having a strong linkage between the fund’s investment focus and the corporate parent’s strategic focus.
We then consider the more general evidence. Using the Ventureone database of private equity financings, we examine over thirty thousand investments in entrepreneurial firms by venture capital programs. The mix of firms in which corporate venture funds invested is little different than that of traditional organizations.
The first set of tests relates to the performance of firms financed by corporate venture capitalists as opposed to those funded by independent funds. If the structural features of the independent funds are critical, we should expect that their investments would perform better. The corporate funds, hampered by poor incentives and management interference, would be unable to select or oversee firms effectively. If corporations can exploit complementarities with their existing lines of business while evaluating or assisting portfolio firms, however, their investments may actually perform better. This should be particularly true for corporate investments in very similar businesses. It is unclear whether corporations will pay more or less than other investors in these cases: it may be that the corporate investor
The Determinants of Corporate Venture Capital Success 19
will be willing to pay more than other investors owing to the indirect bene- fits that it alone enjoys.
When we examine the empirical evidence, we find that, far from being outright failures, corporate venture investments in entrepreneurial firms ap- pear to be at least as successful (using such measures as the probability of the portfolio firm going public) as those backed by independent venture or- ganizations. This appears to be particularly true for investments in which there is strategic overlap between the corporate parent and the portfolio firm. It is harder to assess the relative returns that independent and corpo- rate venture organizations enjoy. Corporations are likely to benefit from indirect gains (e.g., strategic alliances and greater understanding of indus- try trends) as well as direct financial returns.' While corporate venture capitalists tend to invest at a premium to other firms, this premium ap- pears to be no higher in investments with a strong strategic fit where these benefits are likely to be greatest.
We then consider the duration of the programs themselves. We consider two potential reasons why corporate programs might be short-lived, First, it may be that corporations need to employ such programs only during periods of severe technological discontinuity. After such periods of rapid change pass, the programs are no longer needed. If programs were gener- ally designed to address short-run technological discontinuities, it should be the strategic programs that have the shortest duration. A second possi- bility is that large corporations find it difficult to duplicate the autonomy and the high-powered compensation schemes offered in independent ven- ture funds. As a result, key personnel may depart once they establish a track record and relationships with outside investors.
The empirical evidence suggests that corporate programs are much less stable than those of independent funds. The programs frequently cease operations after only a few investments. We show that the instability is particularly great in corporate funds whose investments do not have a strong strategic focus. This result is hard to reconcile with the first hy- pothesis.
In short, the evidence seems to underscore the importance of the com- plementarities hypothesis outlined above. Portfolio companies receiving funds from corporate investors with a well-defined strategic focus enjoy greater success. Investments are made at a premium, but this may reflect the indirect benefits that the corporation receives. Corporate programs with a well-defined strategic focus also appear to be as stable as traditional independent venture organizations. Among the corporate funds without a
1. Of course, these programs may also be associated with costs to the firms as well, such as distraction from the primary mission of the organization. These are difficult for us to assess, except possibly through the measure of program longevity discussed below.

20 Paul A. Gompers and Josh Lerner
strong strategic focus, we see significantly less success in investments and less stability than among the focused funds.
We end with a more general discussion of the implications. It may be that-contrary to the emphasis in the finance literature-the structure of corporate venture funds is not a critical barrier. Rather, the presence of a strong strategic focus may be critical. Alternatively, the corporate pro- grams without a strong strategic focus may also have particularly weak incentive schemes and other problematic structural characteristics.
This paper is related to an extensive corporate finance literature about the relation between organizational structure and corporate performance (reviewed, e.g., in Jensen [1993]). More specifically, a set of papers has examined the structure of financial institutions and investment perfor- mance. Among these are studies of the performance of initial public offer- ings underwritten by investment banks that are and are not affiliated with commercial banks (Kroszner and Rajan 1994), the performance of loans underwritten by savings-and-loan institutions structured as mutual and stock organizations (Cordell, MacDonald, and Wohar 1993), and the ef- fect of mutual fund performance on investment choices and returns (Che- valier and Ellison 1997). As far as we are aware, however, no paper has analyzed the effect of the limited-partnership structure on investment per- formance.
This paper is also related to a body of literature on private equity part- nerships more generally. These writings suggest reasons to be both positive and skeptical about the importance of the partnership structure. On the one hand, a set of articles documents that investments by private equity organizations are associated with real changes in the firms that they fund, measured on both an accounting (Muscarella and Vetsuypens 1990) and a financial (Brav and Gompers 1997) basis. Moreover, the structure of private equity groups-whether measured through the sensitivity of com- pensation to performance (Gompers and Lerner 1999) or the extent of contractual restrictions (Gompers and Lerner 1996)-appears to be re- sponsive to the changing investment mix and characteristics of the funds. On the other hand, it appears that other factors (e.g., relative supply and demand conditions for private equity funds [Gompers and Lerner 19961) can also affect the structure of partnerships. Furthermore, certain features of partnerships apparently can lead to pathological outcomes. For in- stance, policies allowing venture capitalists to distribute shares in stock, designed to maximize investors’ choices regarding the liquidation of their positions, have been exploited by some private equity groups to inflate returns and to boost their compensation (Gompers and Lerner 1998). This paper raises questions about the necessity of the partnership structure em- ployed by independent private equity funds.
The organization of this paper is as follows. In section 1.1, we briefly summarize the history of corporate venture capital funds. Section 1.2 dis-

The Determinants of Corporate Venture Capital Success 21
cusses the case of Xerox Technology Ventures. Section 1.3 describes the data set. The empirical analysis is presented in section 1.4. Section 1.5 con- cludes.
1.1 The History of Corporate Venture Capital Investment
The first corporate venture funds began in the mid-l960s, about two decades after the first formal venture capital funds.2 The corporate efforts were spurred by the successes of the first organized venture capital funds, which backed such firms as Digital Equipment, Memorex, Raychem, and Scientific Data Systems. Excited by this success, large companies began establishing divisions that emulated venture capitalists. During the late 1960s and early 1970s, more than 25 percent of the Fortune 500 firms at- tempted corporate venture programs.
These efforts generally took two forms, external and internal. At one end of the spectrum, large corporations financed new firms alongside other venture capitalists. In many cases, the corporations simply provided funds for a venture capitalist to invest. Other firms invested directly in start-ups, giving them a greater ability to tailor their portfolios to their particular needs. At the other extreme, large corporations attempted to tap the entrepreneurial spirit within their organizations. These programs sought to allow entrepreneurs to focus their attention on developing their innovations while relying on the corporation for financial, legal, and mar- keting support.
In 1973, the market for new public offerings-the primary avenue through which venture capitalists exit successful investments-abruptly declined. Independent venture partnerships began experiencing signifi- cantly less attractive returns and encountered severe difficulties in raising new funds. At the same time, corporations began scaling back their own initiatives. The typical corporate venture program begun in the late 1960s was dissolved after only four years.
Funds flowing into the venture capital industry and the number of ac- tive venture organizations increased dramatically during the late 1970s and early 1980s. An important factor accounting for the increase in money flowing into the venture capital sector was the 1979 amendment to the “prudent man” rule governing pension fund investments; also important
2. This history is based in part on Fast (1978), Gee (1994), and Venture Economics (1986), among other sources.
The origin of the formal venture capital industry in the United States dates back to the formation of American Research and Development in 1946. (Venture capital can be defined as equity or equity-linked investments in young, privately held companies, where the investor is a financial intermediary who is typically active as a director, an adviser, or even a manager of the firm.) A handful of other venture funds were established in the years after the pioneer- ing fund’s formation, but the annual flow of money into new venture funds was quite modest in the first three decades of the industry.
22 Paul A. Gompers and Josh Lerner
was the lowering of capital gains tax rates in 1978. Prior to 1979, the Employee Retirement Income Security Act limited pension funds from investing substantial amounts of money in venture capital or other high- risk asset classes. The Department of Labor’s clarification of the rule ex- plicitly allowed pension managers to invest in high-risk assets, including venture capital. Fueled by these eased restrictions and a robust market for public offerings, fund-raising by independent venture partnerships recov- ered in the early 1980s. Corporations were also once again attracted to the promise of venture investing in response. These efforts peaked in 1986, when corporate funds managed $2 billion, or nearly 12 percent of the total pool of venture capital.
After the stock market crash of 1987, however, the market for new pub- lic offerings again went into a sharp decline. Returns from and fund- raising by independent partnerships declined sharply. Corporations scaled back their commitment to venture investing even more dramatically. By 1992, the number of corporate venture programs had fallen by one-third, and their capital under management represented only 5 percent of the venture pool.
Interest in corporate venture capital climbed once again in the mid- 1990s, both in the United States and abroad. Once again, much of this interest was stimulated by the recent success of the independent venture sector: that is, the rapid growth of funds and their attractive returns. These corporate funds have invested directly in a variety of internal and external ventures as well as in funds organized by independent venture capitalists. (Venture Economics estimates that corporate investors accounted for 30 percent of the commitments to new funds in 1997, up from an average of 5 percent in the period 1990-92 [estimates compiled from various issues of the Venture Capital Journal].)
This brief discussion makes clear that corporate involvement in venture capital has mirrored (perhaps even in an exaggerated manner) the cyclic nature of the entire venture capital industry over the past three decades. At the same time, numerous discussions suggest that certain basic non- cyclic issues also have a significant effect on corporate venture capital ac- tivity.
In particular, it appears that the frequent disillusion of earlier corporate venture programs was due to three structural failings. First, these pro- grams suffered because their missions were not well defined (Fast 1978; Siegel, Siegel, and MacMillan 1988). Typically, they sought to accomplish a wide array of not necessarily compatible objectives: from providing a window on emerging technologies to generating attractive financial re- turns. The confusion over program objectives often led to dissatisfaction with outcomes. For instance, when outside venture capitalists were hired to run a corporate fund under a contract that linked compensation to financial performance, management frequently became frustrated about their failure to invest in the technologies that most interested the firm.

The Determinants of Corporate Venture Capital Success 23
A second cause of failure was insufficient corporate commitment to the venturing initiative (Hardymon, DiNino, and Salter 1983; Rind 1981; Sykes 1990). Even if top management embraced the concept, middle man- agement often resisted. Research-and-development (R&D) personnel pre- ferred that funds be devoted to internal programs; corporate lawyers dis- liked the novelty and complexity of these hybrid organizations. In many cases, new senior management teams terminated programs, seeing them as expendable “pet projects” of their predecessors. Even if they did not ob- ject to the idea of the program, managers were often concerned about its effect on the firm’s accounting earnings. During periods of financial pres- sure, money-losing subsidiaries were frequently terminated in an effort to increase reported operating earnings.
A final cause of failure was inadequate compensation schemes (Block and Ornati 1987; Lawler and Drexel 1980). Corporations have frequently been reluctant to compensate their venture managers through profit- sharing (“carried-interest”) provisions, fearing that they might need to make huge payments if their investments were successful. Typically, suc- cessful risk taking was inadequately rewarded and failure excessively pun- ished. As a result, corporations were frequently unable to attract top people (i.e., those who combined industry experience with connections to other venture capitalists) to run their venture funds. All too often, corpo- rate venture managers adopted a conservative approach to investing. No- where was this behavior more clearly manifested than in the treatment of lagging ventures. Independent venture capitalists often cut off funding to failing firms because they want to devote their limited energy to firms with the greatest promise. Corporate venture capitalists have frequently been unwilling to write off unsuccessful ventures, lest they incur the reputa- tional repercussions that a failure would entail.
1.2 The Case of Xerox Technology Ventures (XTV)
These general observations can be illustrated through a case study. The Xerox Corporation originated as a photography-paper business called the Haloid C ~ m p a n y . ~ The Haloid Company’s entrance into what would later become its principal business came in 1947, when it and the Battelle Me- morial Institute, a research organization, agreed to produce a machine based on the recently developed process named xerography. Invented by the patent lawyer Chester Carlson, xerography involved a process by which images were transferred from one piece of paper to another by means of static electricity. Rapid growth and a redirection of the company’s empha- sis toward xerography characterized the Haloid Company in the 1950s. In 1961, in recognition of the spectacular growth of sales engendered by the first plain-paper copier, the firm was renamed the Xerox Corporation.
3. The first sixteen paragraphs of this section are based on Hunt and Lerner (1995).

24 Paul A. Gompers and Josh Lerner
In response to IBM’s entrance into the copier field in the late 1960s, Xerox experimented with computers and with designing an electronic office of the future. It formed Xerox Computer Services, acquired Scien- tific Data Systems, and opened its Palo Alto Research Center (PARC) in California. These efforts were only the beginning of the copier giant’s effort to become a force in the computer industry. Throughout the 1970s, Xerox completed several acquisitions in order to further its project for an “archi- tecture of information.” Unfortunately, in assembling these noncopier com- panies and opening PARC, Xerox created a clash of cultures. Differences between its East Coast operations and its West Coast computer people would severely affect the company.
The focus for much of this division was PARC. In the 1970s, PARC was remarkably successful in developing ingenious products that would fundamentally alter the nature of computing. The Ethernet, the graphic user interface (the basis of Apple Computer’s and Microsoft’s Windows software), the “mouse,” and the laser printer were all originally developed at PARC. The culmination of much of PARC’s innovation was its develop- ment of the Alto, a very early personal computer. The Alto’s first proto- type was completed in 1973, and later versions were placed in the White House, Congress, and various companies and universities. Nonetheless, the Alto project was terminated in 1980.
Inherent in the Alto’s demise was Xerox’s relationship with PARC. Xe- rox did not have a clear-cut business strategy for its research laboratory, and, in turn, many of PARC’s technologies did not fit into Xerox’s strategic objectives. For instance, the Alto’s ability to adapt to large customers’ com- puter systems was inconsistent with Xerox’s strategy of producing work- stations compatible only with its own equipment.
The establishment of XTV was driven by two events in 1988. First, sev- eral senior Xerox managers were involved in negotiating and approving a spin-off from Xerox, ParcPlace, which sought to commercialize an object- oriented programming language developed at PARC in the 1970s. The negotiation of these agreements proved to be protracted and painful, high- lighting the difficulty that the company faced in dealing with these contin- gencies. More important, in this year a book documenting Xerox’s failure to develop the personal computer, Fumbling the Future (Smith and Alex- ander 1988), appeared. Stung by the description in the book, Xerox chair- man David Kearns established a task force with the mandate of preventing the repetition of such a failure to capitalize on Xerox innovations.
The task force reviewed Xerox’s history with corporate venture pro- grams. Xerox had invested in venture-backed firms since the early 1970s. For instance, it had joined a variety of venture capitalists in investing in Rolm, Apple, and a number of other firms. While the investments were successful financially, they were made on an ad hoc basis. In the early 1980s, Xerox established two venture funds with an external focus. These did not prove particularly successful, largely owing to disputes within the
The Determinants of Corporate Venture Capital Success 25
firm about appropriate investments. The task force, in member (and future XTV president) Robert Adams’s words, rapidly “concluded that we needed a system to prevent technology from leaking out of the company” (Armstrong 1993). The committee focused on two options: (1) to begin aggressively litigating those who try to leave with new technologies and (2) to invest in people trying to leave Xerox. Owing to variations in em- ployee noncompetition law across states (and particularly the weak level of protection afforded by the California courts), it was unclear how effec- tive a policy of aggressive litigation would be. Furthermore, such a policy might reduce Xerox’s ability to recruit the best research personnel, who might not want to limit their future mobility.
On the basis of the task force’s recommendation, Kearns decided to pursue a corporate venture capital program. He agreed to commit $30 million to invest in promising technologies developed at Xerox. As he commented at the time, “XTV is a hedge against repeating missteps of the past” (Armstrong 1993). He briefly considered the possibility of asking an established venture capital firm to run the program jointly with Xerox but decided that the involvement of another party would introduce a formality that might hurt the fledgling venture.
Modeling XTV after venture organizations had several dimensions. The most obvious was the structure of the organization. While this was a cor- porate division rather than an independent partnership (like most venture organizations), the XTV partners crafted an agreement with Xerox that resembled typical agreements between limited and general partners in ven- ture funds.
The spinout process was clearly defined in the agreement in order to ensure that disputes did not arise later on and to minimize the disruption to the organization. The XTV officials insisted on a formal procedure to avoid the ambiguity that had plagued earlier corporate ventures. The agreement made clear that the XTV partners had the flexibility to respond rapidly to investment opportunities, something that independent venture capitalists typically possess. They essentially had full autonomy when it came to monitoring, exiting, or liquidating companies. The partners were allowed to spend up to $2 million at any one time without getting permis- sion from the corporation. For larger expenditures, they were required to obtain permission from XTV’s governing board, which consisted of Xe- rox’s chief executive officer, chief financial officer, and chief patent counsel.
Similar to independent venture organizations (but unlike many corpo- rate programs), the program also had a clear goal: to maximize return on investment. The XTV partners felt that the ambiguous goals of many of the 1970s corporate venture programs had been instrumental in their down- fall. They hoped to achieve a return on investment that exceeded both the average returns of the venture capital industry and Xerox’s corporate hurdle rate for evaluating new projects.
Not only was the level of compensation analogous to that of the 20

26 Paul A. Gompers and Josh Lerner
percent carried-interest that independent venture capitalists received and the degree of autonomy similar, but XTV operated under the same ten- year time frame employed in the typical partnership agreement. Under certain conditions, however, Xerox could dissolve the partnership after five years.
The analogy to independent venture organizations also extended to the companies in which XTV invested. These were structured as separate legal entities, with their own boards and officers. XTV sought to recruit employ- ees from other start-ups who were familiar with managing new enterprises. The typical CEO was hired from the outside on the grounds that entrepre- neurial skills, particularly in financial management, were unlikely to be found in a major corporation. XTV also made heavy use of temporary executives who were familiar with a variety of organizations.
The independence of management also extended to technological deci- sion making in these companies. The traditional Xerox product-for in- stance, a copier-was designed so that it could be operated and serviced in almost any country in the world. This meant not only constraints on how the product was engineered but also the preparation of copious docu- mentation in many languages. These XTV ventures, however, could pro- duce products for “leading-edge’’ users, who emphasized technological performance over careful documentation.
Like independent venture capitalists, XTV intended to give up control of the companies in which they invested. Transferring shares to manage- ment and involving other venture capitalists in XTV companies would reduce Xerox’s ownership of the firm. Their goal was that, over the long run, after several rounds of financing, Xerox would hold from 20 to 50 percent equity stake. XTV sought to have under a 50 percent equity stake at the time a spinout firm went public. In this way, it would not need to consolidate the firm in its balance sheet (i.e., it would not need to include the company’s equity on its balance sheet, which would reduce Xerox’s return on equity). The Xerox lawyers had originally wanted only employ- ees to receive “phantom stock” (typically, bonuses based on the growth in the new units’ performance). Instead, XTV insisted that the employ- ees receive options to buy real shares in the venture-backed companies, in line with traditional Silicon Valley practices. The partners believed that this approach would have a much greater psychological effect as well as a cleaner capital structure to attract follow-on financings by outside in- vestors.
Between 1988 and 1996, the organization invested in over one dozen companies. These covered a gamut of technologies, mostly involving elec- tronic publishing, document processing, electronic imaging, workstation and computer peripherals, software, and office automation. These not only successfully commercialized technology lying fallow in the organiza- tion but also generated attractive financial returns.

The Determinants of Corporate Venture Capital Success 27
One successful example of XTV’s ability to catalyze the commerciali- zation of technological discoveries was Documentum, which marketed an object-oriented document-management system. Xerox had undertaken a large number of projects in this area for over a decade prior to Docu- mentum’s founding, but had not shipped a product. After deciding that this was a promising area, XTV recruited Howard Shao and John New- ton, both former engineering executives at the Ingress Corporation (a rela- tional database manufacturer), to lead the technical effort.
Shao spent the first six months assessing the state of Xerox’s knowledge in this area-including reviewing the several three-hundred-plus-page business plans prepared for earlier proposed (but never shipped) prod- ucts-and assessing the market. He soon realized that, while Xerox under- stood the nature of the technical problems, the company had not grasped how to design a technologically appropriate solution. In particular, the Xerox business plans had proposed building document-management sys- tems for mainframe computers rather than for networked personal com- puters (which were rapidly replacing mainframes at many organizations). With the help of the XTV officials, Shao and Newton led an effort rapidly to convert Xerox’s accumulated knowledge in this area into a marketable product. Xerox’s accumulated knowledge-as well as XTV’s aggressive funding of the firm during the Gulf War period, when the willingness of both independent venture capitalists and the public markets to fund new technology-based firms abruptly declined-gave Documentum an impres- sive lead over its rivals.
Documentum went public in February 1996 with a market capitali- zation of $351 m i l l i ~ n . ~ XTV was able to exit a number of other compa- nies successfully, whether through an initial public offering, a merger with an outside firm, or a repurchase by Xerox (at a price determined through arm’s-length bargaining). A conservative calculation (assuming that Xerox sold its stakes in firms that went public at the time of the initial public offering rather than later, after prices had substantially appreciated, and valuing investments that Xerox has not yet exited or written off at cost, less a 25 percent discount for illiquidity) indicates that the $30 million fund generated capital gains of $219 million. Given the 80/20 percent split established in the XTV agreement, the proceeds to Xerox should have been at least $175 million, those to the three XTV partners at least $44 million.
The same assumptions suggest a net internal rate of return for Xerox (i.e., after fees and incentive compensation) of at least 56 percent. This compares favorably with independent venture capital funds begun in 1989, which had a mean net return of 13.7 percent (an upper-quartile fund be- gun in that year had a return of 20.4 percent) (Venture Economics 1997).
4. The next two paragraphs are based on public security filings and press accounts

28 Paul A. Gompers and Josh Lerner
These calculations of Xerox’s internal rate of return (IRR) do not include any ancillary benefits generated by this program for the corporation. For instance, some observers argued that high-expected-value projects that might otherwise not have been funded through traditional channels (owing to the high risk involved) were increasingly funded during this pe- riod, apparently out of the fear that they would otherwise be funded by XTV and prove successful.
Despite these attractive returns, Xerox decided to terminate XTV in 1996, well before the completion of its originally intended ten-year life.5 The organization was replaced with a new one, Xerox New Enterprises (XNE), which did not seek to relinquish control of firms or to involve outside venture investors. The XNE business model called for a much greater integration of the new units with traditional business units. The autonomy offered to the XNE managers and their compensation schemes were much closer to that afforded in a traditional corporate division. As such, XNE appears to represent a departure from several of the key ele- ments that the XTV staff believed were critical to that company’s success, such as a considerable degree of autonomy and high-powered incentives.
The experience of Xerox Technology Ventures has several implications for corporate venture capital programs more generally. First, the case makes clear that, contrary to the suggestions in writings by both venture capitalists and financial economists, corporate venture capital programs need not fail. As noted above, Xerox’s financial returns were exceedingly favorable when compared to returns from comparable independent ven- ture funds. Second, XTV’s successes-such as Document Sciences and Documentum-were concentrated in industries closely related to the cor- porate parent’s core line of business (document processing). This suggests that the fund’s strong strategic focus was important in its success. Finally, the Xerox Corporation was unable to commit to a structure akin to that of a traditional venture capital partnership. Despite efforts by XTV’s founders to model the fund as closely as possible after a traditional ven- ture partnership, the fund was still dissolved early. This experience under- scores the challenges that these hybrid organizational forms face.
1.3 The Data Set
We now turn to a more systematic assessment of the experience of cor- porate venture programs. Before doing so, however, we discuss the Ven- tureOne database used in this analysis. Ventureone, established in 1987, collects data on firms that have obtained venture capital financing. The database includes firms that have received early stage equity financing
5. This paragraph is based on information from the Xerox website and Turner (1997)

The Determinants of Corporate Venture Capital Success 29
from venture capital organizations, corporate venture capital programs, and other organizations.
The companies are initially identified from a wide variety of sources, including trade publications, company web pages, and telephone contacts with venture investors. Ventureone then collects information about the businesses through interviews with venture capitalists and entrepreneurs. Among the data collected are the names of the investors, the amount and valuation of the venture financings, and the industry, history, and current status of the firm. Data on the firms are updated and validated through monthly contacts with investors and firms.6 Ventureone then markets the database to venture funds and corporate business development groups (for a detailed discussion of the database, see Gompers and Lerner [2000]).
We supplemented the Ventureone data when necessary. Information on some firms in the Ventureone sample was missing, such as an assignment to one of the 103 Ventureone industry classes or information on the firm’s start date. We examined a variety of reference sources to determine this in- formation, including the corporate Technology Directory (Corporate Tech- nology Information Service 1996), the Million Dollar Directory (Dun’s Marketing Services 1996), Ward) Business Directory of U S . Private and Public Companies (Gale Research 1996), the Directory of Leading Private Companies (National Register Publishing Company 1996), and a consider- able number of state and industry business directories in the collections of Harvard Business School’s Baker Library and the Boston Public Library. We also employed several electronic databases: the Company Intelligence and Database America compilations available through LEXIS’S COMPANY/ USPRIV library and the American Business Disk CD-ROM directory.
The investors in the Ventureone database were diverse. They included individuals, institutions (e.g., pension funds), traditional independent ven- ture funds (e.g., Kleiner, Perkins, Caufield, and Byers), and funds spon- sored by corporations, financial institutions, and government bodies. In order to understand the effect of organizational structure, in many of the analyses presented below we concentrate on two types of funds: indepen- dent venture partnerships and corporate funds. As discussed above, we eliminated other hybrid venture funds, such as those affiliated with com- mercial and investment banks, because many of these closely resembled traditional venture organizations.
In order to identify independent and corporate venture capital organi- zations, we used an unpublished database of venture organizations assem-
6. Information about the financing of private firms is typically not revealed in public docn- ments, and investors and entrepreneurs may consider this to be sensitive information. Ven- tureOne seeks to overcome this reluctance by emphasizing that its database also helps firms obtain financing. In particular, firms can alert investors whether they intend to seek further private financing or intend to go public in upcoming months.

30 Paul A. Gompers and Josh Lerner
bled by the Venture Economics Investors Services Group. Venture Eco- nomics is a unit of the Securities Data Company that tracks the venture capital industry. The organization was known as Capital Publishing when it was established in 1961 to prepare a newsletter on federally chartered small business investment companies (SBICs). Since 1977, the company has maintained a database on venture partnerships, a database that in- cludes over two thousand venture capital funds, SBICs, and related organ- izations. The Investors Services Group database is used in the preparation of directories, such as the Venture Economics annual Investment Bench- mark Performuncr. The database is compiled from information provided by venture capitalists and institutional investors. We excluded from either classification a variety of private equity investors, including individuals, SBICs, funds sponsored by banks and other financial institutions, and funds associated with financial subsidiaries of nonfinancial corporations (such as General Electric Capital). In order to determine whether a com- pany was a nonfinancial corporation, we consulted the firm directories noted above to determine the main lines of business in the year of the invest- ment. By so doing, we sought to draw as sharp a contrast as possible be- tween corporate and independent funds.
In some cases, it was difficult to ascertain whether an investor was a corporate venture organization. Some U.S. and several European compa- nies invest in companies through traditional venture capital partnerships. For example, Eastman Kodak not only makes direct equity investments, but also invests through a partnership called Aperture Partners, in which it is the sole limited partner. While we were able to identify many of these cases, we may have missed some. In other cases, independent venture or- ganizations also cater to corporate investors. A prominent example is Ad- vent, a Boston-based organization that organizes comingled funds for fi- nancial investors and other funds for single corporate limited partners. From the Ventureone database, it is usually difficult to determine whether the private equity group is investing its traditional partnerships or one of its corporate funds.
Finally, for the corporate venture capital investments, we characterized the degree of fit between the corporation and the portfolio firm. To do this, we examined the corporate annual reports of the parent firm for the fiscal years 1983, 1989, and 1994. We classified investments as to whether there was a direct fit between one of the corporation’s lines of business highlighted in the annual report closest to the year of the investment and the portfolio firm, whether there was an indirect relation, or whether there was no apparent relation at all. In the analyses below, we denoted invest- ments as having a strategic fit only if there was a direct relation between a line of business of the corporate parent and the portfolio firm. The results are robust to expanding the definition to include indirectly related transac-

The Determinants of Corporate Venture Capital Success 31
tions as well: for example, when a corporate fund invests in a firm that is a potential supplier to or customer of the corporate parent. Not all invest- ments were classified. In some cases, we were not able to determine the relation. In others, we could not obtain the proximate annual reports. In particular, it was difficult to obtain the 1983 and 1989 annual reports for many of the foreign firms.
We limited the analysis to investments in privately held firms between 1983 and 1994. While Ventureone has sought to “backfill” its database with information on earlier venture investments, its coverage of the 1970s and early 1980s is poor. Furthermore, we were concerned that the Venture- One methodology may have introduced selection biases. While the data- base does not include all venture investments between 1983 and 1994, we believe that it provides a reasonable view of the activity in the industry during this period.’ We did not include investments made after 1994 be- cause we wish to assess the outcomes of the investments: it may take sev- eral years until the fate of venture-backed firms is clear. We also eliminated a variety of investments that were outside the scope of this analysis, such as purchases of shares of publicly traded firms and other financings.
1.4 Empirical Analyses
We now analyze this sample empirically. After presenting an overview of the sample, we undertake analyses of the ultimate success of corporate and other venture investments as well as the duration of the venture invest- ment programs themselves.
1.4.1 Summary Statistics
Table 1.1 provides an overview of the sample by year. After the deletions noted above, the sample consists of 32,364 investments. Investments by independent venture funds represent over half the total transactions in the sample. Corporate venture investments represent a much smaller share, about 6 percent. Because on average about four investors participate in each financing round, the number of rounds, 8,506, is significantly smaller. Below, we analyze patterns on both the investment and the round level.8
7. For an analysis of the comprehensiveness of the Ventureone database over time, see Gompers and Lerner (2000). We address concerns about selection biases by repeating the analyses below using only observations from 1988 to 1994, when Ventureone’s coverage of the industry was much more comprehensive. The results are little changed.
8. The reader may note that the dollar amounts reported here are greater in some years than are the cumulative disbursements from venture capital funds reported elsewhere (e.g., Kortum and Lerner 1998). This reflects the fact that the Ventureone data represent total financings from all sources for privately held venture-backed firms rather than just funds from venture capital organizations.

32 Paul A. Gompers and Josh Lerner
Table 1.1 Distribution of the Sample, by Year
Number of Investments
Corporate Independent Number Dollar Year Total vc vc of Rounds Amount
1983 1984 1985 1986 1987 1988 1989 1990 1991 1992 1993 1994
1,841 2,249 2,593 2,557 2,675 2,599 2,866 2,826 2,890 3,166 3,118 2,984
53 91
139 129 152 179 202 233 249 214 198 193
1,013 1,206 1,382 1,381 1,397 1,385 1,490 1,455 1,472 1,699 1,586 1,601
436 550 625 592 642 61 1 720 784 757 91 1 93 1 947
2,219 2,905 2,910 2,394 3,065 2,687 3,069 3,640 3,207 3,891 4,532 4,973
Total 32,364 2,032 17,067 8,506 39,492
Nore: The table depicts the number of venture capital investments in the Ventureone sample by year between 1983 and 1994 as well as the number of financing rounds (a round may consist of several investments by different investors) and the aggregate amount of funding disbursed (in millions of 1994 dollars). Similar tabulations of the number of investments are presented for corporate and independent venture funds. VC = venture capital.
Table 1.2 provides a comparison of four categories of investment: the total sample, investments by corporate and independent venture capital organizations, and corporate investments where there was a strategic fit between the parent and the portfolio firm. In general, the corporate invest- ments closely resemble those of the other funds:
Status at Time of Investment. Corporate funds tend to invest slightly less frequently in start-up and mature private firms. Instead, they are dispro- portionately represented among companies in the middle stages, such as “development” or “beta.”9
Location of Firm. The sample disproportionately includes investments in firms based in California. This reflects Ventureone’s greater coverage of this region, particularly in the early years (for a discussion, see Gompers and Lerner [2000]). While corporate venture investments as a whole are slightly more common in California than are other venture investments, corporate investments with a strong strategic fit are more frequent else- where.
9. For definitions of stages, regions, and industries, see the appendix.

The Determinants of Corporate Venture Capital Success 33
Table 1.2 Characteristics of Firms at the Time of Investment
Entire Corporate Corporate VC and Independent Sample VC Only Strategic Fit VC Only
Status at time of investment (“/u):
Start-up 9.8 Development 30.5 Beta 4.1
Profitable 1.6 Restart 2.4
All Western United States 59.1 California 51.6 All Eastern United States 24.1 Massachusetts 12.8
Medical 25.5 Computer hardware 16.7 Communications 14.5 Computer software on-line
services 15.1 Other 28.1
Mean 2.4 Median 2
Shipping 45.5
Location of firm (YO):
Industry of firm (“YO):
Round of investment:
Age of firm at time of investment:
Mean 3.9 Median 3.0
Amount invested in venture round:
Mean 6.1 Median 4.3
7.1 33.6 5.5
44.4 6.9 2.5
63.1 53.1 25.2 14.0
25.9 17.0 14.2
15.1 21.9
2.8 3
4.0 3.3
6.2 4.5
6.4 35.9 6.4
42.9 5.6 2.8
59.6 51.3 29.1 16.5
24.2 16.2 22.1
14.0 23.5
2.9 3
4.2 3.4
6.0 4.1
10.4 31.2 4.1
44.8 7.3 2.3
60.8 52.1 23.4 12.6
24.2 16.8 15.5
16.2 21.3
2.4 2
3.8 2.8
5.7 4.2
Note; The sample consists of 32,364 investments in privately held venture-backed firms between 1983 and 1994. The table presents the stage of the firm’s development at the time of the investment, the geographic location of the firm, the industry of the firm, the ordinal rank of the venture round, the age of the firm at the time of the investment (in years), and the amount of the investment in the financing round (in millions of 1994 dollars). Separate tabulations are presented for investments by corporate venture firms, corporate funds where there was a strategic fit between the parent and the portfolio firms, and independent venture funds. VC = venture capital.
Industry of the Firm. Venture capital investments tend to focus on a few high-technology industries. This is even more true for corporate venture investments with a strategic focus.
Maturity of Firm and Investment Characteristics. Corporate venture funds tend to invest in later and larger financing rounds and in slightly older firms than other venture funds.
34 Paul A. Gompers and Josh Lerner
1.4.2 Success of Investments
We now consider the success of the investments by the various types of venture organizations. The discussions of the importance of the indepen- dent venture organizations’ partnership structure noted above suggest that these investors should have the greatest success. Meanwhile, potential complementarities with existing lines of business suggest that corporate investments may also perform well, at least those where there is a strong strategic fit.
The measurement of returns presents some challenging issues. Ideally, we would capture the direct and indirect returns to each class of venture investor. Unfortunately, because Ventureone does not compile the stake held by each investor, we cannot compute the direct financial returns for particular investors. Furthermore, it is difficult to identify the indirect ben- efits-for example, an insight that leads to a redirected research program in a corporate laboratory-that corporate venture investors receive, much less to quantify these benefits. As a result, we employ two less satisfactory but more tractable measures.
The first is the success of the firm receiving the funds. This is likely to be a reasonable measure for traditional venture groups. Venture capitalists generate the bulk of their profits from firms that go public. A Venture Economics (1988) study finds that a $1 .OO investment in a firm that goes public provides an average cash return of $1.95 in excess of the initial investment with an average holding period of 4.2 years. The next best alternative as estimated by Venture Economics (1988), an investment in an acquired firm, yields a cash return of only $0.40 over a 3.7-year mean holding period. This measure is also likely to have some validity for corpo- rate venture investors. If the venture fails, the key people and knowledge are likely to be scattered, and the benefits to the corporation are likely to be few. A more successful venture may or may not provide indirect bene- fits to the corporate parent but at least should have attractive financial returns.
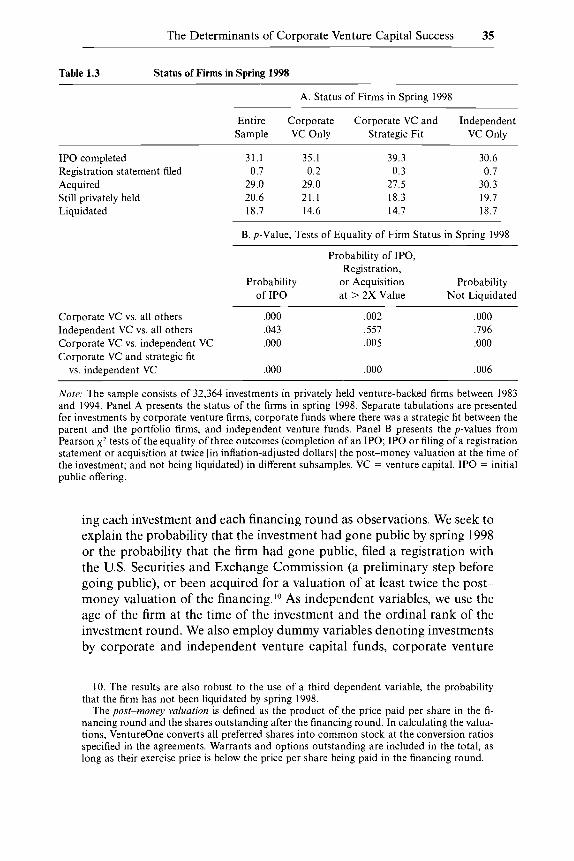
We determine the status of the firms in spring 1998 from the Venture- One database. Table 1.3 presents the outcomes for four classes of investors as well as tests of the statistical significance of the differences between them. Firms backed by corporate venture groups are significantly more likely to have gone public than those financed by other organizations and are less likely to have been liquidated. These differences are particularly strong for investments in which there was a strategic tie between the corpo- rate parent and the portfolio firm. These comparisons may be influenced, however, by differences between the firms backed by corporate and those backed by other venture investors.
To address this concern, we examine these patterns in a regression framework (see table 1.4). We estimate logit regressions, alternatively us-
The Determinants of Corporate Venture Capital Success 35
Table 1.3 Status of Firms in Spring 1998
A. Status of Firms in Spring 1998
Entire Corporate Corporate VC and Independent Sample VC Only Strategic Fit VC Only
IPO completed 31.1 35.1 39.3 30.6 Registration statement filed 0.7 0.2 0.3 0.7 Acquired 29.0 29.0 21.5 30.3 Still privately held 20.6 21.1 18.3 19.7 Liquidated 18.7 14.6 14.7 18.7
B. p-Value, Tests of Equality of Firm Status in Spring 1998
Probability of IPO, Registration,
Probability or Acquisition Probability of IPO at > 2X Value Not Liquidated
Corporate VC vs. all others ,000 ,002 Independent VC vs. all others .043 ,557
vs. independent VC ,000 ,000
Corporate VC vs. independent VC ,000 .005 Corporate VC and strategic fit
,000 .796 .ooo
,006
Note: The sample consists of 32,364 investments in privately held venture-backed firms between 1983 and 1994. Panel A presents the status of the firms in spring 1998. Separate tabulations are presented for investments by corporate venture firms, corporate funds where there was a strategic fit between the parent and the portfolio firms, and independent venture funds. Panel B presents the p-values from Pearson x 2 tests of the equality of three outcomes (completion of an IPO; IPO or filing of a registration statement or acquisition at twice [in inflation-adjusted dollars] the post-money valuation at the time of the investment; and not being liquidated) in different subsamples. VC = venture capital. IPO = initial public offering.
ing each investment and each financing round as observations. We seek to explain the probability that the investment had gone public by spring 1998 or the probability that the firm had gone public, filed a registration with the U.S. Securities and Exchange Commission (a preliminary step before going public), or been acquired for a valuation of at least twice the post- money valuation of the financing.'O As independent variables, we use the age of the firm at the time of the investment and the ordinal rank of the investment round. We also employ dummy variables denoting investments by corporate and independent venture capital funds, corporate venture
10. The results are also robust to the use of a third dependent variable, the probability that the firm has not been liquidated by spring 1998.
The post-money vuluution is defined as the product of the price paid per share in the fi- nancing round and the shares outstanding after the financing round. In calculating the valua- tions, Ventureone converts all preferred shares into common stock at the conversion ratios specified in the agreements. Warrants and options outstanding are included in the total, as long as their exercise price is below the price per share being paid in the financing round.
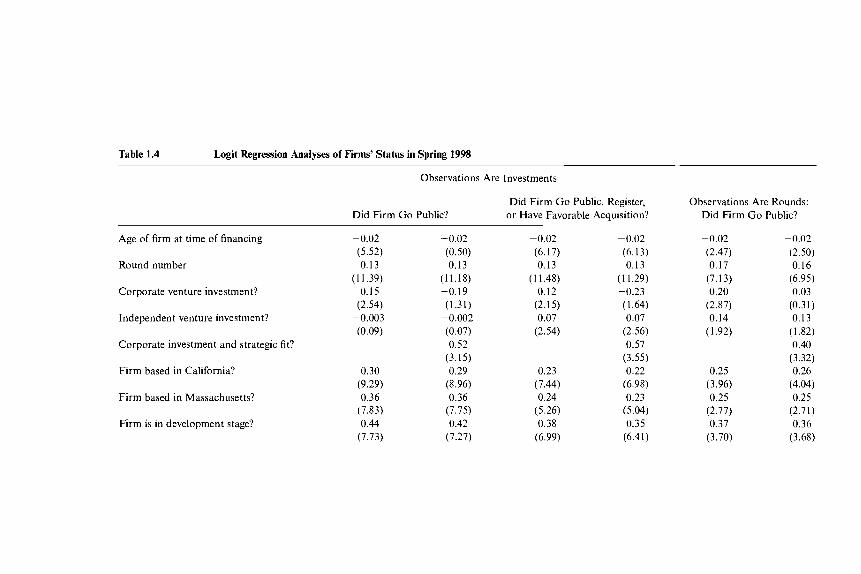
Table 1.4 Logit Regression Analyses of Firms’ Status in Spring 1998
Observations Are Investments
Did Firm Go Public, Register, or Have Favorable Acquisition?
Observations Are Rounds: Did Firm Go Public? Did Firm Go Public?
Age of firm at time of financing
Round number
Corporate venture investment?
Independent venture investment?
Corporate investment and strategic fit?
Firm based in California?
Firm based in Massachusetts?
Firm is in development stage?
-0.02 (5.52) 0.13
( I 1.39) 0.15
(2.54) -0.003 (0.09)
0.30 (9.29) 0.36
(7.83) 0.44
(7.73)
-0.02 (0.50) 0.13
(11.18) -0.19 (1.31)
-0.002 (0.07) 0.52
(3.15) 0.29
(8.96) 0.36
(7.75) 0.42
(7.27)
-0.02 (6.17) 0.13
(1 1.48) 0.12
(2.15) 0.07
(2.54)
0.23 (7.44) 0.24
(5.26) 0.38
(6.99)
-0.02 (6.13) 0.13
(1 1.29) -0.23 (1.64) 0.07
(2.56) 0.57
(3.55) 0.22
(6.98) 0.23
(5.04) 0.35
(6.41)
-0.02 (2.47) 0.17
(7.13) 0.20
(2.87) 0.14
(1.92)
0.25 (3.96) 0.25
(2.77) 0.37
(3.70)
-0.02 (2.50) 0.16
(6.95) 0.03
(0.31) 0.13
(1.82) 0.40
(3.32) 0.26
(4.04) 0.25
(2.71) 0.36
(3.68)

Firm is in beta stage?
Firm is in shipping stage?
Firm is in profitable stage?
Firm is in restart stage?
Log-likelihood -
X*-statistic p-value Number of observations
0.25 (2.83) 0.38
(6.28) 1.32
(17.08) -0.56 (4.20)
14,743.6 2,409.9
0.000 24,515
0.22 (2.50) 0.36
(5.95) 1.30
(16.61) -0.56 (4.19)
- 14,252.0 2,362.4
0.000 23,740
0.14 (1.60) 0.30
(5.20) 1.10
(14.77) -0.43 (3.64)
- 15,477.4 -
2,065.5 0.000
243 15
0.11 (1.24) 0.28
(4.82) 1.08
(14.27) -0.45 (3.71)
- 14,973.7 - 2,025.7
0.000 23,740
0.13 (0.70) 0.33
(3.12) 1.44
(10.52) -0.45 (1.70)
3,694.4 609.0
0.000 6,445
0.13 (0.69) 0.34
(3.23) 1.46
(10.65)
(1.68) -0.45
-3,688.9 620.1
0.000 6,445
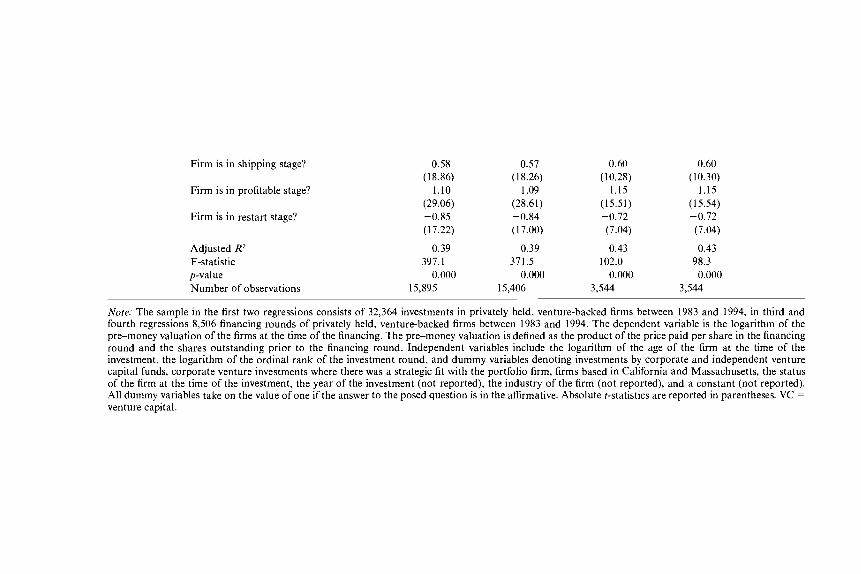
Note: The sample in the first four regressions consists of 32,364 investments in privately held venture-backed firms between 1983 and 1994, in the fifth and sixth regressions 8,506 financing rounds of privately held, venture-backed firms between 1983 and 1994. The dependent variable in the first, second, fifth, and sixth regressions is a dummy variable that takes on the value of one if the firm had gone public by spring 1998. In the third and fourth regressions, the dummy takes the value of one if the firm had gone public, filed a registration statement, or been acquired at twice (in inflation-adjusted dollars) the post-money valuation at the time of the investment by spring 1998. Independent variables include the age of the firm at the time of the investment, the ordinal rank of the investment round, and dummy variables denoting investments by corporate and independent venture capital funds, corporate venture investments where there was a strategic fit with the portfolio firm, firms based in California and Massachusetts, the status of the firm at the time of the investment, the year of the investment (not reported), the industry of the firm (nst reported), and a constant (not reported). All dummy variables take on the value of one if the answer to the posed question is in the affirmative. Absolute t-statistics are reported in parentheses.

38 Paul A. Gompers and Josh Lerner
investments where there was a strategic fit with the portfolio firm, firms based in California and Massachusetts, the status of the firm at the time of the investment, the year of the investment, the industry of the firm, and a constant.
The results are consistent with the univariate comparisons reported above. Corporate venture investments are significantly more successful than other investments. (In most of the regressions, independent venture investments are also more successful, although the effect is smaller in mag- nitude and statistical significance.) When the dummy variable denoting cor- porate venture investments with a strategic fit is added to the regressions, the corporate venture dummy variable becomes insignificant (and fre- quently negative). Corporate venture investments in general do not per- form better, only those with a strategic fit. These results seem consistent with the complementarities hypothesis outlined above.
Our second proxy for the direct and indirect returns for corporate and other investors is the valuation assigned to the firm at the time of the investment. All else being equal, the higher the valuation (i.e., the higher the price paid per share), the lower the direct financial returns to the in- vestor (subject to the caveats outlined in the discussion below). For each investment round for which data were available (about half the entire sample), we computed the pre-money valuation, the product of the price paid per share in the financing round, and the shares outstanding before the financing round."
Table 1.5 presents the pre-money valuations for the four classes of in- vestors tabulated above as well as tests of the statistical significance of these differences. Corporate venture funds do appear to pay significantly more, with a mean pre-money valuation of $28.5 million, as compared to an average of $18.1 million for the independent venture firms. Corporate investments in which there is a strategic fit are also priced at a premium, but the average price ($26.9 million) is lower than that of the other corpo- rate investments.
Once again, we seek to corroborate these patterns through a regression analysis (see table 1.6). Following the approach of Gompers and Lerner (2000), we estimate a hedonic regression, seeking to explain the logarithm of the pre-money valuations (for a detailed discussion of this methodol- ogy, see that paper). Once again, we use each investment and each financ- ing round as observations. As independent variables, we use the logarithm of the age of the firm at the time of the investment and the logarithm of the ordinal rank of the investment round. We also employ dummy variables denoting investments by corporate and independent venture capital funds,
1 1 . As discussed at length in Lerner (l994), the pre-money valuation is a more appropriate dependent variable than the post-money valuation because it is independent of the amount invested in the firm during the current financing round. As Gompers (1995) discusscs, the amount invested may vary with many considerations, including the fund-raising environ- ment.

The Determinants of Corporate Venture Capital Success 39 ~-
Table 1.5 Pre-Money Valuation at the Time of Financing
A. Pre-Money Valuation at Time of Financing
Entire Corporate Corporate VC and Independent Sample VC Only Strategic Fit VC Only
Mean Median
20.1 28.5 26.9 18.1 12.9 17.4 15.9 11.7
Corporate VC vs. all others Independent VC vs. all others Corporate VC vs. independent VC Corporate VC and strategic fit vs.
independent VC
B. p-Value, Tests of Equality of Pre-Money Valuations
Mean Median
,000 .ooo ,000
,000
.ooo ,000 .ooo
,000
Note: The sample consists of 32,364 investments in privately held venture-backed firms between 1983 and 1994. Panel A presents the mean and median pre-money valuation of the firms at the time of the financing. The pre-money valuation is defined as the product of the price paid per share in the financing round and the shares outstanding prior to the financing round. Separate tabulations are presented for investments by corporate venture firms, corporate funds where there was a strategic fit between the parent and portfolio firms, and independent venture funds. Panel B presents the p-values from t-tests and Wilcoxon rank-sum tests of the equality of the mean and median valuations in different subsam- ples. VC = venture capital.
corporate venture investments where there was a strategic fit with the port- folio firm, firms based in California and Massachusetts, the status of the firm at the time of the investment, the year of the investment, the industry of the firm, and a constant.
We find results similar to those in the univariate comparisons. Corpo- rate venture investments are associated with between 18 and 30 percent higher valuations, while those by independent funds are associated with between 7 and 18 percent lower valuations. The dummy variable denoting corporate venture investments with a strategic fit is inconsistent in sign and never significant.
These results suggest two possible interpretations. First, traditional ven- ture investors and entrepreneurs could be exploiting the relative inexperi- ence of the corporate venture investors, persuading them to invest in over- valued transactions (see, e.g., AbuZayyad et al. 1997). Second, corporate investors are likely to enjoy some indirect benefits from their involvement with portfolio firms that independent venture firms do not enjoy. Standard bargaining models (e.g., Nash 1950) suggest that the additional surplus enjoyed by the corporation will lead to corporate venture capitalists in- vesting at higher prices than others. In this way, some of the additional value created will be allocated to the smaller firm and its existing investors.
Disentangling these interpretations is difficult. Nonetheless, we are struck by the lack of a relation between the price premium paid and the

Table 1.6 Ordinary Least Squares Regression Analyses of the Pre-Money Valuation at the Time of the Financing
Observations Are Investments Observations Are Rounds
Logarithm of age of firm
Logarithm of round number
Corporate venture investment?
Independent venture investment?
Corporate investment and strategic fit?
Firm based in California?
Firm based in Massachusetts?
Firm is in development stage?
Firm is in beta stage?
0.14 (1 1.32)
0.68 (49.43)
0.18 (7.39)
-0.07 (5.76)
0.20 (14.78)
0.06 (2.79) 0.40
(14.08) 0.51
(1 3.24)
0.14 (1 1.26)
0.69 (48.94)
0.26 (4.38)
-0.07 (5.75)
-0.09 (1.37) 0.20
(14.54) 0.06
(2.82) 0.38
(13.30) 0.50
(12.81)
0.15 (6.01) 0.68
(24.09) 0.30
-0.18 (9.43)
(4.85)
0.14 (4.76) 0.03
(0.61) 0.37
(7.01) 0.48
(6.1 1)
0.15 (6.00) 0.68
(24.04) 0.27
(6.76) -0.18 (4.91) 0.07
(1.22) 0.14
(4.80) 0.03
(0.59) 0.37
(6.99) 0.48
(6.10)
Firm is in shipping stage?
Firm is in profitable stage?
Firm is in restart stage?
Adjusted R2 F-statistic p-value Number of observations
0.58 0.57 0.60 0.60 (18.86) (18.26) (10.28) (10.30)
1.10 1.09 1.15 1.15 (29.06) (28.61) (15.51) (15.54) -0.85 -0.84 -0.72 -0.72 (17.22) (17.00) (7.04) (7.04)
0.39 0.39 0.43 0.43 397. I 371.5 102.0 98.3
0.000 0.000 0.000 0.000 15,895 15,406 3,544 3,544
Note; The sample in the first two regressions consists of 32,364 investments in privately held, venture-backed firms between 1983 and 1994, in third and fourth regressions 8,506 financing rounds of privately held, venture-backed firms between 1983 and 1994. The dependent variable is the logarithm of the pre-money valuation of the firms at the time of the financing. The pre-money valuation is defined as the product of the price paid per share in the financing round and the shares outstanding prior to the financing round. Independent variables include the logarithm of the age of the firm at the time of the investment, the logarithm of the ordinal rank of the investment round, and dummy variables denoting investments by corporate and independent venture capital funds, corporate venture investments where there was a strategic fit with the portfolio firm, firms based in California and Massachusetts, the status of the firm at the time of the investment, the year of the investment (not reported), the industry of the firm (not reported), and a constant (not reported). All dummy variables take on the value of one if the answer to the posed question is in the affirmative. Absolute t-statistics are reported in parentheses. VC = venture capital.

42 Paul A. Gompers and Josh Lerner
degree of strategic fit. We suggest that this may reflect the fact that corpo- rations are also more savvy investors in companies close to their existing lines of business. While the indirect benefits to the parent may be greater in these instances, resulting in a willingness to pay more, its understanding of the market is also likely to be better. As a result, the corporation may be less likely to invest in overpriced transactions in these cases. In areas outside the corporation’s experience, overpaying for investments may be a more common phenomenon.
1.4.3 Duration of Programs
Finally, we consider the duration of the venture organizations. Table 1.7 presents several measures of the stability of these organizations. First, we examine the total number of investments in the sample. Similarly, we ex- amine the time span (in years) between the first and the last investment in the sample by each venture organization. (A venture organization that made a single investment would be coded as having a time span of 0.)
Both these measures, however, are somewhat problematic. Many corpo- rate venture programs have begun in recent years. As a result, they may have made only a few investments to date. This does not imply, however, that they will not continue to exist for a long time. To control for this “vin- tage effect,” we create a third measure: the time between the first and the last investments by the venture organization in the sample expressed as a percentage of the time from the first investment by the venture organiza- tion to December 1994. Using this approach, both a long-standing ven- ture group and a relatively recent program that remains active through the end of the sample period would be coded as 1 .O.
Unlike the earlier analyses, we confine the analysis (and that in table 1.8 below) to independent and corporate venture funds. Some of the other investors are reported in an inconsistent manner, which would make this type of analysis potentially misleading. For instance, when only a small number of individuals invest, the more prominent ones are identified by name. When a large number invest, all are lumped together as “individ- uals.”
Stark differences appear between the corporate and the independent funds. The corporations make a mean of 4.4 investments over 2.5 years, while the independent funds make 43.5 investments over 7.1 years. Even using the ratio of the active time span to the possible time span, the differ- ences are dramatic: the average is 34.8 percent for the corporate funds, as opposed to 7 1.7 percent for the independent funds. The differences are less extreme, but still significant, for the corporate programs where there was a strategic fit in at least half the investments.
We then examine these patterns in a regression analysis (see table 1 .8). The first two regressions employ all corporate and independent venture organizations in the sample as observations, the second set only those
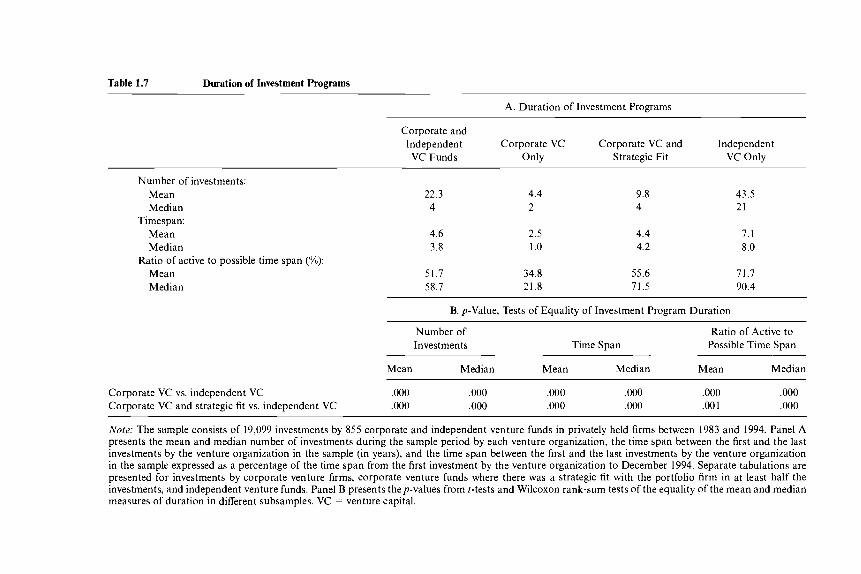
Table 1.7 Duration of Investment Programs
A. Duration of Investment Programs
Corporate and lndependent Corporate VC Corporate VC and Independent VC Funds Only Strategic Fit VC Only
Number of investments: Mean Median
Timespan: Mean Median
Mean Median
Ratio of active to possible time span (“YO):
22.3 4
4.6 3.8
4.4 2
2.5 1 .o
51.7 34.8 58.7 21.8
9.8 4
4.4 4.2
55.6 71.5
43.5 21
7. I 8.0
71.7 90.4
B. p-Value, Tests of Equality of Investment Program Duration
Number of Ratio of Active to Investments Time Span Possible Time Span
Mean Median Mean Mean Median Median
Corporate VC vs. independent VC ,000 ,000 ,000 .ooo ,000 ,000 Corporate VC and strategic fit vs. independent VC ,000 ,000 ,000 .ooo .oo 1 .ooo
Noret The sample consists of 19,099 investments by 855 corporate and independent venture funds in privately held firms between 1983 and 1994. Panel A presents the mean and median number of investments during the sample period by each venture organization, the time span between the first and the last investments by the venture organization in the sample (in years), and the time span between the first and the last investments by the venture organization in the sample expressed as a percentage of the time span from the first investment by the venture organization to December 1994. Separate tabulations are presented for investments by corporate venture firms, corporate venture funds where there was a strategic fit with the portfolio firm in at least half the investments, and independent venture funds. Panel B presents thep-values from r-tests and Wilcoxon rank-sum tests of the equality of the mean and median measures of duration in different subsamples. VC = venture capital.

44 Paul A. Gompers and Josh Lerner
Table 1.8 Double-Censored Regression Analyses of Duration of Investment Program
All Corporate Corporate and and Independent Independent Funds with
VC Funds 2 4 Investments
Date of first investment
Corporate venture fund?
Corporate investment and
Constant strategic fit?
Log-likelihood X2-statistic p-value Number of observations
-0.05 (10.15) -0.32 (8.98)
103.85 (10.22)
290.2
855
-586.2
0.000
-0.05 (9.69)
-0.39 (10.77)
0.35 (6.42) 96.77 (9.76)
- 566.1 330.5
855 0.000
-0.0003
-0.11 (0.07)
(4.55)
1.47 (0.18)
-52.2 23.0 0.000
450
0.001 (0.28)
-0.16 (6.03) 0.15
(3.95) -1.45 (0.18)
-59.9 38.4 0.000
450
Note: The sample consists of 855 corporate and independent venture funds that invested in privately held firms between 1983 and 1994. The dependent variable is the time between the first and the last investments by the venture organization in the sample expressed as a per- centage of the time from the first investment by the venture organization to December 1994. The first two regressions employ all observations, the second set only those organizations with four or more investments in the sample. Independent variables include the date of the venture organization’s first investment (with an investment in May 1992 expressed as 1992.4 etc.), dummy variables denoting observations of corporate venture capital funds and of cor- porate venture funds where there was a strategic fit with the portfolio firm in at least half the investments, and a constant. All dummy variables take on the value of one if the answer to the posed question is in the affirmative. Absolute t-statistics are reported in parentheses. VC = venture capital.
organizations with four or more investments in the sample.12 As a depend- ent variable, we use the ratio of the time span that the fund was active to the time span from its first investment to December 1994. Independent variables include the date of the venture organization’s first investment, dummy variables denoting observations of corporate venture capital funds and of corporate venture funds where there was a strategic fit with the portfolio firms in at least half the investments, and a constant. Reflecting the fact that the dependent variable must fall between zero and one, we employ a double-censored regression specification.
Once again, the corporate venture programs have a significantly shorter duration. The dummy variable for corporate venture programs in which at least half the investments were strategic, however, has a positive coeffi- cient of almost equal magnitude. While corporate programs without a stra-
12. In this way, we seek to examine whether groups that dissolve after only one or two investments drive the results or whether this is a more general pattern. The results are also robust to the use of other cut-off points.

The Determinants of Corporate Venture Capital Success 45
tegic focus are very unstable, those with such a focus appear to have a longevity equivalent to more traditional independent funds, at least using this measure.
We consider two explanations for the shorter time span of the corporate investments. One possibility is that this is a response to technological change. An extensive literature on the economics of innovation has high- lighted that new entrants often exploit technological breakthroughs in more innovative and aggressive ways than do the established incumbents and that these changes are often associated with dramatic shifts in market 1eader~hip.I~ In many cases, product leaders have rapidly lost their com- manding position after many years of dominance. Academics have attrib- uted these patterns to a rational reluctance on the part of existing industry leaders to jeopardize their current revenues and profits as well as to the myopic reluctance of many successful organizations to recognize that their leadership is waning. (In many instances, the continuing financial success of mature product lines masks the organizations’ failure to introduce new
Corporate venture capital programs may be a response to these short-run periods of technological discontinuity. Once this transi- tion period has passed, the corporation may dissolve the effort.
Alternatively, the instability may reflect the manner in which the cor- porate programs are designed. One important argument in favor of the decade-long partnership structure typically employed by independent ven- ture funds is that it allows venture capitalists to make long-run invest- ments without the fear of demands to liquidate their portfolios. (For a discussion of how such fears can affect the behavior of hedge fund manag- ers, who typically do not have these protections, see Shleifer and Vishny [ 19971.) Corporate venture funds are typically structured as corporate divi- sions or affiliates without the protections afforded by a legal partnership agreement. Furthermore, field research suggests that corporate venture groups are often plagued by defections of their most successful investors, who become frustrated at their low level of compensation. These defec- tions may also affect the stability of the groups. This view suggests that all corporate venture programs should be less stable.
It is a challenge to reconcile either hypothesis with the evidence. If pro- grams were generally designed to address short-run technological discon- tinuities, it should be the strategic programs that were of the shortest dura-
13. Two academic studies documenting these patterns (there are also many other more
14. For an overview, see Reinganum (1989). 15. For instance, the pharmaceutical industry was ill prepared for the biotechnology revo-
lution in the early 1980s. Henderson and Cockburn (1996) show that the more successful firms responded by aggressively establishing outside relationships to access new ideas in response to this technological discontinuity. One avenue through which the firms built exter- nal relationships was corporate venture programs.
anecdotal accounts) are Henderson (1993) and Lerner (1997).
46 Paul A. Gompers and Josh Lerner
tion. This is clearly not the case. The structural view suggests that most corporate venture programs should be terminated rapidly, which is hard to reconcile with the success of programs with strong strategic objectives. One possibility is that the organizations without a clear strategic focus also tend to be the ones with a low degree of autonomy and low levels of incentive compensation. Thus, the limited duration of the funds without a clear strategic focus may be a proxy for the organizational structure employed by independent venture funds.
1.5 Conclusions
This paper has compared investments by corporate venture organiza- tions with those of independent and other venture groups. Corporate ven- ture investments in entrepreneurial firms appear to be at least as success- ful (using such measures as the probability of the portfolio firm going public) as those backed by independent venture organizations, particularly when there is a strategic overlap between the corporate parent and the portfolio firm. While corporate venture capitalists tend to invest at a pre- mium to other firms, this premium appears to be no higher in investments with a strong strategic fit. Finally, corporate programs without a strong strategic focus appear to be much less stable, frequently ceasing operations after only a few investments, but strategically focused programs appear to be as stable as independent venture organizations. The evidence is consis- tent with the existence of complementarities that allow corporations to select and add value to portfolio firms effectively, but it is somewhat at odds with the suggestion that the structure of corporate funds introduces distortions.
The paper suggests that the presence of a strong strategic focus is critical to the success of corporate venture funds. This subset of corporate funds appears to have been quite successful, despite having very different struc- tures from traditional funds. This finding appears to challenge the empha- sis in the finance literature on the importance of the partnership structure employed by independent private equity funds. But, as alluded to in sec- tion 1.4 above, it may well be that corporate programs without a clear strategic focus are also the ones with a low degree of autonomy and low levels of compensation. To distinguish between these hypotheses com- prehensively, we would need to have information on the compensation schemes and organizational structures employed by these groups. This pa- per has only skimmed the surface of this issue, and this is a rich area for further exploration, which we hope to undertake in future research.
The analysis raises several puzzles that cannot be answered with the existing data. We end by highlighting two of these. First, why do corpora- tions set up programs that appear likely to be unsuccessful? In the sample,

The Determinants of Corporate Venture Capital Success 47
for instance, we see repeated examples of funds being established that do not have a clear relationship to the corporate parent’s lines of business. Certainly, in many cases, carefully thought through proposals appear to have been modified during the review process in ways that are likely sub- stantially to reduce their likelihood of success. Understanding these pro- cesses and placing them in the context of the broader literature on the problems that can beset corporate decision making are interesting areas for future research.
Second, is there an optimal mixture between internally funded corpo- rate research and outside ideas accessed through initiatives such as cor- porate venture programs? Some high-technology corporations, such as AT&T and IBM, have historically funded internal research laboratories at high levels. Other high-technology giants, such as Cisco Systems, have re- lied on acquisitions and strategic investments to identify and access prod- uct and process innovations. The “make-or-buy’’ decisions that corporate R&D managers face is an important but little-researched issue.
Appendix Definition of Firm Categorizations
The definitions provided below have been adapted from Ventureone (1998).
Investment Stages
Start-up: Company with a skeletal business plan, product, or service de- velopment in preliminary stages.
Development: Product or service development is under way, but the com- pany is not generating revenues from sales.
Beta: For companies specializing in information technology, the beta phase is when the product is being tested by a limited number of cus- tomers but not available for broad sales. For life sciences companies, beta is synonymous with a drug in human clinical trials or a device being tested.
Shipping: The product or service is being sold to customers, and the com- pany is deriving revenues from those sales, but expenses still exceed rev- enues.
Profitable: The company is selling products or services, and the sales reve- nue yields a positive net income.
Restart: A recapitalization at a reduced valuation, accompanied by a sub- stantial shift in the product or marketing focus.

48 Paul A. Gompers and Josh Lerner
Industry Groups
Computer hardware: Firms whose primary lines of business are personal computing, minicomputers or workstations, mainframe computers, CAD/CAM/CAE systems, data storage, computer peripherals, memory systems, office automation, source data collection, multimedia devices, and computer networking devices.
Computer software: Firms whose primary lines of business are compilers, assemblers, and systems, application, CAD/CAM/CAE/CASE, recre- ational and home, artificial intelligence, educational, multimedia soft- ware, and on-line services.
Communications: Firms whose primary lines of business include modems, computer networking, fiber optics, microwave and satellite communica- tions, telephone equipment, pocket paging, cellular phones, radar and defense systems, television equipment, teleconferencing, and television and radio broadcasting.
Medical: Firms whose primary lines of business include biotechnology, pharmaceuticals, diagnostic imaging, patient monitoring, medical de- vices, medical lab instruments, hospital equipment, medical supplies, retail medicine, hospital management, medical data processing, and medical lab services.
Regions
Eastern United States: Firms whose headquarters are located in Connecti- cut, Delaware, the District of Columbia, Maine, Maryland, Massachu- setts, New Hampshire, New Jersey, New York, Pennsylvania, Rhode Island, Vermont, and West Virginia.
Western United States: Firms whose headquarters are located in Alaska, Arizona, California, Colorado, Hawaii, Idaho, Montana, Nevada, New Mexico, Oregon, Utah, Washington, and Wyoming.
References
AbuZayyad, Tarek, Thomas J. Konick, Josh Lerner, and Paul C. Yang. 1996. GO Corporation. Case 9-297-021, Teaching Note 5-298-153. Harvard Business School.
Armstrong, Larry. 1993. Nurturing an employee’s brainchild. Business Week, 23 October, 196.
Athey, Susan, and Scott Stern. 1997. An empirical framework for testing theories about complementarity in organizational design. Working paper. Massachusetts Institute of Technology, Sloan School of Management.
Block, Zenas, and Oscar A. Ornati. 1987. Compensating corporate venture man- agers. Journal of Business Venturing 2:41-52.

The Determinants of Corporate Venture Capital Success 49
Brav, Alon, and Paul A. Gompers. 1997. Myth or reality? The long-run underper- formance of initial public offerings: Evidence from venture capital and nonven- ture capital-backed companies. Journal of Finance 52: 179 1-1 821.
Chevalier, Judith A., and Glenn D. Ellison. 1997. Risk taking by mutual funds as a response to incentives. Journal of Political Economy 105: 1167-1200.
Cordell, Lawrence R., Gregor D. MacDonald, and Mark E. Wohar. 1993. Cor- porate ownership and the thrift crisis. Journal of Law and Economics 36:719- 756.
Corporate Technology Information Services. Various years. Corporate technology directory. Woburn, Mass.
Dun’s Marketing Services. Various years. Million dollar directory. Parsippany, N.J. Fast, Norman D. 1978. The rise and fall of corporate new venture divisions. Ann
Arbor, Mich.: UMI Research. Gale Research. Various years. Wards business directory of U S . private and public
companies. Detroit. Gee, Robert E. 1994. Finding and commercializing new businesses. ResearchlTech-
nology Management 37 (January/February): 49-56. Gompers, Paul A. 1995. Optimal investment, monitoring, and the staging of ven-
ture capital. Journal of Finance 50: 1461-89. Gompers, Paul A., and Josh Lerner. 1996. The use of covenants: An analysis of
venture partnership agreements. Journal of Law and Economics 39:463-98. . 1998. Venture capital distributions: Short- and long-run reactions. Journal
of Finance 53 (December): 2161-83. , 1999. An analysis of compensation in the U.S. venture capital partnership.
Journal of Financial Economics 5 1 (January): 3-44. . 2000. Money chasing deals? The impact of fund inflows on private equity
valuations. Journal of Financial Economics 55, no. 2:28 1-325. Hardymon, G. Felda, Mark J. DeNino, and Malcolm S. Salter. 1983. When cor-
porate venture capital doesn’t work. Harvard Business Review 61 (May-June): 114-20.
Henderson, Rebecca. 1993. Underinvestment and incompetence as responses to radical innovation: Evidence from the photolithographic alignment equipment industry. Rand Journal of Economics 24:248-70.
Henderson, Rebecca, and Iain Cockburn. 1996. Scale, scope, and spillovers: The determinants of research productivity in drug discovery. Rand Journal of Eco- nomics 27:32-59.
Hunt, Brian, and Josh Lerner. 1995. Xerox Technology Ventures: March 1995. Case 9-295-127, Teaching Note 9-298-1 52. Harvard Business School.
Jensen, Michael C. 1993. Presidential address: The modem industrial revolution, exit, and the failure of internal control systems. Journal of Finance 48:831-80.
Kortum, Samuel, and Josh Lerner. 1998. Does venture capital spur innovation? NBER Working Paper no. 6846. Cambridge, Mass.: National Bureau of Eco- nomic Research.
Kroszner, Randall S., and Raghuram G. Rajan. 1994. Is the Glass-Steagall Act justified? A study of the U.S. experience with universal banking before 1933. American Economic Review 84:810-32.
Lawler, E., and J. Drexel. 1980. The corporate entrepreneur. Los Angeles: Center for Effective Organizations/University of Southern California, Graduate School of Business Administration.
Lerner, Josh. 1994. The importance of patent scope: An empirical analysis. Rand Journal of Economics 25319-33.
. 1997. An empirical examination of a technology race. Rand Journal of Economics 28:228-47.

50 Paul A. Gompers and Josh Lerner
Muscarella, Chris J., and Michael R. Vetsuypens. 1990. Efficiency and organiza-
Nash, John F. 1950. The bargaining problem. Econometrica 18: 155-62. National Register Publishing Co. Various years. Directory of leadingprivate compa-
nies, including corporate aflliations. Wilmette, Ill. Reinganum, Jennifer R. 1989. The timing of innovation: Research, development,
and diffusion. In The handbook of industrial organization, ed. R. Schmalensee and R. D. Willig. New York: North-Holland.
Rind, Kenneth W. 1981. The role of venture capital in corporate development. Strategic Management Journal 2: 169-80.
Shleifer, Andrei, and Robert W. Vishny. 1997a. The limits of arbitrage. Journal of Finance 52:35-55.
tions structure: A study of reverse LBOs. Journal of Finance 45:1389%1414.
. 1997b. A survey of corporate governance. Journal of Finance 52:737-83. Siegel, Robin, Eric Siegel, and Ian C. MacMillan. 1988. Corporate venture capital-
ists: Autonomy, obstacles, and performance. Journal of Business Venturing 3:
Smith, Douglas K., and Robert C. Alexander. 1988. Fumbling the future: How Xe-
Sykes, Hollister B. 1990. Corporate venture capital: Strategies for success. Journal
Turner, Nick. 1997. Xerox inventions now raised instead of adopted by others.
Venture Capital Journal. Various issues. Newark, N.J.: Venture Economics. Venture Economics. 1986. Corporate venture capital study. Newark, N.J. Type-
233-47.
rox invented, then ignored, thejrst personal computer New York: Morrow.
of Business Venturing 5:37-47.
Investors’ Business Daily, 28 January, A6.
script. . 1988. Exiting venture capital investments. Newark, N.J. . 1997. Investment benchmark reports-venture capital. Newark, N.J. . Annual. Investment benchmark performance. Newark, N.J.
Ventureone. 1998. Ventureone 1997 annual report. San Francisco.
Comment Michael S. Weisbach
The paper by Paul Gompers and Josh Lerner is one of the first to study corporate venture programs. It starts with speculation from the literature that corporate venture capital funds will underperform other venture cap- ital programs. This underperformance would presumably occur because of agency problems inside corporations that discourage high-powered in- centives and risk taking inside corporate venture capital units as well as because of a lack of a well-defined mission for the venture capital divi- sion (making money or providing technology to the rest of the firm?). To counter this point, Gompers and Lerner point out that corporate venture capital programs have some advantages from complementarities with the firm’s existing assets that potentially offset some of these disadvantages.
The goal of the paper is to evaluate empirically whether the literature’s
Michael S. Weisbach is the I.B.E. Distinguished Professor of Finance at the University of Illinois at Urbana-Champaign.

The Determinants of Corporate Venture Capital Success 51
speculation about the relative performance of corporate venture capital funds is correct. The two offsetting factors that make this a potentially interesting empirical exercise are the agency costs discussed by the litera- ture and the complementarities between the investments and the firm’s assets. One issue that I have with this approach is that Gompers and Ler- ner do not spell out exactly what one would expect to observe in the data a priori. Both effects are undoubtedly present in some cases and are not mutually exclusive. In addition, sample-selection issues are not really dis- cussed in the paper-if all programs are undertaken only if the net ex- pected profitability (including expected agency costs and/or complemen- tarities) is positive, it is not clear what the relative profitability of programs that corporate and independent programs actually undertaken would be.
The first part of the paper presents a case study of Xerox’s capital divi- sion, Xerox Technology Ventures. This case makes interesting reading, and the authors describe how this division of Xerox was outrageously profitable, in large part because of investments in a company called Docu- mentum. What is not clear to me is why the case is included in the paper. It was clearly a positive outlier, but, if all that the authors wanted to dem- onstrate was that there were positive outliers, I would recommend some kind of plot of all the data. Such a plot would give the reader a feel for how likely such a positive outlier is. Sometimes case studies provide useful lessons not easily conveyed by conventional empirical work; however, I do not see that such lessons are learned here.’ I would encourage the authors to provide a better explanation of why they included the case in their study.
The main empirical findings of the paper were as follows: First, corpo- rate investments, particularly “strategic” ones, go public more often than do independent venture capital investments (39.3 percent for corporate strategic investments, 35.1 percent for all corporate investments, and 30.6 percent for independent venture capital investments). Second, corporate investments have higher “pre-money valuations” than do independent ven- ture capital investments. (Pre-money v u h t i o n refers to the valuation of the firm at the time the investment is made, equal to the product of the price paid per share times the number of shares outstanding prior to the investment.) Third, corporate venture capital programs have shorter dura- tions than independent venture capital funds.
My overall reaction is that I liked the paper. It is on an important topic that the authors clearly know well. I learned a lot from it. I just wish that I could have learned more and feel that I will in subsequent work on the topic.
In terms of the specific results presented in the paper, I would caution
1. One paper that does use case studies effectively is Lerner and Merges (1998). In the discus- sion at the conference, Krishna Palepu pointed out that this case does serve as a counter- example to the arguments in the literature and, as such, serves a useful purpose for this reason.

52 Paul A. Gompers and Josh Lerner
the reader about interpreting the higher initial public offering rate for cor- porate investments as meaning higher profitability. One agency problem common in corporations is that they are likely to be overly conserva- tive in their investments. Compared to independent venture capital funds, they probably are not going to undertake as risky investments and also are likely to undertake higher-quality investments. The authors do control (probably as well as they can given the available data) for the maturity of the companies in which the programs invest. Nonetheless, it seems likely that their measures are fairly crude proxies for the expected profitability of the companies. One possibility that the authors cannot really rule out is that the corporate venture programs invest in pricier but higher-potential companies but do not either add more value through their monitoring or make more money on their investments.
The comparison between corporate and independent venture capital programs also ignores other benefits that go to the corporations sponsor- ing the programs. For example, I recently had a speaker in my M.B.A. class who works in this industry. He told the class that you should never take money from Microsoft-they will just steal your idea and do the same thing inside their own company! The point is that Microsoft makes its money not directly through its investments but through the effect of those investments on the profitability of Microsoft’s other assets.
In addition, the paper argues that the companies “invest at a premium.” The authors imply that this result means that the companies overpay for their investments. I am not sure that this interpretation is appropriate. It seems to me that the corporate valuations must be scaled by something like assets or earnings for this measure to make sense. This result, like the previous one, is consistent with the possibility that the corporate venture programs simply invest in higher-quality start-up companies than do inde- pendent venture capital funds. I think that this is an interesting interpreta- tion and that it deserves some discussion in the paper. I would also like to encourage the authors to think about the general issue of how one would distinguish between a fund that makes higher-quality investments ex ante and one that does a better job of monitoring once it has made the invest- ments.
In conclusion, I think that the paper opens up a whole series of interest- ing questions about corporate venture capital. I found it a bit frustrating that the questions on the topic that I thought were the most interesting really are not discussed in this paper. For example, Why do companies have some research projects done internally, some through contracts with an external firm, and some through “hybrid” contracts like a corporate venture capital program? Why are the contracts in corporate venture capi- tal programs structured the way they are? What organizational forces limit the scope of corporate venture capital? To what extent are agency prob- lems inside the sponsoring company responsible for the short lives of these

The Determinants of Corporate Venture Capital Success 53
programs? Does the corporate form induce excess conservatism in the in- vestments they make? To what extent are corporate venture programs used for the expansion of managerial power inside the sponsoring company? One hopes that the authors will address some of these questions in fu- ture work.
Reference
Lerner, Josh, and Robert P. Merges. 1998. The control of technology alliances: An empirical analysis of the biotechnology industry. Journal of Industrial Economics 46, no. 2 (June): 125-56.

This Page Intentionally Left Blank