
1. Textile - Ijtft - Impact of Lean Manufacturing - Samuel Thavaraj
14
www.tjprc.org [email protected] IMPACT OF LEAN MANUFACTURING PRACTICES ON CLOTHING INDUSTRY PERFORMANCE B. SENTHIL KUMAR 1 & H. SAMUEL THAVARAJ 2 1 Assistant Professor, Department of Rural Industries and Management & Textile Engineering, Gandhigram Rural Institute-Deemed University, Dindigul, Tamil Nadu, India 2 Assistant Professor, Department of Rural I ndustries and Management, Gandhigram Rural Institute-Deemed University, Dindigul, Tamil Nadu, India ABSTRACT Most of the Indian clothing Industry follows mass production system are so called Progressive Bundling System (PBS).This typical system creates high amount of non-value added activity, longer production lead time due to higher Work in progress(WIP).Which in turn affects smooth pr oduction flow.In this research the r esearcher approached to address the cited problems with various lean manufacturing tools such as VSM, cellular layout, Single piece flow, and kaizenat ABC clothing Ltd, India. The current state VSM map was developed by mapping all the information and product flow at ABC towards the selected product line. This includes machine cycle time, inventory, setup time, and in formation flow such as how customers place the order. The current state of Value stream mapping (VSM) for mentioned the product was studied and the target areas of improvement were identified to eliminate the process wastages revealed by current state map at ABC. The future state VSM is designed by incorporating cellular layout, Single piece flow, Kaizen. KEYWORDS: Lean Manufacturing; Garment Industries; Value Stream Mapping (VSM), Cellular Layout, Kaizen, Work in Progress, Cycle Time INTRODUCTION Globalization has been the primary driver of change in supply chain structures of the global textile and apparel industries. Due to the increasing labour wage in developed countries, apparel manufacturing has been migrating from high wage developed countries to low wage developing countries (Bheda et al 2002). Due to the specific market nature of the garment industries such as short pr oduction lifecycle, high volatility, low predictability, high level of impulse purchase and the quick market response, garment industries are facing further challenges these days(LucyDalyandTowers2004). The main objective of lean is to create the most value for the customer while consuming the least amount of resources to design, build and sustain the product (B, Senthil Kumar and H. Samuel Thavaraj 2014). Lean manufacturing emphasise the importance of identifying the root because when a quality problem appears, so that the source of the problem must be addressed (Bergman et al 2001). Even today, industries are getting the same or more volumes (orders), but the n umber of styles they have to handle has increased drastically. Earlier, industries were getting bulk order so there was no need to worry, if the production line was set for the first time it would run for a month. Now a day, the fashion industry is highly volatile and if the orders are not fulfilled on time, the fear for losing business is real. Due to small order quantities and complex designs, the garment industry has to produce multiple styles even within a day; this needs higher flexibility in volume and style change over International Journal of Textile and Fashion Technology (IJTFT) ISSN(P): 2250-2378; ISSN(E): 2319-4510 Vol. 5, Issue 2, Apr 2015, 1-14 © TJPRC Pvt. Ltd.
-
Upload
tjprc-publications -
Category
Documents
-
view
216 -
download
0
Transcript of 1. Textile - Ijtft - Impact of Lean Manufacturing - Samuel Thavaraj

8/9/2019 1. Textile - Ijtft - Impact of Lean Manufacturing - Samuel Thavaraj
http://slidepdf.com/reader/full/1-textile-ijtft-impact-of-lean-manufacturing-samuel-thavaraj 1/14
www.tjprc.org [email protected]
IMPACT OF LEAN MANUFACTURING PRACTICES ON CLOTHING
INDUSTRY PERFORMANCE
B. SENTHIL KUMAR1 & H. SAMUEL THAVARAJ2
1Assistant Professor, Department of Rural Industries and Management & Textile Engineering,
Gandhigram Rural Institute-Deemed University, Dindigul, Tamil Nadu, India
2Assistant Professor, Department of Rural Industries and Management,
Gandhigram Rural Institute-Deemed University, Dindigul, Tamil Nadu, India
ABSTRACT
Most of the Indian clothing Industry follows mass production system are so called Progressive Bundling System(PBS).This typical system creates high amount of non-value added activity, longer production lead time due to higher
Work in progress(WIP).Which in turn affects smooth production flow.In this research the researcher approached to address
the cited problems with various lean manufacturing tools such as VSM, cellular layout, Single piece flow, and kaizenat
ABC clothing Ltd, India. The current state VSM map was developed by mapping all the information and product flow at
ABC towards the selected product line. This includes machine cycle time, inventory, setup time, and information flow such
as how customers place the order. The current state of Value stream mapping (VSM) for mentioned the product was
studied and the target areas of improvement were identified to eliminate the process wastages revealed by current state map
at ABC. The future state VSM is designed by incorporating cellular layout, Single piece flow, Kaizen.
KEYWORDS: Lean Manufacturing; Garment Industries; Value Stream Mapping (VSM), Cellular Layout, Kaizen, Work
in Progress, Cycle Time
INTRODUCTION
Globalization has been the primary driver of change in supply chain structures of the global textile and apparel
industries. Due to the increasing labour wage in developed countries, apparel manufacturing has been migrating from high
wage developed countries to low wage developing countries (Bheda et al 2002). Due to the specific market nature of the
garment industries such as short production lifecycle, high volatility, low predictability, high level of impulse purchase and
the quick market response, garment industries are facing further challenges these days(LucyDalyandTowers2004).The main objective of lean is to create the most value for the customer while consuming the least amount of resources to
design, build and sustain the product (B, Senthil Kumar and H. Samuel Thavaraj 2014). Lean manufacturing emphasise the
importance of identifying the root because when a quality problem appears, so that the source of the problem must be
addressed (Bergman et al 2001).
Even today, industries are getting the same or more volumes (orders), but the number of styles they have to handle
has increased drastically. Earlier, industries were getting bulk order so there was no need to worry, if the production line
was set for the first time it would run for a month. Now a day, the fashion industry is highly volatile and if the orders are
not fulfilled on time, the fear for losing business is real. Due to small order quantities and complex designs, the garment
industry has to produce multiple styles even within a day; this needs higher flexibility in volume and style change over
International Journal of Textile and Fashion
Technology (IJTFT)
ISSN(P): 2250-2378; ISSN(E): 2319-4510
Vol. 5, Issue 2, Apr 2015, 1-14
© TJPRC Pvt. Ltd.

8/9/2019 1. Textile - Ijtft - Impact of Lean Manufacturing - Samuel Thavaraj
http://slidepdf.com/reader/full/1-textile-ijtft-impact-of-lean-manufacturing-samuel-thavaraj 2/14
2 B. Senthil Kumar & H. Samuel Thavaraj
Impact Factor (JCC): 2.9594 Index Copernicus Value (ICV): 3.0
(Singh and sharma 2009).The best way to cope with all these challenges is the implementation of lean manufacturing.
This will serve the purpose of flexibility and save a lot of money by reducing production lead time, reducing the inventory,
increasing productivity, training operators for multiple works, and by reducing rework (Drew et al,2004).
High WIP in traditional type of batch production is another major issues faced by industries. Due to high WIP, the
throughput time as well as re work level is very high. In some cases, even though the operator has completed these wing
operations, the garment cannot be packed because of high WIP. Also, the defective parts are hidden inside the batches and
it is very difficult to clear them while completing the final order quantity. In progressive Bundling system, the flexibility
towards the style change over cannot be achieved easily; which is the current demand of garment industry to produce the
small orders.
LEAN TOOLS
According to Womack and Jones (2003) lean is the most powerful tools available for creating value while
eliminating waste in any organization. Waste takes many forms and can be found at any time and in any place. It may be
found hidden in policies, procedures, process and product designs, and in operations. Waste consumes resources but does
not add any value to the product (Singh et al, 2009). According to Drew et al (2004) lean is an alternative to mass
production (that is the Henry Ford way), not a complement to it. Lean calls for a completely different way of operating,
and for a completely different way of thinking about operations. Lean is not compatible with large-batch production;
instead the pace, mix and quality of production are set by the customer. Lean is an integrated set of principles, practices,
tools and techniques designed to address the root causes of operational underperformance( Drew et al 2004).
Value Stream Mapping(VSM)
Value Stream Mapping (VSM) is a technique that was originally developed by Toyota and then popularized
(Rother and Shook 1999).A value stream is a collectionof all actions,value added as well as non-value added that are
required to bring a product or a group of products that use the samere sources through the main flows, from raw material to
the arms of customers(RotherandShook1999).As per Mehmet et al (2008), value stream mapping is a visual way of
representing the flow of information and materials in the production of products. Lasa et al (2008) carried out VSM
application in a company which manufactures plastic parts that make up mobile phone bodies, button units and keypads.
Production lead time was reduced from 26 days to 20 days and value added lead time was reduced from 0.7 days to 0.5
days. Also they reported an achievement in cost savings and a reduction of raw material, semi-finished and finished goods
inventory. Silva (2012), identified the applicability of VSM for the apparel industry in Sri Lanka. The findings revealedthat VSM can be applied to mass production apparel industries in order to derive positive results such as reducing wastes in
inventory and defects. Further, VSM helped the managers of the case company to visualize the different types of wastes
generated in the organization and future possibilities of eliminating or reducing them. Senthil Kumar and Sampath (2012)
focused investigation of VSM in existing product line and to alter the same with new cellular based layout which reduces
the product lead time significantly. Value stream mapping is a pencil and paper tool, which is created using a predefined
set of icons (shown in Figure 1 below). There are a lot of benefits to drawing value stream maps by hand with paper and
pencil. Manual mapping lets us see what is actually happening in a shop floor value stream, rather than being restrained to
a computer. Also, the process of quickly drawing and redrawing a map acts as a plan-do-check-act cycle that deepens our
understanding of the overall flow of value or lack thereof.

8/9/2019 1. Textile - Ijtft - Impact of Lean Manufacturing - Samuel Thavaraj
http://slidepdf.com/reader/full/1-textile-ijtft-impact-of-lean-manufacturing-samuel-thavaraj 3/14
Impact of Lean Manufacturing Practices on Clothing Industry Performance 3
www.tjprc.org [email protected]
Figure 1: Icon used for value stream mapping (Source: Rother and Shook 1999)
As stated by Rotheretal(1999), The first step in value stream mapping is to choose a product family as the target
for improvement. Customers care only about their products and not about all products so that it is unrealistic to map
everything that passes through the shop floor. Drawing all of the product flow in one company would be too complex.
Identifying a product family can be done either by using the product and process matrix to classify similar process steps for
different products or by choosing products that use the highest volume. After choosing a product family the next step is to
draw a current state map to take a snapshot of how things are being done now. Drawing material flow on the current state
map should always start with the process that is most linked to the customers, which in most cases is the shipping
department, and then working one’s way up to the upstream processes. The material flow is drawn at the lower portion of
the map. At each process all the critical information including lead-time, cycle time, change over time, inventory levels,
etc. aredocumented.The inventory levels on the map should correspond to levels at the time of the actual mapping and not
theaveragebecauseitisimportanttouseactual figuresratherthanhistoricalaveragesprovided by the company.
The next stage in value stream mapping is to create the future state map. The purpose of value stream mapping is
to highlight the sources of waste and help make target areas for improvement visible. The future state map is nothing more
than an implementation plan that highlights what kind of lean tools are needed to eliminate the waste and where they are
needed in the product value stream. Creating a future state map is done through answering a set of questions with regards
to issues related to building of the future state map, and technical implementation related to the use of lean tools. Based on
theanswers to these questions, one should mark the future state ideas directly on thefuture statemap. After creating the
future state mapthelaststepistocarryitoutbytryingto implementthedifferent ideasgeneratedbythe future state map on the
actual value stream
Cellular Layout
Cellular layout divides the manufacturing facilities into small groups called cells which will be exclusively

8/9/2019 1. Textile - Ijtft - Impact of Lean Manufacturing - Samuel Thavaraj
http://slidepdf.com/reader/full/1-textile-ijtft-impact-of-lean-manufacturing-samuel-thavaraj 4/14
4 B. Senthil Kumar & H. Samuel Thavaraj
Impact Factor (JCC): 2.9594 Index Copernicus Value (ICV): 3.0
utilized for specific task (Nicoletti et al 1998). A cell contains of equipment and work stations that are arranged to maintain
the smooth flow of product without much of waiting time (Farwaz and Abdulmalek 2007). Apart from these tangible
benefits, there is the very important advantage of cellular manufacturing over the linear flow model. Due to the closed loop
arrangement of machines, the operators inside the cell are familiar with each other’s operations and they understand eachother better. This improves the relation between the operators and helps to improve productivity (Boughton and Arokiam
2000).Da Silveira et al (2001) carried out a study on implementing cellular manufacture in a mechanical industry through a
team based approach in Brazil, with the following results such as reduction in scrap by 40%, reduction in rework level
by83% .Percentage of improvement in product diversity by 233%.Reduction in work in progress by 92 %.Reduction in
floor space by 44%. Van der Zee (2009) cites a 44% increase in productivity and 46% reduction in order lead-time.
The time workers spent on value added activities went from 74% to 92%, and required floor space was reduced by 44%.
An overriding principle of cellular manufacturing is to arrange production work stations and equipment in a
sequence that creates a smooth flow of material (Witt 2006). The possibility of achieving one piece flow is another benefit
of adopting cellular manufacturing (Jing-Wen and Barnes 2000). Put simply one piece flow is the process of ‘make one,
check one, and move one on’ (Black 2007). It has at its heart the principle of manufacturing only to the demand of the
customer
WORK IN PROGRESS (WIP)
In manufacturing inventory in the form of work in process (WIP) is especially a wasteful item and it should
therefore be reduced (Hayes 1981). The following figure 2, indicates the relationship between the production rate and WIP.
Figure 2: Relationship between Production Rate and WIP (Segertedt 1999)
Figure 2 shows maximum production rate reached when WIP buffers are increased to a level where they absorb
all the variation in the operations process. This means that an operator need not wait for the products from the proceeding
operation or wait for the subsequent operation to be ready (Segertedt 1999). High levels of buffers eliminate the waste of
time for the operators waiting for work and maximize the production rate. However throughput time for the products
increases when the WIP increases, which is a waste .This implies that deciding the amount of WIP is matter of balancing
two different kind of waste. Segerstedt’s conclusion is that the WIP should be enough to reach the maximum production
rate, but not bigger.Lean manufacturing emphasise the importance of reducing inventory, since it is considered to hide
productivity problems caused by unwanted variation and complicated set up procedure shown in Figure 3

8/9/2019 1. Textile - Ijtft - Impact of Lean Manufacturing - Samuel Thavaraj
http://slidepdf.com/reader/full/1-textile-ijtft-impact-of-lean-manufacturing-samuel-thavaraj 5/14
Impact of Lean Manufacturing Practices on Clothing Industry Performance 5
www.tjprc.org [email protected]
Figure 3: Problem Hidden due to Inventory (Slack et al 2001)
METHODOLOGY
This proposed research is conducted at ABC Clothing Ltd.ABC is an apparel manufacturing company situated in
Chennai, India.This company is producing more than 80 % of knitted garments and less than 20% of woven garment
products .This is a 100% export oriented factory getting regular business orders from UK, USA, and Germany. Around1500 employees are working in this firm towards the production related activities. Due to competitive market, this firm
intends to implement the lean manufacturing principles in to their production environment.Whose major products are
knitted fabric based garments. To address the current issues of the industry, the researcher recorded the standard operation
time for each operation by using time study techniques. Subsequently the researcher analysed the cycle time, value added
time, product defect level, Work in Progress (WIP), takt time, number of operations, machine types, rate of production, etc.
Product Selection
The researcher has thoroughly studied various kind of products produced at ABC. Some of the basic product lines
are regularly manufactured at this factory.In this research work, the researcher selected sewing section as a research areawhere in the product line was producing men’s inner wear(single jersey knitted fabric)
METHODS
VSM is the important Lean tool was used for the elimination of the product wastes while manufacturing
enterprise. Moreover with the support of VSM, one can identify the other suitable lean tools for implementation. To create
a current state Value Stream Map (VSM) for the product, the product manufacturing line is analysed thoroughly and
collected the required information. A map of the plant layout is obtained to further understand the flow of materials within
the plant. The information such as machine set up times, machine utilization, and inventory counts between the processes,
takt time (customer requirement) are collected for developing the value stream map. The takt time of the product is
calculated by dividing the demand of the customer per day in each style by the number of operating hours per day.
8/9/2019 1. Textile - Ijtft - Impact of Lean Manufacturing - Samuel Thavaraj
http://slidepdf.com/reader/full/1-textile-ijtft-impact-of-lean-manufacturing-samuel-thavaraj 6/14
6 B. Senthil Kumar & H. Samuel Thavaraj
Impact Factor (JCC): 2.9594 Index Copernicus Value (ICV): 3.0
At ABC, Business planning department receives information through Electronic Data Interchange (EDI) from the
customer. In ABC, mostly repeated styles (garment design) of garments are manufactured. The order schedule is received
on once in three months through EDI, the delivery duration and mode of delivery are as per the buyer requirement. Most of
the customers of ABC expect higher product quality and on time shipment delivery. Once the purchase order comes in,business planning department estimates the date by which the factory can make it ready. The planning department
schedules it on weekly basis. Next, arrive at the day wise plan on the production level. Then this schedule is sent to the
factory for further execution. Business planning also includes making sure that enough raw material is available and that
there is with enough capacity on each unit. This schedule should be feasible and balanced. This schedule on the operating
side become the basis to monitor day by day and week by week increments against how well they are in accordance with
the schedule. This schedule can then be updated further on hourly basis or machine wise schedule, which is used to push
the order to the production facility.All data for the current state map are collected according to the approach recommended
by Rother and Shook (1999) .The important data such as inventory levels before each process, cycle times, number of
workers and the changeover times are shown in current VSM. Initially for developing current state VSM, the cycle time is
calculated. So that the researcher can find the muda (process waste) in the existing practice. Subsequently the researcher
can find the scope for implementation of lean tools in the current value stream mapping.
For this product family, the demand of the customer is15, 000 pieces in various colour and size combination.
Shipment schedule is 10 days from the order approval stage. Production demand for product =15000/10 days=1500
pcs/Shift. Daily work time is 28800 sec.
AvailableWorkingTimeperShiftTAKTTime
CustomerDemandperShift=
=28800 sec/1500 pcs per day
=
= 24 sec/pcs
In every 24 seconds one piece of Inner wear garment has to be produced. The production rate more than this talk
time would create delay in production delivery at the same time the production rate less than 24 seconds per piece would
become waste in the form of over production. According to this parameter, current VSM would be evaluated and the same
line new VSM would be created with the base of this takt time.
Current State Value Stream Mapping (VSM) for the Product Line
The focus of this value stream mapping is towards inner wear production. This product would be 100 % cotton
single jersey knitted fabric based inner wear. This garment has single solid colour as well as striped fabric throughout its
silhouette. Fabric inspection and fabric cutting process are common which would be done in a common usage area
irrespective of the product family. The sewing process starts with “panel matching”, “attachment of label” at the centre
back position. After that “gusset attachment” is done. Subsequently “binding attachment” is done on both the side of leg
portions. Then “left side seam attachment”, “binding attachment at the waist”, “close right side seam” are done. After this
stage, “secure the leg and waist”, “trimming”, “main label preparation”, “main label attachment”, and “end line inspection”
are done. The following Figure 4 indicates current VSM for product-4

8/9/2019 1. Textile - Ijtft - Impact of Lean Manufacturing - Samuel Thavaraj
http://slidepdf.com/reader/full/1-textile-ijtft-impact-of-lean-manufacturing-samuel-thavaraj 7/14
Impact of Lean Manufacturing Practices on Clothing Industry Performance 7
www.tjprc.org [email protected]
Figure 4: Current State VSM for Men’s Inner Wear Product
Future State Value Stream Mapping (VSM) for the Product Line
Describing and defining the future state map actually starts while developing the current state map, where target
areas for improvement start to show up. Looking at the current state map ofABC (towards selected product line)
severalthingsstandout: (a) large inventories, (b) thehugedifferencebetweenthe productionlead-timeandthevalueadded time
(c) the process that happens onitsownschedule (d) very low process ratio. The goal of lean manufacturing is to aid in
improving the satisfaction of customer requirements through the whole value stream.
In ourcurrentstatemaptoviewinventoryandlead-timeastwoequivalentthingsandtryto identify lean manufacturing tools to
drive them down and create the ideal state map. The basic philosophy is that more the inventory longer the lead time,
therefore the reduction of lead-time and inventory will expose and force other kinds of wastes to surface, creating the
opportunity for their removal.
Creating Cellular Layout
The cellular layout is suggested in this research for achieving single piece flow between the operations, cost
effectiveness, operator skill enhancement as well as to minimize the production lead time. In this layout, there is no need

8/9/2019 1. Textile - Ijtft - Impact of Lean Manufacturing - Samuel Thavaraj
http://slidepdf.com/reader/full/1-textile-ijtft-impact-of-lean-manufacturing-samuel-thavaraj 8/14
8 B. Senthil Kumar & H. Samuel Thavaraj
Impact Factor (JCC): 2.9594 Index Copernicus Value (ICV): 3.0
for ordering or installing any new equipment, it is just re-arranging the available machines inside the shop floor.After lot of
investigation and pilot study, the researcher found that some of the operations in the existing VSM do not produce any
value to the product transformation. So systematically some of the operations are removed from the existing VSM and few
of the other operations are combined together to minimize the SMV and operator involvement. The quality checking pointsare removed from the preparatory, because the operator who is producing garments should be aware of quality standards
and expected to work accordingly. Only one cellular layout is created for this assembly line. In this module few of the
operations are combined with each other. Finally new series of operations are formed for this layout. Here the operations
“loading”, “panel matching” and “trimming” are removed completely from the existing VSM. Then the operations such as
“preparation of size label” and “attachment of size label” are combined, then “attachment of gusset” and “over locking on
the gusset” are combined, “close the right side seam” and “trimming of extra threads” are combined, “main label
attachment” and “trimming of extra thread” are combined. There are 7 sewing machines and 6 operators are allotted in this
module. As usual the number of machineries is higher than the number of operators. The recommended new layout is
shown in Figure 5.
Figure 5 Revised VSM for Men’s Inner Wear Product
5s Tool Implementation
5s principle was also introduced in sewing section for manufacturing product selected for this research work.
The first step of 5s principle is to sort out the clutter from tables, workstations and equipment .The procedure to remove
items are based on the utility of the equipment .The research team used the red tag tactic (Figure 6 Shows the model of red
tag), to separate these items from the regular production area. This consists of removing the rarely used items from the
work station by identifying them as items to remove from the workplace and keep those item at the red tag area for
temporary purpose.

8/9/2019 1. Textile - Ijtft - Impact of Lean Manufacturing - Samuel Thavaraj
http://slidepdf.com/reader/full/1-textile-ijtft-impact-of-lean-manufacturing-samuel-thavaraj 9/14
Impact of Lean Manufacturing Practices on Clothing Industry Performance 9
www.tjprc.org [email protected]
Figure 6: Red Tag Model
Table 1: Red Tag Classifications
Materials
Stored in Red
Tag
Usage
FrequencyWhere to Place
Daily Work station
Once in week Work area
✓
Once in month Storage Area
✓
Once in Year Ware house
✓
Obsolete Sell/eliminate
The 5s program is implemented in the following five steps called Sort, Set in order, Shine, Standardize, and
Sustain. The researcher sorting items based on the usage frequency and keep only what is needed to perform value-added-
activities and dispose of what is not needed. The classification where items that are daily are kept in the workstation and
others are kept at the red tag area. Afterwards these red tag items are stored according to its usage, for example the items
that are used once a week is stored in the work area, once a month in a storage place, once a year in thewarehouse and
obsolete items are thrown away or sold.
Kaizen Implementation
Kaizen is defined as continuous development towards improving the production efficiency. The principle behind
this is that “a very large number of small improvements are more effective in an organizational environment than a few
improvements of large value”. Mostly the Kaizen is done with the support of shop floor team. In the sewing section the
researcher insisted kaizen in the form of work aid identification, method modification, and operator skill improvement for
improvement of productivity. Since there would be enough effort done on method modification while creating the future
stage VSM (like removing many non-value added activates, combining few operations), the researcher has given more
importance to the work aid identification. Work aid is the one which minimize the efforts involved in product making.
8/9/2019 1. Textile - Ijtft - Impact of Lean Manufacturing - Samuel Thavaraj
http://slidepdf.com/reader/full/1-textile-ijtft-impact-of-lean-manufacturing-samuel-thavaraj 10/14
10 B. Senthil Kumar & H. Samuel Thavaraj
Impact Factor (JCC): 2.9594 Index Copernicus Value (ICV): 3.0
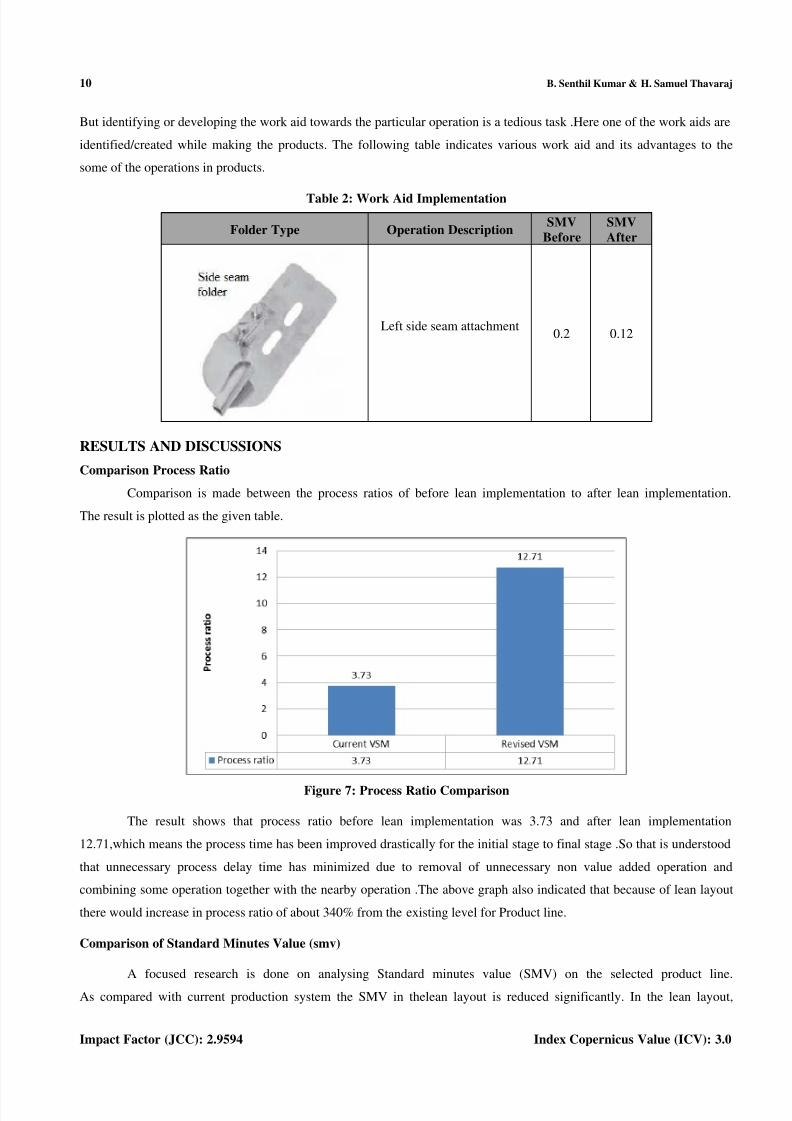
But identifying or developing the work aid towards the particular operation is a tedious task .Here one of the work aids are
identified/created while making the products. The following table indicates various work aid and its advantages to the
some of the operations in products.
Table 2: Work Aid Implementation
Folder Type Operation DescriptionSMV
Before
SMV
After
Left side seam attachment0.2 0.12
RESULTS AND DISCUSSIONS
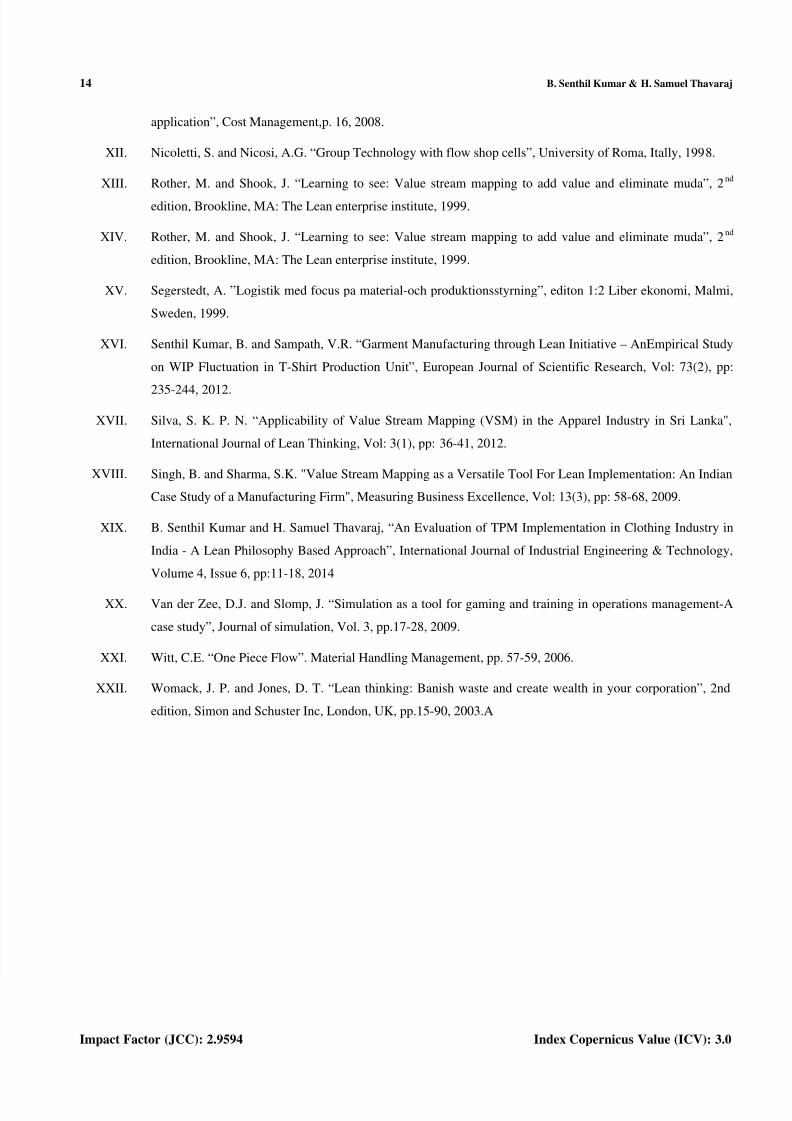
Comparison Process Ratio
Comparison is made between the process ratios of before lean implementation to after lean implementation.
The result is plotted as the given table.
Figure 7: Process Ratio Comparison
The result shows that process ratio before lean implementation was 3.73 and after lean implementation
12.71,which means the process time has been improved drastically for the initial stage to final stage .So that is understood
that unnecessary process delay time has minimized due to removal of unnecessary non value added operation and
combining some operation together with the nearby operation .The above graph also indicated that because of lean layout
there would increase in process ratio of about 340% from the existing level for Product line.
Comparison of Standard Minutes Value (smv)
A focused research is done on analysing Standard minutes value (SMV) on the selected product line.
As compared with current production system the SMV in thelean layout is reduced significantly. In the lean layout,

8/9/2019 1. Textile - Ijtft - Impact of Lean Manufacturing - Samuel Thavaraj
http://slidepdf.com/reader/full/1-textile-ijtft-impact-of-lean-manufacturing-samuel-thavaraj 11/14
Impact of Lean Manufacturing Practices on Clothing Industry Performance 11
www.tjprc.org [email protected]
the reduced SMV has been achieved by merging some of the operation (as number of operations reduce the individual
sewing allowance for each operation will also be reduced) with other and removing few of the non-value added activities
from the current VSM.
In the selected Product line(knitted under wear),operations like “loading”, “panel matching” and “trimming” are
removed completely from the existing VSM.“preparation of size label” and “attachment of size label “ are merged,
“attachment of gusset” and “over locking on the gusset” are merged,“close the right side seam” and “trimming of extra
threads” are merged, and “main label attachment” and “trimming of extra thread on the main label” are merged.
The following graph (Figure 8) indicates the level of reduction in SMV between existing PBS layout to lean
layout.
Figure 8: Comparison of SMV between Existing Layouts to Lean Layout
The above graph shows that because of lean layout there would be a reduction in SMV about 36.25% from the
existing level for Product line. Due to continuous improvement (Kaizen) in the process we can still minimize the product
cycle time.
Comparison of WIP Level
A focused research is done on analysing changes in WIP level between current VSM to revised VSM for all theproduct line. The researcher has collected average WIP data for 7 working days during the production. As compared with
current production system the WIP level in revised module is reduced significantly. In revised system, this has been
achieved by combining the work stations, implementing single piece flow principle,implementing cellular layout and
introduction of multi skilled operators instead of regular operator,removal of few of the non-value added activities in the
revised value stream mapping etc. The following graph (Figure 9) indicates the comparison of WIP level between current
VSM to revised VSM for all the product line.

8/9/2019 1. Textile - Ijtft - Impact of Lean Manufacturing - Samuel Thavaraj
http://slidepdf.com/reader/full/1-textile-ijtft-impact-of-lean-manufacturing-samuel-thavaraj 12/14
12 B. Senthil Kumar & H. Samuel Thavaraj
Impact Factor (JCC): 2.9594 Index Copernicus Value (ICV): 3.0
Figure 9: Comparison of Avg. WIP Level between Current VSM to Revised VSM
This data shows that there would be higher level of reduction in WIP from current VSM.This would support the
manufacturer to minimize the production cost particularly for short run orders.
COMPARISON OF NUMBER OF OPERATIONS
The number of operations required to complete a garment is reduced in all the garment products from the current
VSM to revised VSM.Those operations which do not add any value to the garment are eliminated and some of the
operationsare combined together in such a way so as to minimize the SMV level. The following graph (Figure 10) shows
the number of operationsin existing layout and revised layout.
Figure 10: Comparison of Number of Operation between Existing Layouts to Lean Layout
From the above graphs it is understood that there would be a significant level of reduction in number of operations
from 16 to 8 between the current VSM to revised VSM. This reduced number of operations in revised VSM supports the
manufacturer to minimize the operator allocation and space reduction from the current VSM.
CONCLUSIONS
• The main goal of this research is to develop a general methodology to implement lean manufacturing tools and
techniques in garment industry. It is understood that the goal of lean manufacturing is to become highly

8/9/2019 1. Textile - Ijtft - Impact of Lean Manufacturing - Samuel Thavaraj
http://slidepdf.com/reader/full/1-textile-ijtft-impact-of-lean-manufacturing-samuel-thavaraj 13/14
Impact of Lean Manufacturing Practices on Clothing Industry Performance 13
www.tjprc.org [email protected]
responsive to customer demand while producing quality products in the most efficient and economical manner by
reducing various waste in human effort, inventory, time to market and manufacturing space.
• Restructuring is done on sewing room specifically by VSM analysis. Value stream mapping is an ideal tool used
for understanding the process waste in a value stream and used to identify other suitable lean tool for process
improvement. The development of future state map is not the end of asset of value stream activities. It should be
stressed that the value stream should be revisited until the future becomes the present.
• The problem of low flexibility is eliminated by cellular layout, kaizen and 5s tools. Since this layout produce very
low WIP inside the process, the product line can be changed immediately if needed. This helps to make different
kinds of products in the same production line depending upon requirements.
REFERENCES
I.
Bergman, B. and Klefsjo, B. “Kvalitet fran behov till anvandning”, Third edition, Studentlitteratur, Lund,Sewden, 2001.
II. Bheda, R., Narag, A. S. and Singla, M.L. “Apparel Manufacturing a Strategy for Productivity Improvement”,
Journal of Fashion Marketing and Management, Vol.7. No1, pp.12-22, 2002.
III.
Boughton, N.J. and Arokiam, I.C. “The application of cellular manufacturing: a regional small to-medium
enterprise perspective”, Proceedings of Institutional of Mechanical Engineers, Vol. 214, No. 8, pp. 751-754,
2000.
IV. Da Silveira, G. Borenstein, D. and Fogliatto, F.S. “Mass customization: literature review and research
directions”. International Journal of Production Economics, Vol. 72, pp. 1-13, 2001.
V.
Drew, J., McCallum, B. and Rogenhofer, S. “Journey to lean –making Operational change stick”, Hampshire:
Pallgravemacmillan, 2004.
VI. Farwaz A. Abdulmalek and Jayant Rajgopal, “Analysing the benefits of Lean Manufacturing and value
stream mapping via simulation: A process sector case study”, International Journal Production Economics,
pp.223-236, 2007.
VII.
Hayes R.H. “Why Japenese factories work”, Harward Business Review, pp.55-66, 1981.
VIII.
Jing-Wen, L.I. and Barnes, J. “Investigating the Factors Influencing the Shop Performance in a Job Shop
Environment with Kanban-Based Production Control”. International Journal of Production Research. Vol. 38.
No 18, pp. 4683-4699, 2000.
IX.
Lasa, I.S., Laburu, C.O. and Vila, R.C. "An Evaluation of the Value Stream Mapping Tool", Business
Process Management Journal, Vol: 14(1), pp: 39-52, 2008.
X. LucyDaly, M.B. and Towers, N. “LeanorAgile: A Solution for Supply Chain Management in the Textile and
Clothing Industry”. International Journal of Operation s& Production Management Vol.24No.2, pp.151-170,
2004.
XI.
Mehmet, C. Kocakulah, Jason F. Brown, Joshua W. Thromson, “Lean manufacturing principles and their
8/9/2019 1. Textile - Ijtft - Impact of Lean Manufacturing - Samuel Thavaraj
http://slidepdf.com/reader/full/1-textile-ijtft-impact-of-lean-manufacturing-samuel-thavaraj 14/14
14 B. Senthil Kumar & H. Samuel Thavaraj
Impact Factor (JCC): 2.9594 Index Copernicus Value (ICV): 3.0
application”, Cost Management,p. 16, 2008.
XII.
Nicoletti, S. and Nicosi, A.G. “Group Technology with flow shop cells”, University of Roma, Itally, 1998.
XIII. Rother, M. and Shook, J. “Learning to see: Value stream mapping to add value and eliminate muda”, 2nd
edition, Brookline, MA: The Lean enterprise institute, 1999.
XIV.
Rother, M. and Shook, J. “Learning to see: Value stream mapping to add value and eliminate muda”, 2nd
edition, Brookline, MA: The Lean enterprise institute, 1999.
XV. Segerstedt, A. ”Logistik med focus pa material-och produktionsstyrning”, editon 1:2 Liber ekonomi, Malmi,
Sweden, 1999.
XVI.
Senthil Kumar, B. and Sampath, V.R. “Garment Manufacturing through Lean Initiative – AnEmpirical Study
on WIP Fluctuation in T-Shirt Production Unit”, European Journal of Scientific Research, Vol: 73(2), pp:
235-244, 2012.
XVII. Silva, S. K. P. N. “Applicability of Value Stream Mapping (VSM) in the Apparel Industry in Sri Lanka",
International Journal of Lean Thinking, Vol: 3(1), pp: 36-41, 2012.
XVIII.
Singh, B. and Sharma, S.K. "Value Stream Mapping as a Versatile Tool For Lean Implementation: An Indian
Case Study of a Manufacturing Firm", Measuring Business Excellence, Vol: 13(3), pp: 58-68, 2009.
XIX. B. Senthil Kumar and H. Samuel Thavaraj, “An Evaluation of TPM Implementation in Clothing Industry in
India - A Lean Philosophy Based Approach”, International Journal of Industrial Engineering & Technology,
Volume 4, Issue 6, pp:11-18, 2014
XX.
Van der Zee, D.J. and Slomp, J. “Simulation as a tool for gaming and training in operations management-A
case study”, Journal of simulation, Vol. 3, pp.17-28, 2009.
XXI. Witt, C.E. “One Piece Flow”. Material Handling Management, pp. 57-59, 2006.
XXII.
Womack, J. P. and Jones, D. T. “Lean thinking: Banish waste and create wealth in your corporation”, 2nd
edition, Simon and Schuster Inc, London, UK, pp.15-90, 2003.A


![Textile Technology [Read-Only]textile.yazd.ac.ir/ms.ahmadi/Downloads/Textile Technology/Textile... · Textile Technology (Pictures) Edited by: M. S. Ahmadi Textile Technology 1 Yazd](https://static.fdocuments.in/doc/165x107/5e786641131316263558e076/textile-technology-read-only-technologytextile-textile-technology-pictures.jpg)