1. TES on EOS-Aura Satellite Denis Tremblay Raytheon Information Solutions Susan Sund Kulawik, Simon...
2
1. TES on EOS-Aura Satellite Denis Tremblay Raytheon Information Solutions Susan Sund Kulawik, Simon Hook, Dave Rider Jet Propulsion Laboratory TES Validation Results from the Lake Tahoe Special Observations ABSTRACT: The Tropospheric Emission Spectrometer (TES) is a high-resolution infrared Fourier transform spectrometer on board the AURA spacecraft launched in 2004. As part of the science validation activities, four special "Stare" observations were acquired in August and September 2005 over Lake Tahoe located a the California-Nevada border in western US. Each "Stare" observation took 32 target observation scans each sharing almost the same footprint. The Tahoe site has several advantages for validation, namely it is at high altitude with negligible cloud cover, it has water as the surface with known spectral emissivity, and it has ground-based in-situ radiometric measurements. Statistics of the retrieved values of the target data set over water are compared with the observation error available in the TES product file. In most cases, the results show that the standard deviation of the volume mixing ratio (VMR 1 sigma) at a given pressure level is less that the observation error for H 2 0, atmospheric temperature, and O 3 . VMR-sigma is higher than the observation error in the cases of H 2 O and atmospheric temperature for pressure levels very near the surface. The surface temperature difference of the in-situ radiometric measurements minus the TES retrieved values have a mean of -0.11K and a standard deviation of 0.30K. This exercise has provided important validation of the TES reported errors and the TES on-board radiometric calibration source. http://tes.jpl.nasa.gov A31B-0900 A31B-0900 2. Lake Tahoe In-situ Measurements Table 1. TES Instrument Specifications Scan 0 Scan 31 3. TES “Stare” Mode Special Observations Map Key Latitude Longitude Measurements US Coast (N) (W) Guard 39 10.838 120 07.157 v, WD, Ps, SRu, SRd, AOD, ToV, TSI TB1 39 09.180 120 00.020 Tr, Ts, Ts, Ts, Ts, v, WD, Ps, AT, RH, NR TB2 39 09.290 120 00.020 Tr, Ts, Ts, Ts, Ts, v, WD, Ps, AT, RH, NR TB3 39 08.300 120 04.920 Tr, Ts, Ts, Ts, Ts, v, WD, Ps, AT, RH, NR TB4 39 09.300 120 04.330 Tr, Ts, Ts, Ts, Ts, v, WD, Ps, AT, RH, NR, LR – Longwave Radiation (u-upward looking, d-downward looking), SR – Shortwave Radiation (u-upward looking, d-downward looking), v – Wind Speed, WD – Wind Direction, Ps – Pressure, AT - Air Temperature, RH - Relative Humidity, NR - Net Radiation, AOD - Aerosol Optical Depth, ToV - Total Column Water Vapor, TSI - Total Sky Imager, Tr - Temperature from radiometer, Ts - Skin temperature measured 1cm below skin by thermistor. The far right plot shows the skin temperature on August 20th 2005, date of the TES run 3049 which is one of the 4 special stare observations. The greater variability observed in the afternoon, that is between 19H and 24H GMT, is due to increased wind velocity. This plot was constructed using the on-line tools available on the JPL Lake Tahoe web site. Additional information on others measurements can be found at the following URL: http:// laketahoe.jpl.nasa.gov Figure 2. TES Optical Schematic Figure 1. TES Instrument TES is a spaceborne Connes-type interferometer with 4 ports (2 inputs and 2 outputs). Radiance from the 2 outputs ports are splitted allowing the measurements of the same field-of-view over 4 different optical windows. Each of the 4 focal planes has 16 HgCdTe PV detectors. A single scan will produces 64 interferograms. A 4 seconds scan has an optical path difference (OPD) of 8.4 cm which gives a spectral resolution of 0.06 cm-1. A 16 seconds scan has an OPD of 33.2 cm with a spectral resolution of 0.015 cm-1 (Limb view only). TES pointing control system (PCS) has along and crosstrack viewing capability with angles ranging from -45 to + 45 degrees in each directions. TES has several viewing modes which include nadir (or downlooking), limb (backward looking), off-nadir, and “stare”. A typical nadir observation has a footprint of 5 Km wide by 8 Km long. Off-nadir view footprint will have larger footprint than that of nadir view and will depends on the viewing geometry. Figure 1 shows the TES instrument inside the clean room. The optical schematic shows the radiance path and the optical elements in Figure 2. Table 1 summarizes the TES instrument characteristics. L0 Data (raw packets) L1B Processing (C alibration) Radiometrically calibrated spectra L2 Processing (Atm ospheric R etrieval) Atmospheric profiles,surface tem perature, and others. Figure 3. Lake Tahoe buoys locations. Figure 4. Lake Tahoe Buoy Figure 5. Temperature plot, all 4 buoys, August 20th 2005. Figure 6. Run 3049 (August 20th 2005) TES footprint of all 32 scans. Figure 4. TES Ground Data System data processing flow Run Date GMT Starting Time (HH:MM:SS) 3049 August 20 th 2005 21:17:36 3060 August 22 nd 2005 21:05:14 3104 September 5 th 2005 21:17:40 3110 September 7 th 21:05:28 Table 2. TES “Stare” special observations time with duration of 2 min 20 seconds. Scan 0: Forward Looking Scan 15: Nadir Scan 31: Backward Looking - Lake Tahoe: 1898 m. altitude, 20% less atmosphere than sea level, never freezes. - 4 Buoys equipped with radiometers giving in-situ measurements of surface temperature (TSUR). - Buoy TB4 disregarded due to systematic bias and selected the 5-minutes averaged TSUR. - Other measurements includes wind direction and speed, relative humidity, and more. are” mode runs taken, each comprising of 32 target scans. and cross track viewing angle range from +45 to -45 degrees. of the same run look at the same ‘nominal’ atmosphere share approximately the same footprint (5x8 Km at Nadir). 5 scans of run 3049 disregarded due to possible land overlay. processed with TES Software Version 9.3. etrieval algorithm (ELANOR) uses a non-linear optimal mation method where the forward model is based on the Line-By-Line ative Transfer Model (LBLRTM) from AER corporation.
-
Upload
ambrose-berry -
Category
Documents
-
view
215 -
download
1
Transcript of 1. TES on EOS-Aura Satellite Denis Tremblay Raytheon Information Solutions Susan Sund Kulawik, Simon...

1. TES on EOS-Aura Satellite
Denis Tremblay Raytheon Information Solutions
Susan Sund Kulawik, Simon Hook, Dave Rider Jet Propulsion Laboratory
TES Validation Results from the Lake Tahoe Special Observations
ABSTRACT: The Tropospheric Emission Spectrometer (TES) is a high-resolution infrared Fourier transform spectrometer on board the AURA spacecraft launched in 2004. As part of the science validation activities, four special "Stare" observations were acquired in August and September 2005 over Lake Tahoe located a the California-Nevada border in western US. Each "Stare" observation took 32 target observation scans each sharing almost the same footprint. The Tahoe site has several advantages for validation, namely it is at high altitude with negligible cloud cover, it has water as the surface with known spectral emissivity, and it has ground-based in-situ radiometric measurements. Statistics of the retrieved values of the target data set over water are compared with the observation error available in the TES product file. In most cases, the results show that the standard deviation of the volume mixing ratio (VMR 1 sigma) at a given pressure level is less that the observation error for H 20, atmospheric temperature, and O3. VMR-sigma is higher than the observation error in the cases of H2O and atmospheric temperature for pressure levels very near the surface. The surface temperature difference of the in-situ radiometric measurements minus the TES retrieved values have a mean of -0.11K and a standard deviation of 0.30K. This exercise has provided important validation of the TES reported errors and the TES on-board radiometric calibration source.
http://tes.jpl.nasa.gov
A31B-0900
A31B-0900
2. Lake Tahoe In-situ Measurements
Table 1. TES Instrument Specifications
Scan 0
Scan 31
3. TES “Stare” Mode Special Observations
Map Key Latitude Longitude MeasurementsUS Coast (N) (W)Guard 39 10.838 120 07.157 v, WD, Ps, SRu, SRd, AOD, ToV, TSITB1 39 09.180 120 00.020 Tr, Ts, Ts, Ts, Ts, v, WD, Ps, AT, RH, NRTB2 39 09.290 120 00.020 Tr, Ts, Ts, Ts, Ts, v, WD, Ps, AT, RH, NRTB3 39 08.300 120 04.920 Tr, Ts, Ts, Ts, Ts, v, WD, Ps, AT, RH, NRTB4 39 09.300 120 04.330 Tr, Ts, Ts, Ts, Ts, v, WD, Ps, AT, RH, NR,
LR – Longwave Radiation (u-upward looking, d-downward looking), SR – Shortwave Radiation (u-upward looking, d-downward looking), v – Wind Speed, WD – Wind Direction, Ps – Pressure, AT - Air Temperature, RH - Relative Humidity, NR - Net Radiation, AOD - Aerosol Optical Depth, ToV - Total Column Water Vapor, TSI - Total Sky Imager, Tr - Temperature from radiometer, Ts - Skin temperature measured 1cm below skin by thermistor.
The far right plot shows the skin temperature on August 20th 2005, date of the TES run 3049 which is one of the 4 special stare observations. The greater variability observed in the afternoon, that is between 19H and 24H GMT, is due to increased wind velocity. This plot was constructed using the on-line tools available on the JPL Lake Tahoe web site. Additional information on others measurements can be found at the following URL:
http://laketahoe.jpl.nasa.gov
Figure 2. TES Optical Schematic
Figure 1. TES Instrument TES is a spaceborne Connes-type interferometer with 4 ports (2 inputs and 2 outputs). Radiance from the 2 outputs ports are splitted allowing the measurements of the same field-of-view over 4 different optical windows. Each of the 4 focal planes has 16 HgCdTe PV detectors. A single scan will produces 64 interferograms. A 4 seconds scan has an optical path difference (OPD) of 8.4 cm which gives a spectral resolution of 0.06 cm-1. A 16 seconds scan has an OPD of 33.2 cm with a spectral resolution of 0.015 cm-1 (Limb view only).
TES pointing control system (PCS) has along and crosstrack viewing capability with angles ranging from -45 to + 45 degrees in each directions. TES has several viewing modes which include nadir (or downlooking), limb (backward looking), off-nadir, and “stare”. A typical nadir observation has a footprint of 5 Km wide by 8 Km long. Off-nadir view footprint will have larger footprint than that of nadir view and will depends on the viewing geometry.
Figure 1 shows the TES instrument inside the clean room. The optical schematic shows the radiance path and the optical elements in Figure 2. Table 1 summarizes the TES instrument characteristics.
L0 Data (raw packets)
L1B Processing (Calibration)
Radiometrically calibrated spectra
L2 Processing(Atmospheric
Retrieval)
Atmospheric profiles, surface
temperature, and others.
Figure 3. Lake Tahoe buoys locations.
Figure 4. Lake Tahoe Buoy
Figure 5. Temperature plot, all 4 buoys, August 20th 2005.
Figure 6. Run 3049 (August 20th 2005) TES footprint of all 32 scans.
Figure 4. TES Ground Data System data processing flow
Run Date GMT Starting Time (HH:MM:SS)
3049 August 20th 2005 21:17:36
3060 August 22nd 2005 21:05:14
3104 September 5th 2005 21:17:40
3110 September 7th 2005 21:05:28
Table 2. TES “Stare” special observations time with duration of 2 min 20 seconds.
Scan 0: Forward Looking
Scan 15: Nadir
Scan 31: Backward Looking
- Lake Tahoe: 1898 m. altitude, 20% less atmosphere than sea level, never freezes.- 4 Buoys equipped with radiometers giving in-situ measurements of surface temperature (TSUR).- Buoy TB4 disregarded due to systematic bias and selected the 5-minutes averaged TSUR.- Other measurements includes wind direction and speed, relative humidity, and more.
- 4 “Stare” mode runs taken, each comprising of 32 target scans.- Along and cross track viewing angle range from +45 to -45 degrees.- Scans of the same run look at the same ‘nominal’ atmosphere and share approximately the same footprint (5x8 Km at Nadir).- Last 5 scans of run 3049 disregarded due to possible land overlay.- Data processed with TES Software Version 9.3. - The retrieval algorithm (ELANOR) uses a non-linear optimal estimation method where the forward model is based on the Line-By-Line Radiative Transfer Model (LBLRTM) from AER corporation.
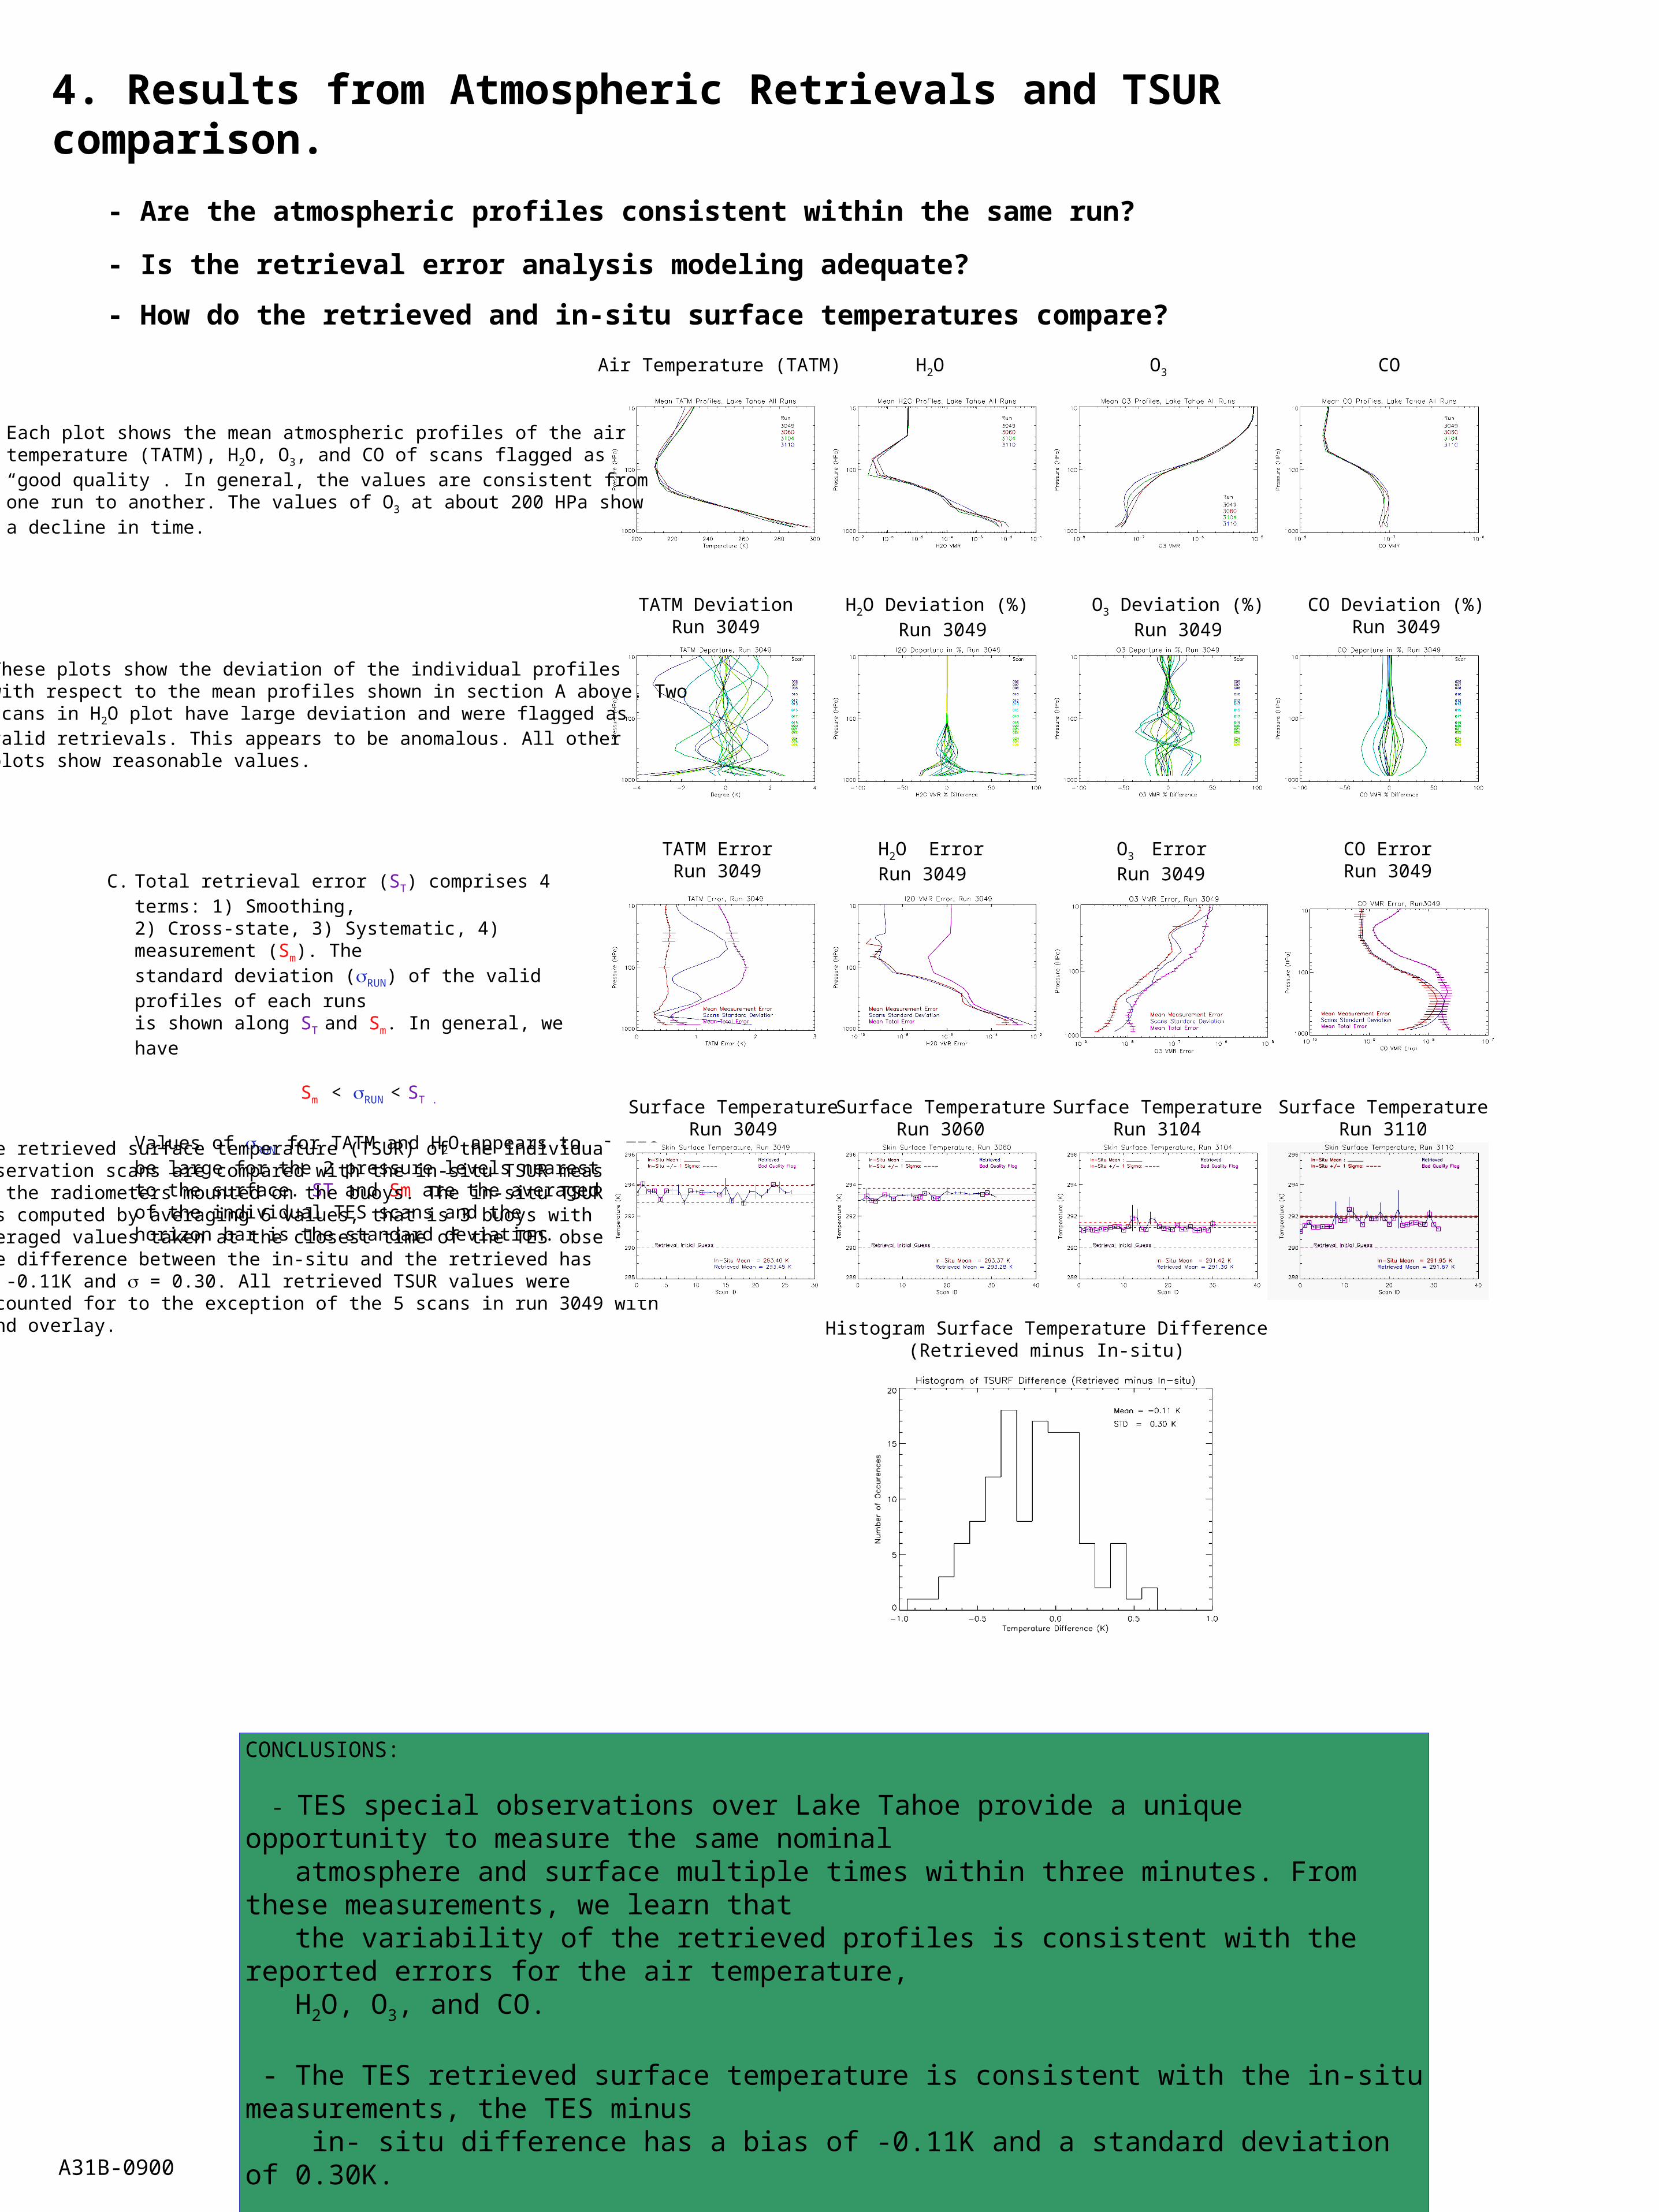
4. Results from Atmospheric Retrievals and TSUR comparison.
- Are the atmospheric profiles consistent within the same run?
- Is the retrieval error analysis modeling adequate?
- How do the retrieved and in-situ surface temperatures compare?
CONCLUSIONS:
- TES special observations over Lake Tahoe provide a unique opportunity to measure the same nominal atmosphere and surface multiple times within three minutes. From these measurements, we learn that the variability of the retrieved profiles is consistent with the reported errors for the air temperature, H2O, O3, and CO. - The TES retrieved surface temperature is consistent with the in-situ measurements, the TES minus in- situ difference has a bias of -0.11K and a standard deviation of 0.30K.
Air Temperature (TATM) H2O O3 CO
TATM DeviationRun 3049
H2O Deviation (%) Run 3049
O3 Deviation (%)Run 3049
CO Deviation (%)Run 3049
TATM ErrorRun 3049
H2O ErrorRun 3049
O3 ErrorRun 3049
CO ErrorRun 3049
Surface TemperatureRun 3049
Surface TemperatureRun 3060
Surface TemperatureRun 3104
Surface TemperatureRun 3110
A. Each plot shows the mean atmospheric profiles of the airtemperature (TATM), H2O, O3, and CO of scans flagged as“good quality”. In general, the values are consistent fromone run to another. The values of O3 at about 200 HPa show a decline in time.
B. These plots show the deviation of the individual profileswith respect to the mean profiles shown in section A above. Two scans in H2O plot have large deviation and were flagged as valid retrievals. This appears to be anomalous. All otherplots show reasonable values.
C. Total retrieval error (ST) comprises 4 terms: 1) Smoothing, 2) Cross-state, 3) Systematic, 4) measurement (Sm). The standard deviation (RUN) of the valid profiles of each runs is shown along ST and Sm. In general, we have
Sm < RUN < ST .
Values of RUN for TATM and H2O appears to be large for the 2 pressure levels nearest to the surface. ST and Sm are the averaged of the individual TES scans and the horizon bar is the standard deviation.
D. The retrieved surface temperature (TSUR) of the individual TES observation scans are compared with the in-situ TSUR measured by the radiometers mounted on the buoys. The in-situ TSUR meanwas computed by averaging 6 values, that is 3 buoys with the 2 averaged values taken at the closest time of the TES observations. The difference between the in-situ and the retrieved has a bias of -0.11K and = 0.30. All retrieved TSUR values were accounted for to the exception of the 5 scans in run 3049 with land overlay. Histogram Surface Temperature Difference
(Retrieved minus In-situ)
A31B-0900