
1 Tax Planning, Corporate Governance and Equity Value Nor ...
43
1 Tax Planning, Corporate Governance and Equity Value Nor Shaipah Abdul Wahab and Kevin Holland* * The authors are respectively Senior Lecturer, PhD, College of Business, Universiti Utara Malaysia, Malaysia and Professor of Accounting and Taxation, School of Management, University of Southampton, UK. Address for correspondence: Nor Shaipah Abdul Wahab, College of Business, Accounting Building, Universiti Utara Malaysia, 06010 Sintok, Kedah, Malaysia. Email: [email protected] Acknowledgements We appreciate helpful comments from participants at School of Management, University of Southampton Staff Seminar Series; Tax Research Network Annual Conference 2009, Cardiff, Wales; 2010 Hawaii Winter Global Conference on Business and Finance, Hawaii, US; British Accounting Association Annual Conference 2010, Cardiff, Wales; Birmingham Business School Seminar Series 2010, University of Birmingham; and Essex Business School Seminar Series 2011, University of Essex. We would also like to thank both referees for their constructive comments.
Transcript of 1 Tax Planning, Corporate Governance and Equity Value Nor ...

1
Tax Planning, Corporate Governance and Equity Value
Nor Shaipah Abdul Wahab and Kevin Holland*
* The authors are respectively Senior Lecturer, PhD, College of Business, Universiti Utara Malaysia, Malaysia and Professor of Accounting and Taxation, School of Management, University of Southampton, UK. Address for correspondence: Nor Shaipah Abdul Wahab, College of Business, Accounting Building, Universiti Utara Malaysia, 06010 Sintok, Kedah, Malaysia. Email: [email protected]
Acknowledgements
We appreciate helpful comments from participants at School of Management, University of Southampton Staff Seminar Series; Tax Research Network Annual Conference 2009, Cardiff, Wales; 2010 Hawaii Winter Global Conference on Business and Finance, Hawaii, US; British Accounting Association Annual Conference 2010, Cardiff, Wales; Birmingham Business School Seminar Series 2010, University of Birmingham; and Essex Business School Seminar Series 2011, University of Essex. We would also like to thank both referees for their constructive comments.
2
Tax Planning, Corporate Governance and Equity Value
Abstract: Tax planning by firms is a highly significant activity. After audit fees, tax related
services are the largest source of fee income for UK accounting firms. When viewed in terms
of its impact, tax planning is the major source of the corporation tax gap amongst large firms
(HMRC, 2010). Although traditionally tax planning has been viewed as benefiting
shareholders via increased after tax earnings, more recently the underlying motivation has
been questioned. Desai and Dharmapala (2006) argue that when an information asymmetry
exists between managers and shareholders with respect to tax planning, it can facilitate
managers acting in their own interests resulting in a negative association between tax
planning and firm value. Using a sample of UK quoted firms from 2005-2007 and data drawn
from International Accounting Standard 12 Income Taxes (IASB, 2010) Effective Tax Rate
(ETR) reconciliations, this paper reports such a negative relationship. Further, the
relationship is robust to the inclusion of corporate governance measures which could be
expected to moderate the potential implications of a tax related shareholder-manager
information asymmetry. An innovation of this paper is in using the ETR reconciliations to
examine sub-categories of tax planning activities. The paper contributes to the debate of who
determines, and benefits from tax planning conducted by firms. Its findings have direct policy
relevance for shareholders and tax administrations in monitoring and controlling firms’ tax
planning activities.
Keywords: Tax planning, tax avoidance, firm value, corporate governance, agency costs
JEL classification: G14 G30 H20 H32

3
1. Introduction
Fees for tax services are the most significant source of fee income for UK accounting firms
after audit fees (Accountancy, 2007). Typically, such fees amount to 24 per cent of total fee
income received by the UK’s 60 largest accounting firms (Accountancy, 2007). Whilst some
of the advice relates to routine compliance matters it is reasonable to speculate that advice on
tax planning comprises a significant element of the fee income. Reliable estimates of the
scale of tax planning are notoriously difficult to make primarily due to lack of agreement on
definitional and related measurement issues (National Audit Office, 2007). Recently HM
Revenue and Customs (HMRC) has published estimates of the “tax gap” i.e. the difference
between the theoretical liability and the amount collected. The latest available estimates are
for 2008-09 (HMRC, 2010) and show a corporation tax gap of £6.9 billion, equivalent to
13.9% of the theoretical liability. For the largest corporate groups administered by its Large
Business Service (LBS), HMRC (2010) disaggregates the corporation tax gap into “tax
avoidance issues” and “technical issues”.1 In the three year sample frame examined in this
paper HMRC (2010) estimates that tax avoidance contributes 77.4%, 87.5% and 92.9% of the
estimated LBS corporate tax gap of £3.1 billion (2004-05), £3.2 billion (2005-06) and £2.8
billion (2006-07) respectively, the balance being attributable to “technical issues” including
evasion. These estimates have been criticised for underestimating the extent of the gap and
their publication has led to debates on both the actions of tax payers and concerns over the
performance of HMRC (Financial Times, 2010). Tax planning is clearly a significant activity
both in terms of fees and tax saving.
This paper examines shareholders’ valuation of corporate income tax planning.2 In the
absence of access to confidential tax return data we use the term tax planning to describe all

4
activities designed to produce a tax benefit.3 Although reducing tax can lead to higher after
tax profits there are actual and potential costs that inhibit firms from maximising after tax
profits through tax planning. In addition to direct paid costs in the form of salaries and fees,
indirect paid costs can arise, for example, when corporate restructuring is a necessary
condition for obtaining the desired tax benefit. Potential costs can exist to the extent that tax
planning can be challenged by a tax administration which can also then lead to reputational
costs. Empirical evidence from the US that suggests tax planning costs act as a significant
constraint on corporate tax planning activity may explain what Weisbach (2002) describes as
the “undersheltering puzzle” i.e. why firms do not appear to minimise tax liabilities.
More recent US research has suggested further costs, in the form of agency costs, lead
shareholders to discount the value of firms by reference to levels of tax planning activity
(Desai & Dharmapala, 2006). They argue the lack of transparency associated with tax
planning provides managers with a “screen” or cover to hide self serving actions (Desai et al.,
2006). A survey by Henderson Global Investors (2005) found a reluctance on the part of
managers to disclose tax related risk management information to shareholders. This lack of
awareness on the part of shareholders can lead to information asymmetry between managers
and shareholders facilitating moral hazard. A related concern of shareholders is that managers
who are “aggressive” with respect to tax planning may also be “aggressive” in their financial
reporting decisions (Frank, Lynch & Rego, 2009). Against this setting it is also relevant to
consider the role of corporate governance mechanisms in moderating any relationship
between tax planning and firm value (Desai et al., 2006).
Shareholder concerns may also be driven by general attitudes towards tax planning. Since the
mid 1990s there is strong evidence of changing attitudes. At the supranational level the

5
European Union (EU) and Organisation for Economic Cooperation and Development
(OECD) have both acted to protect corporate tax revenues by initially focussing on
combating “tax competition” between states (European Union, 1999; OECD, 1998). These
initiatives were designed to limit the extent to which individual states could use tax policy to
influence firms’ location decisions. Subsequently the EU and OECD’s focus moved to
enhancing legal and administrative procedures to ensure consistent and effective
administration of tax legislation. In particular, the European Union (2004) set out steps to
improve the ease at which information on corporate tax payers can be passed between tax
authorities and non-tax supervisory bodies. In its “Seoul Declaration” the OECD’s Forum on
Tax Administration announced its intention to study the role of tax intermediaries in
“unacceptable tax minimisation arrangements” (OECD, 2008). More recently the OECD
(2009) has focused on the banking industry as both a supplier and user of “aggressive tax
planning arrangements”.
The UK’s HMRC has played a leading role in the above initiatives and this is reflected in
recent changes within UK tax legislation and tax administration. The Permanent Secretary for
Tax at HMRC, David Hartnett, describes 2004 as “a tumultuous year in the tax
administration's efforts to counter tax avoidance” (Hartnett, 2009). In that year the HMRC’s
Anti-Avoidance Group (AAG) was established to develop and deliver the HMRC’s anti-
avoidance activities (Tailby, 2009). Also in 2004 new legislation (The Disclosure of Tax
Avoidance Schemes) was enacted to provide HMRC with early information on the marketing
of “aggressive” tax planning arrangements (HMRC, 2006).4 A change of approach has also
been adopted in implementing existing legislation with the HMRC’s use of risk assessments
to direct administrative effort to examining firms where the estimated level of corporate tax
risk is highest (Freedman, Loomer & Vella, 2007; HMRC, 2007).
6
Tax planning by firms is of wider public interest since it can affect the level of provision of
public goods which can then contribute to social issues (Slemrod, 2004). Non-Governmental
Groups in the UK such as Oxfam (2009), Christian Aid (2009) and Trade Union Congress
(2009) have all examined the issue from a social justice perspective. A similar line was taken
by The Guardian (2009) in a series of newspaper articles.
The measure of “tax planning” used in this paper is initially defined as the difference between
a firm’s current tax provision as disclosed in its annual financial statements and the (notional)
level of tax that would be payable if its profit before tax was subject to tax at the UK
statutory rate. We accept this is an imperfect measure of the outcome of tax planning
activities for a number of reasons. Firstly, the measure would fail to detect tax planning that
results in income not being subject to tax whilst also being excluded from accounting income.
As discussed below strong incentives act against this scenario. Secondly, the measure
includes non-discretionary differences between accounting and tax definitions of income
which do not necessarily represent tax planning. These include for example, timing effects
arising from differences between accounting depreciation and capital allowance rates or
permanent effects arising when capital expenditure does not qualify for capital allowances. In
subsequent analysis the sensitivity of the paper’s conclusions to these limitations is assessed.
The paper’s contribution is four fold. Firstly against a backdrop of increased attention on
firms’ tax planning activities it provides the first evidence concerning shareholder valuation
of UK firms’ tax planning and provides insights into corporate behaviour and the resulting
response of shareholders. The extant literature is US based and does not necessarily translate
to the UK setting because of differences in tax law and approaches to compliance and
enforcement. Secondly by using recently available tax reconciliation data required under IAS

7
12 Income Taxes (IASB, 2010), this paper uses disaggregated tax related data to test for
differential effects of varying types of tax planning. Previous studies have generally relied on
a lower level of disaggregation e.g. Desai and Dharmapala (2009). Thirdly although the
potential moderating influence of corporate governance on the relationship between tax
planning and share value has been examined in earlier studies, factor analysis is used to
generate proxy variables that capture broad over reaching corporate governance structures.
This avoids a subjective choice of proxy variables. Fourthly the analysis is conduced over a
three year period thereby recognising that the composition of tax planning activities and
attitudes to tax planning may vary over time.
In summary we find evidence of a negative relationship between the level of tax planning and
firm value. When its components are analysed separately, the source of the negative
relationship appears to be permanent differences between taxable income and accounting
profit measures. Both these findings are consistent with the Desai et al. (2006) agency view
of tax planning. Unlike US studies though there is no compelling evidence of the negative
relationship being moderated by corporate governance procedures.
The next section of the paper reviews the relevant literature and is followed by sections on
research design, sample and data source, results, further analysis and finally the conclusion.
2. Tax planning activities, corporate governance and shareholders’ valuation
Whilst there is a relatively long tradition of research in documenting and explaining
variations in tax burdens or Effective Tax Rates (ETRs) in terms of firm level characteristics
e.g. Zimmerman (1983), Gupta and Newberry (1997) and Holland (1998), only recently has
attention turned to understanding the underlying motivation for these variations and any

8
potential equity valuation consequences. Traditionally, tax planning is seen as leading to
increased after tax earnings and therefore to be in the interest of shareholders; this is the view
typically taken in valuation models. In recognising shareholders’ need to control managers’
tax decision making, Slemrod (2004) suggests linking managers’ compensation to “desirable
outcomes” such as ETR. This implied valuation effect is consistent with anecdotal evidence
of a negative association between ETR and share price (Swenson 1999).
Studies of tax related valuation effects have considered whether in making valuation
assessments shareholders differentiate between different categories of tax planning in terms
of expected benefits and costs including risk. These studies typically use deferred tax
disclosures in firms’ annual statements to disaggregate tax planning activities. IAS 12 Income
Taxes (IASB, 2010) requires firms to provide a breakdown of their tax charge distinguishing
between current and deferred taxes. A deferred tax charge (credit) is required when an item of
income or expense included in the current income statement is included in the taxable income
calculation of another period i.e. a “timing difference” (IASB, 2010). For example,
differences in the rates of accounting depreciation and capital (investment) allowances with
respect to qualifying capital expenditure.5 Consequently, the tax charge in the income
statement includes both the current and future (deferred) tax consequences of the current
period’s activities.6 In contrast, income or expenses which are only ever included in either the
current income statement or the current taxable income calculation give rise to what are
commonly referred to as “permanent differences”.
Consequently planning benefits can be classified as either permanent or timing although in
practice the distinction between the two can be blurred where timing differences are
continually replaced. US evidence of the nature of tax planning suggests that “tax shelter”
9
activity is directed at permanent savings (Wilson, 2009). In contrast, although deferral or
timing differences have no impact on the overall tax expense in the income statement a cash
flow timing benefit can arise (Maydew & Shackelford, 2007).
In examining valuation effects of timing and permanent differences it is necessary to control
for earnings management as it can give rise to similar differences (Phillips, Pincus & Rego,
2003; Hanlon, 2005). Further, in attributing differences to tax planning activity, it is
necessary to isolate non-discretionary items e.g. tax depreciation, which although potentially
having a valuation effect, do not necessarily represent tax planning activity (Frank et al.,
2009).
In the literature on potential tax related valuation effects two specific sources of differences
have been examined. Amir and Sougiannis (1999) and Atwood and Reynolds (2008) find that
current period utilisation of prior period tax losses is value relevant. Similarly where a firm
operates across a number of jurisdictions with varying statutory rates, tax rate differentials
can provide a tax saving recognised in firm value (Bauman & Shaw, 2008). The valuation of
the tax rate differential is dependent on the perceived earnings repatriation policy and the
relative stabilities of the tax jurisdictions involved, i.e. whether the effect represents a timing
or de facto permanent difference.
In contrast, some studies find no direct association between measures of firm value and tax
planning related measures. This absence has been attributed to the effect of unquantifiable
non-tax costs (Cloyd, Mills & Weaver, 2003).7 In particular Desai et al. (2006) predict that in
an agency setting tax planning can lead to a reduction in firm value when managers have both
the opportunity to understate reported accounting profit and the incentive to reduce corporate

10
income tax liability by understating taxable income. If the two forms of understating are
complementary, the general lack of transparency associated with tax planning provides
“cover” for managers to extract rents at the expense of shareholders by understating
accounting profit. Further, the effect of this complementary relationship is conditional upon
the corporate governance mechanisms in place. Desai et al. (2006) predict that tax planning
will be valued negatively by shareholders where weak corporate governance would permit
associated understatement of accounting profit. When corporate governance provision is
strong, accounting profit understatement is not possible and therefore tax planning provides
no diversionary benefit. Desai et al. (2009) provide empirical evidence which gives some
support for the prediction that corporate governance moderates the relationship between tax
planning and firm value. This finding is consistent with the conclusion that tax planning is
interpreted to have been conducted for the benefit of shareholders only when the level of
corporate governance is strong. In other cases shareholders appear to be suspicious of
managers’ motives and do not value tax planning positively. Similarly, Wilson (2009) and
Hanlon and Slemrod (2009) document evidence that shareholders’ valuation of tax planning
activity is conditional upon corporate governance status. A related valuation effect
contributing further to shareholders’ potential concerns is that “aggressiveness” in tax
planning can be associated with accounting “aggressiveness” (Frank et al., 2009). Within the
same accounting period firms attempt to manage accounting profit upwards while
simultaneously managing taxable income downwards.

11
3. Research design
Measurement of tax planning
As shareholders do not generally have access to firms’ tax returns and details of their
planning activities it is necessary to use proxies based on publicly available information
(Stewart, 1981). In addition to the requirement to provide for deferred taxation IAS 12 Income
Taxes (IASB, 2010) requires firms to publish a reconciliation between the actual tax expense
and the notional expense arising if liability was based on the current accounting profit before
tax, i.e. without the adjustments normally required under tax law to convert accounting profit
to taxable income. We measure the extent of tax planning as the after tax (net) effect of any
difference between accounting profit and taxable income i.e. the sum of permanent
differences (PD) and timing differences (TD).8 As discussed previously this measures
captures both the effects of tax avoidance and any tax evasion. Hence we use the more
general term “tax planning” (TP) to describe the measured effect. In addition to permanent
and timing differences, variation between the notional and actual tax expense can arise when
a firm faces varying statutory rates because of taxable income arising in more than one tax
jurisdiction. Using published ETR reconciliations this statutory rate differential (STRDIF)
can be separately identified.
The variable TP is defined in equation 1 below and as shown is equivalent to the difference,
in profit terms, between a firm’s statutory tax rate and its ETR.9 This ETR measure is
consistent with that used in prior studies which have examined equity considerations, for
example Zimmerman, 1983; Porcano, 1986; Holland, 1998; Mills, Erickson and Maydew,
1998; Rego, 2003; Dyreng, Hanlon and & Maydew, 2008.
( )
−=++=
PBT
CTESTRPBTSTRDIFTDPDSTRTP ukuk ** (1)

12
Where: TP = tax planning measure, STRuk = UK statutory main corporation tax rate, CTE =
current tax expense, PBT = profit before tax, PD = permanent differences between
accounting profit and taxable income measures, TD = timing differences between accounting
profit and taxable income measures and STRDIF = tax effect of differences between UK and
non UK statutory corporate income rates. The value of STRDIF is disclosed in published
ETR reconciliations and can be defined as in equation 2:
STRDIF = (STRuk – STRos)*TPos (2)
Where: STRos = weighted (by taxable income) average overseas statutory corporate income
tax rate and TPos = taxable income subject to overseas tax.
A potential limitation of the tax planning variable is that it fails to detect tax savings that do
not generate either a timing difference, permanent difference or result in a reduced statutory
tax rate applying, as captured by the variables, TD, PD and STRDIF respectively. This could
arise where income is legally or illegally excluded from the income statement. Academic
evidence suggests that such exclusion is unlikely to be significant; the need to report
sufficient level of accounting profit in order to satisfy capital market expectations is a
significant constraint on tax planning strategies (Hanlon, 2003).
The tax planning variable (TP) is designed to capture the aggregate effect of tax planning
activity. As discussed above its individual components may have varying valuation effects.
Using the IAS 12 Income Taxes (IASB, 2010) reconciliations subsequent analysis classifies
reconciling items into four categories comprising: permanent differences (TPD), timing

13
differences excluding loss relief (TTD), loss relief (TLOSS) and where the description of a
reconciling item was insufficient to make a classification on the above basis, unclassified
(TUNC). The reconciliations also disclose the effect of differences in statutory tax rates
(STRDIF). These disclosures allowed for the disaggregation of the PD and TD terms in the
tax planning variable TP in equation (1) into these further components as follows in equation
3:
PD + TD = TPD + TTD + TLOSS + TUNC (3)
Measurement of corporate governance
In preference to using selective individual factors to capture broad corporate governance
mechanisms factor analysis is used to systematically identify proxies of underlying corporate
governance constructs. To ensure the relevance of the selection process the full range of
variables was selected from two recent studies of UK corporate governance practice by
Florackis (2008) and McKnight and Weir (2009). The mechanisms considered represent
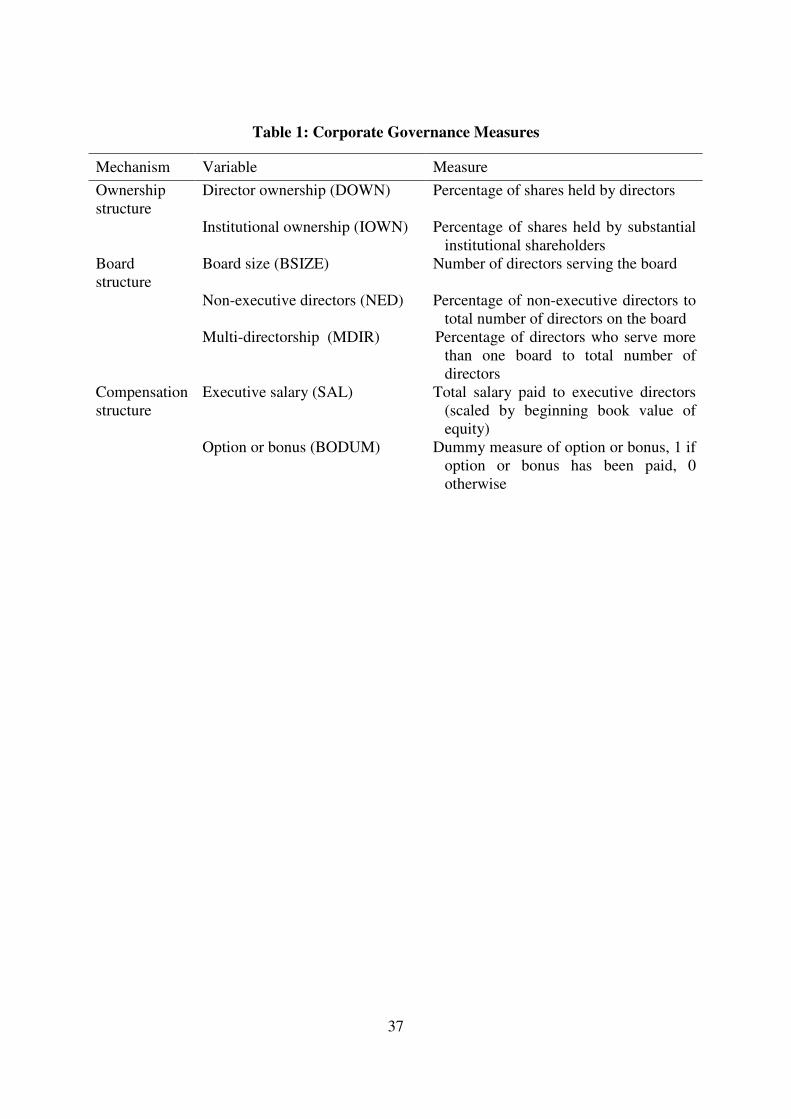
ownership structure, board structure and compensation structure, see table 1.
XXX Insert Table 1 about here XXX
Ownership structure focuses on managerial and institutional ownership as potential
mechanisms to reduce agency conflict. However, previous studies of managerial ownership
document both a positive effect through goal congruence (Jensen & Meckling, 1976) and
negative effect, at high levels of ownership, through entrenchment (Florackis, 2008).
Similarly, although institutional shareholders can provide an informed monitoring function,
UK institutional shareholders are generally found to be passive (Goergen & Renneboog,

14
2001). Further, high levels of institutional ownership might allow a dominant institution to
pursue its own objectives at the expense of other shareholders (Hart, 1995).
Board structure defined in terms of the proportion of non-executive directors to total
directors, board size and duality of chair and chief executive can be a significant factor in
influencing shareholder - manager relationships (Florackis, 2008).10 Non-executive directors
have been found to be effective in mitigating agency problems due to the constructive effects
of directors’ independence, professional knowledge and experience (Zahra & Pearce, 1989).
Board size has been found to influence corporate governance effectiveness in both positive
and negative ways. Positively, large size can be associated with an increased range of skills
and experience, greater opportunities in securing resources and more effective restriction of
CEO domination. However, large size can also be associated with increased complications in
coordination, communication and decision-making processes (Florackis, 2008). Individual
directors holding multiply directorships have been found to provide increased effectiveness in
terms of access to social networks, knowledge spillovers from multiple backgrounds and
higher commitment of directors (Conyon & Muldoon, 2006; Haniffa & Hudaib, 2006).
Finally, compensation structure is considered. This mechanism, either by way of granting
share options or providing performance-related pay, is designed to align managers’ interests
with those of shareholders (Florackis, 2008). However, the effectiveness of remuneration in
reducing agency related problems can be challenged (Firth, Tam & Tang, 1999). Following
Florackis (2008), this paper considers variables based on the level of executive salary and a
dummy variable to capture the presence of options or performance related bonuses.

15
Before applying factor analysis, an initial assessment of the characteristics of the underlying
data was performed. This comprised three steps: analysis of the pearson correlation matrix of
the corporate governance variables, examining its determinate and measuring sample
adequacy using the Kaiser-Meyer-Olkins test (KMO) and Bartlett’s test of sphericity (Pett,
Lackey & Sullivan, 2003). These test statistics are reported in table 2 (panel A). The
insignificant determinate and Bartlett test values combined with an overall KMO test value of
0.6115 support the use of factor analysis.11 Finally, as all but two of the correlation
coefficients are significant at the 5% level and all of the KMO statistics are in excess of 0.5
(see table 2, panel B) it is concluded that factor analysis can be applied to the data set.
XXX Insert Table 2 about here XXX
The factor analysis indicate two underlying factors with eigenvalues > 1, and a cumulative
variance explanation of 0.5111, as shown in table 2 (panel C).12 As the factor analysis is
conducted with the intention to derive general corporate governance variables, a surrogate
variable is required (Hair, Black, Babin, Anderson & Tatham, 2006). Thus, all of the items
are further analysed to determine surrogate variables for each of the two factors. Based on the
highest factor loadings the results indicate the proportion of non-executive directors on the
board of company (NED) and percentage of shares held by substantial institutional
shareholders (IOWN) as surrogates of factor 1 and 2 respectively in capturing firms’ general
corporate governance structures. Consequently, these two variables are included in the
subsequent empirical analysis.
Regression models
The empirical analysis in this paper is based on a standard valuation model used in the
accounting literature, for example, O’Hanlon and Taylor (2007) and Horton (2008). The

16
model explains equity valuation as a function of book value (BV) and current earnings (PBT)
and a series of control variables. Market (firm) value of equity (MVE) is measured three
months after the accounting year-end to reflect the lag in disclosing annual financial
statements to shareholders (O'Hanlon & Taylor, 2007; Horton, 2008).13
The control variables mainly relate to information asymmetry and agency costs, for example,
annual dividends (DIV) (Rees, 1997) and capital contribution (CC) (Akbar & Stark, 2003). In
line with valuation relevance and taxation literatures, this paper also controls for several firm-
specific characteristics, these consist of capital intensity (CAPINT) (Mills et al., 1998; Frank
et al., 2009), industry type (INDDUM) (Derashid & Zhang, 2003; O'Hanlon et al., 2007),
leverage (LEV) (Mills et al., 1998), foreign sales (FS) (Rego, 2003; Bauman et al., 2008) and
earnings management (EM) (Healy, 1985; Phillips et al., 2003; Hanlon, 2005).
In explicitly controlling for observable tax related proxies of tax planning activities e.g.
CAPINT, LEV and FS, the tax planning variable TP captures tax planning in other undefined
areas which, because of their relative lack of transparency when compared to capital structure
for example, may be valued differently by shareholders (Chen, Chen, Cheng & Shevlin,
2010). A subsequent version of the model is run without the inclusion of these three control
variables. The initial model (I) incorporating the tax planning and related control variables is
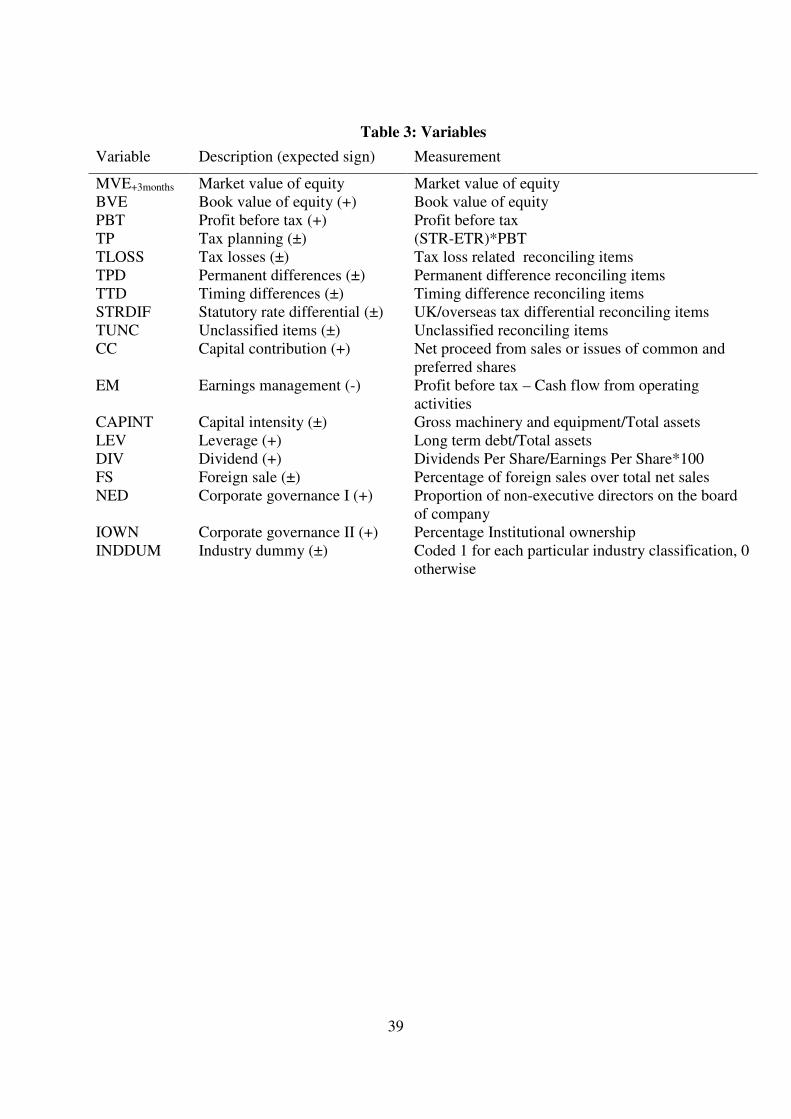
set out below with variables as defined in table 3:
itn
itnititit
ititititititit
INDDUMFSDIVLEV
CAPINTEMCCTPPBTBVEMVE
εββββ
βββββββ
+++++
++++++=
∑ =
+
16
10987
65432103
(model 1)

17
To assess the potential effect of corporate governance factors on the valuation of tax planning
the above model is extended by including the two corporate governance related variables
NED and IOWN to give model II as follows:
MVEit+3 = β0 + β1BVEit + β2PBTit + β3TPit + β4NEDit + β5IOWNit + β6CCit + β7EMit
+ β8CAPINTit + β9LEVit + β10DIVit + β11FSit + 18
12=Σ
nβnINDDUM it + εit (model II)
A third model (III) tests whether the relationship between firm value and tax planning is
moderated by the strength of firms’ corporate governance structures. Accordingly, model III
is extended by the inclusion of two moderating variables, TP*NED and TP*IOWN
constructed by multiplying a firm’s tax planning variable by NED and IOWN variables
respectively.
MVEit+3 = β0 + β1BVEit + β2PBTit + β3TPit + β4NEDit + β5IOWNit + β6TPit*NEDit +
β7TPit*IOWNit +β8CCit + β9EMit + β10CAPINTit + β11LEVit + β12DIVit + β13FSit +
20
14=Σ
nβnINDDUMit + εit (model III)
In each of the above models the aggregate tax planning variable TP has been employed. To
test whether shareholder valuations of tax planning are conditional on the nature of the tax
planning, in model IV the variable TP is replaced by its individual components TLOSS, TPD,
TTD, STRDIF and TUNC as follows:
18
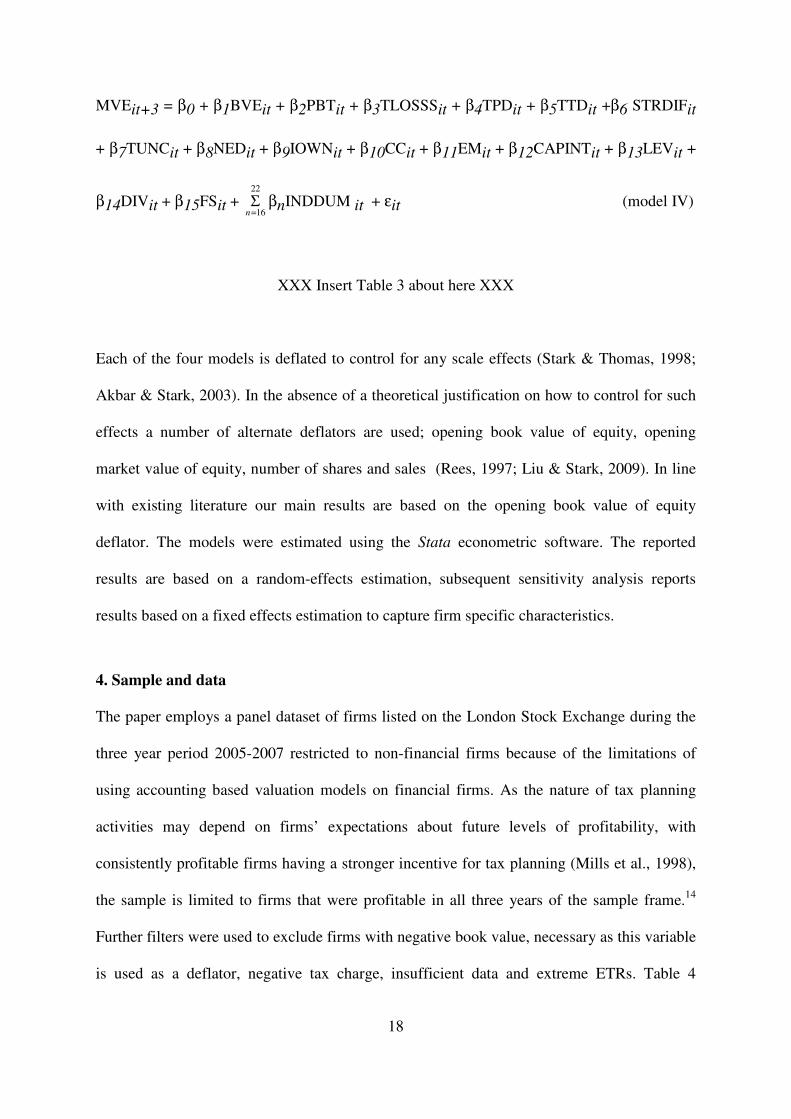
MVEit+3 = β0 + β1BVEit + β2PBTit + β3TLOSSSit + β4TPDit + β5TTDit +β6 STRDIFit
+ β7TUNCit + β8NEDit + β9IOWNit + β10CCit + β11EMit + β12CAPINTit + β13LEVit +
β14DIVit + β15FSit + 22
16=Σ
nβnINDDUM it + εit (model IV)
XXX Insert Table 3 about here XXX
Each of the four models is deflated to control for any scale effects (Stark & Thomas, 1998;
Akbar & Stark, 2003). In the absence of a theoretical justification on how to control for such
effects a number of alternate deflators are used; opening book value of equity, opening
market value of equity, number of shares and sales (Rees, 1997; Liu & Stark, 2009). In line
with existing literature our main results are based on the opening book value of equity
deflator. The models were estimated using the Stata econometric software. The reported
results are based on a random-effects estimation, subsequent sensitivity analysis reports
results based on a fixed effects estimation to capture firm specific characteristics.
4. Sample and data
The paper employs a panel dataset of firms listed on the London Stock Exchange during the
three year period 2005-2007 restricted to non-financial firms because of the limitations of
using accounting based valuation models on financial firms. As the nature of tax planning
activities may depend on firms’ expectations about future levels of profitability, with
consistently profitable firms having a stronger incentive for tax planning (Mills et al., 1998),
the sample is limited to firms that were profitable in all three years of the sample frame.14
Further filters were used to exclude firms with negative book value, necessary as this variable
is used as a deflator, negative tax charge, insufficient data and extreme ETRs. Table 4

19
presents the sample selection process which resulted in 196 firms to give a balanced panel of
588 year end observations over the three year period.
The dataset comprised tax data extracted from firms’ annual reports with the remaining
financial statement related data obtained from Thompson Financial Datastream. Corporate
governance data was obtained from Hemscott database with supplemental data collected from
annual reports and The Corporate Register (various years).
XXX Insert Table 4 about here XXX
Descriptive statistics
When estimating the above models influential and outlying observations were excluded to
provide a more representative analysis.15 Table 5 contains descriptive statistics relating to the
resulting sample of 444 firm year end observations used in estimating models I, II and III and
the sample of 405 year end observations used to estimate model IV. Based on table 5 the
mean value of TP indicates a mean tax saving of £7.465M for the sample of 444 firm year
ends and a corresponding figure of £7.377M for the smaller sample of 405 firm year ends.
The relative magnitude of the tax planning components can be seen in table 5. Expressed as a
percentage of mean profit before tax the individual components in order of declining
magnitude are: TTD (1.32%), STRDIF (0.59%), TUNC (0.53%), TLOSS (0.40%) and TPD
(-0.19%). For each of the five components there are both positive (tax saving) and negative
(tax increasing) values which highlights the dynamic nature of tax planning. The relatively
high value of TUNC raises questions about the sufficiency of some firms’ tax related
disclosures.

20
The corporate governance related characteristics of the sample can be summarised as follows:
the mean board size (BSIZE) is eight directors with a slight majority (57%) being non-
executive directors (NED). Consistent with the observation that non-executive directors
provide networking related benefits the percentage of directors that have multiple
directorship (MDIR) is almost half (49%). Directors’ equity ownership (DOWN) is typically
7% while the level of institutional ownership (IOWN) is higher at 34%. The mean basic
salary compensation (SAL) per board for executive directors in total is £987,577. These
values are similar to those reported in a recent UK corporate governance study (Florackis,
2008) with the exception of DOWN which was higher at 15%.
XXX Insert Tables 5 about here XXX
5. Results
The results of the four models are reported in table 6. In addition to the influential and outlier
analysis previously described, further diagnostic tests were performed. The level of
multicollinearity was assessed using condition indices (Belsley, Kuh & Welsch, 1980). These
indicated the levels were acceptable.16 Due to repeated sampling of firms that have common
features e.g. year end, panel data in accounting research can exhibit serious cross-sectional
(“clustering”) dependence (Bernard, 1987; Petersen, 2009). Consequently the reported
standard errors are estimated using Eicker-Huber-White robust standard errors which also
control for heteroscedasticity (Petersen, 2009).
XXX Insert Table 6 about here XXX

21
Models I, II and III are reported in columns I, II, III of table 6. The first two models show a
significant negative relationship between firm value and tax planning which is robust to
controlling for corporate governance mechanisms in model II.17 This result is consistent with
shareholder concerns about moral hazard risk in tax or other tax planning-related risks, for
example, the risk related to inspection or investigation by tax authorities. The negative
significant coefficient with respect to IOWN is consistent with the Goergen et al. (2001)
finding on the passive and ineffective monitoring role played by UK institutional investors.
The control variables where significant are of the expected negative sign in the cases of EM
and CAPINT. The variable FS is positive suggesting that an increasing proportion of non UK
sales is associated with higher firm value. Though this result could be explained by
differences in relative tax rates it could also arise because of differences in relative
profitability. In model IV we explicitly test for the effect of foreign tax rate differentials.
Model III incorporates the two moderating variables TP*NED and TP*IOWN to examine
whether the relationship between firm value and tax planning is conditional upon the strength
of corporate governance structures. The previously negative significant relationship between
firm value and tax planning no longer holds, and although now positive, TP is not
significantly different from zero. Caution should be exercised in interpreting this as evidence
of a corporate governance effect. A comparison of the adjusted R2 for model III (64.70%)
with that of model II (64.34%) is consistent with the moderating corporate governance
variables TP*NED and TP*IOWN contributing little in terms of additional explanatory
power.18 As an additional test of the influence of corporate governance the sample was split
into sub-samples of “high” and “low” corporate governance effectiveness (Desai et al., 2006).
Firms were assigned a sub-sample by reference to the median value of the product of NED
and IOWN on the basis that both higher institutional ownership and proportion of non-

22
executive directors could contribute to better corporate governance (Zahra et al., 1989;
Florackis, 2008). The results are reported in the next two columns of table 6 for “high” and
“low” governance firms respectively. Both estimations report a significant negative
relationship between firm value and TP; the TP coefficients in the two sub samples do not
significantly differ from each other.19 In contrast to Desai et al. (2009), these results suggest
corporate governance does not mitigate the negative relationship between TP and firm value
even in the case of “high” governance firms.20
The next set of results examines whether the relationship between TP and firm value varies
by its components (model IV). There is a significant negative relationship between firm value
and TPD. Despite controlling for earnings management through the variable EM, it is
possible that the variable TPD reflects both tax planning and earnings management
(aggressive accounting). However, a comparison of the EM coefficient between models II
and IV which exclude and include the variable TPD respectively shows an insignificant
difference consistent with TPD reflecting tax effects.21 The remaining tax planning
components TLOSS, TTD, STRDIF and TUNC are statistically insignificant.22 Although the
variable FS which measures the proportion of firm sales that are made outside of the UK is
consistently positive and statistically significant, the foreign tax rate differential variable
STRDIF is consistently insignificant, though positive. This suggests the influence of FS is
derived from pre tax profitability and not tax benefits.
6. Further analysis
This section reports further analysis to assess the robustness of the above results. The analysis
relates to the date of measuring firm value, choice of deflator, firm fixed-effects, potential
23
non-linear association between firm value and tax planning, alternative measures of firm
value and the exclusion of the potential tax planning related control variables. To provide a
fuller picture of the association between firm value and tax planning, annual regressions are
also carried out.
Qualitatively identical results to those reported above in models I, II and III are found when
deflating either by opening market value of equity or sales. However, when deflating by
number of shares no significant relationship is found between tax planning and firm value.
When examining the individual components using model IV deflated by the number of shares
TPD is no longer significant while STRDIF become significant and positive. When opening
market value is used as the deflator, none of the components in model IV are reported as
significantly related to firm value. When deflated by sales the only significant component is
TTD which becomes positive. Caution must therefore be exercised in attributing the source of
the overall negative relationship between firm value and tax planning to individual
components because of the sensitivity of model IV’s results.
The results reported in table 6 are estimated using a random effects model which assumes any
uncontrolled heterogeneity in firm specific factors are not correlated with the included
independent variables. We relax this assumption through the use of a fixed effects model.
These results are qualitatively no different from those in table 6. We conclude that the
negative relationship between firm value and TP does not appear to be proxying for omitted
firm specific characteristics, such as earnings management.
High levels of tax planning may only be achievable at unacceptable levels of risk or
“aggressiveness”. Consequently the negative association between firm value and TP may
24
increase non-linearly at “higher” levels of tax planning (Hanlon et al., 2009). Models I and II
were re-estimated with the inclusion of quadratic tax planning variable TPNL defined as
TP*TP. The inclusion of this variable did not change the previously reported results and did
not significantly increase the models explanatory power consistent with a linear relationship.
Tobin’s Q has been used in some studies e.g. Desai et al. (2009) as an alternate dependent
variable to market value of equity.23 Regressing Tobin’s Q onto the independent variables in
models I, II and III produce qualitatively identical coefficient estimates to the results in table
6. When using Tobin’s Q to examine the individual components in Model IV, in contrast to
the significant negative relationship reported in table 6 for TPD, no statistically significant
coefficient arises with respect to TPD or any of the other tax component variables.
The inclusion of the control variables CAPINT, LEV and FS which are designed to capture
observable tax planning related activities result in the variable TP capturing the remaining or
unobservable tax planning activities (Chen et al., 2010). Omitting these three variables from
the models would result in the variable TP capturing a wider range of tax planning activities
both observable and unobservable. To the extent that observable activities pose lower risks to
shareholders in terms of moral hazard etc, the TP coefficient should increase after excluding
the three control variables with similar effects for the individual components in model IV.
However, these revised models show qualitatively identical results to those reported in table
6., in particular there are no significant differences with respect to the TP variable or its
components.24 This implies the negative TP coefficient and those of the individual tax
components are not solely driven by unobservable tax planning related factors but that
shareholder concerns relate to both observable and unobservable tax planning factors.

25
Attitudes to tax planning have changed over time as discussed above. To explore the
possibility that the negative relationship between firm value and tax planning may vary over
time two further tests were conducted. Firstly models I, II and III were reestimated with the
inclusion of year dummies, this process has no effect on the qualitative interpretation of the
reported results. Secondly annual regressions for each of the three years were estimated. The
results for 2005 and 2006 are consistent with the above results, while for 2007 a statistically
insignificant coefficient is reported for TP.25
The variation in annual results suggests changes over time in either the nature of tax planning
or shareholders’ attitudes to tax planning, or a combination of both effects. Given the
restrictions of using publicly available data relating to tax planning it is difficult to assess the
extent to which the first factor is valid. However, an investigation of the individual
components by year does reveal variation in their relative importance. Figure 1 plots by year
the mean value of each component relative to TP. Of particular note is the reversal between
2005 and 2006 of the relative importance of TPD and TTD and the marked variation in the
remaining terms with the exception of TLOSS. This adds strength to the need to consider
several years of data when drawing conclusions on tax planning effects because of possible
linkages between years. Though there is considerable variation across the years there is no
obvious indication of why 2007 differs from the earlier two years.
XXX Insert Figure 1 about here XXX
7. Conclusions
Our overall conclusion is that tax planning is not valued by shareholders and is in fact value
reducing. A consistent negative relationship between tax planning and firm value arises

26
which is generally robust to a number of different specifications and controls. On average the
results are consistent with an agency cost theory of tax planning where the information
asymmetry generally associated with tax planning can result in moral hazard or fear of moral
hazard. There is some evidence that suggests the source of the negative relationship to be
permanent differences, where income is included in accounting profit but falls outside the
definition of taxable income. Arguably this type of activity although carrying the highest
potential tax benefits also potentially generates the highest level of risk and cost.
This overall result is consistent with some of the prior exclusively US based research.
However, in contrast to US findings of Desai et al., (2009) and Wilson (2009), corporate
governance mechanisms do not appear to moderate the agency costs associated with tax
planning. Two possible explanations exist, firstly UK corporate governance mechanisms are
ineffective per se, or secondly, there is insufficient tax related information made available for
a potential control mechanism to operate and this deficiency is noted by shareholders. These
differences suggest researchers should pay attention to tax related institutional and policy
differences that exist between countries when interpreting existing research.
In considering the results it is again worth emphasising that the tax planning measure uses
only publicly available information which although identical to the position shareholders are
in may result in misstatement. If shareholders are to be effective monitors and controllers of
firms’ tax related decision, financial reporting and tax regulatory bodies should consider
requiring increased tax related disclosures by firms. However, shareholders face a dilemma if
in demanding increased tax related disclosure managers are discouraged from pursuing
“legitimate” tax planning activities. To the extent that increased disclosure reduces
“illegitimate” activity shareholders and tax administrators would benefit. A critical step in

27
determining the extent and form of additional disclosures is agreeing the boundary between
“legitimate” and “illegitimate” tax planning.

28
Notes:
1 HMRC (2010) defines technical issues as “uncertainty about the correct tax treatment,
through mistakes to culpable errors in, or omissions from, the company tax return”. This
definition would therefore include the effects of tax evasion.
2 All subsequent references to tax are to corporate income tax unless otherwise stated.
3 Using only publicly available information replicates the position facing shareholders and
therefore distinctions between (legal) tax avoidance and (illegal) tax evasion and
intermediary concepts such as “acceptable tax avoidance” and “aggressive tax planning”
cannot be made. In recognition of this we use the term tax planning to describe the observed
effects though, as subsequently discussed, we would expect tax avoidance to be the main
form of tax planning. Earlier studies that use the term tax avoidance make an implicit
assumption as to the legality of the underlying tax planning processes. However, when
referring to official reports we use the terminology adopted in the report for the sake of
consistency.
4 More recently the Government has established a “study programme” to establish the
feasibility of introducing a “General Anti-Avoidance Rule” (GAAR) into UK domestic
legislation (HM Treasury, 2010).
5 Other sources of timing differences include such items as product warranty costs, retirement
benefit costs and research costs which can be deducted from accounting profits on an accrual
basis but are only deductible for tax purposes when paid in a subsequent period (IASB,
2010). The deferred tax charge can also be affected by a timing difference in relation to
unused tax losses (IASB, 2010).
6 In addition to timing differences recognised in the income statement IAS 12 also requires
recognition of temporary differences arising from differences between an asset or liability’s
(revalued) carrying value for accounting purposes and its tax base. Such temporary
differences are recognised outside the income statement and therefore the measure of tax
planning in this paper is free of tax related revaluation effects.
7 The measurement problem presented by non-tax costs when attempting to identify tax
effects has been highlighted by Shackelford and Shevlin (2001) and Chen, Chen, Cheng and
Shevlin (2010).

29
8 In contrast an alternative measure of tax planning, the “book-tax gap”, captures the gross
effect of the differences between accounting profit and taxable income. The use of a net or
ETR based measure as used in this study has the advantage that it can avoid measurement
errors in the process of grossing up foreign tax expenses in order to arrive at the level of
(gross) taxable income (Hanlon, 2003).
9 Where the ETR expresses the current income tax expense (CTE) relative to the accounting
profit before tax (PBT). Using the notation in the following paragraph CTE is defined as:
CTE = STR*(PBT – PD –TD).
10 In the sample used in this paper 98% of the observations have separate Chair and CEOs.
Therefore the issue of duality is not considered further.
11 The KMO test value is in excess of the acceptable threashold level of 0.5 (Hair et al., 2006).
12 The loadings are based on an orthogonal varimax rotation method in which the factors are
assumed to be independent of each other. However, analysis based on an alternative rotation,
i.e. promax rotation, is also conducted and the results are qualitatively similar to the loadings
of varimax rotation.
13 The subsequently reported results are robust to measuring the market value of equity six
months after the year-end. This alternative measurement of market value allows a longer
period for information in the annual financial report to be reflected in the share price (Rees,
1997; Stark & Thomas, 1998; O'Hanlon & Pope, 1999).
14 This restriction resulted in the exclusion of 22 non-persistent firms. This number is
insufficient to conduct tests within this subset of firms.
15 The basis for excluding influential observations is the DFIT measure, its critical value is:
abs (DFIT)>2*(P/N)½ where P and N are the number of variables and observations
respectively (Belsley et al., 1980). Outlying observations were defined with a studentized
residual >|2| (Chen, Ender, Mitchell & Wells, 2005). In models I, II and III, 87 year end
observations were excluded as either influential or outlying respectively. In order to maintain
a balanced panel by necessity a further 57 year end observations were excluded. In model
IV the number of firm year ends excluded was 99 and 84 respectively.
16 None of the condition indices exceed the critical value of 30 (Belsley et al., 1980).
Similarly bivariate correlation analysis shows an acceptable level of correlation. The largest
(absolute) coefficient +0.28 (between PBT and TP) significant at the 1% level, is below the
critical value of 0.9 (Hair et al., 2006) which indicates insignificant multicollinearity.

30
17 Any potential endogeneity of TP is assessed by re-estimated model I using a 2SLS
regression with an instrumental variable (IV) (Larcker & Rusticus, 2007). Based on the
Durbin-Wu-Hausman test for endogeneity the test rejects the endogeneity of TP χ2 = 14.92
(p = 0.5304). The lag variable TP is considered an appropriate IV due to the short-run nature
of a tax planning activities (Dyreng et al., 2008).
18 Although formal tests do not indicate excessive multicollinearity, see endnote 16.
19 Result of test of significance is as follows: Ho -8.0161 = -8.8816 not rejected χ2 =0.03
(p=0.8578).
20 Interestingly though it does appear to moderate the relationship between earnings
management and firm value.
21 Result of test of significance is as follows: Ho -2.7992 = -2.5750 not rejected χ2 = 0.23
(p=0.6347). As the sample size varies between models II and IV a more stringent test is to
estimate model II using model IV sample size and then compare values of EM coefficient.
This process results in the following: Ho -2.7456 = -2.5750 not rejected χ2 = 0.11 (p=
0.7398).
22 A simple test of differences between the five tax component coefficient estimates indicate
that TPD is significantly different from each of the other four coefficients (TLOSS, TTD,
STRDIF and TUNC) and in turn these four do not differ from each other.
23 Tobin’s Q is computed by deflating, the amount of book value of assets plus market value
of common stock minus book value of common stock minus deferred tax expense, by book
value of assets. As it is now included in the dependent variable the book value of equity is
then removed as an independent variable.
24 Results of tests of significance between the TP coefficient (or tax component variables as
in model IV) in each set of models i.e. with and without the control variables CAPINT, LEV
and FS, are summarised as follows: Model I TP (including controls) = -9.1967, TP (excluding
controls) = -9.5025, χ2 = 0.01 (p = 0.9230). Model II TP (including controls) = -9.5925, TP
(excluding controls) = -10.4004, χ2 = 0.07 (p = 0.7987). Model III TP (including controls) =
2.9235, TP (excluding controls) = 3.5267, χ2 = 0.00 (p = 0.9516). Model IV TLOSS, TPD,
TTD, STRDIF, TUNC (including controls) -1.7713, -12.3547, 7.0694, 5.6768 and -5.8766
respectively; (excluding controls) -1.3063, -12.4622, 7.7668, 2.5688 and -5.7410
respectively, χ2 = 0.01 (p = 0.9353), χ2 = 0.00 (p = 0.9864) and χ2 = 0.02 (p = 0.8847)
respectively.

31
25 In the interests of economy these results are not tabulated but are available from the authors
upon request.

32
References
Accountancy (2007). Analysis Top 60 Firms. Accountancy Magazine, available on the internet at http://www.accountancymagazine.com/Accy_Mag/Top_60_Surveys/Top60Survey2007.pdf Accessed 21.01.2011. Akbar, S., Stark, A. W. (2003). Deflators, net shareholder cash flows, dividends, capital contributions and estimated models of corporate valuation. Journal of Business Finance and
Accounting, 30(9-10), 1211-1233. Amir, E., Sougiannis, T. (1999). Analysts' interpretation and investors' valuation of tax carryforwards. Contemporary Accounting Research, 16(1), 1-34. Atwood, T. J., Reynolds, J. K. (2008). The pricing of realized tax benefits from NOL carryforwards: Effect of income statement presentation. Journal of the American Taxation
Association, 30(1), 1-27. Bauman, M. P., Shaw, K. W. (2008). The usefulness of disclosures of untaxed foreign earnings in firm valuation. Journal of the American Taxation Association, 30(2), 53-77. Belsley, D., Kuh, E., Welsch, R. E. (1980). Regression Diagnostics: Identifying Influential
Data and Sources of Collinearity. New York: John Wiley and Sons. Bernard, V. L. (1987). Cross-sectional dependence and problems in inference in market-based accounting research. Journal of Accounting Research, 25(1), 1-48. Chen, S., Chen, X., Cheng, Q., Shevlin, T. J. (2010). Are family firms more tax aggressive than non-family firms? Journal of Financial Economics, 95(1), 41-61. Chen, X., Ender, P. B., Mitchell, M., Wells, C. (2005). Stata Web Books: Regression with Stata, available on the internet at www.ats.ucla.edu/stat/stata/webbooks/reg/ Accessed 21.01.2011.
Christian Aid (2009). Christian Aid Pushes for Tax Justice in War on Poverty, available on the internet at www.christianaid.org.uk/pressoffice/pressreleases/february2009/ChristianAid-
tax-justice-campaign.aspx Accessed 21.01.2011. Cloyd, C. B., Mills, L. F., Weaver, C. D. (2003). Firm valuation effects of the expatriation of US corporations to tax-haven countries. Journal of the American Taxation Association, 25(S-1), 87-109. Conyon, M. J., Muldoon, M. R. (2006). The small world of corporate boards. Journal of
Business Finance and Accounting, 33(9 & 10), 1321-1343. Derashid, C., Zhang, H. (2003). Effective tax rates and the “industrial policy” hypothesis: Evidence from Malaysia. Journal of International Accounting, Auditing and Taxation, 12(1), 45-62.

33
Desai, M. A., Dharmapala, D. (2006). Corporate tax avoidance and high powered incentives. Journal of Financial Economics, 79(1), 145–179. Desai, M. A., Dharmapala, D. (2009). Corporate tax avoidance and firm value. The Review of
Economics and Statistics, 91(3), 537-546. Dyreng, S., Hanlon, M., Maydew, E. L. (2008). Long-run corporate tax avoidance. The
Accounting Review, 83(1), 61-82. European Union (1999) Code of conduct. Harmful Tax Competition, available on the internet at http://ec.europa.eu/taxation_customs/taxation/company_tax/harmful_tax_practices/index_en.
htm#code_conduct Accessed 21.01.2011. European Union (2004). Communication from the Commission to the Council and the European Parliament on Preventing and Combating Corporate and Financial Malpractice, available on the internet at http://ec.europa.eu/taxation_customs/resources/documents/coc_en.pdf Accessed 21.01.2011. Financial Times (2010). Treasury Condemns £42bn Tax Gap. V Houlder. September 16 2010, available on the internet at www.ft.com/cms/s/0/63255cbc-c1c5-11df-9d90-00144feab49a,s01=1.html#axzz1BTl0LUVC Accessed 21.01.2011 Firth, M., Tam, M., Tang, M. (1999). The determinants of top management pay. Omega, 27(6), 617-635. Florackis, C. (2008). Agency costs and corporate governance mechanisms: Evidence for UK firms. International Journal of Managerial Finance, 4(1), 37-59. Frank, M. M., Lynch, L. J., Rego, S. O. (2009). Tax reporting aggressiveness and its relation to aggressive financial reporting. The Accounting Review, 84(2), 467-496. Freedman, J., Loomer, G., Vella, J. (2007). Moving Beyond Avoidance? Tax Risk and the Relationship between Large Business and HMRC. Report of the Oxford University Centre for Business Taxation, available on the internet at http://denning.law.ox.ac.uk/tax/documents/Movingbeyondavoidance.pdf
Accessed 21.01.2011. Goergen, M., Renneboog, L. U. C. (2001). Strong managers and passive institutional investors in the UK. In Barca, F. and Becht, M. (Eds.) The Control of Corporate Europe (pp. 259-284). Oxford University Press. Gupta, S., Newberry, K. (1997). Determinants of the variability in corporate effective tax rates: Evidence from longitudinal data. Journal of Accounting and Public Policy, 16(1), 1-34. Hair, J. F., Black, W. C., Babin, B. J., Anderson, R. E., Tatham, R. L. (2006). Multivariate
Data Analysis, 6th ed. New Jersey: Pearson Education Inc.
34
Haniffa, R., Hudaib, M. (2006). Corporate governance structure and performance of Malaysian listed companies. Journal of Business Finance and Accounting, 33(7 and 8), 1034-1062.
Hanlon, M. (2003). What can we infer about a firm's taxable income from its financial statements? National Tax Journal, 56(4), 831-864. Hanlon, M. (2005). The persistence and pricing of earnings, accruals, and cash flows when firms have large book-tax differences. The Accounting Review, 80(1), 137-166. Hanlon, M., Slemrod, J. B. (2009). What does tax aggressiveness signal? Evidence from stock price reactions to news about tax shelter involvement. Journal of Public Economics, 93(1-2), 126-141. Hart, O. (1995). Corporate governance: Some theory and implications. The Economic
Journal, 105(430), 678-689. Hartnett, D. (2009). UK tax administration. Tax Journal. 22 June 2009, 986, 8 -10.
Healy, P. M. (1985). The effect of bonus schemes on accounting decisions. Journal of
Accounting and Economics, 7(1-3), 85-107. Henderson Global Investors. (2005). Tax, Risk and Corporate Governance. Sustainable and Responsible Investment Reports, available on the internet at http://www.henderson.com/content/sri/publications/reports/taxriskcorporategovernance.pdf Accessed 21.01.2011. HMRC. (2006). Disclosure of Tax Avoidance Schemes, available on the internet at www.hmrc.gov.uk/aiu/summary-disclosure-rules.htm Accessed 21.01.2011.
HMRC. (2007). Approach to Compliance Risk Management for Large Business, available on the internet at www.hmrc.gov.uk/budget2007/large-business-riskman.pdf Accessed 21.01.2011.
HMRC (2010). Measuring Tax Gaps 2010, available on the internet at http://www.hmrc.gov.uk/stats/measuring-tax-gaps-2010.htm.pdf Accessed 21.01.2011
HM Treasury. (2010). Written Ministerial Statement. Anti-Avoidance, available on the internet at www.hm-treasury.gov.uk/d/wms_antiavoidance_061210.pdf Accessed 21.01.2011 Holland, K. (1998). Accounting policy choice: The relationship between corporate tax burdens and company size. Journal of Business Finance and Accounting, 25(3 & 4), 265-288. Horton, J. (2008). The value relevance of 'realistic reporting': Evidence from UK life insurers. Accounting and Business Research, 37(3), 175-197. IASB. (2010). International Accounting Standard 12 “Income Taxes”, available on the internet at www.ifrs.org Accessed 21.01.2011.

35
Jensen, M. C., Meckling, W. H. (1976). Theory of the firm: Managerial behavior, agency costs and ownership structure. Journal of Financial Economics, 3(4), 305-360. Larcker, D. F., Rusticus, T. O. ( 2007). Endogeneity and Empirical Accounting Research. European Accounting Review, 16(1) 207-215 Liu, L. S., Stark, A. W. (2009). Relative performance evaluation in board cash compensation: UK empirical evidence. The British Accounting Review, 41(1), 21-30. Maydew, E. L., Shackelford, D. A. (2007). The changing role of auditors in corporate tax planning. In Auerbach, A. J., Hines, J. R. and Slemrod, J. (Eds.) Taxing Corporate Income in
the 21st Century (pp. 307-337). Cambridge University Press.
McKnight, P. J., Weir, C. (2009). Agency costs, corporate governance mechanisms and ownership structure in large UK publicly quoted companies: A panel data analysis. Quarterly
Review of Economics and Finance, 49(2), 139-156. Mills, L. F., Erickson, M., Maydew, E. L. (1998). Investment in tax planning. The Journal of
the American Taxation Association, 20(1), 1-20. National Audit Office (2007). HM Revenue and Customs: Management of Large Business
Corporation Tax, HC 614 Session 2006-2007 ed. London: Stationery Office. O'Hanlon, J., Taylor, P. (2007). The value relevance of disclosures of liabilities of equity-accounted investees: UK evidence. Accounting and Business Research, 37(4), 267-284. O'Hanlon, J. F., Pope, P. F. (1999). The value-relevance of UK dirty surplus accounting flows. The British Accounting Review, 31(4), 459-482. OECD. (1998). Harmful Tax Competition: An Emerging Global Issue, available on the internet at www.oecd.org/dataoecd/33/0/1904176.pdf Accessed 21.01.2011
OECD. (2008) Study into the Role of Tax Intermediaries, available on the internet at www.oecd.org/dataoecd/28/34/39882938.pdf Accessed 21.01.2011. OECD. (2009). Building Transparent Tax Compliance by Banks, available on the internet at www.oecd.org/ctp/ta/banks Accessed 21.01.2011 Oxfam. (2009). Tax Haven Crackdown could Deliver $120bn a Year to Fight Poverty – Oxfam, available on the internet at www.oxfam.org.uk/applications/blogs/pressoffice/?p=3912 Accessed 21.01.2011. Petersen, M. A. (2009). Estimating standard errors in finance panel data sets: Comparing approaches. Review of Financial Studies, 22(1), 435-480.
Pett, M. A., Lackey, N. R., Sullivan, J. J. (2003). Making Sense of Factor Analysis: The use
of Factor Analysis for Instrument Development in Health Care Research. London: Sage Publications.
36
Phillips, J., Pincus, M., Rego, S. O. (2003). Earnings management: New evidence based on deferred tax expense. The Accounting Review, 78(2), 491-521. Porcano, T. (1986). Corporate tax rates: Progressive, proportional, or regressive. Journal of
the American Taxation Association, 7(2), 17–31. Rees, W. P. (1997). The impact of dividends, debt and investment on valuation models. Journal of Business Finance and Accounting, 24(7 & 8), 1111-1140. Rego, S. O. (2003). Tax-avoidance activities of U.S. multinational corporations. Contemporary Accounting Research, 20(4), 805-833. Shackelford, D. A., Shevlin, T. (2001). Empirical tax research in accounting. Journal of
Accounting and Economics, 31(1-3), 321-387. Slemrod, J. (2004). The economics of corporate tax selfishness. National Tax Journal, 57(4), 877-899. Stark, A. W., Thomas, H. M. (1998). On the empirical relationship between market value and residual income in the UK. Management Accounting Research, 9(4), 445-460. Stewart, J. C. (1981). Company tax - Effective tax rates on profits. Journal of the Statistical
and Social Inquiry Society of Ireland, 24(3), 101-134. Swenson, C. (1999). Increasing stock market value by reducing effective tax rates. Tax Notes, June 7, 1503-1505. Tailby, C. (2009). Tax avoidance – then and now. Tax Journal. 22 June 2009, 986, 23 -25. The Corporate Register (various years) HS Financial Publishing. London. The Guardian. (2009). Firms' Secret Tax Avoidance Schemes Cost UK Billions: Investigation into the Complex and Confidential World of Tax. Tax Gap Reporting, available on the internet at http://www.guardian.co.uk/business/2009/feb/02/tax-gap-avoidance Accessed 21.01.2011. Trade Union Congress. (2009). The Missing Billions the UK Tax Gap (2009) Touchstone Pamphlets, available on the internet at www.tuc.org.uk/touchstone/Missingbillions/1missingbillions.pdf Accessed 21.01.2011. Weisbach, D. A. (2002). Ten truths about tax shelters. Tax Law Review, 55(2), 215-253. Wilson, R. (2009). An examination of corporate tax shelter participants. The Accounting
Review, 84(3), 969-999. Zahra, S. A., Pearce, J. A. (1989). Boards of directors and corporate financial performance: A review and integrative model. Journal of Management, 15(2), 291-334. Zimmerman, J. L. (1983). Taxes and firm size. Journal of Accounting and Economics, 5(2), 119-149.
37
Table 1: Corporate Governance Measures
Mechanism Variable Measure
Ownership structure
Director ownership (DOWN) Percentage of shares held by directors
Institutional ownership (IOWN) Percentage of shares held by substantial institutional shareholders
Board structure
Board size (BSIZE) Number of directors serving the board
Non-executive directors (NED) Percentage of non-executive directors to total number of directors on the board
Multi-directorship (MDIR) Percentage of directors who serve more than one board to total number of directors
Compensation structure
Executive salary (SAL) Total salary paid to executive directors (scaled by beginning book value of equity)
Option or bonus (BODUM) Dummy measure of option or bonus, 1 if option or bonus has been paid, 0 otherwise

38
Table 2: Factor analysis - Corporate Governance
Panel A: Matrix Characteristics
Overall KMO test statistic: 0.6115
Bartlett’s test of sphericity: χ2 = 607.680***
Matrix determinate: 0.3530
*** indicates significance at 1% level.
Panel B: Pearson Correlation Matrix and Kaiser-Meyer-Olkins statistics
n=588 DOWN IOWN BSIZE NED MDIR SAL BODUM
DOWN 0.611 IOWN -0.275*** 0.522 BSIZE -0.044 -0.146*** 0.654 NED -0.204*** 0.127*** 0.154*** 0.593 MDIR -0.295** 0.038 0.196*** 0.609*** 0.597 SAL 0.1519*** 0.009 -0.184*** -0.368*** -0.250*** 0.719 BODUM -0.330*** 0.146*** -0.071* 0.1658*** 0.119*** -0.112*** 0.6405
Individual Kaiser-Meyer-Olkins statistics are in italics on the diagonal Correlation coefficients on off-diagonal. Panel C: Rotated Factor Loadings
Items Factor 1 Factor 2
DOWN -0.344 -0.6507# IOWN -0.039 0.698# BSIZE 0.505# -0.424 NED 0.794# 0.166 MDIR 0.785# 0.126 SAL -0.631# 0.026 BODUM 0.168 0.631# # Indicates extracted items for each factor. ***, ** and * indicate significance at 1%, 2.5% and 5% levels respectively.
39
Table 3: Variables
Variable Description (expected sign) Measurement
MVE+3months Market value of equity Market value of equity
BVE Book value of equity (+) Book value of equity PBT Profit before tax (+) Profit before tax TP Tax planning (±) (STR-ETR)*PBT
TLOSS Tax losses (±) Tax loss related reconciling items TPD Permanent differences (±) Permanent difference reconciling items TTD Timing differences (±) Timing difference reconciling items STRDIF Statutory rate differential (±) UK/overseas tax differential reconciling items TUNC Unclassified items (±) Unclassified reconciling items CC Capital contribution (+) Net proceed from sales or issues of common and
preferred shares EM Earnings management (-) Profit before tax – Cash flow from operating
activities CAPINT Capital intensity (±) Gross machinery and equipment/Total assets LEV Leverage (+) Long term debt/Total assets DIV Dividend (+) Dividends Per Share/Earnings Per Share*100 FS Foreign sale (±) Percentage of foreign sales over total net sales NED Corporate governance I (+) Proportion of non-executive directors on the board
of company IOWN Corporate governance II (+) Percentage Institutional ownership INDDUM Industry dummy (±) Coded 1 for each particular industry classification, 0
otherwise

40
Table 4: Sample Selection Process
Details Number of Observations
Number of Companies
Public listed companies (listed throughout the period) 1006
Finance companies (580)
Not available in Datastream (32)
At least one year of annual report is not available (59)
Accounting period of more than 12 months (4)
Insufficient effective tax rate reconciliation data (29)
Negative book value of equity (24)
“Zero” sales (1)
Extreme value of effective tax rates (ETR>1) (19)
774 258
Negative profit before tax (76)
Negative tax charge (22)
Unbalance data (88)
Initial sample 588
196

41
Table 5: Descriptive Statistics
Mean n=444
Min Max Standard deviation
Mean n=405
Min Max Standard deviation
MVE-3 (£m) 2,149.390 6.650 40,034.070 5,533.618 2,268.608 6.650 40,034.070 5,773.970 BVE (£m) 712.354 8.756 13,700.000 1,546.922 753.063 8.756 13,700.000 1,610.579 PBT (£m) 181.467 0.434 5,146.555 507.634 192.998 0.434 5,146.555 529.590 TP (£m) 7.465 -237.300 331.700 36.837 7.377 -237.300 331.700 38.407 ETR 0.271 0.000 0.927 0.126 0.278 0.000 0.927 0.127 CC (£m) 12.197 -140.000 805.000 57.190 12.248 -140.000 805.000 57.810 EM (£m) 1.584 -1,333.000 1,133.631 148.190 4.329 -13,333.000 1,133.631 153.652 MVE+3/BVEt-1 3.402 0.590 18.950 2.171 3.175 0.590 1.913 18.950 BVEt/BVEt-1 1.152 0.213 7.058 0.377 1.132 0.213 2.553 0.246 PBTt/BVEt-1 0.264 0.014 1.430 0.165 0.258 0.014 1.430 0.154 TPt/BVEt-1 0.009 -0.105 0.165 0.027 0.007 -0.178 0.134 0.028 CCt/BVEt-1 0.038 -0.322 2.416 0.165 0.034 -0.322 1.224 0.125 EMt/BVEt-1 -0.012 -0.653 0.567 0.168 -0.003 -0.580 0.567 0.154 DIV 0.037 0 0.976 0.226 0.377 0.000 0.976 0.232 CAPINT 0.209 0.001 1.475 0.270 0.213 0.001 1.475 0.278 LEV 0.155 0.001 0.644 0.155 0.149 0.001 0.644 0.140 FS (%) 37.864 0 112.913 33.940 37.824 0 112.913 33.797 BSIZE 8.312 4 16 2.249 8.346 4 16.000 2.188 NED 56.759 0 88.889 13.174 56.706 0 88.889 13.527 DOWN 6.642 0 60.451 13.176 6.741 0 60.451 13.427 IOWN 33.540 0 92.400 17.618 32.985 0 77.940 17.120 MDIR 49.103 0 100.000 23.729 48.659 0 100.000 23.577 SAL (£m) 0.988 0.086 4.303 0.605 0.977 0.086 3.894 0.537 SALt/BVEt-1 0.008 0.001 0.061 0.010 0.008 0.001 0.061 0.009 TLOSS (£m) 0.773 -28.000 140.000 9.035 TPD (£m) -0.361 -135.000 211.524 18.490 TTD (£m) 2.539 -22.000 151.000 12.040 STRDIF (£m) 1.143 -28.526 141.728 10.915 TUNC (£m) 1.019 -32.375 72.000 6.218 TLOSSt/BVEt-1 0.000 -0.066 0.040 0.009 TPDt/BVEt-1 -0.003 -0.098 0.047 0.013 TTDt/BVEt-1 0.004 -0.052 0.076 0.012 STRDIF t/BVEt- 0.000 -0.048 0.028 0.008
TUNCt/BVEt-1 0.001 -0.063 0.051 0.007

42
Table 6: Regression estimations –Models I, II, III and IV
Dependent variable: MVEt+3months
Model I Model II Model III Model 1 “High” governance
Model 1 “Low” governance
Model IV
BE 1.0814 4.53***
1.1167 4.68***
1.1286 4.83***
1.2592 3.88***
0.6055 1.47
0.7167 2.55***
PBT 10.0106 17.00***
10.0020 16.79***
10.0312 16.87***
9.8773 16.12***
10.7235 10.92***
9.5480 14.14***
TP -9.1967 -2.91***
-9.5925 -3.03***
2.9235 0.30
-8.0161 -1.76*
-8.8816 -2.03**
TLOSS -1.7713 -0.31
TPD -12.3547 -1.96**
TTD 7.0694 1.47
STRDIF 5.6768 0.69
TUNC
-5.8766 -0.54
NED 0.0080 1.48
0.0096 1.74*
0.0075
1.44
IOWN -0.0074 -1.89*
-0.0070 -1.66*
-0.0083 -2.10*
TP*NED -0.1681 -1.07
TP*IOWN -0.0817 -0.56
CC 0.1831 0.38
0.1048 0.22
0.0731 0.16
-0.0238 -0.03
0.4513 0.89
0.3319 0.71
EM -2.8076 -6.42***
-2.7992 -6.31***
-2.7651 -6.19***
-0.9329 -5.15***
-2.9649 -4.88***
-2.5750 -5.46***
CAPINT -0.5308 -2.96***
-0.5163 -2.96***
-0.5175 -2.95***
-0.3598 -1.69*
-0.7671 -2.22*
-0.4714 -2.44***
LEV -0.2923 -0.65
-0.4862 -1.09
-0.4577 -1.01
0.0247 0.04
-1.0018 -1.62
-0.2551 -0.61
DIV -0.0003 -0.14
-0.0002 -0.13
-0.0003 -0.17
-0.0006 -0.22
-0.0007 -0.23
0.0026 1.51
FS 0.0061 3.01***
0.0058 2.84***
0.0057 2.78***
0.0017 0.62
0.0096 3.48***
0.0059 2.96***
Cons -0.1615 -0.45
-0.3715 -0.81
-0.4879 -1.05
-0.0878 -0.19
0.2259 0.36
-0.1855 -0.41
R-squared 63.39% 64.34% 64.70% 61.17% 71.66% 58.84%
N 444 444 444 222 222 405
Wald 563.77 (16) *** 562.08 (18) ***
509.13 (20) *** 838.15 (16) ***
465.98 (16) *** 363.70 (22) ***
Breusch-Pagan 82.98 (16) *** 83.95 (18) ***
84.70 (20) *** 34.63 (16) ***
55.13 (16) *** 77.60 (22) ***
1. Figures in italics represent cross-section clustered Eicker-Huber-White adjusted t-statistics. 2. ***, ** and * indicate significance at 1%, 2.5% and 10% respectively (single or two tailed respectively). 3. Industry dummy coefficients not reported in interests of economy.
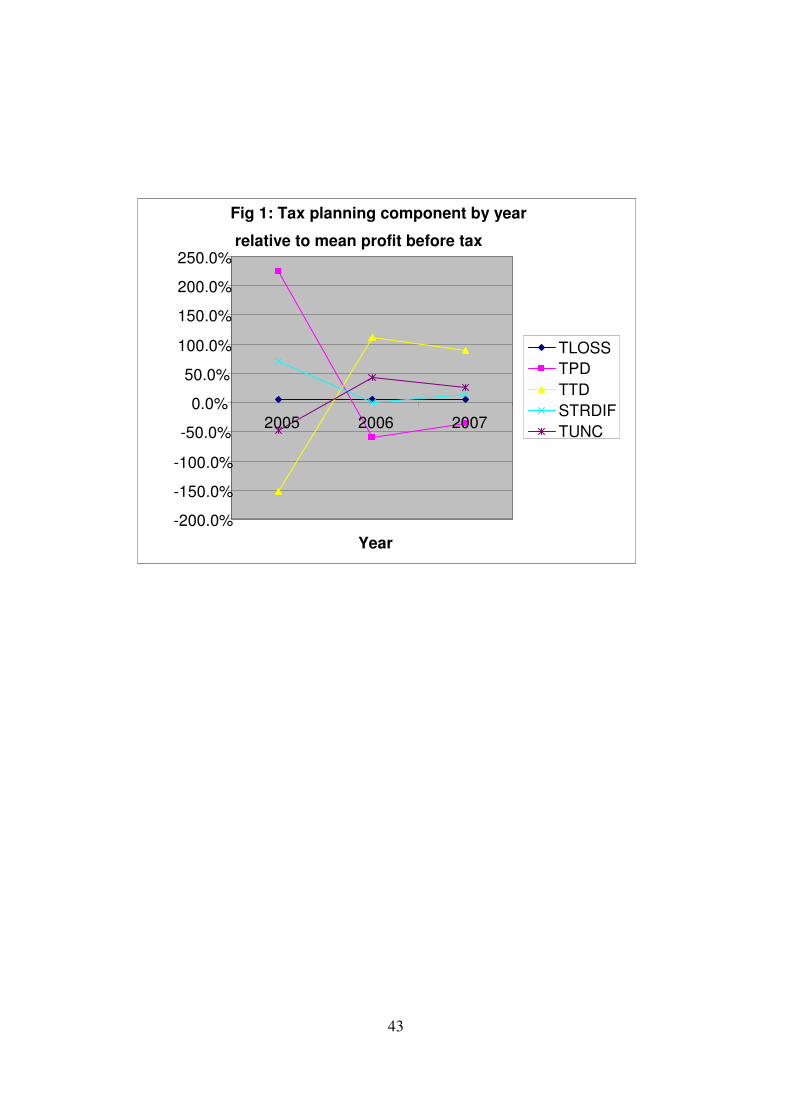
43
Fig 1: Tax planning component by year
relative to mean profit before tax
-200.0%
-150.0%
-100.0%
-50.0%
0.0%
50.0%
100.0%
150.0%
200.0%
250.0%
2005 2006 2007
Year
TLOSS
TPD
TTD
STRDIF
TUNC