Chapter 2 Science, Systems, Matter, and Energy Matter High-Q Energy Low-Q Energy.
Upload
rolf-bryanCategory
view
213download
0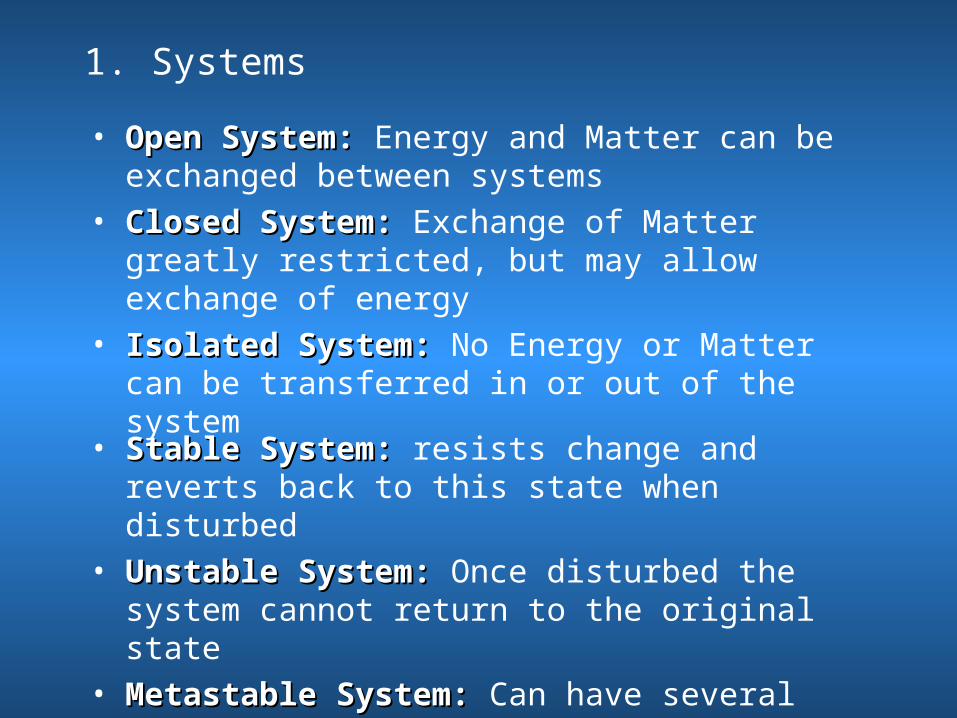
1. Systems
• Open System:Open System: Energy and Matter can be exchanged between systems
• Closed System:Closed System: Exchange of Matter greatly restricted, but may allow exchange of energy
• Isolated System:Isolated System: No Energy or Matter can be transferred in or out of the system
• Stable System:Stable System: resists change and reverts back to this state when disturbed
• Unstable System:Unstable System: Once disturbed the system cannot return to the original state
• Metastable System:Metastable System: Can have several stable states.

2. Feedback
• Processes in one system influences processes in another interconnected system by exchange of matter and energy. The exchange is called feedback.
• Positive Feedback:Positive Feedback: Change in one system causes similar change in the other system. Can cause runaway instability
• Negative FeedbackNegative Feedback means a positive change in one system causes a negative change in the other
Changing CO2 induces positive water vapor feedback
Changing CO2 induces positive albedo feedback

3. Low frequency climate variability:
sub-seasonal variation, seasonal variation, annual variation, and interannual variation.
4. Walker circulation
The Walker Circulation refers to an east-west circulation of the atmosphere above the tropical ocean in the zonal and vertical directions, with air rising above warmer ocean regions (normally in the west), and descending over the cooler ocean areas (normally in the east). Its strength fluctuates with the change in sea surface temperature.
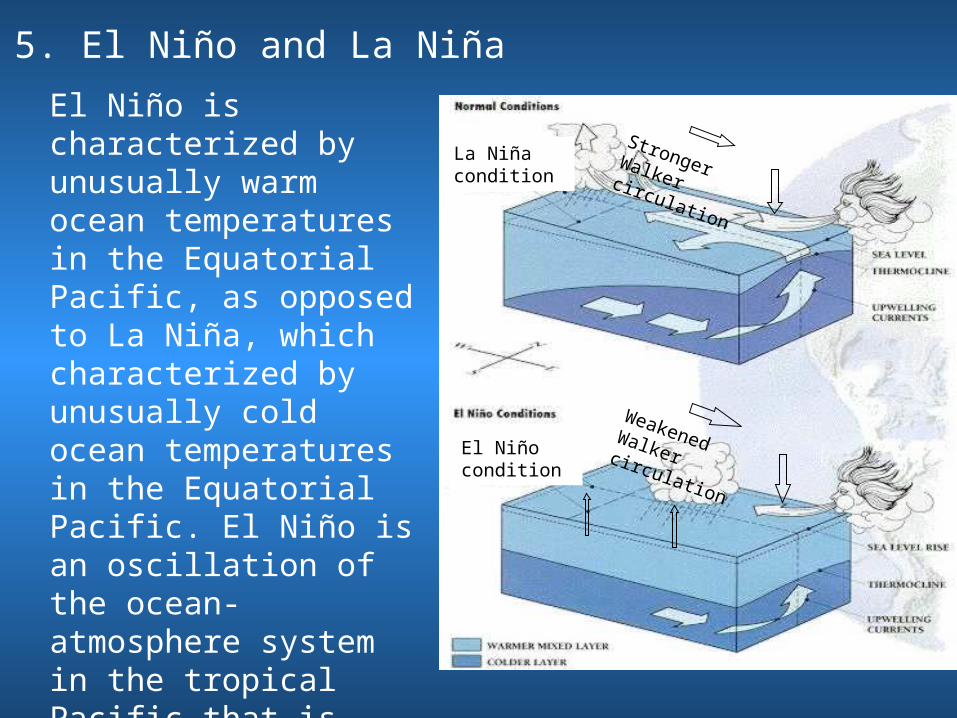
5. El Niño and La Niña
El Niño is characterized by unusually warm ocean temperatures in the Equatorial Pacific, as opposed to La Niña, which characterized by unusually cold ocean temperatures in the Equatorial Pacific. El Niño is an oscillation of the ocean-atmosphere system in the tropical Pacific that is closely related to the change in the Walker circulation and has important consequences for weather and climate around the globe.
Stronger Walker circulation
Weakened Walker
circulationEl Niño condition
La Niña condition

TahitiDarwin
1958-1998
6. Southern Oscillation
The Southern Oscillation is the atmospheric component of El Niño/ La Nina. This component is an oscillation in surface air pressure between the tropical eastern Pacific and the western Pacific Ocean waters.
El Niño/La Niña-Southern Oscillation (ENSO)

Teleconnections via atmospheric Rossby waves
7. Impact of ENSO on Global Climate
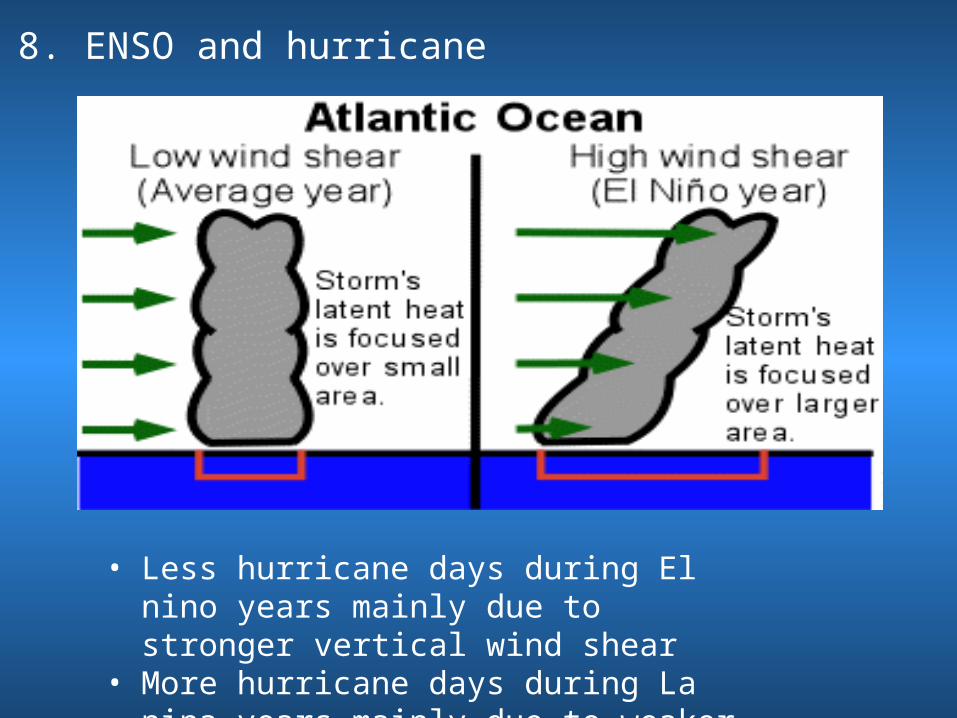
8. ENSO and hurricane
• Less hurricane days during El nino years mainly due to stronger vertical wind shear
• More hurricane days during La nina years mainly due to weaker vertical wind shear.
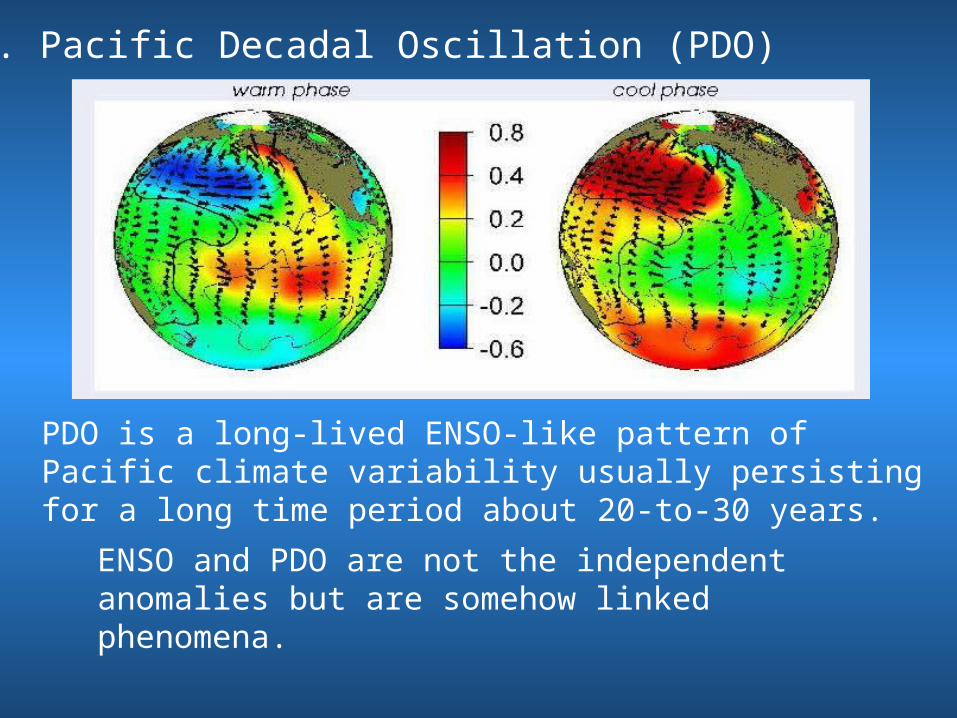
PDO is a long-lived ENSO-like pattern of Pacific climate variability usually persisting for a long time period about 20-to-30 years.
9. Pacific Decadal Oscillation (PDO)
ENSO and PDO are not the independent anomalies but are somehow linked phenomena.

10. Some extreme climate anomalies
(a) A decade of western North American drought could be related to both human activities and natural climate anomalies, such as ENSO.
(b) A possible cause for the 2003 European heat wave is the polarwaord migration of polar jets in a warm climate.
(c) The vanishing snow of Kilimanjaro may be due to the fact that the maximum warming occurs in the mid troposphere over the Equator.

11. Challenges of numerical simulation of climate
Insufficient observations – leading to inaccurate initial conditions;
Chaotic nature of the atmospheric and oceanic system;
Inherent deficiency of numerical models with limited resolution that fails to resolve sub-grid physical processes.
Data assimilation;Ensemble forecast;Parameterization.
Our answers to face the challenges:
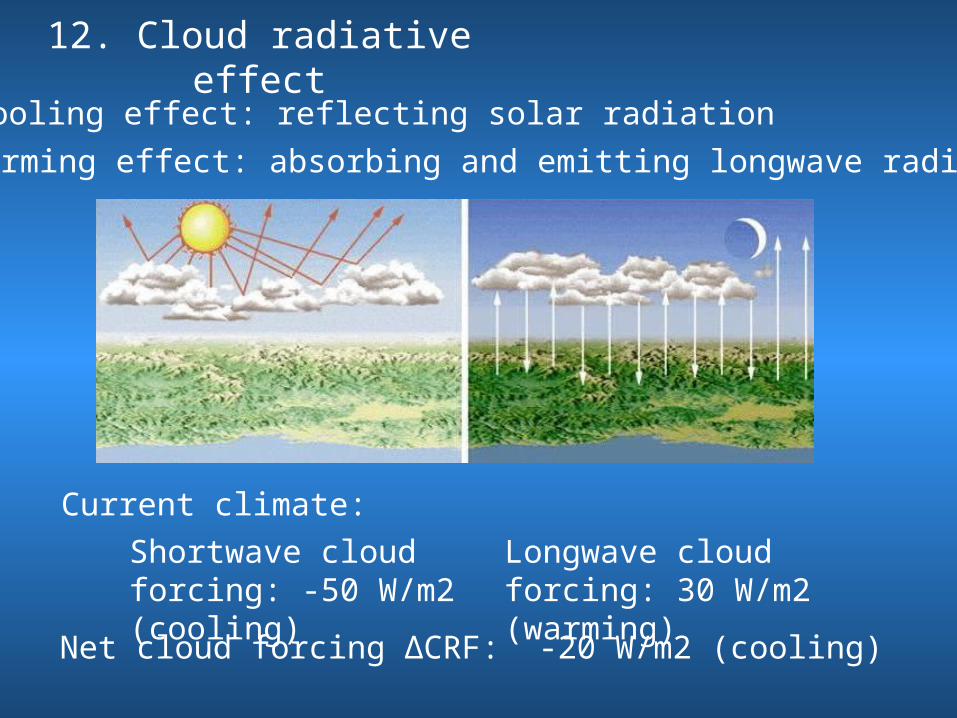
12. Cloud radiative effect
Cooling effect: reflecting solar radiation
Warming effect: absorbing and emitting longwave radiation
Shortwave cloud forcing: -50 W/m2 (cooling)
Longwave cloud forcing: 30 W/m2 (warming)
Net cloud forcing ΔCRF: -20 W/m2 (cooling)
Current climate:
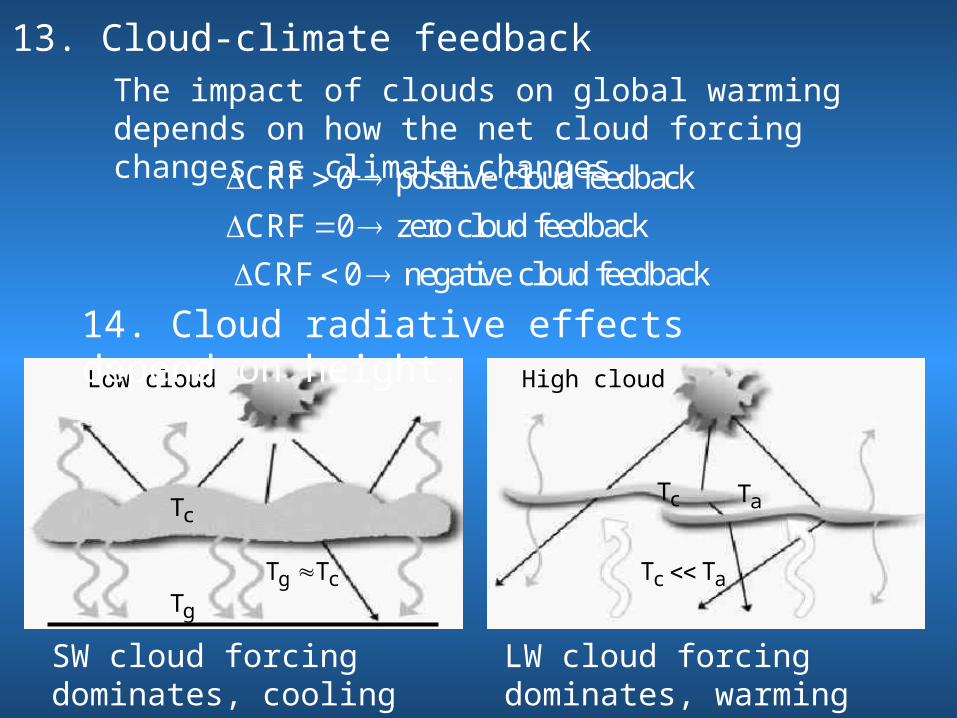
13. Cloud-climate feedback
feedback cloud negative 0 CRF
feedback cloud zero 0 CRF
feedback cloud positive 0 CRF
The impact of clouds on global warming depends on how the net cloud forcing changes as climate changes.
gT
cT
cg TT
cT aT
ac TT
Low cloud High cloud
SW cloud forcing dominates, cooling effect
LW cloud forcing dominates, warming effect
14. Cloud radiative effects depend on height.
15. In general circulation models (GCMs), clouds are the sub-grid scale processes and are not resolved. They are represented parametrically in models. The cloud-climate feedback is one of the largest uncertainties in climate simulations.
16. Cloud formation
Two processes, acting together or individually, can lead to air becoming saturated: cooling the air or adding water vapor to the air. But without cloud nuclei, clouds would not form.
17. PrecipitationCloud droplets need to grow up to a certain size in order to fall to the surface due to gravity
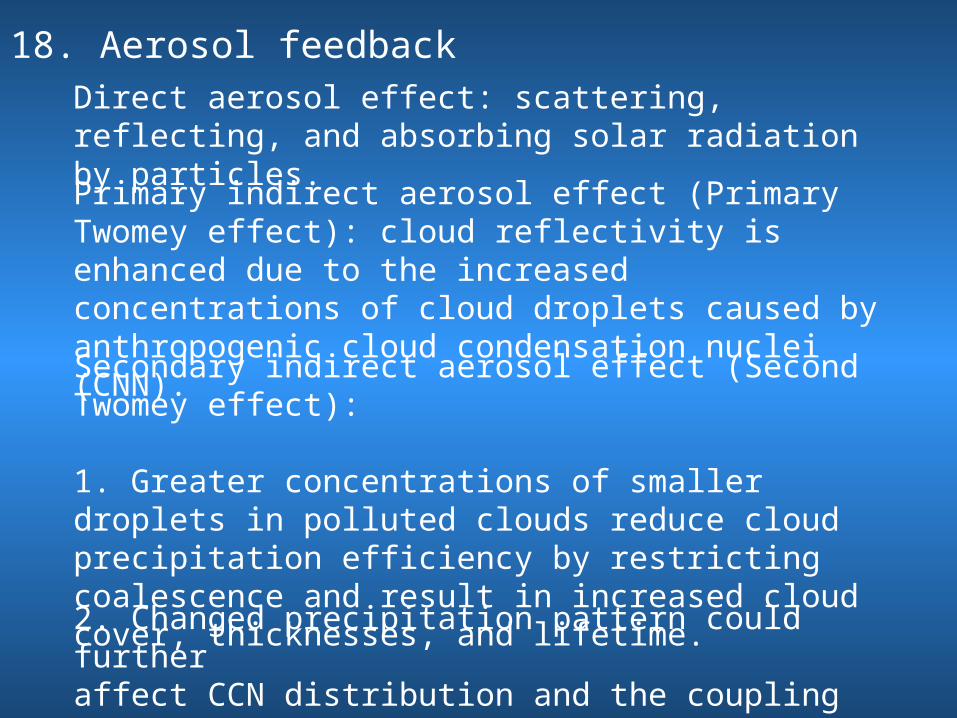
18. Aerosol feedbackDirect aerosol effect: scattering, reflecting, and absorbing solar radiation by particles.
Primary indirect aerosol effect (Primary Twomey effect): cloud reflectivity is enhanced due to the increased concentrations of cloud droplets caused by anthropogenic cloud condensation nuclei (CNN).
Secondary indirect aerosol effect (Second Twomey effect):
1. Greater concentrations of smaller droplets in polluted clouds reduce cloud precipitation efficiency by restricting coalescence and result in increased cloud cover, thicknesses, and lifetime.
2. Changed precipitation pattern could further affect CCN distribution and the coupling between diabatic processes and cloud dynamics.

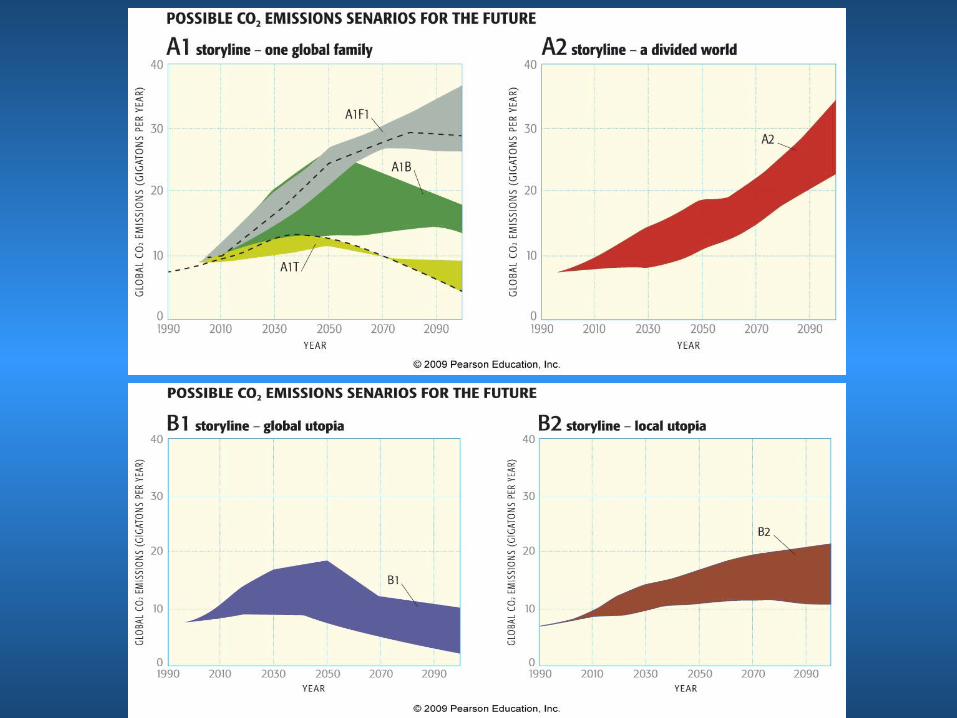
19. Climate Scenarios and Emissions Scenarios
What is a scenario?
• Image of future• Neither forecast nor prediction• Each scenario is one possible future• Useful tool for not fully understood complex systems, whose
prediction is impossible• Emission scenario ≠ climate scenario
1. Population prospects2. Economic development3. Energy intensities and demand, structure of its use4. Resource availability5. Technological change6. Prospects for future energy systems7. Land-use changes
Main driving forces of future emissions:

20. Storylines of scenariosA1: • Rapid economic growth.
• Peak population mid-21st century, then, declining.• Rapid introduction of new and more efficient technologies.• Substantial reduction of regional difference in per-capita income.
A2: • Regional solutions to environmental and social equity issues.• Continuously rising world population.• Slow per-capita income growth technological development
B1: • Rapid changes in economic structures.• Peak population mid-21st century, then, declining, as in A1.• Reduction in intensity of demand for materials.• Introduction of clean and resource efficient technologies.• Global solutions to environmental and social equity issues.
B2: • Intermediate economic development.• Moderate population growth.• Less rapid and more diverse technological change than in the B1 and A1.• Regional solutions to environmental and social equity issues.
A1FI: Fossil fuel intensiveA1B: Balanced emphasis on all energy sourcesA1T: Non-fossil fuel intensive
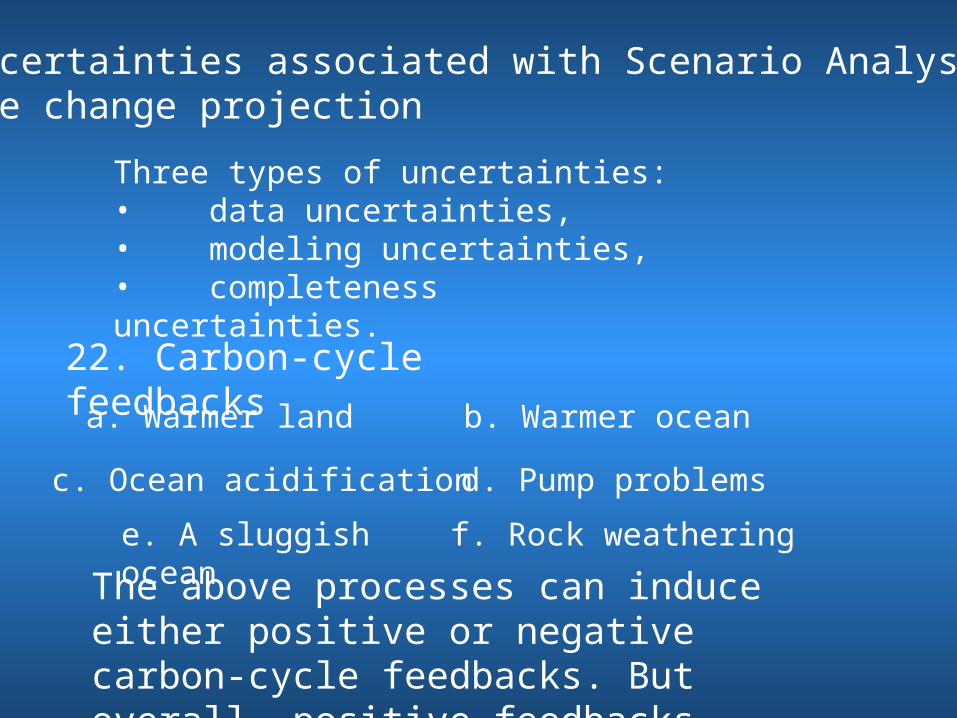
21. Uncertainties associated with Scenario Analysis and climate change projection
Three types of uncertainties: • data uncertainties, • modeling uncertainties, • completeness uncertainties.
22. Carbon-cycle feedbacks
a. Warmer land b. Warmer ocean
c. Ocean acidification d. Pump problems
e. A sluggish ocean f. Rock weathering
The above processes can induce either positive or negative carbon-cycle feedbacks. But overall, positive feedbacks prevail!

23. Stabilizing atmospheric CO2 level
a. The lower the stabilization target, the sooner peak emission of CO2 must occur, or we must cut back on fossil-fuel use, e.g., to stabilize CO2 level at 450 ppm, we would reach peak usage before 2020.b. Lower stabilization levels can be achieved only with lower peak emission.
c. All stabilization targets require sharp reductions in CO2 emission after the peak. Low stabilization targets require that the emission rates fall below the current rates within a few decades.
24. Changes in the Oceans due to global warming
Melting glaciers
Changes in deep-ocean circulation (slowing down)
Warmer surface waters
25. Polar Ice Melting
Loss of ice = enhanced warming due to lower albedo
Arctic ice melting affects polar bear survival.
Food sources are dwindling for Arctic dwellers.
Sea level rise
26. Ocean acidity increaseSome atmospheric carbon dioxide dissolves in ocean
water. ----- Acidifies ocean
CoccolithophoresForaminifersSea urchinsCorals
Organisms threatened by Increased Marine Acidity
27. Rising Sea Level – already occurring Main contributors:– Melting of Antarctic and Greenland ice sheets (most
important)– Thermal expansion of ocean surface waters– Melting of land glaciers and ice caps– Thermal expansion of deep-ocean waters