1 Supply Chain Disruptions and Shareholder Value Kevin Hendricks Richard Ivey School of Business...
48
1 Supply Chain Disruptions and Shareholder Value Kevin Hendricks Richard Ivey School of Business Ontario, Canada Vinod R. Singhal DuPree College of Management Georgia Institute of Technology Atlanta, GA, 30332 February 2005
-
Upload
iris-allison -
Category
Documents
-
view
216 -
download
0
Transcript of 1 Supply Chain Disruptions and Shareholder Value Kevin Hendricks Richard Ivey School of Business...

1
Supply Chain Disruptions and ShareholderValue
Kevin HendricksRichard Ivey School of Business
Ontario, Canada
Vinod R. SinghalDuPree College of ManagementGeorgia Institute of Technology
Atlanta, GA, 30332
February 2005

2
• Without facts you are just another person with an opinion
unless
you are at a level of the organization where your opinion becomes fact
• When research is limited or absent, anecdotes prevail
Some thoughts

3
•Comparison of supply chain’s linkage to financial performance of 600 global companies over two different time period
•Supply chain performance classified into four groups based on
- Inventory turns- Return on assets- Cost of good sold/sales (1- gross margin)
•Financial performance - Industry adjusted shareholder return grouped into four groups
Accenture study (with INSEAD and Stanford)
4
•Shareholder Value = Create - Destroy
•Poor supply chain performance destroys shareholder value
•Practices that prevent poor supply chain performance create value by avoiding value destruction
Supply chains and shareholder value

5
•Effect of disruptions on shareholder value
•Effect of disruptions on profitability – growth in operating income, sales, cost, assets, and inventory
•Effect of disruptions on risk – share price
volatility
Issues examined

6
• Sample
• Measurement time period
• Methods to estimate the impact of disruption on performance
• Statistical tests
• Results
• Implications
Approach

7
• 800+ announcements of supply chain disruptions (production or shipment delays) from Wall Street Journal and Dow Jones News
Sun Microsystems delays shipments of workstations and servers, Dow Jones News Service, December, 14, 2000.
Sony Sees Shortage of Playstation 2s for Holiday Season”, The Wall Street Journal, September 28, 2000.
Boeing pushing for record production, finds parts shortages, delivery delays, Wall Street Journal, June 26, 1997.
Hershey will miss earnings estimate by as much as 10% because of problems in delivering order, Wall Street Journal, September 14, 1999.
Sample
8
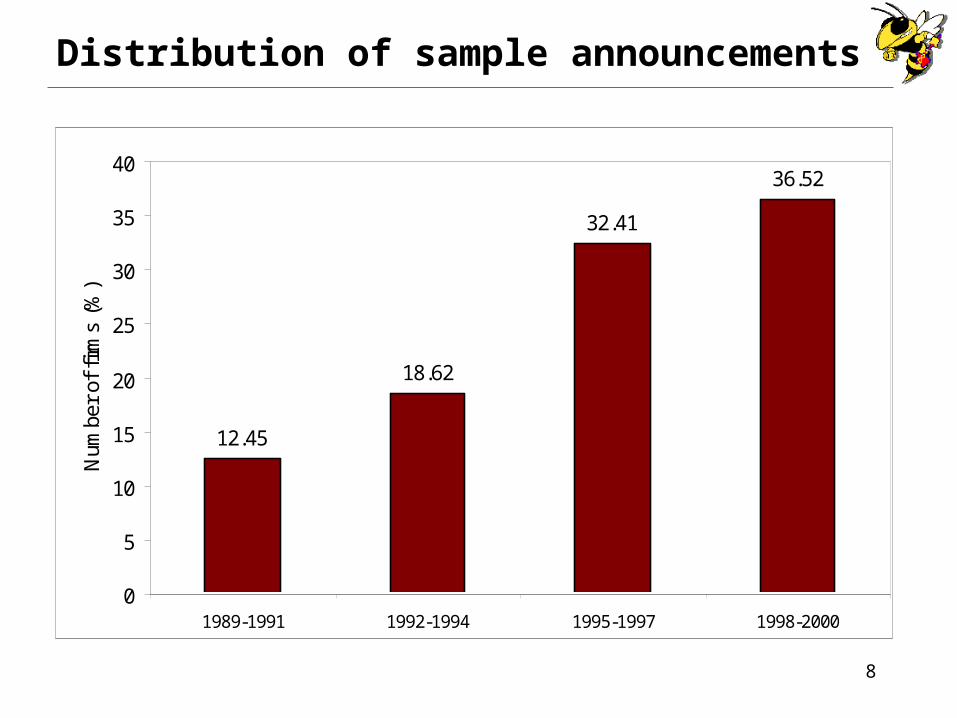
Distribution of sample announcements
12.45
18.62
32.41
36.52
0
5
10
15
20
25
30
35
40
1989-1991 1992-1994 1995-1997 1998-2000
Num
ber
of f
irms
(%)
9
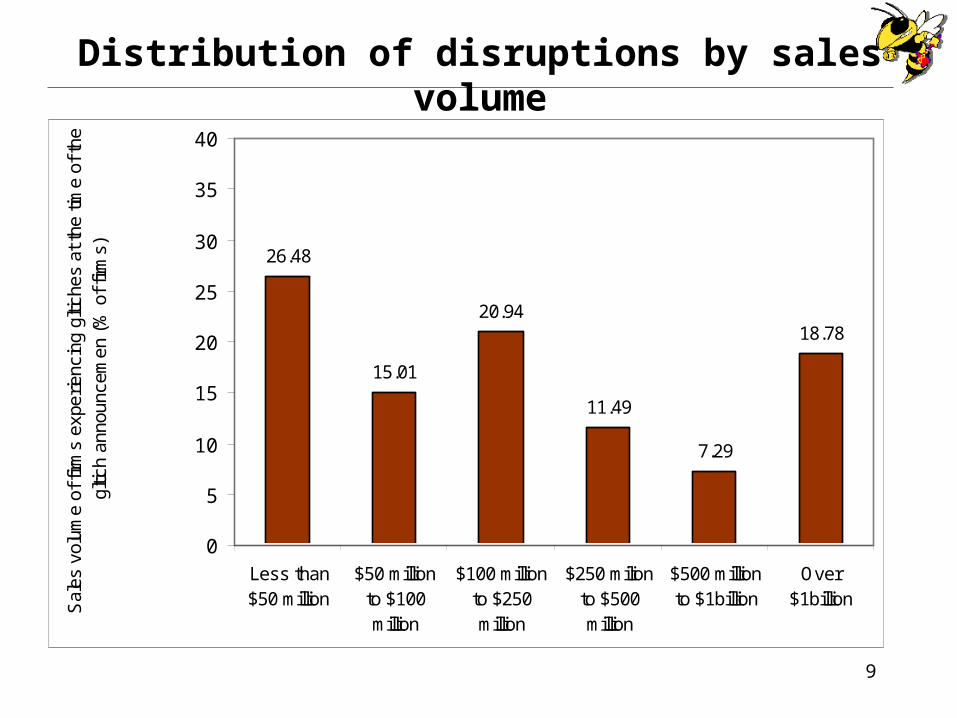
Distribution of disruptions by sales volume
26.48
15.01
20.94
11.49
7.29
18.78
0
5
10
15
20
25
30
35
40
Less than$50 million
$50 millionto $100million
$100 millionto $250million
$250 milionto $500million
$500 millionto $1billion
Over$1billion
Sal
es v
olum
e of
firm
s ex
perie
ncin
g gl
tiche
s at
the
time
of th
e gl
tich
anno
unce
men
(%
of f
irms)

10
Responsibility for disruptions
33.61
12.8114.51
3.816.05
29.38
0
5
10
15
20
25
30
35
40
Internal Customer Supplier Nature andgovernment
Othercombinations
Noneprovided
% o
f Fir
ms

11
Reasons for disruptions
21.64
8.94 8.823 8.46
4.11 3.26
29.38
0
5
10
15
20
25
30
35
Partshortages
Ramp/roll-out problems
Orderchanges bycustomers
Productionproblems
Developmentproblems
Qualityproblems
Noneprovided
Num
ber
of f
irms
(%)
12
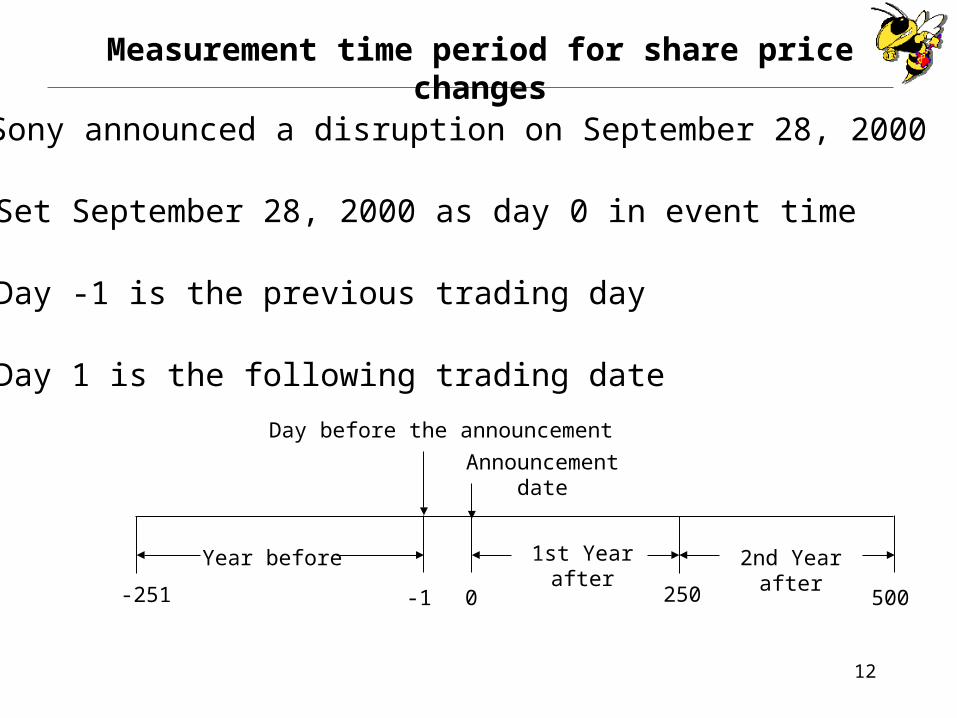
Measurement time period for share price changes
Day before the announcement
-251
1st Year after
Announcement date
2500-1
Year before 2nd Year after
500
• Sony announced a disruption on September 28, 2000
• Set September 28, 2000 as day 0 in event time
• Day -1 is the previous trading day
• Day 1 is the following trading date
13
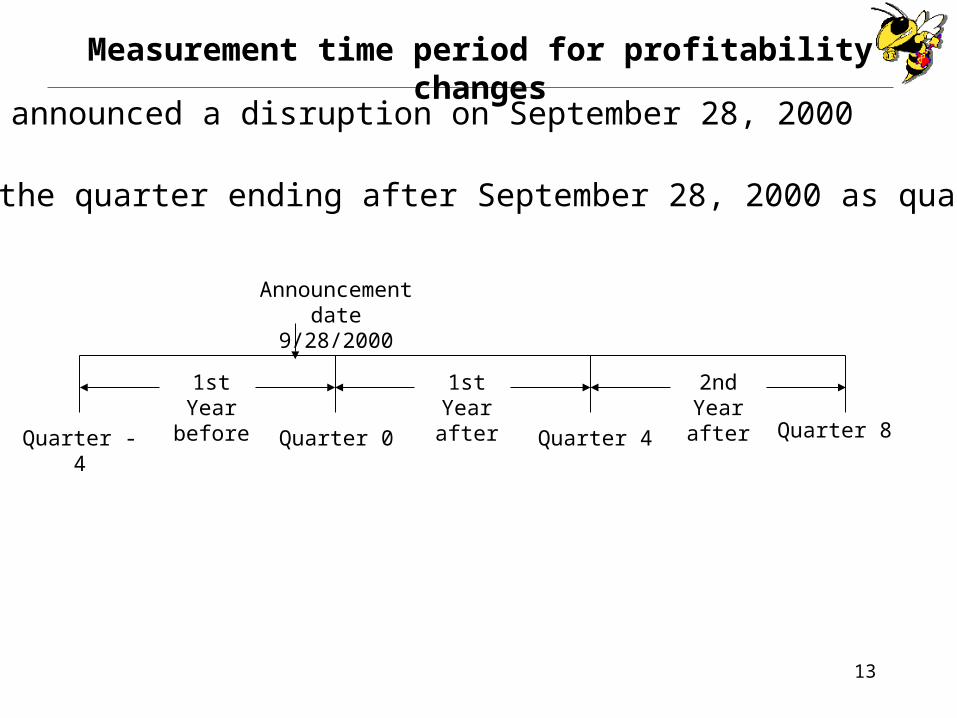
Measurement time period for profitability changes
Announcement date 9/28/2000
Quarter 0
1st Year before
Quarter -4
2nd Year after
1st Year after
Quarter 8Quarter 4
• Sony announced a disruption on September 28, 2000
• Set the quarter ending after September 28, 2000 as quarter 0

14
Measurement time period for share price volatility changes
Announcement date
-509
1st Year after
2nd Year after
2600-10 51010
1st Year before
2nd Year before
-260
• Sony announced a disruption on September 28, 2000
• Set September 28, 2000 as day 0 in event time

15
• Compare performance of disruption experiencing firms with portfolios of similar type of firms
- Size (created 14 portfolio)- Book to market value (subdivided each of the 14 into 5 )- Prior performance (subdivided each of the 70 into 3)
• 210 portfolios of firms
• Simulated 1000 benchmark portfolios
• Used the simulated distribution to test statistical significance
Estimating stock price performance implications

16
• One to one matching
- Closest in size- Closest in performance- Closest in SIC match
• Estimate the difference in stock price performance between the sample firm and its benchmark
• Estimate the difference in change in volatility of the sample firm and its benchmark
Estimating stock price performance and risk implications
17
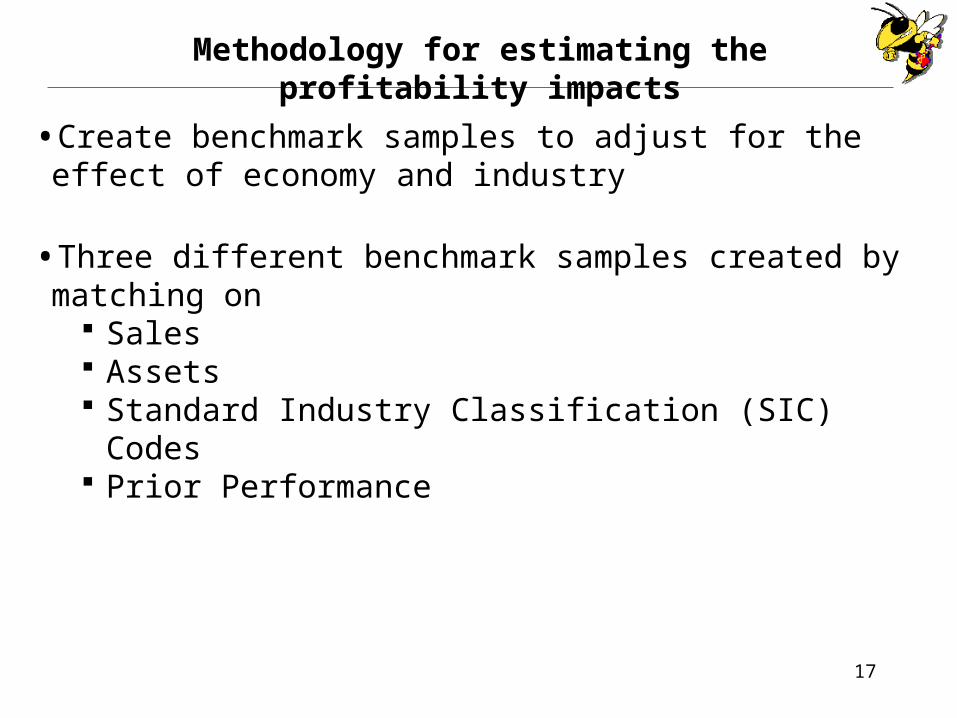
Methodology for estimating the profitability impacts
•Create benchmark samples to adjust for the effect of economy and industry
•Three different benchmark samples created by matching on Sales Assets Standard Industry Classification (SIC) Codes Prior Performance

18
Average stock returns on disruption announcements
-7.18 -7.17-6.81
-7.81
-10
-8
-6
-4
-2
0
Portfolio Matched Size MatchedPerformance
Matched Industry Matched
Ave
rage
sha
reho
lder
ret
urn
(%)

19
Comparison with stock market reaction to other corporate events
Financial events
Stock splits 3.3%
Open market share repurchase 3.5%Proxy contest
4.2%Increasing financial leverage
7.6%Decreasing financial leverage -5.4%
Seasoned equity offerings -3.0%
Marketing events
Change in firm name0.7%
Brand leveraging 0.3%Celebrity endorsement
0.2%New product introduction0.7%
Affirmative action awards 1.6%Delay introduction of new -5.3% products
Information technology events
IT Investments1.0%
B2C e-commerce10.5%
B2B e-commerce 3.3%
IT problems -1.7%
Operational events
Increase in capital expenditure 1.0%Increase in R&D expenditure
1.4%Effective TQM implementation 0.7%
Internal corporate restructuring 1.0% Decrease in capital expenditure -1.8% Plant closing
-0.7%
20
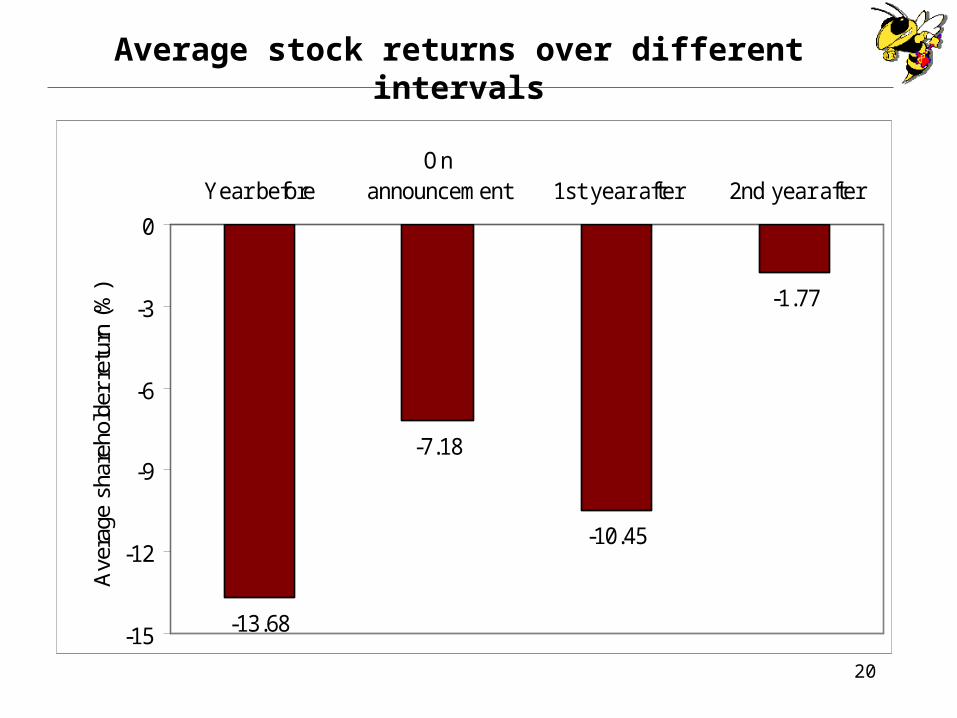
Average stock returns over different intervals
-13.68
-7.18
-10.45
-1.77
-15
-12
-9
-6
-3
0
Year beforeOn
announcement 1st year after 2nd year after
Ave
rage
sha
reho
lder
ret
urn
(%)

21
Average stock returns over three years
-40.66
-34.77-32.21
-38.40
-50
-40
-30
-20
-10
0
Portfolio Matched Size MatchedPerformance
Matched Industry Matched
Ave
rage
sha
reho
lder
ret
urn
(%)

22
Year to year changes in equity volatility
-1.74
13.5
2.82
15.16
-5
0
5
10
15
20
Two years beforeto one year
before
One year beforeto one year after
One year after totwo years after
Two years beforeto two years after
% C
hang
e in
equ
ity r
isk
(sta
ndar
d de
viat
ion)
23
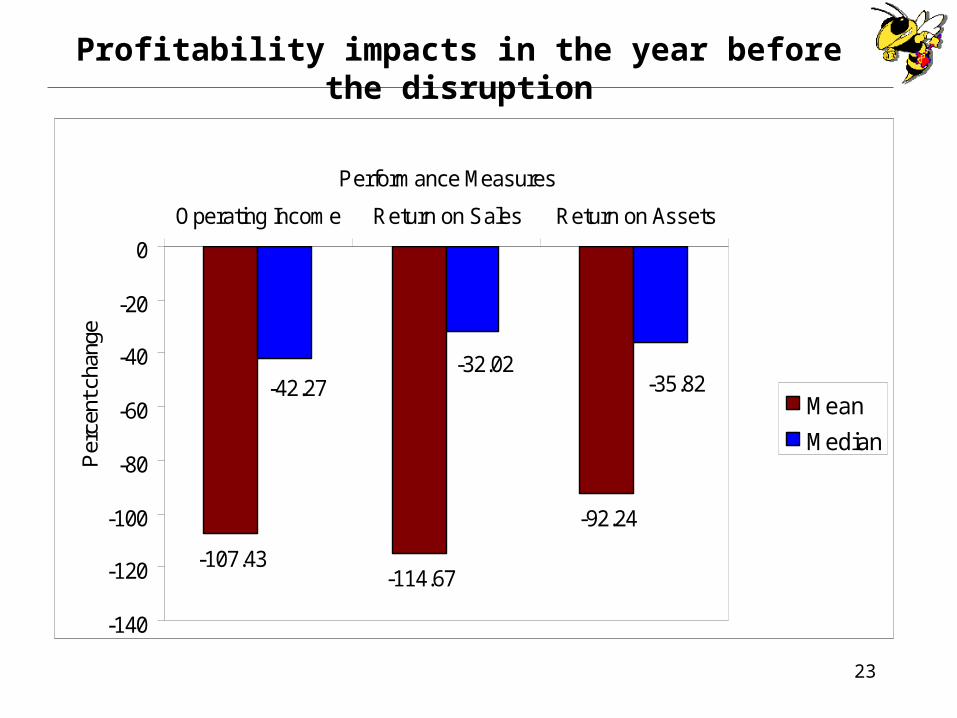
Profitability impacts in the year before the disruption
-107.43-114.67
-92.24
-42.27-32.02
-35.82
-140
-120
-100
-80
-60
-40
-20
0
Operating Income Return on Sales Return on Assets
Performance Measures
Per
cent
cha
nge
Mean
Median

24
Profitability impacts in the year before the disruption
13.88
9.59
6.08
10.66
-6.92
3.064.29
-2.84
-20
-15
-10
-5
0
5
10
15
20
Sales Cost Assets Inventory
Per
cent
cha
nge
Mean
Median
25
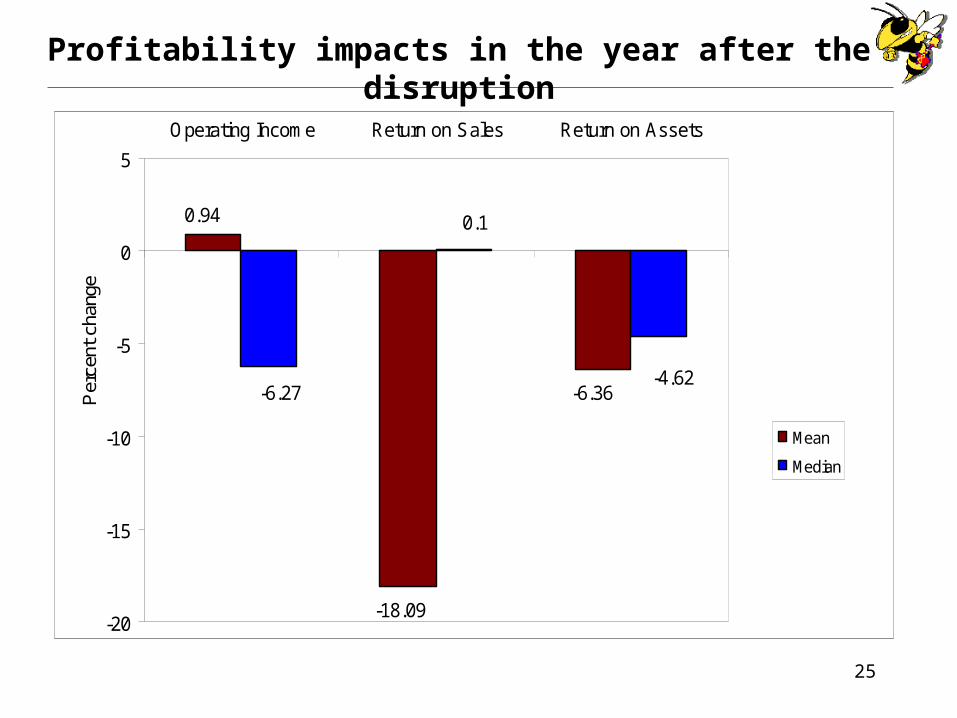
Profitability impacts in the year after the disruption
-6.36
-18.09
0.94
-4.62
0.1
-6.27
-20
-15
-10
-5
0
5
Operating Income Return on Sales Return on Assets
Per
cent
cha
nge
Mean
Median

26
Profitability impacts in the 2nd year after the disruption
-25.44
-36.19
-23.09
-6.58
-3.49
-8.32
-40
-35
-30
-25
-20
-15
-10
-5
0
5
Operating Income Return on Sales Return on Assets
Per
cent
cha
nge
Mean
Median
27
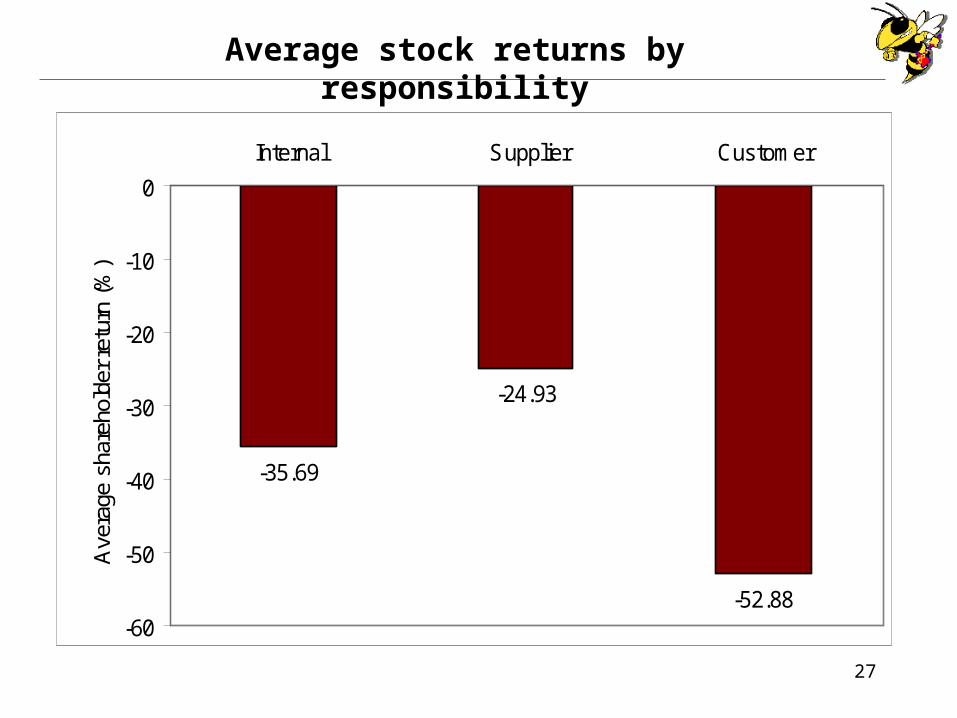
Average stock returns by responsibility
-35.69
-24.93
-52.88-60
-50
-40
-30
-20
-10
0
Internal Supplier Customer
Ave
rage
sha
reho
lder
ret
urn
(%)

28
Average stock returns by reason
-25.48
-52.79
-46.59
-41.67
-60
-50
-40
-30
-20
-10
0
Part shortagesRamp/roll-out
problemsOrder changesby customers
Productionproblems
Ave
rage
sha
reho
lder
ret
urn
(%)

29
Average stock returns by size
-47.05
-64.28
-46.68
-32.35
-19.61
-70
-60
-50
-40
-30
-20
-10
0
Ist quintile(smallest) 2nd quintile 3rd quintile 4th quintile
5th quintile(largest)
Ave
rage
sha
reho
lder
ret
urn
(%)

30
• Disruptions cause significant destruction in corporate performance
• It does not matter who or what caused the disruption – you still pay
• Small firms suffer more from disruptions
• Market always took a dim view of supply chain disruptions
• Firms do not quickly recover from disruptions
Summary
31
• S&P 500 has returned about 12% annually over the last 15 years
• Major disruptions are associated with 35% underperformance in stock returns
• One major glitch every 10 years – average return of 9%
Broader perspectives

32
•Consequences are not known
•Low frequency events
•Resource shortages
•Requires cross-functional effort
•Short tenure of managers
•You don’t get credit for fixing problems that never happened
•You have not experienced one
Why enough attention is not paid to the possibility of disruptions?
33
•Globalization of supply chains
• Increased reliance on outsourcing and partnerships
•Single sourcing
•Little slack in the supply chain
•Competition
Are supply chains more prone to disruptions today?

34
• Reduce the frequency (probability) of disruptions
- better forecasting
- better planning
- communicate, collaborate, and share
• Develop ability to predict disruptions (business intelligence)
- select, define, and track key performance indicators
- analyze disruptions to develop key leading indicators
- track leading indicators
- need visibility
Dealing with disruptions

35
• Elapsed time between the occurrence and detection of glitch
- aim for zero elapsed time
- real time visibility of the extended supply chain
- event management systems
• Time it takes to resolve the glitch
- quick resolution, prevent escalation and worsening
- a process for dealing/responding to disruptions
- developing capabilities to react and respond
Dealing with disruptions
36
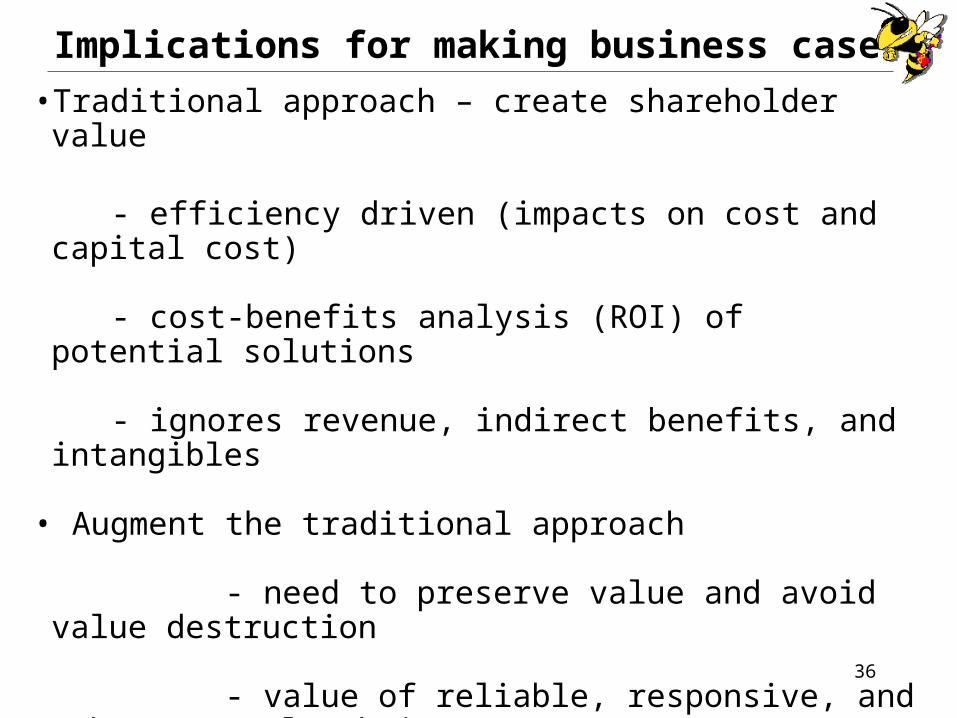
• Traditional approach – create shareholder value
- efficiency driven (impacts on cost and capital cost)
- cost-benefits analysis (ROI) of potential solutions
- ignores revenue, indirect benefits, and intangibles
• Augment the traditional approach
- need to preserve value and avoid value destruction
- value of reliable, responsive, and robust supply chains
- prevention role of effective SCM
- effective SCM buys insurance against value destruction
Implications for making business case

37
• Understand how upstream and downstream supply chain partners get affected by disruptions
• Examine the impact of excess inventory on shareholder value
• Product development delays
• Operation glitches and cost of capital
Future research
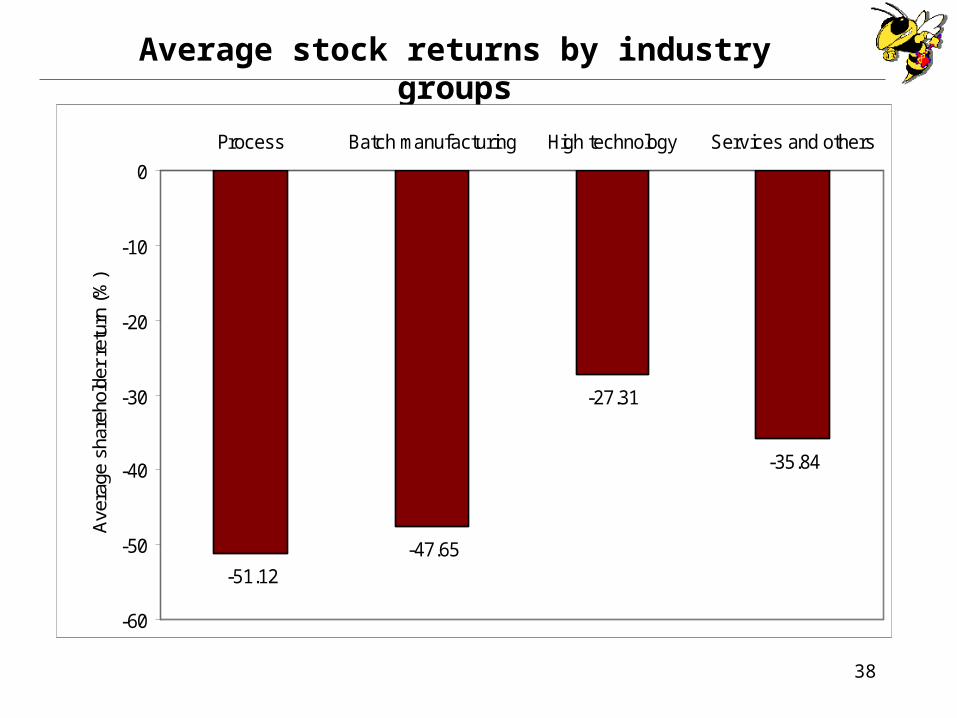
38
Average stock returns by industry groups
-51.12-47.65
-27.31
-35.84
-60
-50
-40
-30
-20
-10
0
Process Batch manufacturing High technology Services and others
Ave
rage
sha
reho
lder
ret
urn
(%)
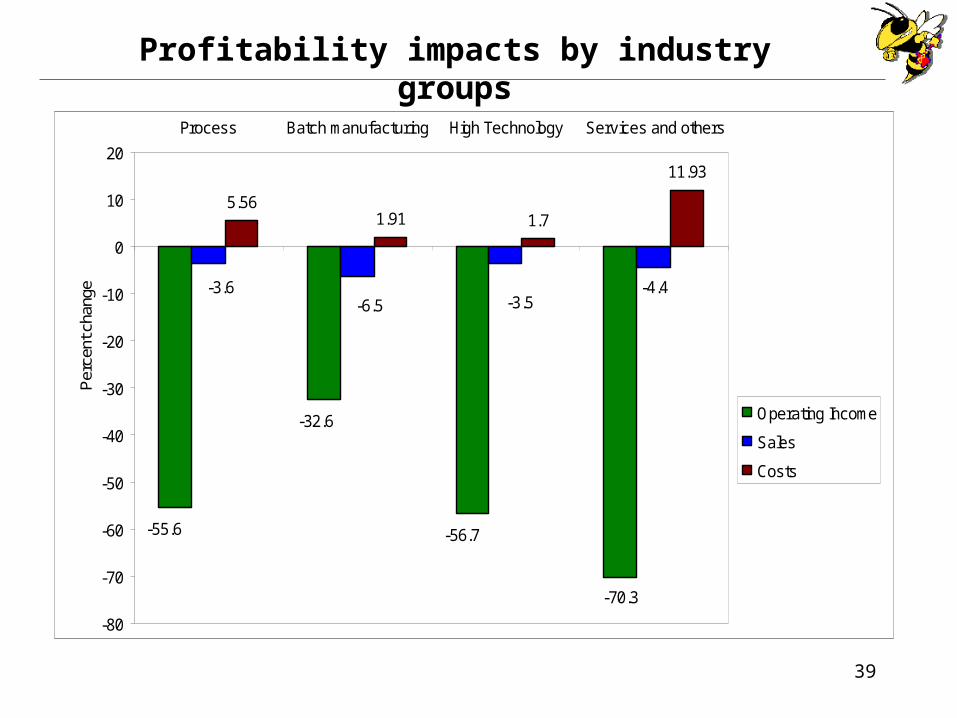
39
Profitability impacts by industry groups
-70.3
-4.4
5.561.91 1.7
11.93
-56.7
-32.6
-55.6
-3.5-6.5-3.6
-80
-70
-60
-50
-40
-30
-20
-10
0
10
20
Process Batch manufacturing High Technology Services and others
Per
cent
cha
nge
Operating Income
Sales
Costs
40
• Lower Revenues
• Higher costs
• Poor asset utilization
• Excess inventory, inventory write-offs, stockouts
• Higher cost of capital/borrowing
• Shareholder lawsuits
• Management and personnel turnover
• Loss of reputation and credibility, negative publicity
Consequences of disruptions

41
• Growth in Operating Income Sales – manufacturing costs – selling and general administration
costs
• Growth in return on sales Operating income normalized by sales
• Growth in return on assets Operating income normalized by total assets
• Growth in sales Net Revenues
• Growth in costs Manufacturing costs + selling and general administration cost
• Growth in total assets
• Growth in inventory Raw material + Work-in-process + Finished goods inventory
Estimating profitability impacts of disruptions

42
Median profitability impacts by responsibility
4.521.25
5.82
-43.7
-29.9
-55.0
-4.3 -1.1-5.6
-70
-60
-50
-40
-30
-20
-10
0
10
20
Internal Supplier Customer
Performance Measures
Per
cent
cha
nge
Operating Income
Sales
Costs
43
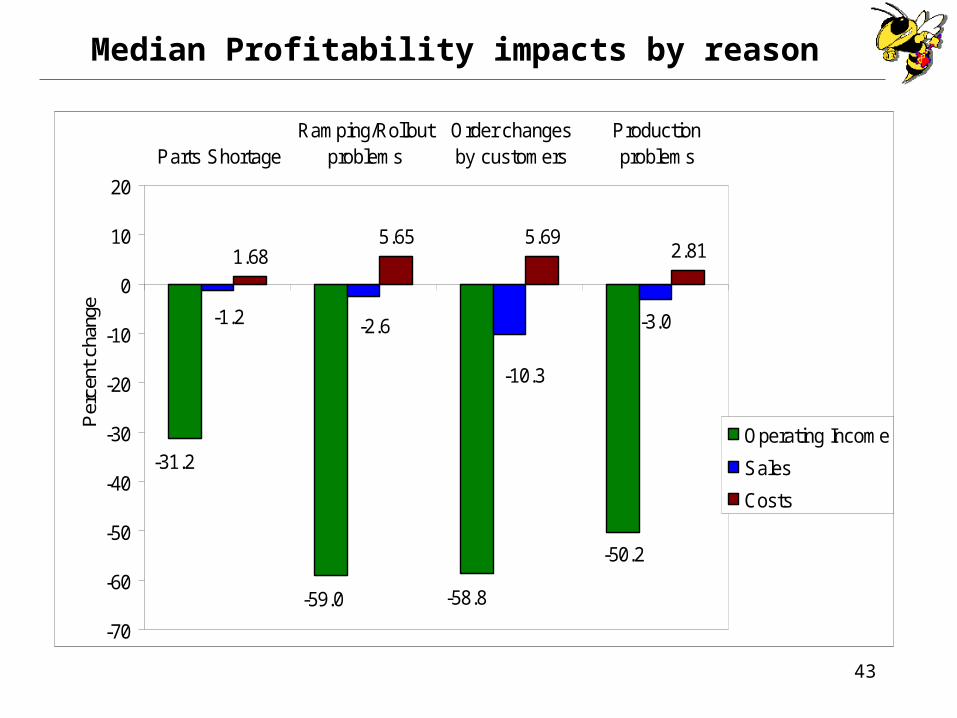
Median Profitability impacts by reason
-50.2
-3.0
1.685.65 5.69
2.81
-58.8-59.0
-31.2
-10.3
-2.6-1.2
-70
-60
-50
-40
-30
-20
-10
0
10
20
Parts ShortageRamping/Rollout
problemsOrder changesby customers
Productionproblems
Per
cent
cha
nge
Operating Income
Sales
Costs
44
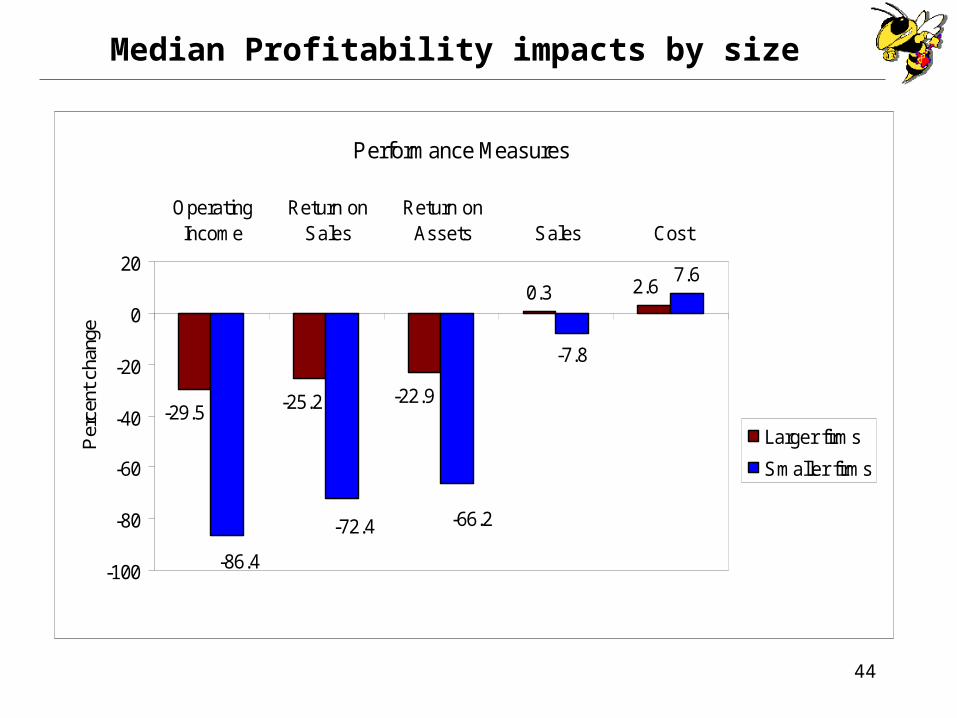
Median Profitability impacts by size
0.3
-7.8
7.62.6
-22.9-25.2-29.5
-66.2-72.4
-86.4-100
-80
-60
-40
-20
0
20
OperatingIncome
Return onSales
Return onAssets Sales Cost
Performance Measures
Per
cent
cha
nge
Larger firms
Smaller firms

45
•Attract and engage top management attention
•Make business case for organizational changes
•Make business case for investments in technology
•Convince our students that OM matters
Why link supply chain performance and shareholder value?

46
Supply chains and shareholder value
• Efficiency
• Reliability
• Responsiveness

47
• Lean and efficient supply chains
- Stretched and complex supply chains- Outsourcing and dependency on third parties- Single sourcing- Low slack
• Above practices can increase the risk of disruptions
• Trade-off between lean/efficiency and the risk/expected cost of disruptions
Lean and efficient versus risk of disruptions in supply chains

48
• Effect of disruptions on shareholder value
• Effect of disruptions on profitability – growth in operating income, sales, cost, assets, and inventory
• Effect of disruptions on risk – share price volatility
- cost of capital (discount rate)
- more expensive and difficult to raise capital
- can affect investment/acquisition plans
- increase the cost of factors of production
- conflict between various stakeholders
Issues examined