1 SUMMARY OF THE SAPS 2013- 14 ANNUAL REPORT ANALYSIS PC ON POLICE THEMBANI MBADLANYANA: 15 OCTOBER...
27
1 SUMMARY OF THE SAPS 2013-14 ANNUAL REPORT ANALYSIS PC ON POLICE THEMBANI MBADLANYANA: 15 OCTOBER 2014
-
Upload
bernadette-lyons -
Category
Documents
-
view
216 -
download
0
Transcript of 1 SUMMARY OF THE SAPS 2013- 14 ANNUAL REPORT ANALYSIS PC ON POLICE THEMBANI MBADLANYANA: 15 OCTOBER...
1
SUMMARY OF THE SAPS 2013-
14 ANNUAL REPORT
ANALYSIS
PC ON POLICE
THEMBANI MBADLANYANA:
15 OCTOBER 2014

2
SAPS 2013/4 ANNUAL REPORT ANALYSIS
Presentation Outline
•Introduction
•Strategic Overview
•Predetermined performance targets
•2013/14 Budget Allocation
•Auditor General Findings
•Key Challenges/concerns
•Conclusion

3
SAPS 2013/14 ANNUAL REPORT ANALYSIS
Introduction
•Annual Report hearings are important to the: 1) oversight role of the Portfolio Committee and; 2) fulfilment of its legislative obligations.
•Department’s annual report provides the Committee with necessary information and an opportunity to:
a)Assess whether services rendered are in line with the SAPS’ constitutional mandate, strategic plans, annual performance plans and allocated budgets;
b)Evaluate whether services being rendered do, in reality, contribute meaningfully to the realization of government’s overall objectives;
c)Assess whether allocated resources are utilised for their intended purposes.
d)Ensure that gaps between planned and actual budgets are reduced.
e)Ensure that over and/or under spending by the department are minimised and lastly;
f) Identify areas where the Portfolio Committee might help the Department to improve on its performance.

4
SAPS 2013/14 ANNUAL REPORT ANALYSIS
Legislative Mandate
•Aim: prevent, combat and investigate crime, maintain public order, protect and secure the inhabitants of South Africa and their property, and uphold and enforce the law.
•Vision: create a safe and secure environment for all people in South Africa
•Mission: prevent and combat anything that may threaten the safety and security of any community; investigate all crimes that
threaten safety and security of any community; protect and secure the inhabitants of the Republic and their property;
uphold and enforce the law; maintain public order; ensure offenders are brought to justice and; participate in efforts to
address the root causes of crime.
•Values: protect everyone’s rights and to be impartial, respectful, open and accountable to the community; use the powers in a
responsible way; Provide a responsible, effective and high-quality service with honesty and integrity; Evaluate
services rendered continuously and make every effort to improve on them; Ensure an effective, efficient and economic
use of resources; Develop the skills of all members through equal opportunity; Cooperate with all communities, all
spheres of Government and other relevant role-players
5
SAPS 2013/14 ANNUAL REPORT ANALYSIS
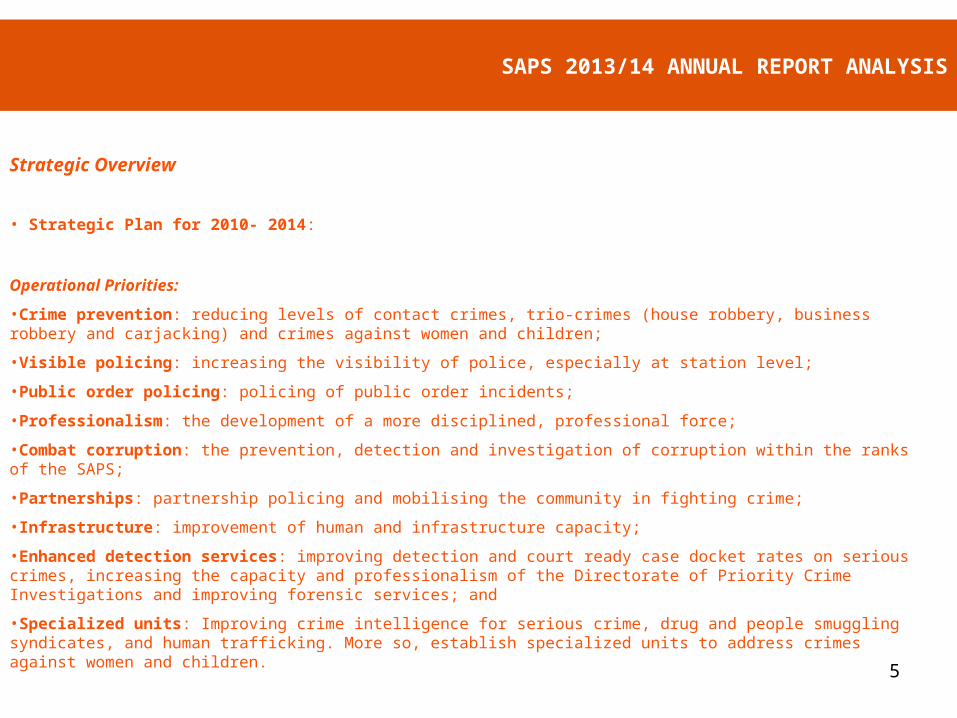
Strategic Overview
• Strategic Plan for 2010- 2014:
Operational Priorities:
•Crime prevention: reducing levels of contact crimes, trio-crimes (house robbery, business robbery and carjacking) and crimes against women and children;
•Visible policing: increasing the visibility of police, especially at station level;
•Public order policing: policing of public order incidents;
•Professionalism: the development of a more disciplined, professional force;
•Combat corruption: the prevention, detection and investigation of corruption within the ranks of the SAPS;
•Partnerships: partnership policing and mobilising the community in fighting crime;
•Infrastructure: improvement of human and infrastructure capacity;
•Enhanced detection services: improving detection and court ready case docket rates on serious crimes, increasing the capacity and professionalism of the Directorate of Priority Crime Investigations and improving forensic services; and
•Specialized units: Improving crime intelligence for serious crime, drug and people smuggling syndicates, and human trafficking. More so, establish specialized units to address crimes against women and children.
6
SAPS 2013/14 ANNUAL REPORT ANALYSIS
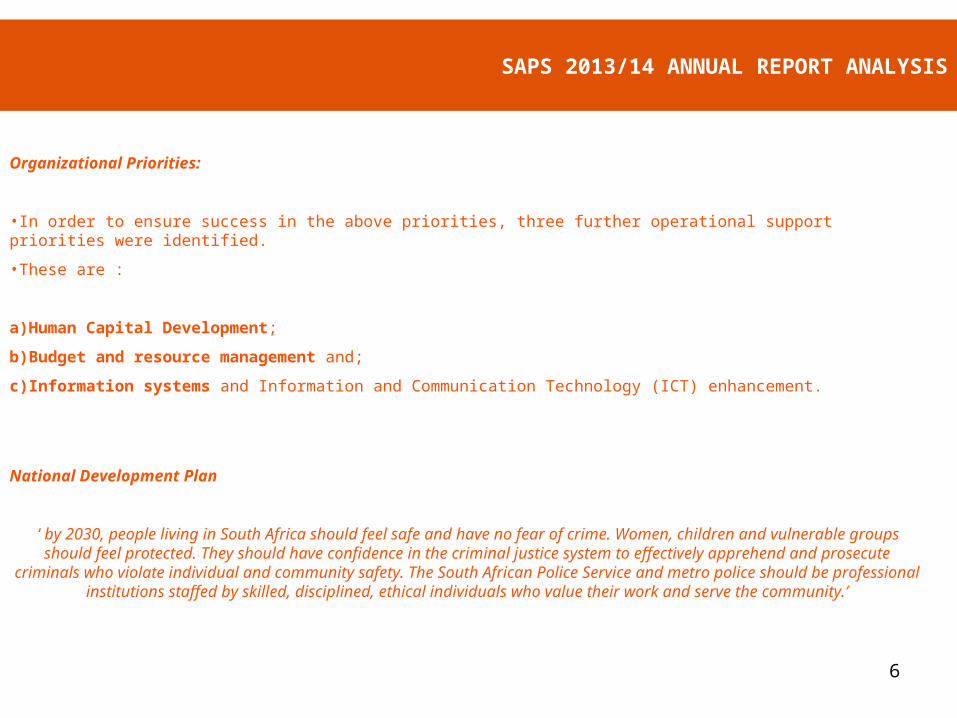
Organizational Priorities:
•In order to ensure success in the above priorities, three further operational support priorities were identified.
•These are :
a)Human Capital Development;
b)Budget and resource management and;
c)Information systems and Information and Communication Technology (ICT) enhancement.
National Development Plan
‘by 2030, people living in South Africa should feel safe and have no fear of crime. Women, children and vulnerable groups should feel protected. They should have confidence in the criminal justice system to effectively apprehend and prosecute criminals who violate individual and community safety. The South African Police Service and metro police should be professional institutions
staffed by skilled, disciplined, ethical individuals who value their work and serve the community.’

7
SAPS 2013/14 ANNUAL REPORT ANALYSIS
NDP Five Key Recommendations
•Synergized Criminal Justice System: the CJS is to have a single set of objectives, priorities and performance-measurement targets
•Demilitarise the police.
•Select and train police members to be professional and impartial, responsive to community needs, competent and inspire confidence.
•Coordinate activities across a variety of departments, the private sector and community bodies, the latter to include revitalised community-safety centres.
•Ensure all vulnerable groups including women, children and rural communities should enjoy equal protection and their fear of crime should be eradicated through effective, coordinated responses of the police, business, community and civil society.
National Planning Commission (NPC) Measurable Performance Outcomes
“Strategic Outcome 3 - All people in South Africa are and feel safe”

8
SAPS 2013/14 ANNUAL REPORT ANALYSIS
2013/14 Annual Performance Plan (APP) : Annual targets and performance indicators
•64 annual targets and performance indicators for five departmental programmes (Administration, Visible Policing, Detective Services, Crime Intelligence, Protection & Security Services).
• Of those 64 annual targets and performance indicators:
- 14 were for Administration (Programme 1),
- 20 for Visible Policing (Programme 2),
- 23 for Detective Services (Programme 3),
- 3 for Crime Intelligence (Programme 4) and;
- 4 for Protection and Security Services (Programme 5)

9
SAPS 2013/14 ANNUAL REPORT ANALYSIS
Annual Performance Plan (APP) : Spending Priorities
•Spending priorities identified by the Department in its 2013/14 APP:
a)Provision for specialised equipment and training for detectives to enhance the process of investigation of crime;
b) Increase police access points on a geographic basis to improve police response times;
c) Maintain level of spending to replace boarded vehicles;
d) Further implementation od sector policing to increase visibility of SAPS
e) Victim Support programmes;
f)Implementation of an Integrated CJS
g)Funding for the Forensic Services and broader Detective Services environments with regards to crime scene management;
h)Implementation of the Domestic Violence Act;
i)Maintaining a specialised capacity that allows for interventions through external deployment;
j)Implementation of the Firearm Control Act;
k)Capacity at police stations to implement the Service Delivery Improvement Programme;
l)Establishment of victim - friendly facilities;
m)Investment in capital equipment in support of basic policing services;
n)Maintaining the fixed wing aircraft and helicopter fleet;
o)Youth Crime Prevention and Social Crime Prevention;
p)Conducting high risk operations and many more.

10
SAPS 2013/14 ANNUAL REPORT ANALYSIS
Annual Performance Plan : Baseline budgetary provisions for the 2013/14 financial year
Added to the aforementioned spending priorities are the following specific baseline budgetary provisions for 2014/15:
•Uniform
•Weapon purchases
•Ammunition
•Network and hosting upgrades to continue
•Basic services at police stations (water, electricity and sanitation)
•Ramps at police access points for disabled individuals
•Furnishing and expanding Victim Friendly Facilities through
Criminal Asset Recovery Account (CARA) funding
•Radio Communication System
•Vehicles
•Maintaining a level of funding that allows for the management of the Police’s vehicle fleet through the Automated Vehicle Location System (AVL)
•Specialised equipment

11
SAPS 2013/14 ANNUAL REPORT ANALYSIS
SAPS Overall Budget Allocation : 2013/14 Financial Year
Table 1: Voted funds and expenditure in 2013/14
•2013/14 Main appropriation= R67.9 billion
• 2013/14 Final Appropriation= R68.7 billion
• 2013/14 Actual expenditure= R68.7
• Variance: R28 000 ( under Administration Programme)
Main Appropriation R’000
Final Appropriation R’000
Actual Amount Spent R’000
Over/Under Expenditure R’000
67,917,118 68,791,426 68,791,398 28 000 variance

12
SAPS 2013/14 ANNUAL REPORT ANALYSIS
Overall Departmental Expenditure: 2013/14 Financial Year

13
SAPS 2013/14 ANNUAL REPORT ANALYSIS
Budget Expenditure and Performance Per Programme: 2013/14 Financial Year
Programme 1: Administration

14
Budget Expenditure and Performance Per Programme: 2013/14 Financial Year
Programme 2: Visible Policing
SAPS 2013/14 ANNUAL REPORT ANALYSIS

15
Budget Expenditure and Performance Per Programme: 2013/15 Financial Year
Programme 3: Detective Services
SAPS 2013/14 ANNUAL REPORT ANALYSIS

16
Budget Expenditure and Performance Per Programme: 2013/15 Financial Year
Programme 4: Crime Intelligence
SAPS 2013/14 ANNUAL REPORT ANALYSIS

17
Budget Expenditure and Performance Per Programme: 2013/15 Financial Year
Programme 5: Protection and Security Services
SAPS 2013/14 ANNUAL REPORT ANALYSIS

18
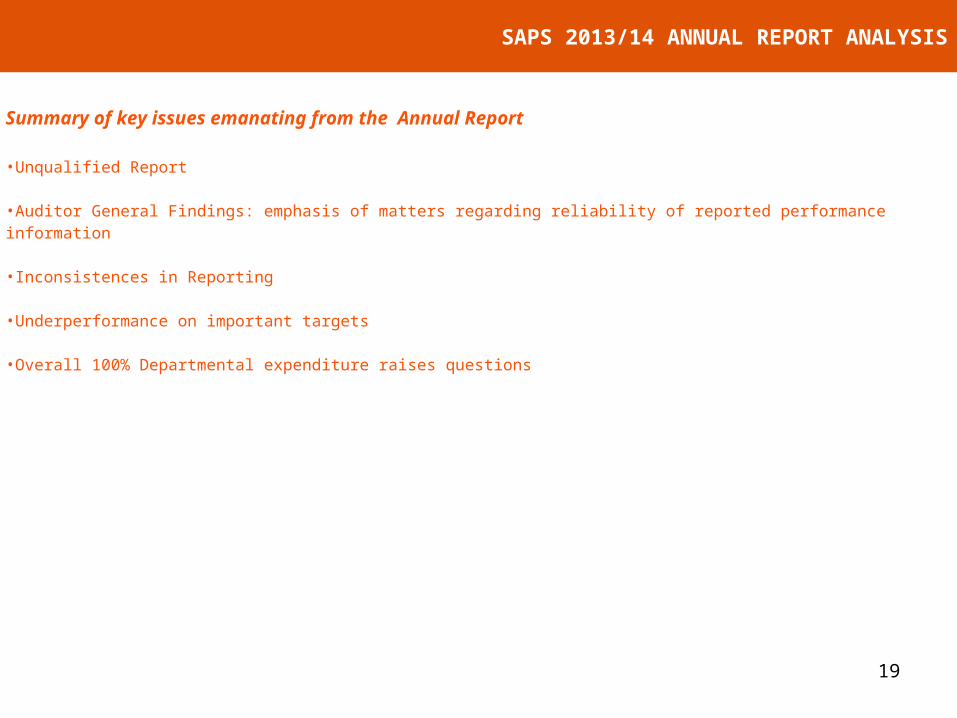
Summary of key issues emanating from the Annual Report
•Unqualified Report
•Auditor General Findings: emphasis of matters regarding reliability of reported performance information
•Inconsistences in Reporting
•Underperformance on important targets
•Overall 100% Departmental expenditure raises questions
SAPS 2013/14 ANNUAL REPORT ANALYSIS
19
Summary of key issues emanating from the Annual Report
•Unqualified Report
•Auditor General Findings: emphasis of matters regarding reliability of reported performance information
•Inconsistences in Reporting
•Underperformance on important targets
•Overall 100% Departmental expenditure raises questions
SAPS 2013/14 ANNUAL REPORT ANALYSIS
20
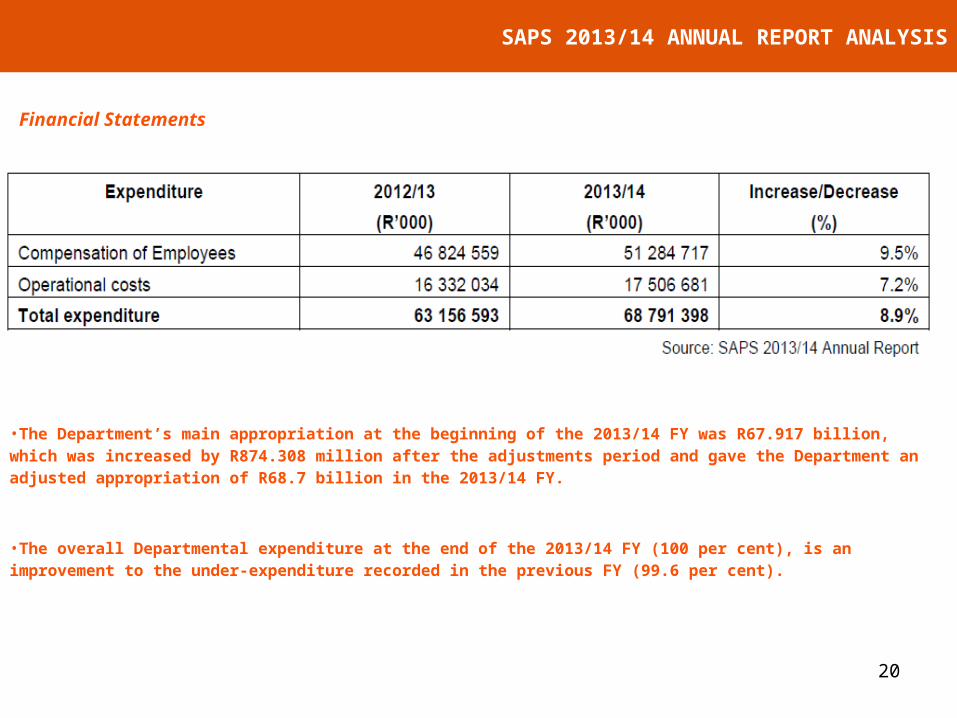
Financial Statements
•The Department’s main appropriation at the beginning of the 2013/14 FY was R67.917 billion, which was increased by R874.308 million after the adjustments period and gave the Department an adjusted appropriation of R68.7 billion in the 2013/14 FY.
•The overall Departmental expenditure at the end of the 2013/14 FY (100 per cent), is an improvement to the under-expenditure recorded in the previous FY (99.6 per cent).
SAPS 2013/14 ANNUAL REPORT ANALYSIS

21
Expenditure per economic classification
Compensation of employees
•Expenditure on this item improved from the previous FY. The Department spent 100% of its approved final appropriation at the end of the 2013/14 FY.
•A total amount of R51 284 717 billion was spent on Compensation of Employees during the 2013/14 FY. In particular, out of the 100% spent, 64.1% was spent on salaries; 1.0% on overtime; 3.5 on home owners’ allowance and 11.9% on medical assistance.
Goods and Services
•The Department spent 100% of its final appropriation (R13.5 billion) on Goods and Services.
•This final allocation and expenditure was much higher when compared to the 2012/13 FY.
Provinces and municipalities
•A final appropriation on Transfers to Provinces and Municipalities during the 2013/14 FY was R34. 5 million. About 100% of the final appropriation was spent by the end of the fourth quarter.
Buildings and other fixed structures
•A final appropriation on Buildings and other fixed structures during the 2013/14 FY was R868 million. About 100% of the final appropriation was spent by the end of the fourth quarter.
SAPS 2013/14 ANNUAL REPORT ANALYSIS

22
Expenditure per economic classification
Machinery and equipment
•A final appropriation on Machinery and equipment during the 2013/14 FY was R2.2 million. About 100% of the final appropriation was spent by the end of the fourth quarter.
Biological Assets
•An appropriation of R238 thousand was allocated to this item for the 2013/14 FY and the Department spent 100% of the allocated budget on Biological Assets. In the first three quarters no spending occurred on this item and suddenly the Department spent 91.5% against a target of 100% of the total allocation in the fourth quarter.
Virement/ Roll-overs
•According to the 2013/14 Annual Report, no amounts will be requested for roll-overs to the 2014/15 FY since the full amount allocated for the 2013/14 FY was expended.
SAPS 2013/14 ANNUAL REPORT ANALYSIS
23
Expenditure trends (in-year) during 2013/14 FY
Department’s overall expenditure at the end of the fourth quarter as captured in the 2013/14 Annual Report is not really reflective of the in-
yearly expenditure trends.
SAPS 2013/14 ANNUAL REPORT ANALYSIS

24
Departmental Revenue
•The R 386, 341 million total Departmental revenue received in 2013/14 was more than the R342, 023 million received in the 2012/13 FY.
•Of note is the increase in the Sales of capital assets, which increased from R150, 335 million in 2012/13 to R165,800 million in the 2013/14 FY.
•The revenue received from Transactions in financial assets and liabilities increased from R165, 448 million in 2012/13 to R165, 452 million in 2013/14.
Donor funds/Aid assistance
•A total amount of R 5,828 million was received in the form of donor funds/aid assistance, which is substantially less than the R9, 686 million received in 2012/13. •Total expenditure of aid/donor funds also increased from R5, 891 in 2012/13 to R6, 647 million in 2013/14. A total of R229 was surrendered, which is less that the R1, 810 million surrendered in the 2012/13 FY.
Foreign funding
•The financial statements illustrate that a significantly lower amount (R4, 292 million) was spent on Current expenditure from foreign aid assistance in the 2013/14 FY compared to the R5, 496 million was spent in the 2012/13 FY.
Local funds
•In terms of local funds, the Department had an opening balance of R819 thousand and received R5.828 million from the Criminal Assets Recovery Account (CARA)3 funds in 2013/14, of which R5.7 million was spent on the Capital account and R904 thousand for current payment.
SAPS 2013/14 ANNUAL REPORT ANALYSIS

25
Contingent liabilities
•The total recorded by the Department for Contingent Liabilities increased from R19,158,364 in 2012/13 FY to R21,192,094 in 2013/14 FY.
•The Sanlam Middestad Building remains as a Contingent liability of R611,692 million similar to the 2012/13.
•In terms of Claims against the Department, the liability increased from R18, 447,358 billion in 2012/13 to R20, 544,283 billion in 2013/14. • Of these the largest amounts were paid to claims for Police action, Shooting incidents and vehicles. It is noted that the amount paid out is far less than the value of original claims.
Irregular expenditure
•The past financial year recorded a slight decrease in irregular expenditure. In the 2013/14 FY, the Department had irregular expenditure of R339 thousand compared to R984 thousand in 2012/13.A total of R 2, 827 million is still awaiting condonation and is under investigation.•According to the Report the main areas where irregular expenditure was incurred in 2013/14was for: Labour hiring- 1 case (R158 thousand) Training- 4 cases (R394 thousand) Repairs- 6 cases (R67 thousand) Cleaning services- 4 cases (R420 thousand)Towing costs- 4 cases (R9 thousand)Renovation (Buildings)- 3 cases (R268 thousand)Leases – 2 cases- (R4 thousand)
SAPS 2013/14 ANNUAL REPORT ANALYSIS

26
SAPS 2013/14 ANNUAL REPORT ANALYSIS
Conclusion
•Despite some achievements, there remain some major challenges to be remedied. •As pointed out in the report of the Auditor-General, the Department is stagnating and not showing any commitment to improve and progress on its service delivery outputs.
•One of the biggest concerns regarding the stagnation of any Department is the fact that it can easily regress in its performance. •Moving forward, the biggest challenge in the Department of Police remains a challenge on setting reliable and measurable performance indicators and targets, which affects a clear and flawless assessment and/or evaluation of the department’s outcomes and impact.
• If the Department stands any chance of improving on its service delivery mandate in the current financial year, it should improve on how it sets its predetermined performance indicators and targets.
•As pointed out in the AG’s report, it is the necessity for the Department to improve on its strategic planning and performance management to ensure effective and efficient internal controls regarding performance management.
27
SAPS BUDGET ANALYSIS REPORT FOR 2014/15 FINANCIAL YEAR
THANK YOUASANTE SANAMERCI BEAUCOUP