1 Strategic Plan Baseline Data September 2004 Prince William County School Board October 6, 2004.
34
1 Strategic Plan Baseline Data September 2004 Prince William County School Board October 6, 2004
-
Upload
priscilla-young -
Category
Documents
-
view
214 -
download
0
Transcript of 1 Strategic Plan Baseline Data September 2004 Prince William County School Board October 6, 2004.

1
Strategic Plan
Baseline Data September 2004
Prince William County School Board
October 6, 2004

2
Overview
One school Prince William County School Division
Snapshot of division performance on Strategic Plan State standards Progress Achievement gap Program Participation/Performance Graduation Safe Schools Student Wellness

3
Mission
To meet the educational needs of a diverse student population through a high quality system.

4
Strategic Goal One
All students will meet high standards of performance

5
Strategic Measure 1.1.1
Accredited Provisional Accredited w. Warning
Year ES MS HS ES MS HS ES MS HS
2001 19 0 1 25 12 7
2002 29 8 6 18 4 2
2003 42 9 8 5 4 0
2004 45 13 8 3 0 0
All schools will be accredited by Virginia

6
Strategic Measure 1.1.1
Virginia Accreditation Division Scores
Subject 2000-01 2001-02 2003-03 2003-04
Math 71 78 83 86
English 80 83 84 87
History 61 78 84 85*
Science 76 79 82 84
*5th grade US I not included

7
Strategic Measure 1.1.2
Schools and the division will meet Adequate Yearly Progress annual measurable objectives
Division Made AYP
Elementary 42
Middle 8
High 2
TBD/Appeal 6
Number of Schools Making Adequate Yearly Progress

8
Strategic Measure 1.1.2
80% of all students will pass English and Math SOL tests
% Passing English/Math SOL Tests
60%
65%
70%
75%
80%
85%
2000-01 2001-02 2002-03 2003-04
English
Math

9
Strategic Measure 1.1.3
% Scoring Advanced on SOL Tests 2003-04
0%
5%
10%
15%
20%
25%
30%
35%
2000-01 2001-02 2002-03 2003-04
English
Math
Sci
SS
25% of students will score pass/advanced

10
Strategic Measure 1.1.4
90% of 3rd graders will read at grade level
Reading at Grade Level
50%
60%
70%
80%
90%
2000-01 2001-02 2002-03 2003-04

11
Strategic Measure 1.1.5
% Passing Research Paper
50% 60% 70% 80% 90% 100%
2000-01
2001-02
2002-03
2003-04
90% of students will pass the English Research Paper on first submission

12
Strategic Measure 1.2.1
Low Income Students passing English and Math SOLs
30%
40%
50%
60%
70%
80%
90%
100%
2000-01 2001-02 2002-03 2003-04
English
Math
80% of low income students will pass English and Math SOLs

13
Strategic Measure 1.2.1
Black Students passing English and Math SOLs
30%
40%
50%
60%
70%
80%
90%
100%
2000-01 2001-02 2002-03 2003-04
English
Math
80% of black students will pass English and Math SOLs

14
Strategic Measure 1.2.1
Hispanic Students passing English and Math SOLs
30%
40%
50%
60%
70%
80%
90%
100%
2000-01 2001-02 2002-03 2003-04
English
Math
80% of hispanic students will pass English and Math SOLs

15
Strategic Measure 1.2.1
White Students passing English and Math SOLs
30%
40%
50%
60%
70%
80%
90%
100%
2000-01 2001-02 2002-03 2003-04
English
Math
80% of white students will pass English and Math SOLs

16
Strategic Measure 1.2.1
Students with Disabilities passing English and Math SOLs
20%
30%
40%
50%
60%
70%
80%
90%
100%
2000-01 2001-02 2002-03 2003-04
English
Math
80% of students with disabilities will pass English and Math SOLs

17
Strategic Measure 1.2.1
LEP Students passing English and Math SOLs
30%
40%
50%
60%
70%
80%
90%
100%
2000-01 2001-02 2002-03 2003-04
English
Math
80% of LEP students will pass English and Math SOLs

18
Strategic Measure 1.2.2
Increased program participation of low income and minority students
0%5%
10%15%20%25%30%35%40%45%
LowIncome
Minority LowIncome
Minority LowIncome
Minority
Specialty AP Gifted
2000-01
2001-02
2002-03
2003-04
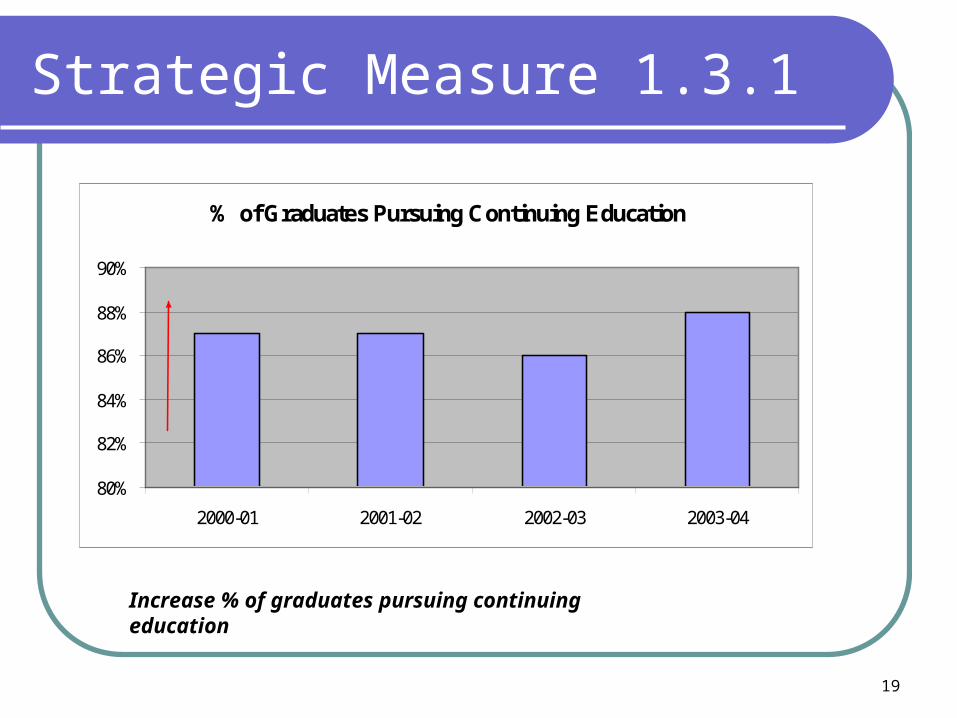
19
Strategic Measure 1.3.1
% of Graduates Pursuing Continuing Education
80%
82%
84%
86%
88%
90%
2000-01 2001-02 2002-03 2003-04
Increase % of graduates pursuing continuing education

20
Strategic Measure 1.3.2
Percent of Regular Ed Graduates Earning Advanced Studies Diploma
0%10%20%30%40%50%60%70%
2000-01 2001-02 2002-03 2003-04
60% of graduates will earn an Advanced Studies diploma
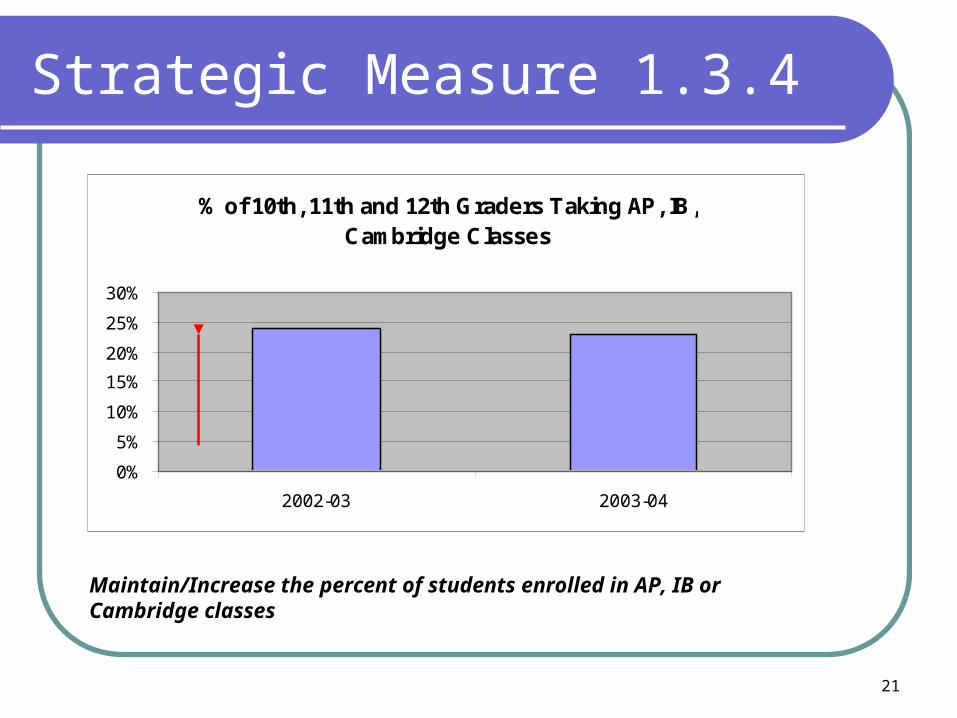
21
Strategic Measure 1.3.4
Maintain/Increase the percent of students enrolled in AP, IB or Cambridge classes
% of 10th, 11th and 12th Graders Taking AP, IB, Cambridge Classes
0%
5%
10%
15%
20%
25%
30%
2002-03 2003-04

22
Strategic Measure 1.3.5
% scoring 3 or more on AP exams meet or exceed national average
% Scoring 3 or Higher on AP Exams
30%35%40%45%50%55%60%65%70%
2000-01 2001-02 2002-03 2003-04
PWC
Nation

23
Strategic Measure 1.3.5
% scoring 4 or more on IB exams meet or exceed world average
% Scoring 4 or higher IB Tests
50%
60%
70%
80%
90%
100%
2001-02 2002-03 2003-04
PWC
World

24
Strategic Measure 1.4.1
% of Attendance
94.72%
94.54%
94.90%
94.96%
75% 85% 95%
2000-01
2001-02
2002-03
2003-04
% of attendance will be 95%

26
Strategic Goals 2, 3, 4 and 5
Measures with Data Collection

27
Strategic Measure 2.2.1
Decrease the % of students who repeatedly violate the code of behavior
% of students with 10 or more violations
2.0% 1.9%
0.0%
0.5%
1.0%
1.5%
2.0%
2.5%
2003 2004

28
Strategic Measure 2.2.2
NCLB Safety MeasureNone as calculated by VDOE
20032004
No school identified as persistently dangerous

29
Strategic Measure 2.2.3
85% will pass physical education requirements
Virginia Wellness Test
65%
70%
75%
80%
85%
90%
% M
eetin
g S
tand
ard
2003
2004
2003 83% 73% 78% 80%
2004 87% 76% 79% 81%
Abdominals Aerobic Upper Body Flexibility

30
Strategic Measure 2.3.3, 5.2.2
Fund renovations and repairs at 3% to 3.5% of replacement value
Year % Value
FY2005 4.2
FY2006 3.5
FY2007 4.1
FY2008 2.5
FY2009 3.4

31
Strategic Measure 2.3.4
95% of students will be housed in permanent facilities
% Students Housed in Permanent Facilities
80%
85%
90%
95%
100%
105%
110%
115%
ElementarySchool
MiddleSchool
High School DivisionTotal
2003-04 SHPF
2004-05 SHPF

32
Strategic Measure 4.1.1
All students taught by fully certified and endorsed teachers
Highly Qualified Teachers *
Tchrs Licensed,Need Endorsement,
6.1%
Tchrs Licensed and Endorsed,
93.9%
*Classes taught by Tchrs Licensed nd Endorsed

33
Strategic Measure 4.3.1
Each year, the rate of change in employee demographics will exceed the rate of change in student demographics.
Change in % of Minority Students and Staff
0% 10% 20% 30% 40% 50% 60%
Administrators
Teachers
Classif ied
Combined Staff
Students
Sept 04
Sept 03
Sept 04 21% 21% 35% 26% 53%
Sept 03 21% 20% 32% 24% 50%
Administrators Teachers Classif ied Combined Staff Students

34
Satisfaction Survey
80% of parents, student and staff will be satisfied with PWCS
0
10
20
30
40
50
60
70
80
90
Parents Students Staff
% S
atis
fied
2000
2001
2002
2003
2004

35
Conclusion
Meeting state standards Showing continuous improvement Reducing achievement gap Creating challenging programs Providing safe schools Addressing physical education Employing highly qualified teachers Challenges
Grade levels, content areas, groups of students Program Participation