1 ‘Social Sharing’ By Means of Distributed Computing: Some Results From A Study of SETI@home...
22
1 ‘Social Sharing’ By Means of Distributed Computing: Some Results From A Study of SETI@home Hans-Jürgen Engelbrecht Massey University August 2005 [email protected] http://www.massey.ac.nz/~hengelbr/
-
Upload
cecilia-reeves -
Category
Documents
-
view
214 -
download
0
Transcript of 1 ‘Social Sharing’ By Means of Distributed Computing: Some Results From A Study of SETI@home...

1
‘Social Sharing’ By Means of Distributed Computing: Some
Results From A Study of SETI@home
Hans-Jürgen EngelbrechtMassey University
August 2005
[email protected]://www.massey.ac.nz/~hengelbr/

2
1. Introduction
Information and Communication Technologies (ICT) are General Purpose Technologies.
One of many associated innovations: Distributed computing, grid computing.
Enables non-commercial sharing of physical, rivalrous goods via the Internet: Such ‘social sharing’ is a form of economic production (Benkler, 2004).

3
‘Shareable goods’
Sharing of computing power and bandwidth.
Two features of ‘shareable goods’ (Benkler, 2004): They are lumpy (PCs come in discrete units). They are of ‘mid-grained’ granularity (PCs are
widely privately owned and systematically have slack capacity).

4
‘Shareable goods’ ctd.
What determines the extent of ‘social sharing’?
Technological conditions, but also cultural practices and tastes (Benkler, 2004) and social and legal conditions (David, 2004).

5
2. SETI@home
Prime example of a voluntary non-commercial Internet-based distributed computing project: SETI@home.
Launched in May 1999.Download screen saver.Analysis of Arecibo radio telescope data.SETI@home the most powerful special
purpose supercomputer in the world.

6
SETI@home ctd.
Worldwide phenomenon (except for Mauritius, Palestine and Vatican City).
Incentives build into client interface, e.g. user and results data.
By Dec. 2004, there had been: More than 5 million contributors. Providing over 2 million years of CPU time
(more than 1000 years of CPU time during the last day alone).

7
SETI@home ctd.
SETI country data available for: Dec. 10th, 2002; Dec. 11th, 2003; Dec. 13th, 2004.
Dependent variables used in the regression model:SETI participants per capita.SETI results per capita (measures actual
outcomes and is arguably a better Internet-intensity variable than ‘hours of use’).

8
3. Explanatory variables What determines SETI@home cross-country
participation and its intensity? Aim: To include as many countries as possible. Therefore, modelling is severely restricted and I
use only a few key explanatory variables in the regressions: ITU’s ‘Digital Access Index’ (DAI). GDP per capita (gdp). The ‘Human Development Index’ (HDI). Country group dummy variables.

9
The Digital Access Index (DAI) ITU: The DAI tries to measure “the overall ability
of individuals in a country to access and use ICTs…”. It provides the first truly global ICT ranking.
The DAI is a composite index made up of 8 underlying indicators to capture: infrastructure (fixed telephone & mobile telephone
subscribers), affordability (Internet access price), ‘knowledge’ (adult literacy, school enrolment), quality (broadband subscribers, international
Internet bandwidth), actual usage of ICTs (Internet users).

10
Components of the Digital Access Index (DAI), 2002:
Indicator Goal-post
Sub-Components (in italics) and their composition
Fixed telephone subscribers per 100 inhabitants1
60
Mobile subscribers per 100 inhabitants
100
Each has a one half weight for infrastructure, which proxies overall ICT network development.
Adult literacy2 100 Overall school enrolment (primary, secondary and tertiary)2
100 Literacy has a two-third weight and enrolment a one-third weight for knowledge, which affects a country’s ability to use new technologies.
Internet access price (20 hours per month) as percent of monthly per capita income3
1 This is subtracted from 1 to form an indicator that proxies affordability of Internet access. (1=free Internet)
Broadband subscribers per 100 inhabitants4
30
Intern. Internet bandwidth per capita 10’000
Each has a one half weight for quality of access to ICTs.
Internet users per 100 inhabitants 85 This indicator proxies Internet usage.
11
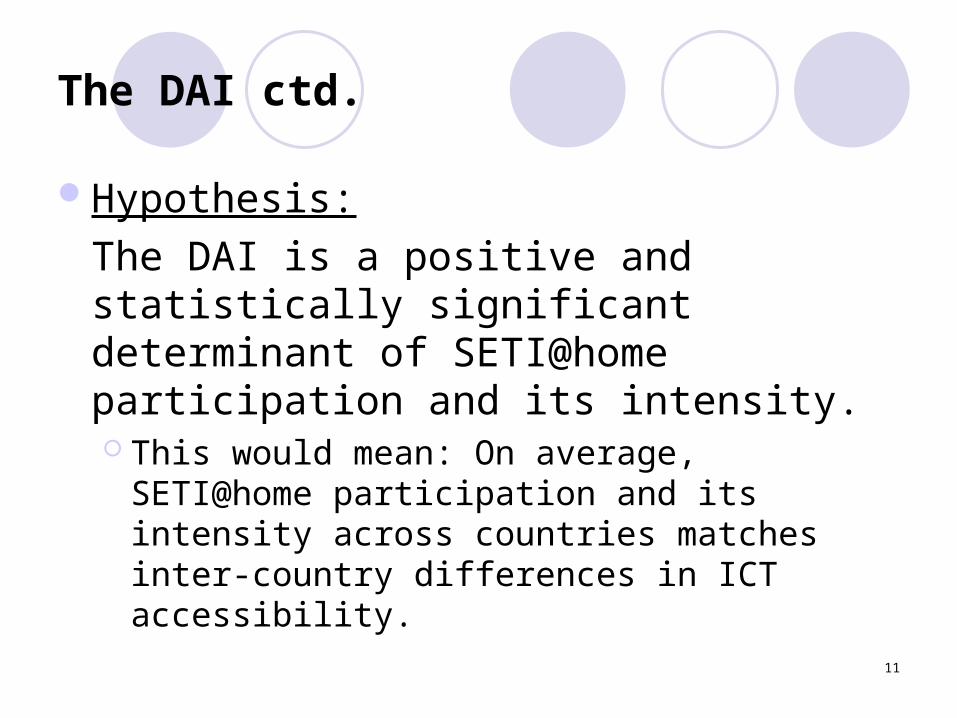
The DAI ctd.
Hypothesis:
The DAI is a positive and statistically significant determinant of SETI@home participation and its intensity. This would mean: On average, SETI@home
participation and its intensity across countries matches inter-country differences in ICT accessibility.
12
Other explanatory variables
GDP per capita (in PPP adjusted US $): Traditional proxy for ‘standard of living’. Key
explanatory variable in numerous ICT and Internet diffusion studies.
It is expected to be a positive and statistically significant determinant of SETI@home participation and its intensity.

13
Other explanatory variables ctd.
The HDI: A composite index which has emerged as the
preferred measure of ‘development’. It measures important dimensions of human
development neglected by gdp, such as: living a long and health life and being educated.
It is best included alongside DAI and gdp as an additional explanatory variable.

14
Other explanatory variables ctd.
Country group dummy variables: ITU’s “developed & advanced countries” versus
‘the rest’. Alternatively: 6 regional dummy variables
(similar to Caselli and Coleman II, 2001).
See “Appendix: Country List”.

15
4. Regression analysis
Matching data for 172 countries.Dependent variables alternatively in 2004
levels and 2002-2004 changes. Most regressions estimated in double-log
form.OLS with White’s heteroscedasticity
correction.Box-Cox regressions.

16
Regression results (1) (2) (3) (4) Dependent Variable: Indep. Variables:
Results per capita 2004
Participants per capita
2004
Change in results per capita,
2002-04
Change in participants per capita, 2002-04
DAI 2002 0.945b
(2.25) 1.065a
(3.54) 0.745b
(2.17) 0.892a
(3.02) gdp 2002 1.144a
(4.82) 1.031a
(5.36) 0.938a
(4.96) 0.985a
(5.43) Dev&adv dummy
1.121a
(3.52) 0.769a
(3.09) 1.013a
(2.98) 0.689a
(2.91) Intercept -4.383a
(-5.59) -9.348a
(-15.86) -4.457a
(-6.94) -10.668a
(-18.65) Adj. R2 0.70 0.77 0.69 0.73 DW 1.76 1.57 1.73 1.73 JB 1.28 1.08 5.68 0.32

17
Regression results ctd.Increasing DAI and gdp by 1% increases
dependent variables by a similar %tage (elasticity of ‘change in results per capita’ with respect to DAI somewhat lower).
DAI, gdp, and the general divide between rich&poor countries can explain most of the cross-country variation in SETI@home participation and its intensity (see R2s).
HDI dropped from preferred regressions (DAI and HDI highly correlated).

18
5. The global SETI@home digital divide
By Dec. 2004, developed & advanced countries (about 15% of the sample population) accounted for over 90% of submitted results.
But: Indications of a slowly narrowing global SETI@home digital divide! Growth rates for ‘users’ and ‘results’ higher in
”the rest”.

19
Developed & advanced countries versus ‘the rest’:
December 2004 totals
Dev. & adv. countries:
The rest: % the rest:
No. of total users: 4,511,609 604,821 11.8% No. of total results: 1,507,659,459 164,968,938 9.9% Total population: 900,395,111 4,975,626,881 84.7% December 2002 totals
Dev. & adv. countries:
The rest: % the rest:
No. of total users: 3,559,136 425,122 10.7% No. of total results: 661,872,079 47,186,802 6.7% Total population: 899,335,782 4,975,979,881 84.7%

20
Developed & advanced countries versus ‘the rest’ ctd.:
Percentage increase (Dec. 2002 - Dec. 2004): Dev. & adv.
countries The rest:
No. of total users:
26.8% 42.3%
No. of results:
127.8% 249.6%

21
Developed & advanced countries versus ‘the rest’ ctd.:
Per capita and per user results: Dev. & adv.
countries: The rest: The rest as % of
dev. & adv. cont.: No. of total users per capita by Dec. 2004:
0.00501
0.00012
2.43%
No. of total users per capita by Dec. 2002:
0.00396
0.000085
2.16%
No. of total results per capita by Dec. 2004:
1.67444
0.03316
1.98%
No. of total results per capita by Dec. 2002:
0.73596
0.00948
1.29%
No. of total results per user by Dec. 2004:
334.17
272.76
81.6%
No. of total results per user by Dec. 2002:
185.96
111
59.7%

22
6. Concluding comments
Further research needed: For a less heterogeneous group of countries. This
would allow more sophisticated modelling. More sophisticated models are needed to enable more
specific policy conclusions. Will non-commercial ‘social sharing’ via the
Internet become a dominant mode of economic production? There is huge potential for it, but commercial distributed
computing might greatly affect its realization.

![[Mary Firestone] SETI Scientist(BookFi.org)](https://static.fdocuments.in/doc/165x107/55cf8dd8550346703b8be936/mary-firestone-seti-scientistbookfiorg.jpg)