
1-s2.0-S0008622300000488-main
7
PERGAMON Carbon 38 (2000) 1995–2001 Changes in surface chemistry of activated carbons by wet oxidation a, b a * ´ ´ ´ C. Moreno-Castilla , M.V. Lopez-Ramon , F. Carrasco-Marın a ´ ´ Departamento de Quımica Inorganica, Facultad de Ciencias, Universidad de Granada, 18071 Granada, Spain b ´ ´ ´ ´ ´ Departamento de Quımica Inorganica y Organica, Facultad de Ciencias Experimentales, Universidad de Jaen, 23071 Jaen, Spain Received 18 October 1999; accepted 16 February 2000 Abstract A series of activated carbons with different degrees of activation were oxidized with H O , (NH ) S O and HNO in 2 2 4 2 2 8 3 order to introduce different oxygen surface complexes. Changes in the surface chemistry of the activated carbons after their oxidizing treatments were studied by different techniques including temperature-programmed desorption (TPD), X-ray photoelectron spectroscopy (XPS), Fourier transformed infrared spectroscopy (FTIR), titrations with HCl and NaOH, measurements of the pH of the point of zero charge and catalytic dehydration of methanol. Results showed that treatment with (NH ) S O fixed the lowest amount of both total oxygen and surface acid groups. However, this treatment yielded the 4 2 2 8 acid groups with the highest acid strength. This could be because it favors fixation of carboxyl groups close to other groups, such as carbonyl and hydroxyl, which enhances their acidity. 2000 Elsevier Science Ltd. All rights reserved. Keywords: A. Activated carbon; B. Oxidation; D. Surface oxygen complexes 1. Introduction in the same way. Thus, when activated carbons prepared from almond shells were oxidized with HNO or 3 The surface chemistry of carbon materials is basically (NH ) S O the latter treatment yielded oxidized activated 4 2 2 8 determined by the acidic and basic character of their carbons with stronger acid groups than the former, in spite surface, and can be changed by treating them with of the fewer oxygen surface complexes [7,8]. The aim of oxidizing agents either in the gas phase or in solution. the present work was to gain more insight into the changes These treatments fix a certain amount of oxygen surface occurring in the surface chemistry of activated carbons complexes such as: carboxyls, lactones, phenols, ketones, with different degrees of activation, after their wet oxida- quinones, alcohols and ethers that make the carbon materi- tion with nitric acid, hydrogen peroxide and ammonium als more hydrophilic and acidic, decreasing the pH of their peroxydisulphate. These changes were followed by tem- point of zero charge and increasing their surface charge perature-programmed desorption (TPD), X-ray photoelec- density [1–11]. At the same time, the surface basicity has tron spectroscopy (XPS), Fourier transformed infrared been found to decrease suggesting that the surface basic spectroscopy (FTIR), titrations with NaOH and HCl, sites are essentially of the Lewis type, associated with p measurements of the pH of the point zero charge, pH , PZC electron-rich regions found on the basal planes. Thus, an and by the behavior of the oxidized carbons in the increase in the oxygen content of the carbon diminishes the dehydration reaction of methanol. electronic density of the basal planes and, consequently, reduces the basicity of the carbon surface [11–19]. Different oxidizing agents can be used in aqueous 2. Experimental solutions to introduce oxygen surface complexes [12], and we have shown recently [7,8] that not all of these behave Activated carbons were prepared from olive stones. The raw material supplied by an olive mill was sieved to obtain a particle size between 1 and 1.5 mm, which was treated *Corresponding author. Tel.: 134-958-243-323; fax: 134- with a diluted H SO solution (10%) and washed with 958-248-526. 2 4 E-mail address: [email protected] (C. Moreno-Castilla). distilled water till absence of sulphate ions in the washing 0008-6223 / 00 / $ – see front matter 2000 Elsevier Science Ltd. All rights reserved. PII: S0008-6223(00)00048-8
-
Upload
dulce-baeza -
Category
Documents
-
view
213 -
download
0
description
CAMBIOS EN LA QUÍMICA SUPERFICIAL DE LOS CARBONES ACTIVADOS
Transcript of 1-s2.0-S0008622300000488-main

PERGAMON Carbon 38 (2000) 1995–2001
Changes in surface chemistry of activated carbons by wetoxidation
a , b a* ´ ´ ´C. Moreno-Castilla , M.V. Lopez-Ramon , F. Carrasco-Marına ´ ´Departamento de Quımica Inorganica, Facultad de Ciencias, Universidad de Granada, 18071 Granada, Spain
b ´ ´ ´ ´ ´Departamento de Quımica Inorganica y Organica, Facultad de Ciencias Experimentales, Universidad de Jaen, 23071 Jaen, Spain
Received 18 October 1999; accepted 16 February 2000
Abstract
A series of activated carbons with different degrees of activation were oxidized with H O , (NH ) S O and HNO in2 2 4 2 2 8 3
order to introduce different oxygen surface complexes. Changes in the surface chemistry of the activated carbons after theiroxidizing treatments were studied by different techniques including temperature-programmed desorption (TPD), X-rayphotoelectron spectroscopy (XPS), Fourier transformed infrared spectroscopy (FTIR), titrations with HCl and NaOH,measurements of the pH of the point of zero charge and catalytic dehydration of methanol. Results showed that treatmentwith (NH ) S O fixed the lowest amount of both total oxygen and surface acid groups. However, this treatment yielded the4 2 2 8
acid groups with the highest acid strength. This could be because it favors fixation of carboxyl groups close to other groups,such as carbonyl and hydroxyl, which enhances their acidity. 2000 Elsevier Science Ltd. All rights reserved.
Keywords: A. Activated carbon; B. Oxidation; D. Surface oxygen complexes
1. Introduction in the same way. Thus, when activated carbons preparedfrom almond shells were oxidized with HNO or3
The surface chemistry of carbon materials is basically (NH ) S O the latter treatment yielded oxidized activated4 2 2 8
determined by the acidic and basic character of their carbons with stronger acid groups than the former, in spitesurface, and can be changed by treating them with of the fewer oxygen surface complexes [7,8]. The aim ofoxidizing agents either in the gas phase or in solution. the present work was to gain more insight into the changesThese treatments fix a certain amount of oxygen surface occurring in the surface chemistry of activated carbonscomplexes such as: carboxyls, lactones, phenols, ketones, with different degrees of activation, after their wet oxida-quinones, alcohols and ethers that make the carbon materi- tion with nitric acid, hydrogen peroxide and ammoniumals more hydrophilic and acidic, decreasing the pH of their peroxydisulphate. These changes were followed by tem-point of zero charge and increasing their surface charge perature-programmed desorption (TPD), X-ray photoelec-density [1–11]. At the same time, the surface basicity has tron spectroscopy (XPS), Fourier transformed infraredbeen found to decrease suggesting that the surface basic spectroscopy (FTIR), titrations with NaOH and HCl,sites are essentially of the Lewis type, associated with p measurements of the pH of the point zero charge, pH ,PZC
electron-rich regions found on the basal planes. Thus, an and by the behavior of the oxidized carbons in theincrease in the oxygen content of the carbon diminishes the dehydration reaction of methanol.electronic density of the basal planes and, consequently,reduces the basicity of the carbon surface [11–19].
Different oxidizing agents can be used in aqueous 2. Experimentalsolutions to introduce oxygen surface complexes [12], andwe have shown recently [7,8] that not all of these behave Activated carbons were prepared from olive stones. The
raw material supplied by an olive mill was sieved to obtaina particle size between 1 and 1.5 mm, which was treated*Corresponding author. Tel.: 134-958-243-323; fax: 134-with a diluted H SO solution (10%) and washed with958-248-526. 2 4
E-mail address: [email protected] (C. Moreno-Castilla). distilled water till absence of sulphate ions in the washing
0008-6223/00/$ – see front matter 2000 Elsevier Science Ltd. All rights reserved.PI I : S0008-6223( 00 )00048-8

1996 C. Moreno-Castilla et al. / Carbon 38 (2000) 1995 –2001
water. This material was carbonized in a N flow at 1273 was kept in a plastic bottle and shaken periodically for one2
K for 1 h, and after that, steam activated at 1123 K for or two days until the pH had stabilized, taking the final pHdifferent periods of time to obtain various degrees of of the slurry as the pH of the solid. Finally, the surfacePZC
activation, following the method explained elsewhere [8]. acidity was also evaluated by studying the dehydrationThe activated carbons so prepared will be referred to in the reaction of methanol at 453 K. Catalytic test was carriedtext as BV followed by a number that indicates the degree out in a glass microreactor at atmospheric pressure and theof activation, or percentage of burn-off, during the steam catalyst was heat treated at 453 K for 2 h, in He flow,activation step. before studying its activity. The reaction was performed in
The samples obtained were oxidized with HNO , H O He flow saturated with alcohol at 273 K. The total flow3 2 23 21 21and (NH ) S O . The oxidized samples, or the treatment was 63 cm min and the space velocity 0.41 h .4 2 2 8
followed to obtain them, will be referred to in the text as Analysis of reaction products was done by on-line gasN, H or S, respectively. The procedures followed to chromatography using a Perkin-Elmer gas chromatograph,oxidize the activated carbons have been explained in detail model 8500, with flame ionization detector and a columnelsewhere [7,8]. After the N and S treatments the samples Carbopack B80/120.were washed with distilled water till absence of nitrate andsulphate ions, respectively, in the washing water.
All samples were characterized by N adsorption at 772
3. Results and discussionK by applying the BET equation to the N adsorption2
isotherm. Mercury porosimetry data were obtained up to a22 Surface area and porosity of the original and oxidizedfinal pressure of 4200 kg cm using an Austoscan 60
activated carbons are shown in Table 1. S of the originalequipment. From this technique, the pore volume of pores N2
samples increased with the degree of activation given towith a diameter between 3.6 and 50 nm, V , and the pore2
the carbonized raw material. The oxidation treatments didvolume of pores with a diameter greater than 50 nm werenot change S in the case of BV5. However, in the case ofobtained. N2
BV15 and BV29 there was a decrease in this parameterSurface chemistry of activated carbons was studied bywith oxidation treatment with greater degrees of activationTPD, XPS, FTIR, titration with NaOH and HCl and pHPZC
of the original carbon resulting in a more pronouncedmeasurements. TPD experiments were carried out bydecrease in S . This occurs because an increase in theheating the samples up to 1273 K in He flow at a heating N2
21rate of 20 K min and recording the amounts of CO and degree of activation makes the pore walls thinner and,CO evolved with a quadrupole mass spectrometer, from thus, more easily destroyed by the oxidizing agent [7]. V2 2
Balzers, model Thermocube, as a function of temperature value decreased significantly with oxidation treatment inas described elsewhere [20]. all cases, except in the case of BV29H. It is noteworthy
XPS measurements were made with a Physical Elec- that whereas the S and N treatments decreased the macro-tronic 5700 equipment with a Mg K X-ray excitation pore volume, V , of the original sample, H treatmenta 3
source (hn 51253.6 eV) and hemispherical electron ana- increased the macropore volume.lyzer. Prior to the analysis, the samples were heated in situat 393 K for 1 h under high vacuum and introduced in the Table 1analysis chamber without any contact with the atmosphere. Surface area and porosity of the original and oxidized activatedThe residual pressure in the analysis chamber was main- carbons
29tained below 10 Torr during data acquisition. Survey a bSample S V VN 2 32and multiregion spectra were recorded at O and C 2 21 3 21 3 211s 1s m g cm g cm gphotoelectron peaks. The atomic concentrations were
BV5 467 0.17 0.18calculated from the photoelectron peak areas, using ShirleyBV5H 425 0.16 0.22background subtraction [21] and sensitivity factors pro-BV5S 497 0.16 0.13vided by the spectrometer manufacturer PHI [22].
The transmission FTIR spectra were obtained with a BV15 716 0.19 0.29BV15H 651 0.17 0.42Nicolet 20SXB spectrophotometer using KBr wafers con-BV15S 646 0.17 0.36taining about 0.5 g carbon. These wafers were dried
overnight at 393 K before the spectra were recorded. The BV29 928 0.14 0.74FTIR spectra of the samples were obtained by adding 100 BV29H 769 0.20 0.83
21scans at a resolution of 1 cm . BV29S 780 0.13 0.64BV29N 738 0.15 0.59Both total surface acidity and basicity were determined
aby titration with NaOH and HCl, respectively, following V is the pore volume of pores with diameter between 3.6 and2the method described elsewhere [8]. The pH of the 50 nm.PZC
bactivated carbons [6] was obtained by mixing 1 g of V is the pore volume of pores with diameter greater than 5033carbon with 20 cm of CO -free distilled water. The slurry nm.2

C. Moreno-Castilla et al. / Carbon 38 (2000) 1995 –2001 1997
Table 2Amounts of CO and CO evolved after heating up to 1273 K in2
He flow. Total and surface oxygen concentrationsa bSample CO CO CO/CO [O] [O]2 2 T S
21 21mmol g mmol g % %
BV5 0.45 0.11 4.09 1.1 –BV5H 1.15 0.35 3.29 3.0 –BV5S 0.90 0.23 3.91 2.2 –
BV15 0.40 0.10 4.00 1.0 6.7BV15H 1.97 0.60 3.28 5.1 10.2BV15S 2.16 0.45 4.80 4.9 8.7
BV29 0.37 0.09 4.11 0.9 4.6BV29H 2.90 0.90 3.22 7.5 12.0BV29S 2.87 0.61 4.70 6.5 9.1BV29N 5.28 2.22 2.38 15.6 12.7
a Total oxygen content from the amounts of CO and CO2
evolved.b Surface oxygen content from XPS measurements.
From TPD spectra, the amounts of CO and CO evolved2
up to 1273 K were obtained and these are compiled inFig. 1. XPS pattern (C core level) of sample BV29H.1sTable 2. The results show that the S treatment fixed the
lowest amount of CO -evolving surface complexes, i.e.2
carboxyl and lactone groups, whereas the N treatment fixed fitting of the measured peaks, the following functions werethe largest amount of these groups. Therefore, the CO/ considered: aromatic and aliphatic carbon, single C–OCO ratio decreases in the order S.H.N. From the bonds, double C=O bonds, carboxyl groups and carbonate.2
amounts of CO and CO evolved, the total oxygen content, The contribution of plasmon was negligible. Table 3 shows2
[O] , was obtained. The N treatment fixed the largest the binding energy (BE) values adopted in C fits [25–T 1s
amount of oxygen, whereas the S treatment fixed the 28].smallest amount. The relevant peak areas are compiled in Table 4. Listed
The surface oxygen content, [O] , was obtained from values were normalized to the area of peak 1 arbitrarily setS
XPS. Papirer et al. [23] indicate that, with a first approxi- to 100. Results show that, on the most external surface ofmation, the 80–90% peak area of the O peak originates the samples, the S treatment fixed the lowest amount of1s
from the contribution of surface atoms, or atoms of the double C=O bonds and carboxyl groups, peaks 3 and 4,3.5–4 nm thick outer shell and the C peak from C atoms respectively. This lowest amount of carboxyl groups was1s
located at the surface or in the 4–5 nm outer shell. Results also detected by TPD (Table 2). Thus, the concentration offound show that for the original carbons, BV15 and BV29, carboxyl groups was lowest after the S treatment both onthe oxygen groups were essentially concentrated on the the total and the most external surface of the particles. Theexternal surface of the carbon particles. When these S treatment also yielded the lowest surface concentrationcarbons were oxidized with both H O and (NH )S O of groups with a single C–O bond. The surface con-2 2 4 2 8
most of the oxygen surface complexes were fixed on the centration of carbonate is almost the same after the threeexternal surface and so [O] .[O] . However, the N oxidizing treatments. Therefore, these results clearly indi-S T
treatment gave a [O] ,[O] and, therefore, was able to fix cate that the surface concentration of acid groups such asS T
more oxygen surface complexes on the internal surface of carboxyl, lactone or phenol groups was the lowest after thethe carbon particles than the other two treatments. S treatment.
The chemical nature of the oxygen surface complexes FTIR of sample BV29 and its oxidized derivatives arefixed on the samples after the oxidizing treatments was depicted in Fig. 2, as an example. Bands in the region of
21studied both by XPS and FTIR of selected samples. XPS 1860–1650 cm are attributed to the C=O stretchinggives information about the composition of the most vibrations corresponding to carbonyl and carboxyl groupsexternal surface of the activated carbon particles, as [29–31]. In this region, the oxidized carbons present morementioned above. Fig. 1 shows, as an example, the fits of pronounced bands than the original carbon. Samples
21C of sample BV29H. With all carbons, the C signal BV29S and BV29N show a band at 1740 cm which can1s 1s
showed an asymmetric tailing. This is partially due to the be assigned to lactone groups [29–32], whereas in sample21intrinsic asymmetry of the graphite peak [24,25] and to the BV29H this band is shifted to 1720 cm . This band could
contribution of oxygen surface complexes. For the curve be assigned either to lactone groups [29–31] or to non-

1998 C. Moreno-Castilla et al. / Carbon 38 (2000) 1995 –2001
Table 3Position and assignments of C peaks1s
Peak number Binding energy Assignment(eV)
1 284.6 – 285.1 Aromatics and aliphatics2 286.1 Single C–O bond (alcohol, ether, phenol,
C–OH of an enol–keto group)3 287.3 Double bonded carbon oxygen groups
(carbonyl, quinone)4 289.1 Carboxyl groups
a5 290.6 Carbonate, CO2
6 291.6 Plasmona This peak is also attributed [23] to shake-up satellite (p→p*).
aromatic carboxyl groups, for which the C=O stretching are superimposed. They can not, therefore, be described in21has been reported [30–33] to occur at 1712 cm . terms of simple motion of specific functional groups or
21 21Sample BV29H shows a shoulder at 1700 cm and a chemical bonds [30]. At 1040 cm , sample BV29H21peak at 1660 cm , sample BV29N only shows a well presents a shoulder and samples BV29N ad BV29S a
21defined peak at 1660 cm and sample BV29S shows a defined peak which corresponds to alcoholic C–O stretch-21doublet with peaks at 1680 and 1660 cm . It has been
reported [33,34] that the C=O stretching vibration ofcarboxyl acid groups existing in an aromatic ring structure
21generally appear at 1700–1680 cm and its wave numberis affected by different peripheral groups. Finally, the band
21at 1660 cm can be attributed to quinone or conjugatedketone [9,29,33,35].
21The band at 1580 cm , that appears in the original andoxidized samples, has been observed by many authors andhas not been interpreted unequivocally. This has beenassigned to aromatic ring stretching coupled to highly
21conjugated carbonyl groups (C=O) [29]. The 1460 cmcan be attributed either to an O–H deformation vibration incarboxyl groups or C–H bending vibrations [9,29,36], andappears in all oxidized samples. The bands in the region of
211400–1380 cm , that also appear in oxidized samples,can be ascribed either to carboxyl–carbonate structures[29,36] or to aromatic C=C bond and various substitutionmodes of the aromatic ring [34].
21Bands in the 1200–1000 cm region are difficult toassign because here a number of broad overlapping bands
Table 4Comparison of C peak areas normalized to the area of peak 11s
arbitrarily set to 100
Sample C peak number1s
1 2 3 4 5
BV15 100 1.94 1.31 1.69 2.60BV15H 100 7.55 3.72 3.13 2.46BV15S 100 5.69 1.92 1.69 3.01
BV29 100 1.38 0.88 1.26 1.60BV29H 100 3.74 4.65 2.83 2.61BV29S 100 3.44 1.80 1.88 2.67BV29N 100 7.82 3.87 2.69 2.65
Fig. 2. FTIR spectra for activated carbons from BV29 series.
C. Moreno-Castilla et al. / Carbon 38 (2000) 1995 –2001 1999
21ing vibration [33]. Bands below 950 cm are characteris- ent authors [10,45–48], and one of the conclusions reachedtic of out-of-plane deformation vibrations of C–H groups was that the dehydration reaction took place on acid sitesin aromatic structures [29,36–38]. of carboxyl type essentially placed at the external surface
In conclusion, qualitatively, the FTIR technique detected of the carbon particles.lactone, quinone or conjugated quinone, carboxyl–carbon- The only product obtained in the decomposition ofate structures and alcohol groups in all oxidized samples. methanol by the activated carbons studied was dimethylIn the case of samples obtained after the H and S ether (DME) and results found with selected catalysts at atreatments a band corresponding to carboxyl groups reaction temperature of 453 K are shown in Table 6. Thebonded to aromatic structures also appears. original activated carbons, BV15 and BV29, had no
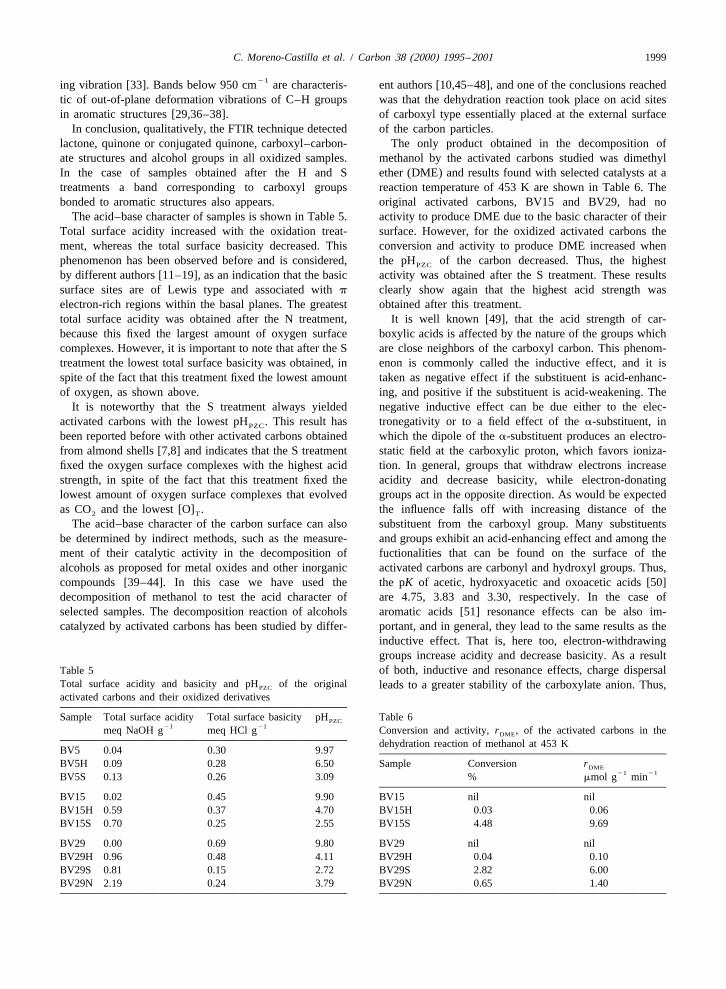
The acid–base character of samples is shown in Table 5. activity to produce DME due to the basic character of theirTotal surface acidity increased with the oxidation treat- surface. However, for the oxidized activated carbons thement, whereas the total surface basicity decreased. This conversion and activity to produce DME increased whenphenomenon has been observed before and is considered, the pH of the carbon decreased. Thus, the highestPZC
by different authors [11–19], as an indication that the basic activity was obtained after the S treatment. These resultssurface sites are of Lewis type and associated with p clearly show again that the highest acid strength waselectron-rich regions within the basal planes. The greatest obtained after this treatment.total surface acidity was obtained after the N treatment, It is well known [49], that the acid strength of car-because this fixed the largest amount of oxygen surface boxylic acids is affected by the nature of the groups whichcomplexes. However, it is important to note that after the S are close neighbors of the carboxyl carbon. This phenom-treatment the lowest total surface basicity was obtained, in enon is commonly called the inductive effect, and it isspite of the fact that this treatment fixed the lowest amount taken as negative effect if the substituent is acid-enhanc-of oxygen, as shown above. ing, and positive if the substituent is acid-weakening. The
It is noteworthy that the S treatment always yielded negative inductive effect can be due either to the elec-activated carbons with the lowest pH . This result has tronegativity or to a field effect of the a-substituent, inPZC
been reported before with other activated carbons obtained which the dipole of the a-substituent produces an electro-from almond shells [7,8] and indicates that the S treatment static field at the carboxylic proton, which favors ioniza-fixed the oxygen surface complexes with the highest acid tion. In general, groups that withdraw electrons increasestrength, in spite of the fact that this treatment fixed the acidity and decrease basicity, while electron-donatinglowest amount of oxygen surface complexes that evolved groups act in the opposite direction. As would be expectedas CO and the lowest [O] . the influence falls off with increasing distance of the2 T
The acid–base character of the carbon surface can also substituent from the carboxyl group. Many substituentsbe determined by indirect methods, such as the measure- and groups exhibit an acid-enhancing effect and among thement of their catalytic activity in the decomposition of fuctionalities that can be found on the surface of thealcohols as proposed for metal oxides and other inorganic activated carbons are carbonyl and hydroxyl groups. Thus,compounds [39–44]. In this case we have used the the pK of acetic, hydroxyacetic and oxoacetic acids [50]decomposition of methanol to test the acid character of are 4.75, 3.83 and 3.30, respectively. In the case ofselected samples. The decomposition reaction of alcohols aromatic acids [51] resonance effects can be also im-catalyzed by activated carbons has been studied by differ- portant, and in general, they lead to the same results as the
inductive effect. That is, here too, electron-withdrawinggroups increase acidity and decrease basicity. As a result
Table 5 of both, inductive and resonance effects, charge dispersalTotal surface acidity and basicity and pH of the original leads to a greater stability of the carboxylate anion. Thus,PZC
activated carbons and their oxidized derivatives
Sample Total surface acidity Total surface basicity pH Table 6PZC21 21meq NaOH g meq HCl g Conversion and activity, r , of the activated carbons in theDME
dehydration reaction of methanol at 453 KBV5 0.04 0.30 9.97BV5H 0.09 0.28 6.50 Sample Conversion rDME
21 21BV5S 0.13 0.26 3.09 % mmol g min
BV15 0.02 0.45 9.90 BV15 nil nilBV15H 0.59 0.37 4.70 BV15H 0.03 0.06BV15S 0.70 0.25 2.55 BV15S 4.48 9.69
BV29 0.00 0.69 9.80 BV29 nil nilBV29H 0.96 0.48 4.11 BV29H 0.04 0.10BV29S 0.81 0.15 2.72 BV29S 2.82 6.00BV29N 2.19 0.24 3.79 BV29N 0.65 1.40
2000 C. Moreno-Castilla et al. / Carbon 38 (2000) 1995 –2001
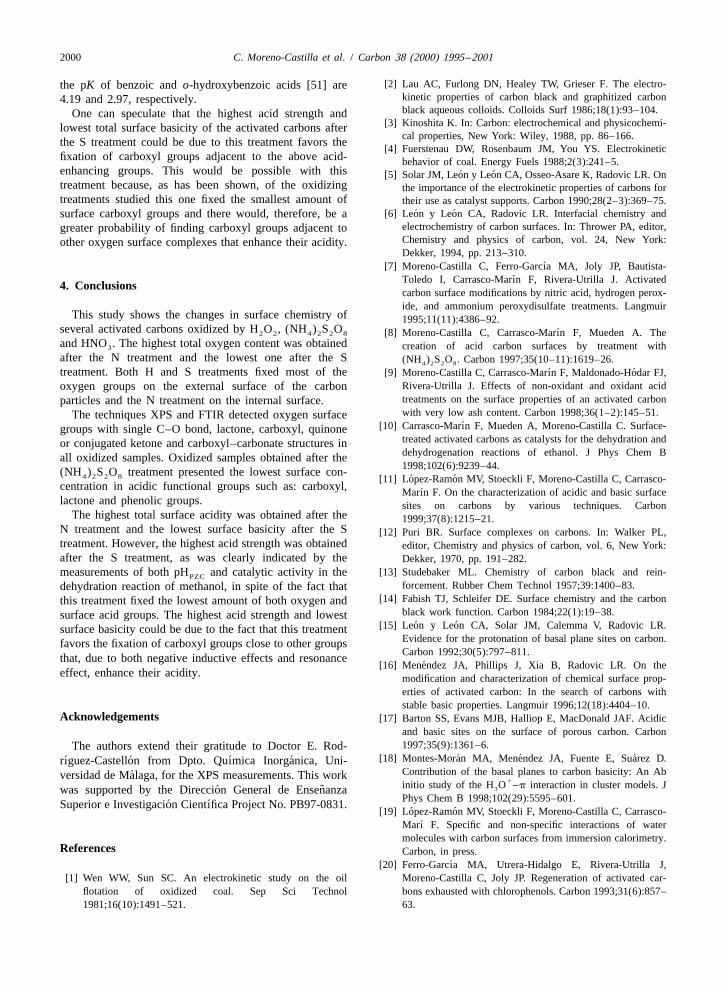
[2] Lau AC, Furlong DN, Healey TW, Grieser F. The electro-the pK of benzoic and o-hydroxybenzoic acids [51] arekinetic properties of carbon black and graphitized carbon4.19 and 2.97, respectively.black aqueous colloids. Colloids Surf 1986;18(1):93–104.One can speculate that the highest acid strength and
[3] Kinoshita K. In: Carbon: electrochemical and physicochemi-lowest total surface basicity of the activated carbons aftercal properties, New York: Wiley, 1988, pp. 86–166.the S treatment could be due to this treatment favors the
[4] Fuerstenau DW, Rosenbaum JM, You YS. Electrokineticfixation of carboxyl groups adjacent to the above acid- behavior of coal. Energy Fuels 1988;2(3):241–5.enhancing groups. This would be possible with this ´ ´[5] Solar JM, Leon y Leon CA, Osseo-Asare K, Radovic LR. Ontreatment because, as has been shown, of the oxidizing the importance of the electrokinetic properties of carbons fortreatments studied this one fixed the smallest amount of their use as catalyst supports. Carbon 1990;28(2–3):369–75.
´ ´[6] Leon y Leon CA, Radovic LR. Interfacial chemistry andsurface carboxyl groups and there would, therefore, be aelectrochemistry of carbon surfaces. In: Thrower PA, editor,greater probability of finding carboxyl groups adjacent toChemistry and physics of carbon, vol. 24, New York:other oxygen surface complexes that enhance their acidity.Dekker, 1994, pp. 213–310.
´[7] Moreno-Castilla C, Ferro-Garcıa MA, Joly JP, Bautista-´Toledo I, Carrasco-Marın F, Rivera-Utrilla J. Activated4. Conclusions
carbon surface modifications by nitric acid, hydrogen perox-ide, and ammonium peroxydisulfate treatments. Langmuir
This study shows the changes in surface chemistry of 1995;11(11):4386–92.several activated carbons oxidized by H O , (NH ) S O2 2 4 2 2 8 ´[8] Moreno-Castilla C, Carrasco-Marın F, Mueden A. Theand HNO . The highest total oxygen content was obtained creation of acid carbon surfaces by treatment with3
after the N treatment and the lowest one after the S (NH ) S O . Carbon 1997;35(10–11):1619–26.4 2 2 8
treatment. Both H and S treatments fixed most of the ´ ´[9] Moreno-Castilla C, Carrasco-Marın F, Maldonado-Hodar FJ,Rivera-Utrilla J. Effects of non-oxidant and oxidant acidoxygen groups on the external surface of the carbontreatments on the surface properties of an activated carbonparticles and the N treatment on the internal surface.with very low ash content. Carbon 1998;36(1–2):145–51.The techniques XPS and FTIR detected oxygen surface
´[10] Carrasco-Marın F, Mueden A, Moreno-Castilla C. Surface-groups with single C–O bond, lactone, carboxyl, quinonetreated activated carbons as catalysts for the dehydration andor conjugated ketone and carboxyl–carbonate structures indehydrogenation reactions of ethanol. J Phys Chem Ball oxidized samples. Oxidized samples obtained after the1998;102(6):9239–44.(NH ) S O treatment presented the lowest surface con-4 2 2 8 ´ ´[11] Lopez-Ramon MV, Stoeckli F, Moreno-Castilla C, Carrasco-
centration in acidic functional groups such as: carboxyl, ´Marın F. On the characterization of acidic and basic surfacelactone and phenolic groups. sites on carbons by various techniques. Carbon
The highest total surface acidity was obtained after the 1999;37(8):1215–21.N treatment and the lowest surface basicity after the S [12] Puri BR. Surface complexes on carbons. In: Walker PL,treatment. However, the highest acid strength was obtained editor, Chemistry and physics of carbon, vol. 6, New York:after the S treatment, as was clearly indicated by the Dekker, 1970, pp. 191–282.
[13] Studebaker ML. Chemistry of carbon black and rein-measurements of both pH and catalytic activity in thePZC
forcement. Rubber Chem Technol 1957;39:1400–83.dehydration reaction of methanol, in spite of the fact that[14] Fabish TJ, Schleifer DE. Surface chemistry and the carbonthis treatment fixed the lowest amount of both oxygen and
black work function. Carbon 1984;22(1):19–38.surface acid groups. The highest acid strength and lowest´ ´[15] Leon y Leon CA, Solar JM, Calemma V, Radovic LR.surface basicity could be due to the fact that this treatment
Evidence for the protonation of basal plane sites on carbon.favors the fixation of carboxyl groups close to other groupsCarbon 1992;30(5):797–811.that, due to both negative inductive effects and resonance
´[16] Menendez JA, Phillips J, Xia B, Radovic LR. On theeffect, enhance their acidity. modification and characterization of chemical surface prop-
erties of activated carbon: In the search of carbons withstable basic properties. Langmuir 1996;12(18):4404–10.
Acknowledgements [17] Barton SS, Evans MJB, Halliop E, MacDonald JAF. Acidicand basic sites on the surface of porous carbon. Carbon1997;35(9):1361–6.The authors extend their gratitude to Doctor E. Rod-
´ ´ ´[18] Montes-Moran MA, Menendez JA, Fuente E, Suarez D.´ ´ ´ ´rıguez-Castellon from Dpto. Quımica Inorganica, Uni-Contribution of the basal planes to carbon basicity: An Ab´versidad de Malaga, for the XPS measurements. This work
1initio study of the H O –p interaction in cluster models. J3˜´was supported by the Direccion General de EnsenanzaPhys Chem B 1998;102(29):5595–601.´ ´Superior e Investigacion Cientıfica Project No. PB97-0831.
´ ´[19] Lopez-Ramon MV, Stoeckli F, Moreno-Castilla C, Carrasco-´Marı F. Specific and non-specific interactions of water
molecules with carbon surfaces from immersion calorimetry.References Carbon, in press.
´[20] Ferro-Garcıa MA, Utrera-Hidalgo E, Rivera-Utrilla J,[1] Wen WW, Sun SC. An electrokinetic study on the oil Moreno-Castilla C, Joly JP. Regeneration of activated car-
flotation of oxidized coal. Sep Sci Technol bons exhausted with chlorophenols. Carbon 1993;31(6):857–1981;16(10):1491–521. 63.
C. Moreno-Castilla et al. / Carbon 38 (2000) 1995 –2001 2001
[21] Shirley DA. High-resolution X-ray photoemission spectrum [37] Meldrum BJ, Rochester CH. In situ infrared study of theof the valence bands of gold. Phys Rev B 1972;5(12):4709– surface oxidation of activated carbon in oxygen and carbon14. dioxide. J Chem Soc Faraday Trans 1990;86(5):861–5.
[22] Physical Electronics, 6509 Flying Cloud Drive, Eden Prairie, [38] Meldrum BJ, Rochester CH. In situ infrared study of theMn 55344, USA. modification of the surface of activated carbon by ammonia,
[23] Papirer E, Lacroix R, Donnet JB, Nanse G, Fioux P. XPS water and hydrogen. J Chem Soc Faraday TransStudy of the halogenation of carbon black – Part 1. 1990;86(10):1881–4.Bromination. Carbon 1994;32(7):1341–58. [39] Ai M. Oxidation activity and acid–base properties of tin
[24] Cheung TTP. X-ray photoemission of polynuclear aromatic dioxide-based binary catalysts. I. Tin dioxide–vanadiumcarbon. J Appl Phys 1984;55(5):1388–93. pentoxide system. J Catal 1975;40(3):318–26.
[25] Darmstadt H, Roy C, Kaliaguine S. ESCA Characterization [40] Ai M. Oxidation activity and acid–basic properties of tinof commercial carbon blacks and of carbon blacks from dioxide-based binary catalysts. II. Tin dioxide–molibdenumvacuum pyrolysis of used tires. Carbon 1994;32(8):1399– trioxide and tin dioxide–phosphorus pentoxide systems. J406. Catal 1975;40(3):327–33.
[26] Desimoni E, Casella GI, Salvi AM. XPS/XAES study of [41] Gervasini A, Auroux A. Acidity and basicity of metal oxidecarbon fibers during thermal annealing under UHV con- surfaces. J Catal 1991;131:190–8.ditions. Carbon 1992;30(4):521–6. [42] Afanasiev P, Geatent C, Breysse M, Coudurier G,Vedrine JC.
[27] Desimoni E, Casella GI, Salvi AM, Cataldi TRI, Morone A. Influence of preparation method on the acidity ofXPS Investigation of ultrahigh-vacuum storage effects on MoO (WO )/ZrO catalysts. J Chem Soc Faraday Trans3 3 2
carbon fiber surfaces. Carbon 1992;30(4):527–31. 1994;90(1):193–202.¨[28] Zielke U, Huttinger KJ, Hoffman WP. Surface-oxidized [43] Gervasini A, Bellussi G, Fenyvesi J, Auroux A. Mi-
carbon fibers: I. Surface structure and chemistry. Carbon crocalorimetric and catalytic studies of the acidic character1996;34(8):983–98. of modified metal oxide surfaces. 1. Doping ions on alumina,
[29] Zawadzki J. Infrared spectroscopy in surface chemistry of magnesia and silica. J Phys Chem 1995;99(14):5117–25.´carbons. In: Thrower PA, editor, Chemistry and physics of [44] Moreno-Castilla C, Maldonado-Hodar FJ, Rivera-Utrilla J,
´ ´carbon, vol. 21, New York: Dekker, 1989, pp. 147–380. Rodrıguez-Castellon E. Group 6 metal oxide–carbon[30] Painter P, Starsinic M, Coleman M. Determination of func- aerogels. Their synthesis characterization and catalytic ac-
tional groups in coal by Fourier transform interferometry. In: tivity in the skeletal isomerization of 1-butene. Appl Catal AFourier transform infrared spectroscopy, vol. 4, New York: 1999;183:345–56.Academic Press, 1985, pp. 169–89. [45] Szymanski GS, Rychlicki G. Importance of oxygen surface
[31] Fanning PE, Vannice MA. A DRIFTS study of the formation groups in catalytic dehydration and dehydrogenation ofof surface groups on carbon by oxidation. Carbon butan-2-ol promoted by carbon catalysts. Carbon 1991;29(4–1993;31(5):721–30. 5):489–98.
[32] Zhuang QL, Kyotani T, Tomita A. DRIFT and TK/TPD [46] Grunewald GC, Drago RS. Carbon molecular sieves asanalyses of surface oxygen complexes formed during carbon catalysts and catalyst supports. J Am Chem Socgasification. Energy Fuels 1994;8:714–8. 1991;113(5):1636–9.
[33] Shin S, Jang J, Yoon SH, Mochida I. A study on the effect of [47] Szymanski GS, Rychlicki G. Catalytic conversion of propan-heat treatment on functional groups of pitch based activated 2-ol on carbon catalysts. Carbon 1993;31(2):247–57.carbon fiber using FTIR. Carbon 1997;35(12):1739–43. [48] Szymanski GS, Rychlicki G, Terzyk AP. Catalytic conver-
[34] Pretsch E, Clerc T, Seibl J, Simon W. In: Tables of spectral sion of ethanol on carbon catalysts. Carbon 1994;32(2):265–data for structure determination of organic compounds, 2nd 71.ed, New York: Springer-Verlag, 1989, pp. I5–I265. [49] Roberts JD, Caserio MC. In: Basic principles of organic
[35] Starsinic M, Taylor RL, Walker Jr. PL, Painter PC. FTIR chemistry, New York: Benjamin Inc, 1965, pp. 507–64.Studies of Saran chars. Carbon 1983;21(1):69–74. [50] Lide RD, editor, Handbook of chemistry and physics, 72nd
[36] Biniak S, Szymanski G, Siedlewski J, Swiatkowski A. The ed, Boca Raton: CRC Press, 1992, pp. 8.39–40.characterization of activated carbons with oxygen and nitro- [51] March J. In: Advanced organic chemistry, 4th ed, New York:gen surface groups. Carbon 1997;35(12):1799–810. Wiley, 1992, pp. 263–9.


