1. ROCKWELL HARDNESS TEST II. APPARATUS: III. … LAB MANUAL.pdf · Repeat the experiment at other...
38
AURORA’S TECHNOLOGICAL AND RESEARCH INSTITUTE,UPPAL,HYD DEPARTMENT OF MECHANICAL ENGINEERING MECHANICS OF SOLIDS 1 1. ROCKWELL HARDNESS TEST 1. AIM: To determine the Rockwell Hardness of a given test specimen II. APPARATUS: Rockwell Hardness testing machine, Test specimen. III. THEORY: HARDNESS-It is defined as the resistance of a metal to plastic deformation against Indentation, scratching, abrasion of cutting. The hardness of a material by this Rockwell hardness test method is measured by the depth of Penetration of the indenter. The depth of Penetration is inversely proportional to the hardness. Both ball or diamond cone types of indenters are used in this test. There are three scales on the machine for taking hardness readings. Scale “A” with load 60 kgf or 588.4 N and diamond indenter is used for performing tests on thin steel and shallow case hardened steel. Scale “B” with load 100 kgf or 980.7 N and 1.588 mm dia ball indenter is used for performing tests on soft steel, malleable iron, copper and aluminum alloys. First minor load is applied to over come the film thickness on the metal surface. Minor load also eliminates errors in the depth of measurements due to spring of the machine frame or setting down of the specimen and table attachments. The Rockwell hardness is derived from the measurement of the depth of the impression E P = Depth of penetration due to Minor load of 98.07 N. E a = Increase in depth of penetration due to Major load. E = Permanent increase of depth of indentation under minor load at 98.07 N even after removal of Major load. This method of test is suitable for finished or machined parts of simple shapes.
-
Upload
truongdang -
Category
Documents
-
view
217 -
download
0
Transcript of 1. ROCKWELL HARDNESS TEST II. APPARATUS: III. … LAB MANUAL.pdf · Repeat the experiment at other...

AURORA’S TECHNOLOGICAL AND RESEARCH INSTITUTE,UPPAL,HYD
DEPARTMENT OF MECHANICAL ENGINEERING
MECHANICS OF SOLIDS
1
1. ROCKWELL HARDNESS TEST
1. AIM: To determine the Rockwell Hardness of a given test specimen
II. APPARATUS: Rockwell Hardness testing machine, Test specimen.
III. THEORY:
HARDNESS-It is defined as the resistance of a metal to plastic deformation
against Indentation, scratching, abrasion of cutting.
The hardness of a material by this Rockwell hardness test method is measured by
the depth of Penetration of the indenter. The depth of Penetration is inversely
proportional to the hardness. Both ball or diamond cone types of indenters are used in this
test. There are three scales on the machine for taking hardness readings. Scale “A” with
load 60 kgf or 588.4 N and diamond indenter is used for performing tests on thin steel
and shallow case hardened steel.
Scale “B” with load 100 kgf or 980.7 N and 1.588 mm dia ball indenter is used for
performing tests on soft steel, malleable iron, copper and aluminum alloys.
First minor load is applied to over come the film thickness on the metal surface.
Minor load also eliminates errors in the depth of measurements due to spring of the
machine frame or setting down of the specimen and table attachments.
The Rockwell hardness is derived from the measurement of the depth of the impression
EP = Depth of penetration due to Minor load of 98.07 N.
Ea = Increase in depth of penetration due to Major load.
E = Permanent increase of depth of indentation under minor load at 98.07 N even
after removal of Major load.
This method of test is suitable for finished or machined parts of simple shapes.

AURORA’S TECHNOLOGICAL AND RESEARCH INSTITUTE,UPPAL,HYD
DEPARTMENT OF MECHANICAL ENGINEERING
MECHANICS OF SOLIDS
2
IV. PROCEDURE:
1. Select the load by rotating the Knob and fix the suitable indenter.
2. Clean the test-piece and place n the special anvil or work table of the
machine.
3. Turn the capstan wheel to elevate the test specimen into contact with the
indenter point.
4. Further turn the wheel for three rotations forcing the test specimen against
the indenter. This will ensure that the Minor load of 98.07 N has been
applied
5. Set the pointer on the Scale dial at the appropriate position.
6. Push the lever to apply the Major load. A Dash Pot provided in the loading
mechanism to ensure that the load is applied gradually.
7. As soon as the pointer comes to rest pull the handle in the reverse
direction slowly. This releases the Major, but not Minor load. The pointer
will now rotate in the reverse direction.
8. The Rockwell hardness can be read off the scale dial, on the appropriate
scale, after the pointer comes to rest.
V. OBSERVATIONS:
Material of test piece =
Thickness of test piece =
Hardness Scale used =
Minor Load =
Major Load =
Test No. 1 2 3 4
Hard ness value

AURORA’S TECHNOLOGICAL AND RESEARCH INSTITUTE,UPPAL,HYD
DEPARTMENT OF MECHANICAL ENGINEERING
MECHANICS OF SOLIDS
3
VI. PRECAUTIONS:
1. For testing cylindrical test specimen, use V-type platform.
2. Calibrate the machine occasionally using standard test blocks.
3. For thin metal prices place another sufficiently thick metal piece between
the test specimen and the platform to avoid any damage which may likely
occur to the platform.
4. After applying Major load, wait for sometime to allow the needle to come
to rest. The waiting time vary from 2 to 8 seconds.
5. The surface of the test piece should be smooth and even and free from
oxide scale and foreign matter.
6. Test specimen should not be subjected to any heating or cold working.
7. The thickness of test piece or of the layer under test should be at least 8
times the permanent increase of depth of “E”.
8. The distance between the centers of two adjacent indentation should be at
least 4 indentation to the edge of the test piece should be at least 2.5 times
the diameter of the indentation.
VII. VIVA QUESTIONS:
1. Define Hardness.
2. Applications of Rockwell Hardness A – Scale, B-Scale, C-Scale.
3. Type of Indentor used in the Three Different Scales of Rockwell Hardness
Test.
4. Different Types of Hardness Testing Methods.
5. Size of the Ball to be used in Ball Indentor of Rockwell Hardness Test.
6. Diameters of the different Balls used in Brinell Hardness Test.
7. Selection of Load in Brinell Hardness Test.
8. Selection of Load in Rockwell Hardness Test.

AURORA’S TECHNOLOGICAL AND RESEARCH INSTITUTE,UPPAL,HYD
DEPARTMENT OF MECHANICAL ENGINEERING
MECHANICS OF SOLIDS
4
Figure: Hardness Testing Machine

AURORA’S TECHNOLOGICAL AND RESEARCH INSTITUTE,UPPAL,HYD
DEPARTMENT OF MECHANICAL ENGINEERING
MECHANICS OF SOLIDS
5
2. BRINELL HARDNESS TEST
I. AIM: To determine the Brinell hardness of the given test specimen.
II. APPARATUS: Brinell hardness machine, test specimen. Brinell Microscope
III. THEORY:
INDENTATION HARDNESS-A number related to the area or to the depth of
the impression made by an indenter or fixed geometry under a known fixed load.
This method consists of indenting the surface of the metal by a hardened steel ball
of specified diameter D mm under a given load F(kgf) and measuring the average
diameter d mm of the impression with the help of Brinell microscope fitted with a scale.
The Brinell hardness HB is defined, as the quotient of the applied force F divided by the
spherical area of the impression
HB = Test load in kgf/surface area of indentation
= 222 )(
2
mmkg
dDDD
F
IV. PROCEDURE:
1. Select the proper size of the ball and load to suit the material under test
2. Clean the test specimen to be free from any dirt and defects or blemishes.
3. Mount the test piece surface at right angles to the axis of the ball indenter plunger.
4. Turn the platform so that the bal is lifted up.
5. By shifting the lever apply the load and wait for some time.
6. Release the load by shifting the lever.
7. Take out the specimen and measure the diameter of indentation by means of the
Brinell microscope.

AURORA’S TECHNOLOGICAL AND RESEARCH INSTITUTE,UPPAL,HYD
DEPARTMENT OF MECHANICAL ENGINEERING
MECHANICS OF SOLIDS
6
8. Repeat the experiment at other positions of the test piece.
9. Calculate the value of HB.
V. OBSERVATIONS:
Test Piece Material =
Diameter of Ball “D” =
Load selection F/D2 =
Test Load F =
Load application time =
Least count of Brinell Microscope =
HB = 222 )(
2
mmkg
dDDD
F
Sl.No.
Impression Diameter F
in kG
T
in sec
D
in mm
HB
Kg/mm2 d1 d2
2
21 dd
Average value of HB =
VI. PRECAUTIONS:
1. The surface of the test piece should be clean.
2. The testing machine should be protected throughout the test from shock or
vibration.
3. The test should be carried out at room temperature.
4. The distance of the center of the indentation from the edge of the test piece
should be at least 2.5 times the diameter of the indentation and the
distance between the center of two adjacent indentations should be at least
4 times the diameter of the indentation.

AURORA’S TECHNOLOGICAL AND RESEARCH INSTITUTE,UPPAL,HYD
DEPARTMENT OF MECHANICAL ENGINEERING
MECHANICS OF SOLIDS
7
5. The diameter of each indentation should be measured in two directions at
right angles and the mean value of the two readings used for the purpose
of determining the hardness number.
LIST OF PARTS
1. MAIN LEVER 2. HANGER
3. HANGER VE (FEMALE) 4. HANGER VEE (MALE)
5. WEIGHT HANGER 6. WEIGHT
7. BOTTOM WEIGHT 8. COVER
9. FRAME 10. OPERATING LEVER
11. SPINDLE SPRING 12. SPINDLE SHAFT
13. MAIN NKIFE EDGE 14. PIVOT VEE
15. PIVOT KNIFE EDGE 16. SPINDLE BUSHING
17. SPINDLE 18. BALL HOLDER
19. FLATANVIL 20. ADAPTOR
21. ELEVATING SCREW 22. ADAPTOR
23. HAND WHEEL 24. METERING VALVE
FIGURE: BRINELL HARDNESS TESTING MACHINE

AURORA’S TECHNOLOGICAL AND RESEARCH INSTITUTE,UPPAL,HYD
DEPARTMENT OF MECHANICAL ENGINEERING
MECHANICS OF SOLIDS
8
3. IZOD IMPACT TEST
I. AIM: To perform the Izod Impact test on Metals.
II. APPARATUS: Izod impact testing machine, test specimen, verniar caliper,
steel rule
III. THEORY:
IMPACT STRENGTH: The high resistance of material to fracture under
suddenly applied loads.
The types of test pieces are used for this test as given.
i. Square cross-section ii. Round cross-section
The specimens may have single, two or three notches. The testing machine should
have the following specifications. Angle between top fce of grips and face holding the
specimen vertical = 900 Angle of tip of hammer = 75
0 1
0
Angle between normal to the specimen and the underside face of the
Hammer at striking point = 100 1
0
Speed of hammer at impact = 3.99 m/sec
Striking energy = 168 N-M or Joules.
Angle of drop of pendulum = 900
Effective weight of pendulum = 21.79 kg.
Minimum value of scale graduation = 2 Joules.
Permissible total friction loss of corresponding energy = 0.50%
Distance from axis of rotation of distance between base of specimen notch and the point
of specimen hit by the hammer = 22 mm 0.5 mm.
The longitudinal Axis of the test piece shall lie in the plane of swing of the center of
gravity of the hammer. The notch shall be positioned so that it is in the plane of the
hammer. The notch shall be positioned so that its plane of symmetry coincides with the
top face of the grips. For setting the specimen. The notch impact strength I is calculated
according to the following relation.
I=K/A
Where I = Impact Strength in Joules/m2

AURORA’S TECHNOLOGICAL AND RESEARCH INSTITUTE,UPPAL,HYD
DEPARTMENT OF MECHANICAL ENGINEERING
MECHANICS OF SOLIDS
9
IV. PROCEDURE:
1. For conducting Izod test, a proper striker is to be fitted firmly to the
bottom of the hammer with the help clamping piece.
2. The latching take for Izod test is to be firmly fitted to the bearing housing
at the side of the columns.
3. Adjust reading pointer along with pointer carrier on 168 J reading on the
dial when the pendulum is hinging free vertically.
4. The frictional loss of the machine can be determined by free fall test.
Raise the hammer by hands and latch in. Release the hammer by operating
liver, the pointer will then indicate the energy loss due to friction. From
this reading confirm that the friction loss is not exceeding 0.5% of the
initial potential energy. Otherwise friction loss ha to be added to the final
reading.
5. Now raise the pendulum by hands and latch in with latch
6. The specimen for Izod test is firmly fitted in the specimen support with the
help of clamping screw and élan key. Care is to be taken that the notch on
the specimen should face to pendulum striker.
7. After ascertaining that there is no person in the range of swinging
pendulum. Release the pendulum to smash the specimen.
8. Carefully operate the pendulum brake when returning after one swing to
stop the oscillations.
9. Read off position of reading pointer on dial and not indicated value.
10. Remove the broken specimen by loosening the clamping screw.
The notch impact strength depends largely on the shape of the specimen and the notch.
The values determined with other specimens therefore may not be compared with each
other.
V. OBSERVATION TABLE:
Sl.No. A
Area of Cross-section of Specimen
K
Impact Energy
Absorbed
I
Impact Strength

AURORA’S TECHNOLOGICAL AND RESEARCH INSTITUTE,UPPAL,HYD
DEPARTMENT OF MECHANICAL ENGINEERING
MECHANICS OF SOLIDS
10
FIGURE : IZOD & CHARPY IMPACT TEST

AURORA’S TECHNOLOGICAL AND RESEARCH INSTITUTE,UPPAL,HYD
DEPARTMENT OF MECHANICAL ENGINEERING
MECHANICS OF SOLIDS
11
4. DEFLECTION TEST ON A SIMPLY SUPPORTED BEAM
III. AIM:
This experiment is to demonstrate the effect of span of a simply supported
beam on deflection of the beam.
The effect of young’s modulus of the material of the beam using different
materials bars.
The effect of type of cross section on the deflection because of the effect
of moment of inertia of the beam.
III. THEORY:
A beam with a span L and is supported at both ends by knife edges. Let the
moment of inertia of the Beam is ‘I’ about it’s neutral axis and the Young’s
Modulus be ‘E’.
Figure:
Moment of Inertia about the neutral axis I = 12
3bh
Deflection at the center of span where the load is acting =
The deflection at the center (Max deflection) is related to the load ‘W’. Span ‘L’
moment of Inertia ’I’, and Young’s Modulus ‘E’ through the equation.
= EI
WL
48
3
We can observe that
i. If load is doubled deflection will also be doubled
ii. If span is doubled deflection increases by 8 times.
AURORA’S TECHNOLOGICAL AND RESEARCH INSTITUTE,UPPAL,HYD
DEPARTMENT OF MECHANICAL ENGINEERING
MECHANICS OF SOLIDS
12
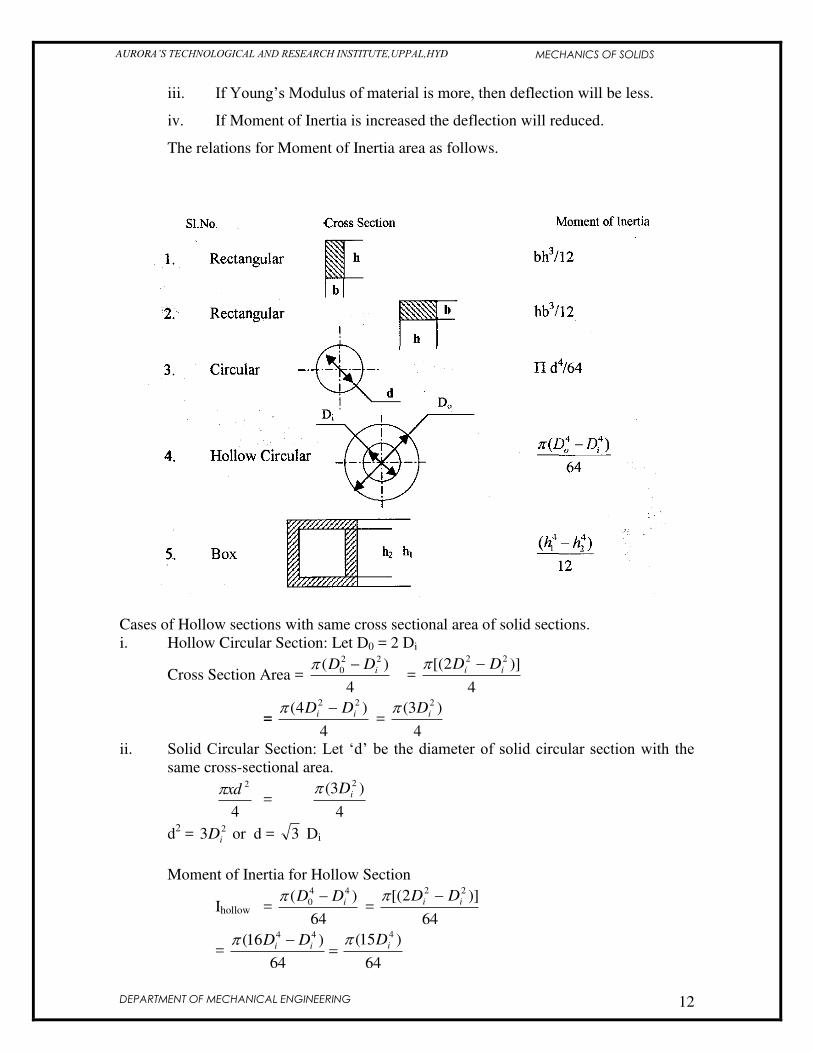
iii. If Young’s Modulus of material is more, then deflection will be less.
iv. If Moment of Inertia is increased the deflection will reduced.
The relations for Moment of Inertia area as follows.
Cases of Hollow sections with same cross sectional area of solid sections.
i. Hollow Circular Section: Let D0 = 2 Di
Cross Section Area = 4
)( 22
0 iDD =
4
)]2[( 22
ii DD
= 4
)4( 22
ii DD =
4
)3( 2
iD
ii. Solid Circular Section: Let ‘d’ be the diameter of solid circular section with the same cross-sectional area.
4
2xd =
4
)3( 2
iD
d2 = 23 iD or d = 3 Di
Moment of Inertia for Hollow Section
Ihollow = 64
)( 44
0 iDD =
64
)]2[( 22
ii DD
=
64
)16( 44
ii DD64
)15( 4
iD

AURORA’S TECHNOLOGICAL AND RESEARCH INSTITUTE,UPPAL,HYD
DEPARTMENT OF MECHANICAL ENGINEERING
MECHANICS OF SOLIDS
13
Moment of Inertia for Solid Section
Isolid = 64
]9[
64
]3[
64
)(444
ii DDd
Hollow section has more ‘I’ than solid section with same cross-sectional area.
Some comments on sections of Beams & Materials.
i. Hollow section with same cross sectional area of a solid section; will have
more load carrying capacity and hence more stiffness.
ii. Beams area used with depth longer than width because of more Moment
of Inertia for the same cross-sectional area.
iii. Mild Steel is stiffer than Aluminum because the Young’s Modulus of the former material is bigger.
Concept of stiffness of Beam’s in Bending (Kb)
Stiffness of component in bending is defined as the ration of load required for unit
deflection in bending.
Bending stiffness Kb = W/
In the case of Simply supported Beam with control loading the Stiffness
Kb = 3
48
L
EI
Hence
i. If E is doubled Stiffness will be doubled.
ii. If Moment of Inertia is doubled Stiffness will be doubled.
iii. If the Distance of load is doubled the Stiffness reduced by 1/8 times.
iv. Higher the Stiffness lesser will be the deflection of beam for the same load
applied.
IV. EXPERIMENTAL SET-UP: The set-up contains the following
1. Two knife edges and supporting stands for beam.
2. Beams of different section
3. Loading arrangement along with different weights
4. Dial gauge with magnetic stand.
5. Measuring tape or Steel Scale.
XIII. PROCEDURE:
i. Set the beam horizontally on the two knife edges.
ii. Measure the span of Beam L (distance from clamp end to loading point)
iii. Fix the dial gauge under the beam at the loading point middle of the span
to Read down-ward moment and set to zero.
iv. Hang the loading Pan at the mid point of the beam span.
v. Load the Beam with different loads(W) and note the dial gauge readings
().

AURORA’S TECHNOLOGICAL AND RESEARCH INSTITUTE,UPPAL,HYD
DEPARTMENT OF MECHANICAL ENGINEERING
MECHANICS OF SOLIDS
14
vi. Change the span of beam for two more different lengths repeat the
experiment.
vii. Change the position of Beam and repeat the experiment for the other value
of I for rectangular cross-section.
XIV. PRECAUTIONS :
i. Beam should be positioned Horizontally
ii. The span of the Beam should be measured properly
iii. The dial gauge spindle knob should always
iv. Loading hanger should be placed at center of the Beam length.
v. All the errors should be eliminated while taking readings.
vi. Elastic limit of the Beam should not exceeded.
XV. OBSERVATIONS:
a) Independent Variables: 1. Load
2. Span
3. Moment of Inertia (By choosing different sections)
4. Young’s Modulus (By choosing different Materials)
Sl.
No.
Beam
Material
Cross
Section
Y.M.
E
N/mm2
M.I.
I mm4
Span
L mm
Load
W in
N
Deflection
in mm
Bending
Stiffness
N/mm
XVI. GRAPHS:
Deflection Vs W, L, I and E
Stiffness Vs W, L, I and E
XVII. CONCLUSION:

AURORA’S TECHNOLOGICAL AND RESEARCH INSTITUTE,UPPAL,HYD
DEPARTMENT OF MECHANICAL ENGINEERING
MECHANICS OF SOLIDS
15
XVIII. VIVA QUESTIONS:
1. Give Equation for maximum Deflection, Maximum Bending Moment,
Maximum Slope in the case of Cantilever. Simply Supported Beam, Fixed
Beam and a Continuous Beam with Three Supports.
2. For the same cross sectional area and span give in the increasing order the
values of i) Square Section, ii) Rectangular Section with ‘h’ > ‘b’ and ‘h’ < ‘b’, iii) Hollow Square Section, iv) Circular Section.
3. Define Point of Contraflexure, Stiffness, Shear Force and Shear Stress in
Beams in Bending.

AURORA’S TECHNOLOGICAL AND RESEARCH INSTITUTE,UPPAL,HYD
DEPARTMENT OF MECHANICAL ENGINEERING
MECHANICS OF SOLIDS
16
5. DEFLECTION TEST ON CANTILEVER BEAM
I. AIM:
This experiment is to demonstrate the effect of distance at which the load
acting from the fixed end on deflection of the beam
The effects of young’s modulus of the material of the beam using different materials bars.
The effect of type of cross section on the deflection because of the effect
of moment of inertia of the beam.
II. THEORY:
A Cantilever is a Beam one end of which is clamped and other end is free.
A beam with a length L and is fixed at one end and the other end is free. Let the
moment of inertia of the Beam is ‘I’ about it’s neutral axis and the Young’s
Modulus be ’E’.
Moment of inertia about the neutral axis I = 12
3bh
Deflection at the end where point load is acting =
The deflection at the end (Max deflection) is related to the load ‘W’, length ‘L’
moment of Inertia ‘I’ and Young’s Modulus ‘E’ through the equation.
= EI
WL
3
3
We can observe that
i. If load is doubled deflection will also be doubled
ii. If span is doubled deflection increases y 8 times.

AURORA’S TECHNOLOGICAL AND RESEARCH INSTITUTE,UPPAL,HYD
DEPARTMENT OF MECHANICAL ENGINEERING
MECHANICS OF SOLIDS
17
iii. If Young’s Modulus of material is more, then deflection will be less.
iv. If Moment of Inertia is increased the deflection will reduced.
Cases of Hollow sections with same cross sectional area of solid sections.
i. Hollow Circular Section: Let D0 = 2 Di
Cross Section Area = 4
)( 22
0 iDD =
4
)]2[( 22
ii DD
= 4
)4( 22
ii DD =
4
)3( 2
iD
ii. Solid Circular Section: Let ‘d’ be the diameter of solid circular section with the
same cross-sectional area.
4
2xd =
4
)3( 2
iD

AURORA’S TECHNOLOGICAL AND RESEARCH INSTITUTE,UPPAL,HYD
DEPARTMENT OF MECHANICAL ENGINEERING
MECHANICS OF SOLIDS
18
d2 = 2
13D or d = 3 Di
Moment of Inertia for Hollow Section
Ihollow = 64
)( 44
0 iDD =
64
)])2[( 44
ii DD
=
64
)16( 44
ii DD64
)15( 4
iD
Moment of Inertia for Solid Section
Isolid = 64
]9[
64
]3[
64
)(444
ii DDd
Hollow section has more ‘I’ than solid section with same cross-
sectional area.
Some comments on sections of Beams & Materials.
i. Hollow section with same cross sectional area of a solid section; will have
more load carrying capacity and hence more stiffness.
ii. Beams area used with depth longer than width because of more Moment
of Inertia for the same cross-sectional area.
iii. Mild Steel is stiffer than Aluminum because the Young’s Modulus of the former material is bigger.
Concept of stiffness of Beam’s in Bending (Kb)
Stiffness of component in bending is defined as the ration of load required
for unit deflection in bending.
Bending stiffness Kb = W/
In the case of Simply supported Beam with control loading the Stiffness
Kb = 3
3
L
EI
Hence
i. If E is doubled Stiffness will be doubled.
ii. If Moment of Inertia is doubled Stiffness will be doubled.
iii. If the Distance of load is doubled the Stiffness reduced by 1/8 times.
iv. Higher the Stiffness lesser will be the deflection of beam for the same load
applied.
IV. EXPERIMENTAL SET-UP: The set-up contains the following
i. One rigid clamping support for fixing one end of the beam.
ii. Beams of different section
iii. Loading arrangement along with different weights.
iv. Dial gauge with magnetic stand.
v. Measuring tape or Steel Scale

AURORA’S TECHNOLOGICAL AND RESEARCH INSTITUTE,UPPAL,HYD
DEPARTMENT OF MECHANICAL ENGINEERING
MECHANICS OF SOLIDS
19
V. PROCEDURE:
i. Clamp the Beam horizontally on the clamping support at one end.
ii. Measure the length of cantilever L (distance from clamp end to loading
point)
iii. Fix the dial gauge under the beam at the loading point to Read down-ward
moment and set to zero.
iv. Hang the loading Pan at the free end of the cantilever.
v. Load the cantilever with different loads (W) and note the dial gauge
readings ()
vi. Change the length of cantilever for two more different lengths repeat the
experiment.
vii. Change the position of cantilever and repeat the experiment for the other
value of I for rectangular cross-section.
VI. PRECAUTIONS: i. Beam should be positioned Horizontally
ii. The length of the cantilever should be measured properly
iii. The dial gauge spindle knob should always touch the beam at the bottom
of loading point.
iv. Loading hanger should be placed at known distance of cantilever length.
v. All the errors should be eliminated while taking readings.
vi. Elastic limit of the Bema should not exceeded.
VII. OBSERVATIONS:
a) Independent Variables: 1. Load
2. Span
3. Moment of Inertia (By choosing
different sections)
4. Young’s Modulus (By choosing different Materials)
b) Dependant Variable: Bending Deflection
c) Derived Variable: Bending Stiffness
Sl.No. Beam
Material
Cross
Section
Y.M.E
N/mm2
M.I.I.Mm4 Span
L
mm
Load
W in
N
Deflection
in mm
Bending
Stiffness
N/mm
VIII. GRAPHS:
Deflection Vs W, L, I and E
Stiffness Vs W, L, I and E
XII. CONCLUSION:

AURORA’S TECHNOLOGICAL AND RESEARCH INSTITUTE,UPPAL,HYD
DEPARTMENT OF MECHANICAL ENGINEERING
MECHANICS OF SOLIDS
20

AURORA’S TECHNOLOGICAL AND RESEARCH INSTITUTE,UPPAL,HYD
DEPARTMENT OF MECHANICAL ENGINEERING
MECHANICS OF SOLIDS
21
6. SPRING TEST
I. AIM: To determine the stiffness of the Spring and Modulus of Rigidity of the
Spring Wire.
II. MATERIAL AND EQUIPMENT:
i) Spring testing machine
ii) Springs for testing
iii) Micrometer
iv) Vernier Caliper.
III. THEORY: Springs are elastic members which distort under load and regain their
original shape when load is removed. They are used in railway carriages, Motor
Cars, Scooters, Motor Cycles, Rickshaws, Governors etc.
Types of Springs:
1. Close-coiled helical sprigs & Tension helical springs with circular
cross-section
2. Open-coiled springs & Compression helical springs with square cross-
section
3. Full-elliptical leaf springs.
4. Semi-elliptical laminated springs.
5. Cantilever leaf springs
6. Circular Springs.
According to their uses, the springs perform the following function:
i. To absorb shock or impact loading as in carriage springs.
ii. To store energy as in clock springs.
iii. To supply forces to and to control motions as in brakes and clutches.
iv. To measure forces as in spring balances.
v. To absorb the vibrations, characteristic of a member as in flexible
mounting of motors.
The springs are usually made of either high carbon steel (0.7% to 1.0%) or
Medium carbon alloy steels. Phosphor bronze, Brass and 18/8 Stain less steel.
Other metal alloys are used for corrosion resistance.
Analysis of Close-Coiled Helical Springs: (Circular Section wire)
W Axial load applied (N)
Rm Mean radius of the Coil(mm)
Do Outer Diameter of Coil (mm)
Dm (Do-d) Mean diameter of the Coil (mm)
d Diameter of the wire of the Coil (mm)
Deflection of coil (m) under the load ‘W’ C Modulus of rigidity (N/mm
2)
n Number of coils or turns.
L Lenth of wire = 2Rmn (mm)
t Shear stress (N/mm2)

AURORA’S TECHNOLOGICAL AND RESEARCH INSTITUTE,UPPAL,HYD
DEPARTMENT OF MECHANICAL ENGINEERING
MECHANICS OF SOLIDS
22
T Torque (N-mm)
IP Polar Moment of Inertia of wire = d4/32 (mm
4)
Spring index = Dm/d
Torsion Equation: rL
C
I
T
P
a) For circular section of spring with dia = d
T= Nmmd
dx
d
r
I P
16
2
32
34
= 33
81616
d
WD
d
WR
r
T mm
(where T=WRm & Rm = Dm/2)
We have L
C
I
T
P
)(64322
4
2
4Radians
Cd
nWR
dC
nRWR
CI
TL mmm
P
Deflection = Rm (mm)
= )(864
4
3
4
3
mmCd
nWD
Cd
nWR mm
or Modulus of Rigidity C = )/(8 2
4
3
mmNd
nWDm
b) For Rectangular Cross-section wire (Width = b and Thickness = h)
C = 2
33
223
/7
mmNhb
hbnWRm
c) For Square cross-section wire when ‘b’ is the side of square
C = )/(14 2
4
3
mmNb
nWRm
d) For Open coiled helical spring with circular cross-section wire, With the angle of
Helix = ,
Deflection of spring () due to axial load
=
ECd
nWRm 22
4
3sin2cossec.64
Stiffness of spring = W/

AURORA’S TECHNOLOGICAL AND RESEARCH INSTITUTE,UPPAL,HYD
DEPARTMENT OF MECHANICAL ENGINEERING
MECHANICS OF SOLIDS
23
IV. PROCEDURE:
1. By using micrometer measure the diameter of the wire of spring (d)
2. By using the vernier caliper measure the outer diameter of spring coil (Do),
3. Count the number of turns (n),
4. Insert the spring in the spring testing machine and load spring by a suitable
weight and note the corresponding axial deflection in tension or
compression.
5. Increase the load and take the corresponding axial deflection readings.
6. Plot a curve between load and deflection, shape of the curve gives the
stiffness of the spring.
7. Calculate modulus of rigidity C in N/mm2 from the readings obtained
within the elastic limit.
V. OBSERVATIONS AND CALCULATIONS:
Sl.No. Outer
dia Do
Wire
dia d.
No. of
Turns
‘n’
Mean
dia Dm
Load
W (N)
Deflection
(mm)
Stiffness
W/
Modulus
of
Rigidity
C(N/mm2)
VI. GRAPHS & RESULTS:
Load Vs Deflection
Stiffness Estimation
VII. VIVA QUESTIONS:
1. Types of Springs.
2. State Different Functions of Springs.

AURORA’S TECHNOLOGICAL AND RESEARCH INSTITUTE,UPPAL,HYD
DEPARTMENT OF MECHANICAL ENGINEERING
MECHANICS OF SOLIDS
24

AURORA’S TECHNOLOGICAL AND RESEARCH INSTITUTE,UPPAL,HYD
DEPARTMENT OF MECHANICAL ENGINEERING
MECHANICS OF SOLIDS
25

AURORA’S TECHNOLOGICAL AND RESEARCH INSTITUTE,UPPAL,HYD
DEPARTMENT OF MECHANICAL ENGINEERING
MECHANICS OF SOLIDS
26
7. TORSION TEST
I. AIM: To conduct torsion on mild steel or cast iron specimens to fine out
Modulus of Rigidity or to fine angle of twist of the materials which are
subjected to Torsion
II. MATERIAL AND EQUIPMENT:
1. A Torsion testing machine along with angle of twist measuring attachment
2. Standard specimen of mild steel or cast iron.
3. A steel rule.
4. Vernier caliper or Micrometer.
III. THEORY: For transmitting power through a rotating shaft it is necessary to
apply a turning force. The force is applied tangentially and in the plane of
transverse cross-section. The torque of twisting moment may be calculated by
multiplying to two opposite turning moments, it is said to be in pure torsion and it
will exhibit the tendency of shearing off at every cross-section which is
perpendicular to longitudinal axis.
Torsion Equation:
If T = Maximum Twisting Torque (Nmm)
= 6102
60x
N
Px
where Power (P) Transmitted by shaft in kW
and N is Revolutions per minute of shaft.
D = Diameter of a solid shaft (mm)
Do= Outer diameter of hollow shaft (mm)
Dt = Inner Moment of Inertia (mm)
IP= Polar Moment of Inertia (mm4)
For Solid shafts IP= D4/32 (mm
4)
For Hollow shafts IP = (D04-32 (mm
4)
= Shear Stress (N/mm2)
C = Modulus of Rigidity (N/mm2)
= The angle of twist in radians
L =Length of shaft under Torsion (mm)
Torsion Equation is L
C
RI
T
P
Where R = D/2 in mm for Solid shaft
R = Do/2 in mm for Hollow shaft
Torque applied T = WD/2 (Nmm) Where W is tangential load applied.
The value of Modulus of Rigidity can be find by C = PI
TLin N/mm
2
Or Angle of Twist per unit Length CI
T
L P
(Radian/mm Length)

AURORA’S TECHNOLOGICAL AND RESEARCH INSTITUTE,UPPAL,HYD
DEPARTMENT OF MECHANICAL ENGINEERING
MECHANICS OF SOLIDS
27
Assumptions made for getting Torsion Equation
1. The material of the shaft is uniform throughout
2. The shaft, circular in section remain circular after loading.
3. Plane sections of shaft normal to its axis before loading remain plane after
the torque have been applied.
4. The twist along the length of shaft is uniform throughout.
5. The distance between any two normal – sections remains the same after
the applications of torque.
6. Maximum Shear Stress induced in the shaft due to application of Torque
does not exceed its Elastic Limit.
IV. PROCEDURE:
1. Select suitable grips to suit the size of the Specimen and clamp it in the
machine by adjusting sliding Jaw.
2. Measure the diameter at about three places and take average value.
3. Choose the appropriate loading range depending upon specimen.
4. Set the maximum load pointer to zero.
5. Carry out straining by rotating the hand wheel or by switching on the
motor.
6. Load the member in suitable increments, observe and record strain
readings.
7. Continue till failure of specimen.
8. Calculate the value of Modulus of Rigidity C by using C = TL/IP taking
values of T & within Elastic Limit.
9. Plot a Torque – Twist graph (T Vs ).
10. For known value of C, per unit length /L = T/IPC
V. OBSERVATIONS:
Gauge length (L) = mm.
Diameter of the Specimen (D) = mm.
Weight (W) = Newtons,
Torque (T) = WD/2 N-mm.
Angle of twist () = 0 in degrres.
() = 0 x /180 in radians.
Polar Moment of Inertia IP = D4/32 mm
4,
Modulus of Rigidity C = TL/IP N/mm2
Sl.
No.
L
(mm)
D
(mm)
W
(N)
T
(N-mm) IP
(mm4)
C
(N/mm2)
Degrees Radians
VI. CONCLUSIONS:

AURORA’S TECHNOLOGICAL AND RESEARCH INSTITUTE,UPPAL,HYD
DEPARTMENT OF MECHANICAL ENGINEERING
MECHANICS OF SOLIDS
28
i. Modulus of Rigidity calculated will be a constant for given material,
irrespective of L, D, W & T. The differences must be explained for.
ii. Angle of twist per unit length can be calculated for known values of
Torque, Diameter of specimen and Modulus of Rigidity.

AURORA’S TECHNOLOGICAL AND RESEARCH INSTITUTE,UPPAL,HYD
DEPARTMENT OF MECHANICAL ENGINEERING
MECHANICS OF SOLIDS
29
8. TENSILE TEST
I. AIM: To conduct tensile test on a mild steel specimen and determine the
following:
i) Limit of proportionality ii) Upper yield point
iii) Ultimate strength iv) Lower yield point
v) Ultimate strength vi) Fracture Strength
vii) Young’s modulus viii) Percentage elongation
ix) Percentage reduction in area x) Duetility
xi) Toughness xii) True-Stress & true-strain
values
xiii) Malleability
II. MATERIAL & EQUIPMENT:
i) Tensile testing machine ii) Specimen
iii) Steel rule iv) Vernier caliper
v) Micrometer
III. THEORY:
The tensile test is mot applied one of all mechanical tests. In this test, a test
specimen is fixed into grips connected to a Straining device and to a load-measuring
device. (one end in stationary grips and the other in movable grips). If the applied load is
small enough, the deformation of any solid body is entirely elastic. An elastically
deformed solid will return to its original form as soon as load is removed. However if the
load is too large, the material can be deformed permanently. The initial part of the tension
curve, which represents the manner in which solid undergoes plastic deformation is
termed plastic. The stress below which the deformation is essentially entirely elastic is
known as the elastic limit of material. In some materials like mild steel the onset of
plastic deformation is denoted by a sudden drop in load indicating both an upper and
lower yield point. How ever some materials do not exhibit a sharp yield point. During
plastic deformation, at larger extensions, strain hardening cannot compensate for the
decrease in section and thus the load passes through a maximum and then begins to
decrease. At this stage the ULTIMATE STRENGTH which is defined as the ration of the
load on the specimen to original cross-sectional area, reaches a maximum value. Until
this point the deformation is uniform at all sections of the specimen. Further loading will
eventually
Usually a tension test is conducted at room temperature. And the tensile load is applied
slowly. During this test either round or flat specimens may be used. The load on the
specimen is applied mechanically or hydraulically depending on the type of testing
machine.

AURORA’S TECHNOLOGICAL AND RESEARCH INSTITUTE,UPPAL,HYD
DEPARTMENT OF MECHANICAL ENGINEERING
MECHANICS OF SOLIDS
30
3.1) Nomial/Engg. Stress and Nominal/Engg Strain:
Original C/S are = A0 (mm2) Nominal Stress = P/A0 (N/mm
2)
Original gauge length = L0(mm) Nominal Strain = L0/L0
3.2 Limit of Proportionality (Point A in Fig 9)
Stress is proportional to strain upto this point.
Nominal Stress = PA/A0
Nominal Strain = ( L0)A/L0
3.3 Elastic Limit (Point B in Fig.9)
When the load is removed at “B”, the specimen will go back to original dimension
ie.e.L0 and A0
Nominal Stress = P0/A0
3.4 Upper Yield (point C in Fig.9)
Nominal Stress = P0/A0
Nominal Strain = (L0)c/L0
3.5 Lower Yield point (Point D in Fig.9)
Nominal Stress = PD/A0
Nominal Strain = (L0)D/L0
3.6 Ultimate Load or Maximum Load Point (Point E in Fig.9)
Nominal Ultimate Stress = PE/A0
Nominal Strain = (L0)E/L0
3.7 Fracture Load Pont F(Point F in Fig.9)
Nominal Fracture stress = PF/A0
Nominal Strain at fracture = (L0)F/L0
3.8 Young’s Modulus (E) Young Modulus (E) = Stress / strain
(in the elastic region limit of Proportionality
= Nominal Stress at A/Nominal Strain at A
3.9 Modulus of Resilience = (Nominal stress at elastic limit)2/2E
( Area under Engg. Stress-Strain diagram upto elastic limit)
3.10 Resilience = Modulus of Resilience X Volume of specimen undergoing tensile
stress.
3.11 Yield Point Elongation
Elongation taking place in the specimen from C to D’. This is taking place without increase in stress.
3.12 Modulus of toughness
Area under Engineering stress-strain diagram upto fracture.
3.13 Toughness = Modulus of toughness x Volume of specimen

AURORA’S TECHNOLOGICAL AND RESEARCH INSTITUTE,UPPAL,HYD
DEPARTMENT OF MECHANICAL ENGINEERING
MECHANICS OF SOLIDS
31
This indicates the amount of energy absorbed by the specimen before fracture
takes place.
3.13 Malleability:
It is the ability of the material to undergo plastic deformation prior fracture under
Compressive Loading conditions. In a tensile test it is approximated as percentage
reduction in cross sectional area of the specimen.
Malleability = (A0 - Af)/A0) X 100
4. True Stress – True strain diagram
Engineering stress is calculated based on original cross sectional area (A0) but not
on the actual cross sectional area at load ‘ P’.
True stress = P/A = P/A0 X A0/A
Since volume remains constant during plastic deformation we have A0L0 = AL
True Stress = P/A0 X L/L0
= P/A0 X (L0 + L0) / L0)
= P/A0 X (1+L0) / L0) = p(1+e)
= Normal stress (1+Nominal strain)
True Strain = = In(1+e)
These relations are valid upto ultimate load ie. Upto which the strain is uniform
all along he gauge length.
4.1 True Stress at Upper Yield Point
= Nominal stress at upper yield point (1+ec)
True strain C = In(1+ec)
4.2 True Stress at Ultimate Load (Point EI)
= Nominal ultimate stress (1+eE)
True strain at ultimate load = In(1+eE)
4.3 True Stress at Fracture (At point FI)
True stress at fracture = Pf/Af
Where Af is the area of cross section at fracture can be measured.
True strain at Fracture = In (A0/Af)
Area relation is taken instead of lengths because the strains are localized in the
region between ultimate load point and Fracture point.
4.4 Strain Hardening
From lower yield point onwards increase in load is required for increase in strain.
Thus the stress required for further deformation is more. This phenomenon is
called strain hardening.
4.5 True-Stress-True Strain Curve in log-log co-ordinates
When the True – stress and True strain are plotted on log-log co-ordinates the
curve looks as in Fig.2 i.e. Straight line.

AURORA’S TECHNOLOGICAL AND RESEARCH INSTITUTE,UPPAL,HYD
DEPARTMENT OF MECHANICAL ENGINEERING
MECHANICS OF SOLIDS
32
4.6 Ductile and Brittle Materials
If a material fails without much plastic deformation it can be called brittle. If the
percentage elongation at fracture is less than 2.5 the material is classified as
brittle. Ex Grey Cast Iron
- Usually the metals with F.C.C and CPH structures are highly ductile. Ex
Al, Cu, Ag, Au etc.
IV. PROCEDURE:
1. Measure the originals gauge length and diameter of the specimen.
2. Insert the specimen into grips of the test machine
3. Begin the load application and record load versus elongation data
4. Take readings more frequently as yield point is approached
5. Measure elongation values
6. Continue the test till fracture occurs.
7. By joining the two broken halves of the specimen together measure the
final length and diameter of specimen at fracture.
V. RESULTS & DISCUSSIONS
a) Plot the Engg. Stress stain curve and determine the following
i) Limit of proportionality = (N/mm2)
ii) Yield strength = (N/mm2)
iii) Ultimate Strength = (N/mm2)
iv) Young’s modulus = (N/mm2)
v) Percentage Elongation = %
(Ductility)
vi) Percentage reduction in area = %
vii) Fracture Strength = (Nominal / Engg)
viii) Toughness = area under Stress-Strain curve up to fracture
ix) Malleability
b) Plot True-Stress, True-strain curve after calculating true-Stress and True-strain
values at various points.
Estimate I) Strength coefficient
ii) Strain hardening coefficient
c) Determine whether the material is Ductile or Brittle?
d) Comment on the results.
VI. PRECAUTIONS:

AURORA’S TECHNOLOGICAL AND RESEARCH INSTITUTE,UPPAL,HYD
DEPARTMENT OF MECHANICAL ENGINEERING
MECHANICS OF SOLIDS
33
VII. VIVA QUESTIONS:
Define the following terms
1. Elasticity. 2. Plasticity
3. Rigidity 4. Ductility
5. Toughness 6. Brittleness
7. Stress. 8. Strain
9. Tensile Stress 10. Shear Stress
11. Limit of Proportionality 12. Elastic Limit
13. Yield Point 14. Upper Yield Point
15. Lower Yield Point 16. Strain Hardening.
17. Proof Stress. 18. Modulus of Resilience.
19. Resilience. 20. Percentage Elongation
21. Percentage Reduction in Area 22. True Stress
23. True Strain 24. Ultimate Strength
25. Breaking Strength 26. Elastic Constants
27. Young’s Modulus 28. Shear Modulus or Modulus
or Rigidity
29. Bulk Modulus 30. Poissons/Ratio
31. Modulus of Elasticity for Mild Steel, Copper, Aluminum, Cost Iron etc.
32. Examples for Ductile Materials
33. Examples for Brittle Materials
34. Examples for Malleable Materials .
35. Failure of Ductile Material under Tension
36. Failure of Brittle Material under Tension.
.

AURORA’S TECHNOLOGICAL AND RESEARCH INSTITUTE,UPPAL,HYD
DEPARTMENT OF MECHANICAL ENGINEERING
MECHANICS OF SOLIDS
34

AURORA’S TECHNOLOGICAL AND RESEARCH INSTITUTE,UPPAL,HYD
DEPARTMENT OF MECHANICAL ENGINEERING
MECHANICS OF SOLIDS
35

AURORA’S TECHNOLOGICAL AND RESEARCH INSTITUTE,UPPAL,HYD
DEPARTMENT OF MECHANICAL ENGINEERING
MECHANICS OF SOLIDS
36
9. SLOPE MEASUREMENT ON CANTILEVER BEAM
I. AIM : The aim of this experiment is to-
Study the variation of slope at the end of a cantilever beam with the load applied
at the free end
Infer the modulus of elasticity of the material of the beam
Learn the use of lamp, mirror and scale arrangement for angle measurement.
II. THEORY :
To a first level of approximation and confined to the realm of linear elastic
mechanics, the slope of a cantilever at the end when loaded transversely at the end
is a function of the applied load, length of the beam, sectional moment of inertia,
and the modulus of elasticity of the material of the beam.
The relationship is expressed as (Fig. 1)
(dy / dx) = tan ө ~ ө (for small values of ө) and,
tan ө = ( W L2 ) / 2 E I
where, ө is the slope of the beam at the free end,
W is the applied load,
L is the length of the beam,
I is the moment of inertia of the section, (= b.d3
/12 ), and,

AURORA’S TECHNOLOGICAL AND RESEARCH INSTITUTE,UPPAL,HYD
DEPARTMENT OF MECHANICAL ENGINEERING
MECHANICS OF SOLIDS
37
E is the modulus of elasticity of the material of the beam
The principle of measurement is as follows
In this experiment we measure the slope at the free end of the beam using a
‘Lamp, mirror and scale arrangement’ (Fig. 2 )
If the screen is at a distance of ‘D’, from the mirror mounted on the object, an angle ‘ө’ turned by the object results in a turn of 2 ө of the light beam.
Therefore, ө = (1 / 2) x measured angle of the turn of the beam
For small values of ө tan ө = ½ tan (2 ө) = p /( 2. D )
If ө is measured experimentally, and other parameters measured, we can find out
E as follows.
E = ( W/p) . ( L2. D/ I)
III. EXPEIMENTAL SET UP :
The set up consists of the following
i. A rigid clamping support for fixing the cantilever beam at one end.
ii. Loading arrangement with different weights
iii. Light source in the form of a thin laser beam mounted on stand
iv. A screen to receive the reflected light
v. A scale to measure the displacement of the reflected beam

AURORA’S TECHNOLOGICAL AND RESEARCH INSTITUTE,UPPAL,HYD
DEPARTMENT OF MECHANICAL ENGINEERING
MECHANICS OF SOLIDS
38
IV. PROCEDURE :
1. Clamp the beam at the desired location
2. Measure the length of the cantilever beam (distance from clamped end to
the centre of the mirror) and its cross section dimensions
3. Measure the distance between the mirror mounted on the beam and the
screen.
4. Fix the laser light to receive the image of the beam reflected back on the
screen.
5. Mark the position of the beam on the scale.
6. Apply load on the beam in steps.
7. For every load step, mark the position of the reflected beam on the scale
and measure its distance
IV. PRECAUTIONS :
1. The beam should be clamped rigidly and horizontally
2. Displacement of the light beam to be measured accurately
3. The size of cross section of the beam to be measured accurately with
Vernier scale.
4. Loading of the beam to be within elastic limit.
V. OBSERVATIONS :
a) Independent variables : 1. Load
2. Beam Span
3. Moment of Inertia
4. Distance of beam from the screen
b) Dependent variables:
1. Displacement of the light beam
S.
No.
Distance
D
mm.
Length of
Span L
mm.
Depth of
beam d
mm.
Width
w of
beam
mm.
Load
W
kg
Beam
movement
mm.
Remarks
VI. GRAPHS :
1. Load v/s displacement of the light beam
VII. CONCLUSION: