1 Robust diagnosis DLBCL from gene expression data from different laboratories Dimacs Workshop, June...
34
1 Robust diagnosis DLBCL from Robust diagnosis DLBCL from gene expression data from gene expression data from different laboratories different laboratories Dimacs Workshop, June 22, 2005 Gyan Bhanot, IBM Research
-
date post
19-Dec-2015 -
Category
Documents
-
view
219 -
download
3
Transcript of 1 Robust diagnosis DLBCL from gene expression data from different laboratories Dimacs Workshop, June...

1
Robust diagnosis DLBCL from gene Robust diagnosis DLBCL from gene expression data from different expression data from different
laboratories laboratories
Dimacs Workshop, June 22, 2005
Gyan Bhanot, IBM Research

2
Collaborators:
Gabriela Alexe1
Arnold Levine2,3
Gustavo Stolovitzky1 1 IBM2 IAS3 UMDNJ

3
Overview Overview
Motivation
Pattern-based meta-classifiers
Case study – compare data from two labs for
DLBCL vs FL diagnosis

4
Motivation Cancer is a genetic/proteomic disease
Genetic mutations/virus’s/radiation modify pathways
to create survival advantage for damaged cell
Gene Arrays are a way to study the variation of
mRNA levels between diseased and healthy cells.
This allows diagnosis and inference of pathways that
cause disease

5
Cancer diagnosis:Cancer diagnosis:
InputTraining (biomedical / proteomic, microarray) data:
k 2 classes (m samples) described by N >> features
OutputCollection of robust biomarkers, modelsRobust, accurate classifier /
tested on out-of-sample data

6
Data preprocessingCreating training and test dataNormalizationNoise estimation
Robust feature selectionFiltering Support set selection
Artificial Neural Networks
Support Vector Machines
Weighted Voting System (LAD)
k-Nearest Neighbors
Decision Trees(C4.5)
Logistic Regression
Pattern data(training)
Raw data(training)
Principal Components
META-CLASSIFIERValidation(test data)
Input data
Calibration
INDIVIDUAL CLASSIFIERS
INTERMEDIATE CLASSIFIERS
Classifier (Weighted Voting)
Biology-based feature selectionFilteringSupport set selection

7
Strategy of present paperStrategy of present paper
1. Transform original data to “pattern ” space
2. Find robust sets of biomarkers with significant collective
discriminatory power
3. Use many machine learning tools on original and pattern data
ANN, SVM, kNN, Weighted voting, Classification trees
4. Validate the results on data from a different lab

8
PatternsPatterns
Observed dataset System response

9
Positive patterns Negative patterns
Pattern basicsPattern basics
x1,..., xn Rn |i xi ,i I, x j j , j J

10
Individual classifiers usedIndividual classifiers used
SVM, ANN, WV, KNN, CART, LR
Trained / calibrated (leave-one-out):
raw data
pattern data

11
Application: Progression of Follicular Lymphoma (FL) to Diffuse Large B Cell Lymphoma (DLBCL) Gene Array data from different laboratories
Shipp et al. (2002) Nature Med.; 8(1), 68-74. (Whitehead Lab)
Stolovitzky G. (2005) In Deisboeck et al Complex Systems Science in BioMedicine (in press) (preprint: http://www.wkap.nl/prod/a/Stolovitzky.pdf). (DellaFavera Lab)
Alexe et al (2005) Artificial Intelligence in Medicine (in press)

12
Non-Hodgkin lymphomas
FL low grade non-Hodgkin lymphoma
t(14;18) translocation: over-expression of anti-apoptotic bcl2
25-60% FL cases evolve to DLBCL
DLBCL high grade non-Hodgkin lymphoma
< 2 years survival if untreated
Biomarkers: FL transformation to DLBCL• p53/MDM2 (Moller et al., 1999)
• p16 (Pyniol, 1998)
• p38MAPK (Elenitoba-Johnson et al., 2003)
• c-myc (Lossos et al., 2002)

13
Lymphoma datasetsLymphoma datasets
Data: WI (Shipp et al., 2002) Affy HuGeneFL
CU (DallaFavera Lab, Stolovitzky, 2005) Affy Hu95Av2
Samples:
WI: 58 DLBCL & 19 FL
CU: 14 DLBCL & 7 FL
Genes:
WI: 6817
CU: 12581

14
Data Preprocessing
50 % P calls, UL = 16000, LL = 20 2/1 stratify WI data to train/test. CU data testCompute SD per gene across samplesNormalize data to mean 0, SD 1 per geneGenerate 500 data sets using noise + k fold
stratified sampling + jacknife Find genes with high correlation to
phenotype using t-test or SNR. Keep genes that are in > 450/501 of datasets

15
Choosing Support SetsChoosing Support Sets
Create good patterns using small subsets of genes, validate using weighted voting with 10 fold cross validation
Sort genes by their appearance in good patterns
Select top genes to cover each sample by at least 10 patterns

16
The 30 genes that The 30 genes that
best distinguish best distinguish
FL from DLBCLFL from DLBCLG
ene
sym
bol
Ship
p e
t a
l.
Gene
s@
Work
t-te
st
p5
3 r
eg
ula
ted
Bio
log
ical
function
SEPP1 * * * oxidative stress
TXNIP * * metastases suppressor
DNASE1L3 * * apoptosis
CDH11 * * * cell adhesion
LUCA15 * apoptosis
GPR18 * * * signaling pathway
CLU * * * apoptosis
LY9 * * cell adhesion
RHOH * * T-cell differentiation
ELF2 transcription
CCNG2 * cell cycle
CR2 complement activation
CDKN2D * cell cycle
PPP2R5C * signal transduction
G18 cell growth
LY86 * apoptosis
ARPC1B cell motility
MCM7 * * * * cell cycle
BCL2A1 * * * apoptosis
IMPDH2 * * GMP biosynthesis
RRP45 * immune response
STAT1 NF-kappaB cascade
DLG7 * * * cell-cell signaling
SLC1A5 * * transport
TUBB2 * * microtubule movement
PSMA6 protein catabolism
PSMC1 * * * spinocerebellar ataxia
LGALS3 * * * sugar binding
CLTA * * transport
PAGA * * cell proliferation

17
Examples of FL and DLBCL patternsExamples of FL and DLBCL patterns
Pos Neg Pos Neg
P1 >- 1.13 >- 0.62 97 0 91 23
P2 0.91 >- 0.77 95 0 79 31
N1 >- 0.26 - 0.55 0 100 3 54
Training set Test set
Gene Symbol
Pattern
Prevalence (%)
GPR18 CLU DLG7 MCM7
WI training data:
Each DLBCL case satisfies at least one of the patterns P1 and P2
Each FL case satisfies the pattern N1 (and none of the patterns P1 and P2)

18
Pattern dataPattern data
WI training data
WI test data
Positive patterns
Negative
patternsD
LB
CL
FL
CU test data
19
Meta-classifier performanceMeta-classifier performance
Sensitivity (%)
Specificity (%)
Error rate(%)
Sensitivity (%)
Specificity (%)
Error rate(%)
ANN 0.08 94.74 92.31 5.88 82.35 84.62 17.02SVM 0.08 97.37 92.31 3.92 97.06 76.92 8.51kNN 0.09 97.37 100.00 1.96 91.18 84.62 10.64WV 0.07 92.11 92.31 7.84 94.12 76.92 10.64C4.5 0.06 94.74 84.62 7.84 94.12 69.23 12.77LR 0.07 97.37 84.62 5.88 94.12 69.23 12.77ANN 0.10 100.00 100.00 0.00 97.06 76.92 8.51SVM 0.10 100.00 100.00 0.00 97.06 76.92 8.51kNN 0.10 100.00 100.00 0.00 100.00 69.23 8.51WV 0.10 100.00 100.00 0.00 97.06 76.92 8.51C4.5 0.10 100.00 100.00 0.00 91.18 76.92 12.77LR 0.05 100.00 76.92 5.88 100.00 61.54 10.64
100.00 100.00 0.00 100.00 76.92 6.38Meta-classifier
Weight
Training Test
Tra
ined
on
raw
data
Tra
ined
on
patte
rn d
ata
Classifier

20
Error distribution: raw and pattern dataError distribution: raw and pattern data
0 10 20 30 40 50
Meta-classifier
Classifiers trained on pattern data
Classifiers trained on raw data
CU test dataWI test data

21
Biology Based MethodsBiology Based Methods
22
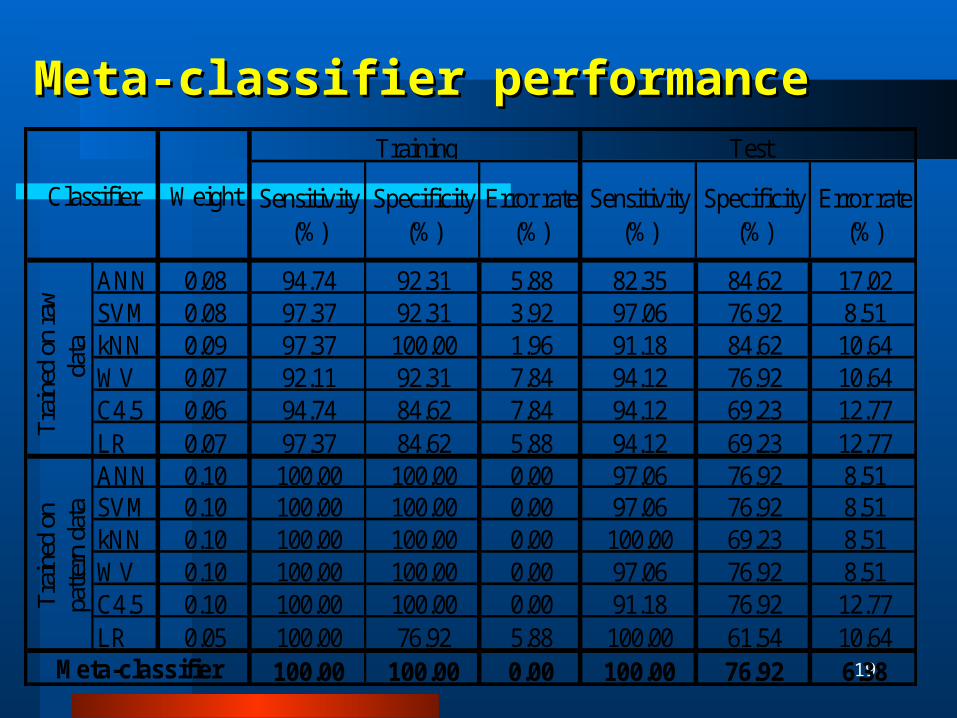
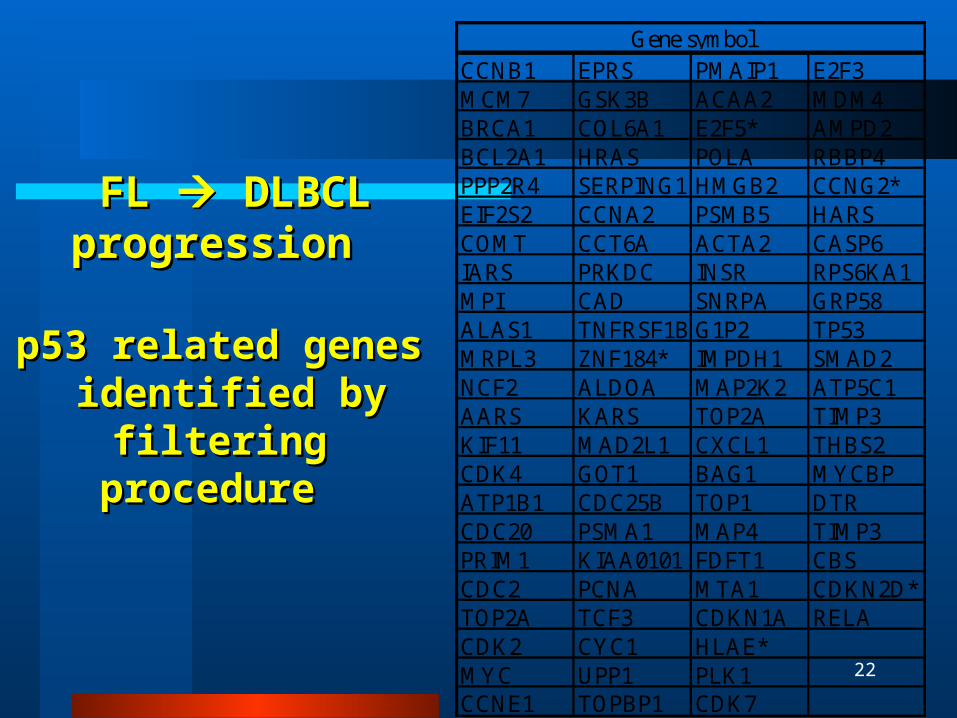
p53 related genes p53 related genes identified by filtering identified by filtering
procedure procedure
CCNB1 EPRS PMAIP1 E2F3MCM7 GSK3B ACAA2 MDM4BRCA1 COL6A1 E2F5* AMPD2BCL2A1 HRAS POLA RBBP4PPP2R4 SERPING1 HMGB2 CCNG2*EIF2S2 CCNA2 PSMB5 HARSCOMT CCT6A ACTA2 CASP6IARS PRKDC INSR RPS6KA1MPI CAD SNRPA GRP58ALAS1 TNFRSF1B G1P2 TP53MRPL3 ZNF184* IMPDH1 SMAD2NCF2 ALDOA MAP2K2 ATP5C1AARS KARS TOP2A TIMP3KIF11 MAD2L1 CXCL1 THBS2CDK4 GOT1 BAG1 MYCBPATP1B1 CDC25B TOP1 DTRCDC20 PSMA1 MAP4 TIMP3PRIM1 KIAA0101 FDFT1 CBSCDC2 PCNA MTA1 CDKN2D*TOP2A TCF3 CDKN1A RELACDK2 CYC1 HLAE*MYC UPP1 PLK1CCNE1 TOPBP1 CDK7
Gene symbol
FL FL DLBCL DLBCL progressionprogression

23
p53 pattern datap53 pattern data
WI data CU data
Positive patterns
Negative
patterns
DL
BC
LF
L

24
Examples of p53 responsive genes patternsExamples of p53 responsive genes patterns M
CM
7
CCN
B1
BCL
2A1
CCN
E1
KIA
A01
01
CD
C2
CBS
E2F
5
Pos
Neg Pos
Neg
P1 >- 0.66 >- 0.89 93 11 86 29P2 >- 0.66 >- 0.78 90 11 71 29P3 >- 0.8 >- 0.33 69 11 64 14N1 - 0.66 3 74 14 71N2 - 0.56 - 0.18 3 68 21 57N3 - 0.11 >0.11 3 68 7 71
Gene symbol
Patte
rn
Prevalence (%)
Training set Test set
WI data:Each DLBCL case satisfies one of the patterns P1, P2, P3Each FL case satisfies one of the patterns N1, N2, N3

25
p53 combinatorial biomarkerp53 combinatorial biomarker
77% FL & 21% DLBCL cases (3.7 fold) at most one gene over-expressed
79% DLBCL & 23% FL cases (3.4 fold)
at least two genes over-expressed
0
10
20
30
40
50
60
70
80
90
<= 1 >=2
# of over-expressed genes in DLBCL vs. FL
(p53, PLK1, CDK2)
% c
ases DLBCL
FL
Each individual gene: over- expressed in about 40-70% DLBCL & 20-40% FL
(specificity 50-60%, sensitivity 60-70%)

26
What are these genes?What are these genes?
Plk1 (stpk13): polo-like kinase serine threonine protein kinase 13, M-phase specific
cell transformation, neoplastic, drives quiescent cells into mitosis over-expressed in various human tumors Takai et al., Oncogene, 2005: plk1 potential target for cancer therapy, new
prognostic marker for cancer Mito et al, Leuk Lymph, 2005: plk1 biomarker for DLBCL
Cdk2 (p33): cyclin -dependent kinase: G2/M transition of mitotic cell cycle, interacts with cyclins A, B3, D, E
P53 tumor suppressor gene (Levine 1982)

27
Conclusions Conclusions
Pattern-based meta-classifier is robust against noise
Good prediction of FL DLBCL Biology Based Analysis also
possible Yields useful BiomarkerShould Study Biologically motivated
sets of genes build pathways

28Thank you for your attention !
<>

29
Artificial neural networksArtificial neural networks
Wij
Wjk

30
Support vector machinesSupport vector machines
H2 H1H
PositiveNegative
miz
xzbxw
xzbxw
w
i
i
i
zCbw
m
ii
,...,1 ,0
negative ~ ,1~positive ~ ,1~
2
1min
1
2
,
--
Find a maximum Find a maximum margin hyperplane margin hyperplane in pattern space in pattern space (Vapnik)(Vapnik)
miCyts
xxyy
ii
ii
ii
ijijiji
,...,2,1 ,0 ,0 ..
2
1min
-
(P) (D)

31
k-Nearest neighborsk-Nearest neighbors
Training data : samples in normalized peptide space Prediction for test data: The dominant class of the k-
nearest neighbors in Euclidean metric
Positive
NegativeNew case: Negative

32
Weighted votingWeighted voting
Pattern data: – each pattern P is a voter– weight = fraction of correctly classified cases
by the pattern– each test case: compute sum of weights of
triggered positive patterns and negative patterns
– classify by highest weight

33
Logistic regressionLogistic regression
Dataset of two phenotypes (e.g., cancer vs. non-cancer)
Transform into logit space y->ln(p/1-p)
Find phenotype predictor as a linear combination of data values in logit space
Insightful Miner

34
Decision trees / forestsDecision trees / forests
Find rules in training data:
– find root feature which best classifies samples by
phenotype
– iterate on each branch to find two new features
which best split each branch by phenotype
– if necessary prune weak support nodes
CART =Classification and Regression Trees (Breiman)
Many trees = forest