1 Roberts, M. R., & Gierl, M. J. Developing score reports ... · A sample diagnostic report is...
43
1 Roberts, M. R., & Gierl, M. J. Developing score reports for cognitive diagnostic assessment. AUTHOR POST PRINT VERSION Roberts, M. R., & Gierl, M. J. (2010). Developing score reports for cognitive diagnostic assessment. Educational Measurement: Issues and Practice, 29(3), 25-38.
Transcript of 1 Roberts, M. R., & Gierl, M. J. Developing score reports ... · A sample diagnostic report is...
1
Roberts, M. R., & Gierl, M. J.
Developing score reports for cognitive diagnostic assessment.
AUTHOR POST PRINT VERSION
Roberts, M. R., & Gierl, M. J. (2010). Developing score reports for cognitive diagnostic
assessment. Educational Measurement: Issues and Practice, 29(3), 25-38.
2
Abstract
This paper presents a framework to provide a structured approach for developing score reports
for cognitive diagnostic assessments. Guidelines for reporting and presenting diagnostic scores
are based on a review of current educational test score reporting practices and literature from the
area of information design. A sample diagnostic report is presented to illustrate application of the
reporting framework in the context of one cognitive diagnostic assessment procedure called the
Attribute Hierarchy Method (AHM; Gierl, Wang, & Zhou, 2008; Leighton, Gierl, & Hunka,
2004). Integration and application of interdisciplinary techniques from education, information
design, and technology are required for effective score reporting. While the AHM is used in this
paper, this framework is applicable to any attribute-based diagnostic testing method.
3
Developing Score Reports for Cognitive Diagnostic Assessments
Educational tests should provide meaningful information to guide student learning. The
recent emphasis on understanding the psychology underlying test performance has lead to
developments in cognitive diagnostic assessment (e.g. Leighton & Gierl, 2007a; Mislevy, 2006),
which integrates cognitive psychology and educational measurement for the purposes of
enhancing learning and instruction. A cognitive diagnostic assessment (CDA) is specifically
designed to measure a student’s knowledge structures and processing skills. In contrast with
reporting a small number of content-based subscores, typical of most current educational test
score reports, the results of a CDA yield a profile of scores with specific information about a
student’s cognitive strengths and weaknesses. This cognitive diagnostic feedback has the
potential to guide instructors, parents, and students in their teaching and learning processes. The
success of CDA in accomplishing its goal of providing more formative feedback to educational
stakeholders rests, in part, on the test developer’s ability to effectively communicate this
information through score reports. However, the question of how to effectively communicate
such complex and detailed information on educational tests, in general, or CDA, more
specifically, has been inadequately studied, to date.
Score reporting serves a critical function as the interface between the test developer and a
diverse audience of test users. Despite the importance of score reports in the testing process,
there has been a paucity of research in this area. The available body of research on test score
reporting has centered on large-scale reporting of aggregate-level results (i.e., at district, state,
and national levels) for accountability purposes in the United States (Jaeger, 1998; Linn &
Dunbar, 1992). Fewer studies have focused on student-level score reporting features (Goodman
& Hambleton, 2004; Trout & Hyde, 2006). General conclusions drawn from these studies are not
4
encouraging claiming that score reports are difficult to read and understand (Hambleton & Slater,
1997), often lead to inferences not supported by the information presented (Koretz & Diebert,
1993), and are not disseminated in a timely manner (Huff & Goodman, 2007).
As developments in CDA continue to progress, the need to address and overcome score
reporting issues of comprehensibility, interpretability, and timeliness become even more urgent.
Diagnostic testing information, including skills descriptions and learning concepts, is
fundamentally different in purpose from information typically reported from traditional large-
scale assessments, such as total number correct scores or percentile ranks. Test developers must
report and present new kinds of information from these diagnostic tests. In short, the challenge of
diagnostic score reporting lies in the integration of the substantive and technical information
needs of the educational community with the psychologically sophisticated information unique
to CDA. But how can test developers present diagnostic information to a non-technical audience
in a way that can be understood? To date, no such research on diagnostic score reporting exists to
answer this question. Thus, to begin to address this gap in the literature, a framework for
reporting diagnostic information is needed to ensure that the benefits of a CDA are realized with
their intended audience.
The purposes of this paper are (a) to review current test score reporting practices to
provide a context for diagnostic score reporting, (b) to review relevant literature pertinent to
presenting information in score reports, and (c) to present a structured approach for reporting
diagnostic scores based on the literature review. Application of the reporting framework is
illustrated in the context of one CDA procedure called the attribute hierarchy method (AHM;
Gierl, Wang, & Zhou, 2008; Leighton, Gierl, & Hunka, 2004) to generate sample diagnostic
reports.
5
To lay the foundations for the development of diagnostic score reporting guidelines, a
review of related research in educational measurement and information design is structured
around two components: score reporting and score report documentation. Score reporting refers
to the reporting process, focusing on characteristics of the information contained within the
report and its method of presentation. Score report documentation is subsumed under the score
reporting process, but is used to refer to the document of the actual report itself, involving
discussions around report organization and layout. These ideas are discussed separately for the
purposes of clarity.
SECTION 1: REVIEW OF CURRENT TEST SCORE REPORTING PRACTICES IN
EDUCATION
The Standards and Features of Score Reporting
Legislated and professional standards for test score reporting function, in part, to ensure
some standardization of the information reported to educational stakeholders about student
performance. These standards were created largely in the context of large-scale assessments.
With No Child Left Behind Act of 2001 (NCLB), test developers must develop ways to present
student-level results in mandated statewide assessments. NCLB requires states to:
Produce individual student interpretive, descriptive, and diagnostic reports...that allow
parents, teachers, and principals to understand and address the specific academic needs of
students, and include information regarding achievement on academic assessments
aligned with State academic achievement standards, and that are provided to parents,
teachers, and principals, as soon as practicably possible after the assessment is given, in
an understandable and uniform format, and to the extent practicable, in a language that
parents can understand. (NCLB, 2001, as cited in Goodman & Hambleton, 2004, p. 147)
6
In addition to meeting high psychometric standards, the information provided by large-scale
assessments must also meet professional standards. The Standards for Educational and
Psychological Testing (American Educational Research Association, American Psychological
Association, National Council on Measurement in Education, 1999) contains numerous
guidelines relevant to score reporting. The role of test developers in the reporting process is
exemplified within Standard 5.10:
When test score information is released to students, parents, legal representatives,
teachers, clients, or the media, those responsible for testing programs should provide
appropriate interpretations. The interpretations should describe in simple language what
the test covers, what the scores mean, and how the scores will be used. (p. 65)
The basic requirements for score reporting are clearly identified within these standards; however
the methods to achieve these standards are not. There lies an implicit assumption that results are
reported in a manner that can be readily understood and used to educational stakeholders. A
structured approach to the test score reporting process is needed to ensure that relevant score
reporting features are identified and reported.
Jaeger (1998) proposed a comprehensive research agenda for reporting results from the
National Assessment of Educational Progress (NAEP) testing program. Jaeger proposed three
questions that, when answered, should help to guide the score reporting process. First, in what
form should NAEP results be reported? Form in this context refers to the method of
summarizing student performance which includes the use of performance descriptors, obtained
through item mapping, scale anchoring or achievement levels, and scale scores. Second, how
should NAEP results be displayed? Displays of information include numeric, graphic, and
narrative forms. Third, how should results be disseminated? For example, score reports can be
7
paper based or web based; a stand alone document or with an accompanying interpretative guide.
Each of these three questions should be applied in the context of a specific audience. His report
provided an important initial attempt at providing a structure for reporting NAEP results, which
could be generalized to other research efforts on student-level score reporting.
Jaeger’s framework for reporting NAEP results can be further refined by specifying
reporting elements which are common to most reporting systems. Ryan (2003) provides a useful
framework of eight reporting features or characteristics. These characteristics include: (1)
audience for the report, (2) scale or metric for reporting, (3) reference for interpretation, (4)
assessment unit, (5) reporting unit, (6) error of measurement, (7) mode of presentation, and (8)
reporting medium.
Reviewing Current Score Reporting Practices
Goodman and Hambleton (2004) provide the most recent comprehensive review and
critique of student-level score reporting practices from large-scale assessments. Their review
showed varied practices with the kinds of information reported and their presentation. In general,
the type and number of overall scores and content-based subscores reported varied across testing
programs and contexts. Usually, two types of overall scores were reported such as scale scores,
percentile ranks, stanines, and number correct scores. Goodman and Hambleton conclude that
scale scores are the most popular method of reporting as they are ideal for the purposes of
comparing sets of scores across different groups of students and different test administrations.
Previous studies indicate interpretation of scale scores is difficult for a number of audiences
(Forsyth, 1991; Koretz & Diebert, 1993). This difficulty is best illustrated by the body of
research conducted on the reporting of NAEP results (see special issue in the Journal of
Educational Statistics, Spring 1992) which generated a line of research focusing on IRT-based
8
item mapping methods (Lissitz & Bourque, 1995; Zwick, Sentur, Wang, & Loomis, 2001) to
improve the substantive meaning behind scale scores in an attempt to increase the interpretability
of the score report.
Goodman and Hambleton’s (2004) review concluded that many of the student score
reports had promising features such as reporting information in alternate forms (i.e., narrative,
numeric, and graphic), having different reports for different audiences, and personalizing reports
and interpretative guides. However, they cite a number of weaknesses that require further
attention and research including:
1. Reporting excessive amounts of information, such as many types of overall scores,
but omitting essential pieces of information, such as the purpose of the test and
information about how test results will and should be used.
2. Information regarding the precision of test scores was not provided.
3. The use of statistical jargon.
4. Key terms were not always defined in the reports or interpretative guides, leaving
interpretations up to users and inviting inaccurate interpretations.
5. Efforts to report large amounts of information in such a small amount of space
resulted in reports that appeared dense, cluttered, and difficult to read.
These weaknesses are echoed in the results of studies on score reporting conducted over
the past 15 years which have consistently identified issues with the reporting of large-scale
assessment results (Hambleton & Slater, 1997; Impara, Divine, Bruce, Liverman, & Gay, 1991;
Koretz & Diebert, 1993). In general, these studies concluded that accurate interpretation of score
reports were influenced by multiple factors, including familiarity of the reader with statistical,
measurement, and assessment concepts, presentation of the results, and availability of
9
information to support the reader in making appropriate interpretations and inferences. More
recently, criticism around the timeliness of reporting comes from Huff and Goodman (2007) and
Trout and Hyde (2006). These researchers cited the time lag present between assessment and
reporting of the results as a limitation for using assessment results to inform classroom
instruction and learning. Turnaround time for score reports has become an issue that could
potentially be resolved using technology (i.e., web-based reporting).
Guidelines for Effective Score Reporting
Numerous guidelines for effective score reporting have emerged in the educational
measurement literature. Aschbacher and Herman (1991) reviewed relevant empirical literature
from the disciplines of psychology, communication, and business for their set of reporting
guidelines. Forte Fast and the Accountability Systems and Reporting State Collaborative on
Assessment and Student Standards (2002) also created a set of reporting guidelines with a greater
emphasis on the use of universal design principles. Universal design refers to the “design of
products and environments to be usable by all people, to the greatest extent possible, without the
need for adaptation or specialized design” (Center for Universal Design, n.d.). These studies
suggest that reporting guidelines should incorporate design principles that, when implemented,
yield score reports that are accessible to a majority of educational stakeholders. The similarity of
the guidelines identified by Aschbacher and Herman, Forte Fast et. al., and Goodman and
Hambleton, demonstrate a general agreement about how they believe this information should be
presented. Goodman and Hambleton (2004) provide specific recommendations for reporting
student-level results (with slight modifications):
1. Include all information essential to proper interpretation of assessment results in
student score reports;
10
2. Include detailed information about the assessment and score results in a separate
interpretative guide;
3. Personalize the score report and interpretative guide;
4. Include a narrative summary of the student’s results at the beginning of the score
report;
5. Identify some things parents can do to help their child improve;
6. Include sample questions in the interpretative guides; and
7. For paper copies, include a reproduction of student score reports in the interpretative
guides to explain elements of the score reports.
Concrete examples of score reports implementing these guidelines are few and varied across
states and testing programs (Goodman & Hambleton, 2004). More importantly, the effectiveness
of these guidelines requires validation through empirical studies in the context of operational
score reporting.
SECTION 2: REVIEW OF RELEVANT RESEARCH ON PRESENTING INFORMATION
Designing Score Reports: Why Look to Information Design?
Rune Pettersson (2002) defines information design as the following:
In order to satisfy the information needs of the intended receivers, information design
comprises analysis, planning, presentation and understanding of a message – its content,
language and form. Regardless of the selected medium, a well designed information set
will satisfy aesthetic, economic, ergonomic, as well as subject matter requirements.
Information design is a multidisciplinary field where the goal of communication-oriented
design is clarity of communication. (Pettersson, 2002, p. ix)
11
The field of information design embodies research from different disciplines, including
psychology, communication studies, information technology, and aesthetics, with the focus on
communicating information effectively. This research includes design guidelines applicable to
developing user-friendly score report documents and effective displays of quantitative
information, such as tables and graphs. Hence, information design principles may help us
overcome some of the persistent problems that arise in assessment score reports.
Designing Effective Text-Based Documents
A number of design techniques are available to assist a reader when reading a document.
More specifically, document elements can be structured to provide an organizing framework, or
a schema in psychological terms, to present information in a coherent and logical manner. These
techniques are grouped into two broad categories of internal and external text structuring
(Jonassen, 1982; Pettersson, 2002). Both techniques complement and interact with each other
when used to create documents that effectively communicate information.
Internal text structuring includes techniques to organize, sequence, and provide an
internal framework for understanding document content. Most readers come to expect some
imposed structure and organization of ideas. When this is not found, the text can be considered
difficult to read and understand. This problem is more persistent with longer texts with highly
technical or scientific reporting. In these instances, the use of external text structuring in
combination with internal structuring techniques can be applied to assist the reader in organizing
and comprehending information.
External text structuring includes techniques such as the use of access structures,
typographical cues, and spatial layout to structure text (Gribbons, 2002; Waller, 1982). Access
structures (Waller, 1982) combine linguistic cues with typographic and spatial cues to help the
12
reader gain access to text that is meaningfully grouped and sequenced. Waller describes access
structures as having two text functions: global and local accessibility. Global accessibility
provides an overview of the content presented and assists the reader with developing a reading
strategy (i.e., to search for and read specific parts of the text, or to read the text entirely).
Examples include: (a) table of contents, (b) glossary, (c) objectives, and (d) summaries.
Alternatively, local accessibility refers to techniques that signal or identify particular units of
text, often providing a visual structure. Examples include: (a) headings, (b) numbering systems,
and (c) lists. Headings should be accurate, specific, and concise (Hartley & Jonassen, 1985;
Swarts, Flower, and Hayes, 1980).
Typography
Typography deals with the aspects of type which can be a letter, number, or any other
character used in printing (Pettersson, 2002). Legibility is an important consideration in choosing
a particular font or typeface for readable text. It is recommended to choose a common serif
typeface (e.g., Times New Roman), which is considered easier to read, than sans-serif typefaces
(e.g., Arial) except for small letter sizes (Tinker, 1963, as cited in Pettersson, 2002, p.165). The
point size of typeface used has important implications for the length of written text. For example,
long sentences written in very small typeface are difficult to read, whereas the use of very large
typeface means fewer words per line. Schriver (1997) recommends approximately eight to 12
words per line for text presented on paper and less for text presented on a computer screen.
When presenting text in column format, Schriver emphasizes the importance of preserving the
syntactic units of the text.
Typographical cues. Typographical cues such as italics, bolding, CAPITAL LETTERS,
underlining, and color, serve as an explicit visual cue or signalling device within text. These cues
13
draw the reader’s attention to important words or sections of text and can also support the spatial
organization of the document (Gribbons, 1992). Bolding and italics is more effective for
denoting emphasis in short sections of continuous text, although long sections set in boldface or
italics is difficult to read. The use of capital letters for short headings and titles is appropriate for
emphasis, otherwise the use of both upper and lowercase typeface is recommended. The
judicious use of one or two typographical cues is warranted, as multiple or “over-cueing” may
serve to confuse the reader and unnecessarily clutter a document.
Horton (1991) and Winn (1991) argue that color can be used as a typographical cue to
signal important words or sections within an organized text. Color should be chosen to maximize
type contrast and background, such as black type on a white background, in order to maximize
legibility. Consideration should also be given to certain color choices, given that approximately
10 percent of the North American population has difficulty distinguishing colors, including red-
green and blue-yellow defects (Vaiana & McGlynn, 2002). It is recommended that information
organized using color cues should be used redundantly with other signalling devices such as
typeface or spatial cues. Factors such as resources to print documents in color, as well as
characteristics of the audience (i.e., color-deficits) will influence whether elaborate color
schemes are used on score reports.
Typographical layout and organization. Typographic and page layouts use a combination
of type, color, and spatial organization techniques to effectively structure text within a document.
The use of vertical and horizontal spacing assists with reinforcing the visual hierarchical
structuring characteristic of most documents. Gribbons (1992) claims the designation of vertical
and horizontal cues is guided by three factors. First, horizontal positioning should accommodate
the significance a reader places on information in the left-most portion of a page. This
14
positioning is readily seen in most textbooks, where titles and headings are placed flush with the
left margin, while subsequent paragraphs are indented from the margin. Second, vertical
positioning should use the principle of proximity to group conceptually similar items. For
example, the vertical space between sentences in a paragraph is small, signalling the paragraph
as one conceptual unit where larger spaces are found between separate sections or chapters,
denoting a shift between conceptual units. Third, spatial formatting should be consistent with the
structure previously established using other techniques such as local access structures and
typographical cues. For instance, the property of alignment of textual elements can be used to
reinforce the signalling relationship of headers to their corresponding text.
Designing Effective Displays of Quantitative Information
Score reports necessitate communication of quantitative information such as test scores,
percentile ranks, and error of measurement. This kind of information can be summarized
narratively, or visually using a table or graph. Numerous theories of graphical perception and
cognition currently exist in the literature (Bertin, 1983; Cleveland, 1984; Cleveland & McGill,
1985; Kosslyn, 1994; Wainer, 1999). It is beyond the scope of this paper to review these works
here and the interested reader is encouraged to refer to these references for greater detail. Two of
these major theories by Cleveland and McGill (1985) and Kosslyn (1994), draw on knowledge of
the brain for elucidating their theories of graphical perception and cognition. Cleveland and
McGill’s theory focuses on the manipulation of the perceptual features of graphs which affect the
reader’s associated cognitive processes of selecting and encoding. Kosslyn’s three “maxims”
incorporates the perceptual theories of Cleveland and McGill, but also focuses on the cognitive
processes invoked once sensory information is attended to and held in working memory.
15
The design principles for designing effective quantitative data displays are similar to
those of designing effective text: (1) using contrast to signal important information and increase
legibility, (2) using redundancy of presented information, such as the use of large typesize for
headers in addition to visual cues, (3) using proximity of similar elements, and (4) using
alignment of elements to emphasize visual structuring of information.
Choosing a Format for Displaying Information
In her summary of tabular versus graphical displays, Wright (1977) aptly states that
generalizations of research findings on the superiority of one format over another are difficult.
The decision of whether to use one format over another requires individual consideration of the
particulars to a situation including the purpose of the data display and characteristics of the
intended audience.
Tables. Tufte (2001) recommends the use of tables for small data sets showing exact
numerical values requiring local comparisons. When creating a table, Tufte discusses the use of
vertical and horizontal formatting techniques to both structure and group numerical entries.
Some evidence for this claim is provided by the documented difficulties of administrators and
educators attempting to make sense of the large summary tables used in reporting NAEP results
(Hambleton & Slater, 1997). Wainer (1992) drawing upon the work of Ehrenberg (1977) lists
some general principles for improving tabular formats. These include:
1. Rounding digits to no more than 2 decimal places;
2. Using row or column averages to provide a visual focus and a summary;
3. Using columns rather than rows to make intended comparisons;
4. Ordering the rows and columns in meaningful ways; and
5. Using white space to group figures and to guide the eye.
16
The physical display of a table should be aesthetically pleasing, open, and without excessive
clutter. Tufte advocates the use of thin lines within the table, and for aesthetic considerations,
varying the thicknesses of linework where applicable.
Graphs. The use of graphs over tables is preferable for readers if comparisons of the data
are to be made (Shah, Mayer, and Hegarty, 1999; Wright, 1977). Graphs communicate amounts,
changes, and trends in the data more accurately and can be perceived more readily. When
constructed appropriately, graphical representation can reduce the cognitive load required by the
reader to make accurate comparisons, inferences, and interpretations. The graphic format should
be compatible with its form (Kosslyn, 1994) and its intended purpose. For instance, bar graphs
are best used for static comparisons, more so than pie charts or three-dimensional figures,
whereas line graphs are best used to illustrate trends. Graphics and text should be integrated in
the document and not placed on separate pages, especially if the graph is meant to illustrate
points discussed in the text. Labels for axes and other graphical elements should be positioned
close to its referent to promote easy and accurate interpretation of information (Macdonald-Ross,
1977 as cited in Schriver, 1997).
Summary of Sections 1 and 2
Establishing a structured approach to the test score reporting process is needed to ensure
that relevant score reporting features are identified and reported. Most available research on
score reporting has been conducted with NAEP data or results from statewide assessments
(Hambleton & Slater, 1997; Jaeger, 1998, Koretz & Diebert, 1993). This data is often reported at
the aggregate level, with results often used for accountability purposes. Difficulties with reading,
understanding, and interpreting score information accurately have lead to strategies for creating
substantive meaning for reported score information in the form of IRT-based item mapping
17
strategies (Beaton & Allen, 1992; Lissitz & Bourque, 1995; Zwick et. al., 2001). Sets of
guidelines exist for score reporting, recommending the use of relevant design principles for
improving the appearance of score reports (Aschbacher & Herman, 1991; Forte Fast et. al., 2002;
Goodman & Hambleton, 2004). In particular, research reviewed from information design
promotes the creation of an organizing structure or framework to help assist the reader with
creating a coherent representation of the information presented, aiding in accurate
comprehension and interpretation. Also, research by Trout and Hyde (2006) and Huff and
Goodman (2007) identified the need to report test score information, especially for teachers, in a
timelier manner for use in planning instructional activities. The use of companion websites or
dissemination of results using the Internet appears to be a promising suggestion. Next, we
discuss reporting diagnostic results in light of the review of current test score reporting practices,
recommendations for reporting information, and designing score reports.
SECTION 3: REPORTING DIAGNOSTIC SCORES
To begin, a brief overview and rationale for the development of cognitive diagnostic
assessments with implications for score reporting is provided. Then, an adapted score reporting
framework based on the work of Jaeger (1998) and Ryan (2003) is introduced as a structured
approach for creating diagnostic score reports with any attribute-based diagnostic testing method.
Finally, a sample diagnostic score report illustrating the reporting framework applied in the
context of one CDA method called the Attribute Hierarchy Method is presented along with a
description of the reporting and design considerations.
Score Reporting and Cognitive Diagnostic Assessment
Research efforts in cognitive diagnostic assessment (CDA) have been fuelled by the
increasing demand, from both researchers and educational stakeholders, for more formative
18
information from educational tests (Huff & Goodman, 2007). Scores provided from large-scale
assessments provide minimal information about a student’s performance that can be used to
support classroom activities. This is largely due to the dominant testing paradigm in an
accountability framework with the development of large-scale educational tests that function to
assess and rank order examinees based on a unidimensional latent trait. Given this focus, it is
logical that large-scale assessments report only one overall total score. Diagnostic scores are
often conceived as content-based subscores, which are reported from assessments originally
designed to measure a unidimensional latent trait. As previously discussed, interpretation of
these scores is often difficult, the scores are open to misinterpretation, and the scores usually
require some context in the form of anchor items, achievement, or performance descriptors for
understanding what the reported test score means in terms of student performance.
The unidimensional testing paradigm is now making way for assessments designed to
model and assess multiple cognitive skills that underlie student test performance (Stout, 2001).
CDA has generated a surge of scholarly interest and activity among educational measurement
researchers. As testimony to this claim, the Journal of Educational Measurement dedicated a
special issue in 2007 to IRT-based cognitive diagnostic models and related methods. Many
diverse cognitive psychometric models (CDMs) and procedures currently exist for skills
diagnostic testing including the Multicomponent Latent Trait Model (Whitely (Embretson),
1980), Bayes Net (Mislevy, Almond, Yan, & Steinberg, 1999; Mislevy, Steinberg, & Almond,
2003), Rule Space Model (Tatsuoka, 1983, 1990, 1995), Unified Model (DiBello, Stout, &
Roussos, 1995; Hartz, 2002), deterministic input noisy and gate model (DINA; de la Torre &
Douglas, 2004; Haertel, 1999), noisy input deterministic and gate model (NIDA; Junker &
Sijtsma, 2001), and the Attribute Hierarchy Method (Gierl, Wang, & Zhou, 2008; Leighton,
19
Gierl, & Hunka, 2004). These models all share a common feature where the results of a complex
analysis yield a profile of scores based on the cognitive skills measured by the test. In contrast to
reporting one overall scaled score or multiple content-based subscores, as in large-scale
assessments, cognitive diagnostic assessments produce many scores often in the form of skill
mastery probabilities. These skill mastery probabilities serve as scores that are substantively
meaningful because the interpretations and inferences about student performance are made with
reference to the cognitive skills measured by the test. These diagnostic skill profiles can then be
used to support instruction and learning.
Currently, there are few examples of cognitive diagnostic score reports. One operational
example is the College Board’s Score Report Plus for the PSAT/NMSQT which reports
diagnostic information based on an analysis of examinee responses using a modified Rule Space
Model. Cognitive diagnostic feedback is given in the form of the top three skills requiring
improvement for each content area of Mathematics, Critical Reading, and Writing along with
recommended remedial activities. Jang (2009) also created score reports as part of a study
investigating the application of the Fusion Model to a large-scale reading comprehension test for
cognitive diagnosis. Jang used a reporting format similar to the Score Report Plus. Cognitive
diagnostic feedback was provided in the form of skill descriptors, discriminatory power of items,
and skill mastery probabilities. As developments continue to progress, current score reporting
approaches need to be recast in light of the new kinds of information yielded by CDA.
The Attribute Hierarchy Method
The reader is provided with a brief overview of the AHM as it will provide a context for
illustrating the proposed diagnostic reporting framework. While the AHM is described in this
paper, CDA features such as identification and representation of cognitive skills, assessment of
20
model-data fit, and estimation of skill mastery probabilities are not unique to the AHM, but are
common across all attribute-based diagnostic testing methods. Therefore, using the AHM as an
illustrative example for diagnostic score reporting will generalize to many other CDM’s
currently available.
The AHM is a cognitively-based psychometric method used to classify an examinee’s
test item responses into a set of structured attribute patterns associated with a cognitive model of
task performance. An attribute represents the declarative or procedural knowledge needed to
solve a task in the domain of interest. These attributes form a hierarchy that defines the ordering
of cognitive skills required to solve test items. The attribute hierarchy functions as a cognitive
model which in educational measurement refers to a “simplified description of human problem
solving on standardized educational tasks, which helps to characterize the knowledge and skills
students at different levels of learning have acquired and to facilitate the explanation and
prediction of students’ performance” (Leighton & Gierl, 2007b, p. 6). The attributes are specified
at a small grain size in order to generate specific diagnostic inferences underlying test
performance.
Development of the cognitive model is important for two reasons. First, a cognitive
model provides the interpretative framework for linking test score interpretations to cognitive
skills. The test developer is in a better position to make defensible claims about student
knowledge, skills, and processes that account for test performance. Second, a cognitive model
provides a link between cognitive and learning psychology with instruction. Based on an
examinee’s observed response pattern, detailed feedback about an examinee’s cognitive
strengths and weaknesses can be provided through a score report. This diagnostic information
21
can then be used to inform instruction tailored to the examinee, with the goals of improving or
remediating specific cognitive skills.
Once the attributes within a hierarchical cognitive model are specified and validated,
items can be created to measure each combination of attributes specified in the model. In this
way, each component of the cognitive model can be evaluated systematically. If the examinee’s
attribute pattern contains the attributes required by the item, then the examinee is expected to
answer the item correctly. However, if the examinee’s attribute pattern is missing one or more of
the cognitive attributes required by the item, then the examinee is not expected to answer the
item correctly.
After verifying the accuracy of the cognitive model for accounting observed student
response data through model-data fit analyses, attribute probabilities are estimated for each
examinee. These probabilities serve as diagnostic scores. Mastery of specific cognitive skills is
determined using a neural network approach (Gierl, Cui, & Hunka, 2007; Gierl, Cui, & Hunka,
in press) where higher probabilities can be interpreted as higher levels of mastery. Based on a
student’s observed response pattern, an attribute probability close to 1 would indicate that the
examinee has likely mastered the cognitive attribute, whereas a probability close to 0 would
indicate that the examinee has likely not mastered the cognitive attribute (for an example, see
Gierl, Wang, & Zhou, 2008).
Diagnostic Reporting Framework
The AHM yields diagnostic scores that must be communicated through score reports in
an accessible manner to a diverse audience such as students, parents, and instructors. Two
important questions arise. What parts of an AHM analysis should be reported? How should this
information be presented in a score report? To help answer this question, an adapted reporting
22
framework based on research by Jaegar (1998) and Ryan (2003) is proposed for reporting
cognitive diagnostic scores. An example of the diagnostic reporting framework applied to
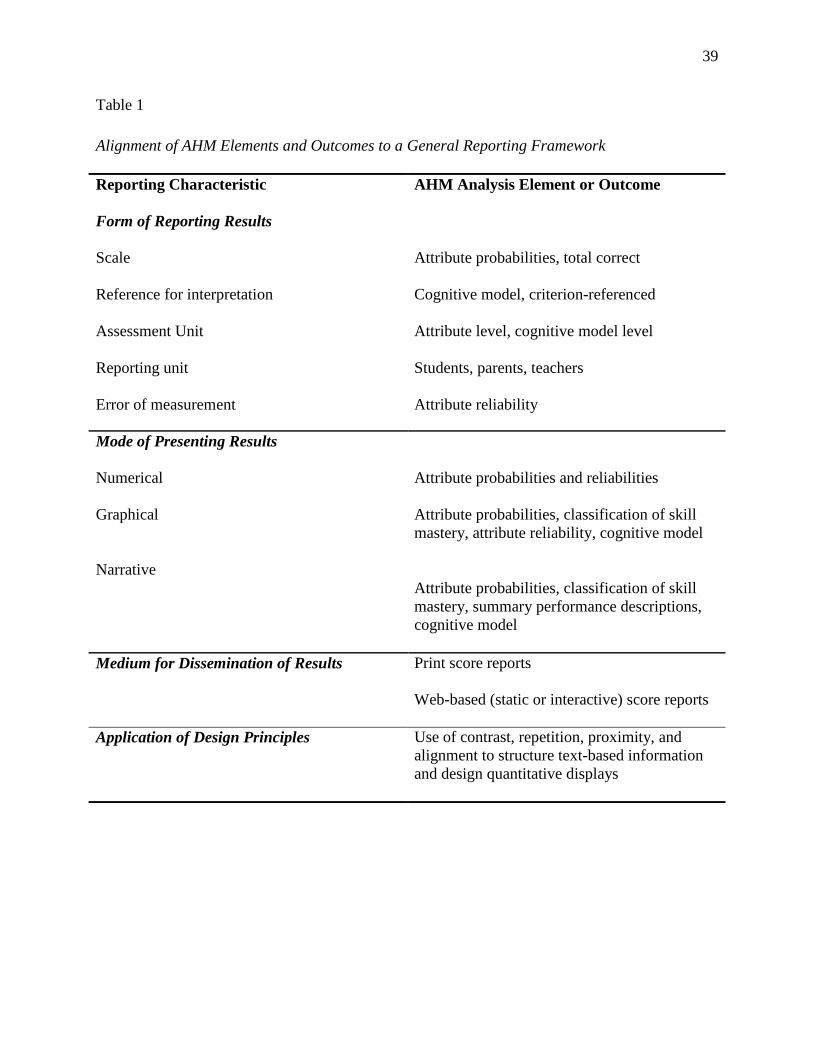
elements of an AHM analysis is provided in Table 1. Inspection of the framework shows that
elements and outcomes of a diagnostic analysis can be systematically identified and presented in
different ways and combinations. Test developers may choose to report some or all of the content
outlined in the framework in various formats and modes, however the final form will likely be
influenced by the information needs of a particular audience and educational policy.
Additionally, implementation of information design principles including contrast, repetition,
proximity, and alignment should be applied when organizing and presenting numerical,
graphical, or text-based information on a document. The proposed framework combines both
content and form considerations with design principles for presenting information as a principled
approach to developing diagnostic score reports.
An Example of a Student-Level Diagnostic Score Report
The following diagnostic score report was developed under the condition that the
cognitive model adequately accounted for the observed examinee responses. The reports were
also developed with the intention that they could either be viewed on the web (static
presentation) or printed. This decision constrained the number of pages of the report to two, so it
could be printed on the front and back sides of a letter-sized page. The goal was to create a stand
alone document and any references in the sample report to additional resources were made for
illustrative purposes, however these resources were not created. When designing the score
reports, great effort was made to incorporate the design guidelines and reporting
recommendations reviewed earlier in the paper. All documents were created using a program
called Adobe In-Design for greater flexibility in the formatting and creation of the document.
23
Individual Diagnostic Score Report
The purpose of this type of report is to provide a summary of student performance across
attributes in one skill category. This type of reporting allows the reader to compare mastery
across attributes providing a diagnostic profile of cognitive strengths and weaknesses. A student
or parent can use this document as a starting point for discussions with a teacher or tutor on areas
requiring further instruction or study. The following report is based on the strand of Algebra
under the skill category of Applying Mathematical Knowledge 1 (O’Callaghan, Morley, &
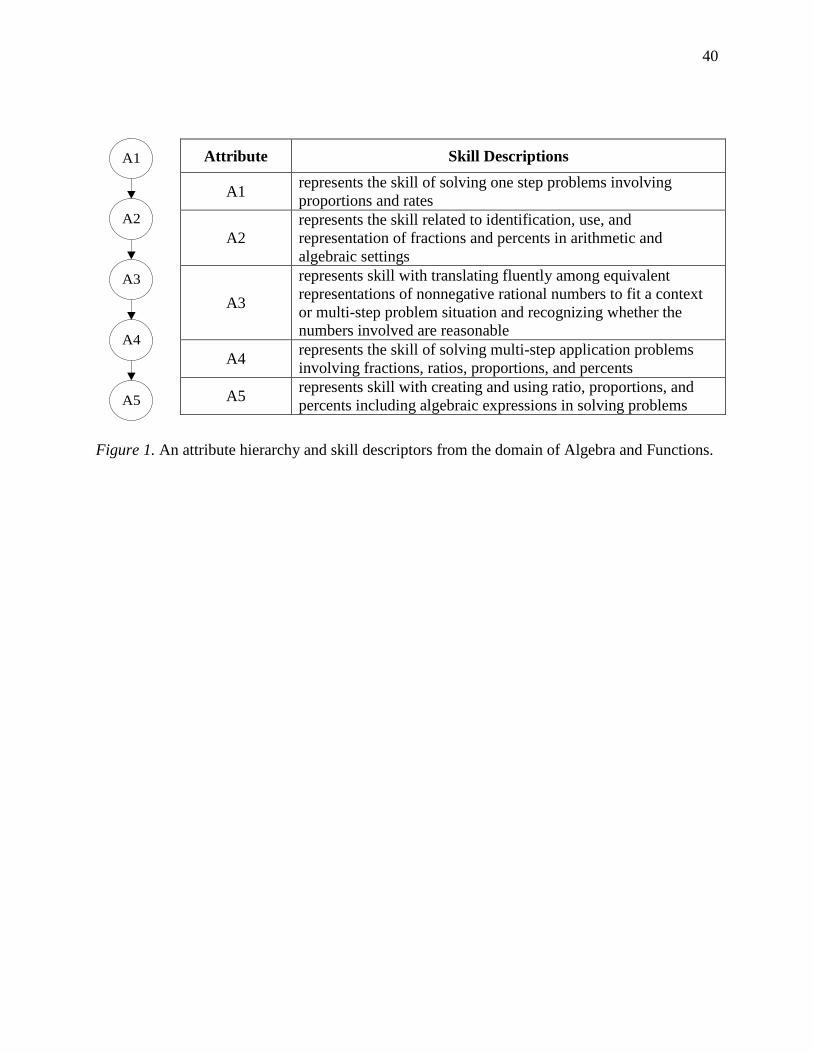
Schwartz, 2004). The cognitive model for this simulated reporting scheme is a five attribute
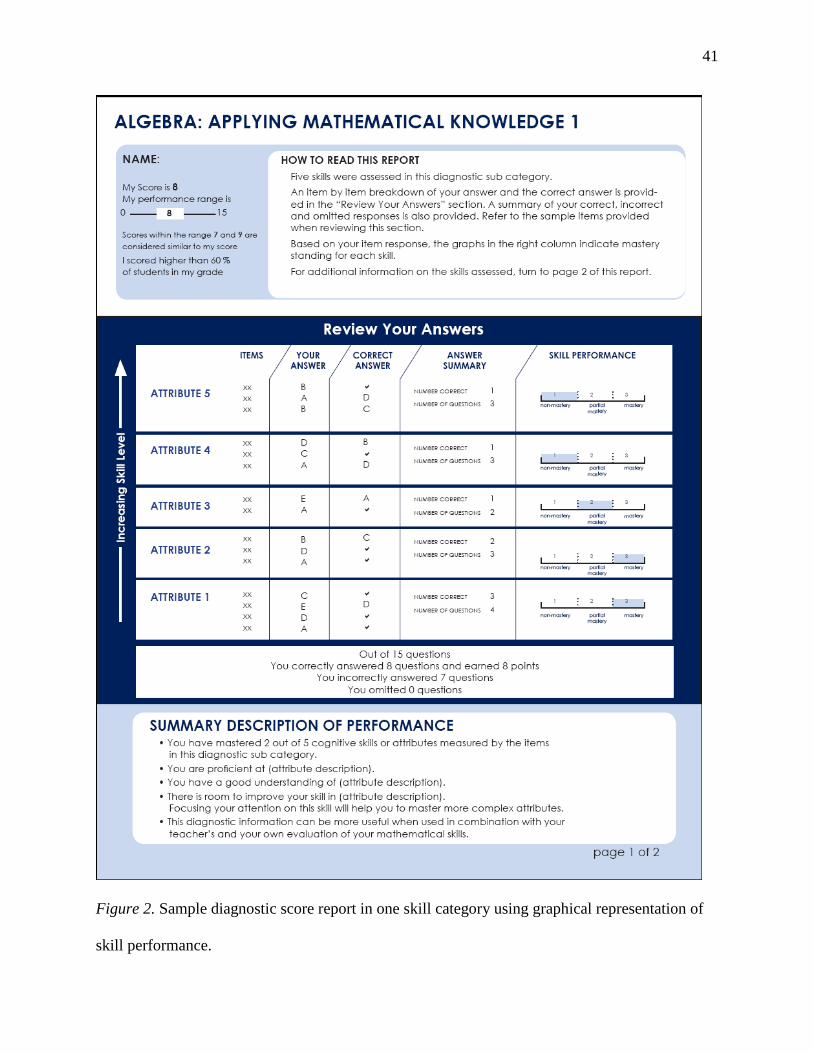
hierarchy, depicted in Figure 1. The report presented in Figure 2 incorporates the AHM reporting
elements of the cognitive model, attribute scores, and attribute descriptions. Specific reporting
elements are discussed first followed by a description of the design principles used when
constructing the report.
Reporting considerations. In this reporting scheme, elements specific to CDA are
reported together with elements common to large-scale reporting. This approach was chosen to
provide the reader with familiar reporting features while introducing relatively unfamiliar and
novel diagnostic scores. For example, normative information is provided as well as a total score
for this skill category in the top-left corner where this score could be a total correct or scaled
score. Notwithstanding the limitations of reporting total scores in terms of interpretation,
reporting a total score in combination with diagnostic scores can illustrate to students, parents,
and teachers that the same total score can be characterized by different patterns of skill mastery.
In this way, cognitive diagnostic feedback highlights student performance. Information on report
contents and directions for how to read the report is placed in the top section at the beginning,
24
serving as an overview for the reader. Also, a reminder is provided for the reader to consult the
interpretive material on the second page for further detail and explanation of the score report.
The middle section of the report contains information not typically reported from large-
scale assessments: student diagnostic scores and specific information on attribute-level
performance. The attribute labels in the first column correspond to a standardized attribute
descriptor which provides an abbreviated description of the cognitive skill measured by the test.
Attribute-level performance is illustrated by providing information on item-level performance
under the columns “Item”, “Your Answer”, “Correct Answer” and “Answer Summary”. Actual
skill performance, as indicated by the attribute score, is presented in graphical form with three
sections on the bar denoting classification of skill mastery: non-mastery, partial mastery, and
mastery. Determining mastery probabilities associated with each of level of skill mastery would
require the use of some type of standard setting procedure. For this sample score report,
diagnostic scores are reported in terms of performance levels within each attribute to provide
some context for interpreting the attribute scores. Placement of the colored bar is based on the
estimated attribute score.1 Finally, a summary of the scoring is given with a breakdown of the
number of questions answered correctly, incorrectly, and omitted.
The bottom section of the report provides a narrative summary, in point form, of the
student’s performance across all attributes. An element of redundancy in information within the
report can be helpful for understanding the major outcomes of the assessment without focusing
on the details, if desired. In this section, a cognitive diagnostic summary, instead of an item-level
1 Although not shown here, the length of the bar can be adjusted to reflect the estimated error of
measurement associated with the mastery classification procedures. This method of presenting
scores does not report the actual numerical probabilities or errors of measurement related to
estimation of skill mastery. The reader must infer the relationship between the placement and
length of the bar, with level of skill mastery and error of measurement (see Gierl, Cui, & Zhou,
in press).
25
performance summary, is provided to direct the student to areas of strengths and weaknesses
based on his or her item responses. The student is provided with a short recommendation on how
to improve and a reminder to consult with his or her teacher for further guidance in interpreting
and using the feedback in the report.
Design considerations. This report was designed in three sections with related but
different functional purposes. The top section of the report contains orienting information in the
form of an overview of contents for the reader. Student identification information and a summary
score is brought to the attention of the reader by placing it in a colored, boxed area in the top-left
hand corner of the page, which is where the eye naturally begins when reading a document.
The middle section of the report, “Review Your Answers” contains diagnostic
information regarding attribute mastery along with item-level performance. The results are based
on a simulated linear cognitive model presented in Figure 1, therefore presenting attribute-level
results vertically is consistent with the form of the cognitive model. An arrow placed beside the
attribute labels pointing upwards, provides the reader with additional information about how the
attributes are related in the cognitive model. Attribute labels, item-level performance, and skill
performance are grouped together into three areas within this section, while variations in line
thicknesses were used to visually separate attribute level results vertically. Skill performance is
presented in graphical form where each third of the bar is numbered directly to reinforce the
association of a higher number, such as 3, with a higher skill classification, such as mastery. This
form of presentation uses the design principle of repetition of information. Bars representing skill
performance are also stacked vertically to facilitate visual comparisons among attributes to
quickly glance where the cognitive strengths and weaknesses lie.
26
The bottom section of the report is structurally and visually separated from the middle
section by the use of a box. This section contains mostly text-based information using bullets
with left alignment for clarity in presentation and ease of reading.
Interpretive Material for the Cognitive Diagnostic Score Report
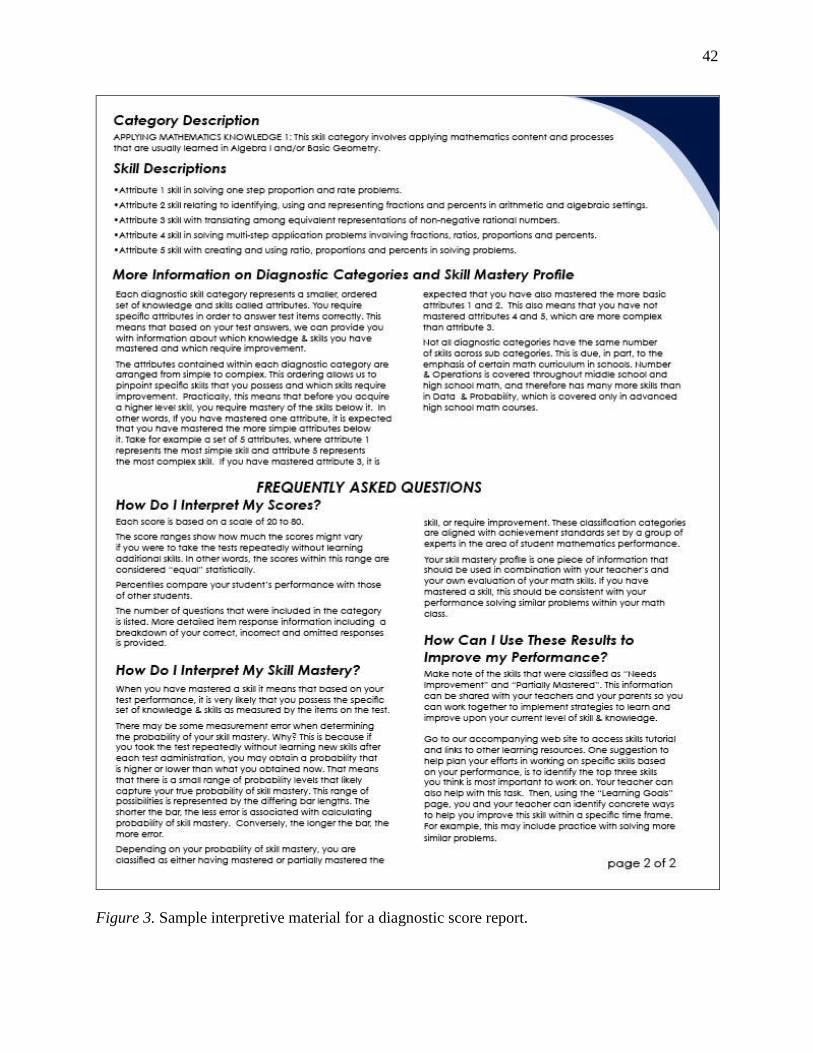
The new kind of information reported from a CDA is emphasized in the accompanying
interpretive material which is illustrated in Figure 3. The back page of the report can be viewed
in three sections. The top section provides a description of the skill category as defined by the
cognitive model and the attributes. Attribute descriptions are more detailed in the interpretive
guide than the attribute descriptors on the front page where they function as exemplar statements
written in a standard format. The middle section provides more information about what an
attribute is and how they are related to each other on the test. An explanation of how diagnostic
profiles are produced based on a student’s response pattern is provided in simple terms to
describe the logic of where attribute scores come from. The bottom section assists with providing
contextual information when interpreting the contents on the front page of the report. This
information is grouped under headings of anticipated “Frequently Asked Questions” that a reader
may have such as directions for how to use the report, interpret scores, as well as how to find
more specific diagnostic information. This technique is employed to decrease anticipated
misinterpretations and unintended uses of diagnostic scores. Due to the large narrative
component, the typeface size was kept at 10pt, line lengths were kept short, and text was
chunked into columns separated by white space to maintain legibility.
SECTION 4: SUMMARY AND DISCUSSION
The purposes of this paper were to (a) review current test score reporting practices to
provide a context for diagnostic score reporting, (b) review relevant literature pertinent to
27
presenting information in score reports, and (c) to present a structured approach for reporting
diagnostic scores based on the literature review. Application of the diagnostic reporting
framework was illustrated using the Attribute Hierarchy Method (AHM). But, these guidelines
could be used with many other diagnostic testing procedures.
To begin, a review of score reporting practices and procedures in education was
completed. This literature identified issues with score reporting including difficulties with report
readability and comprehension, which can often lead to inferences not supported by the
information presented. Additionally, score reports were not disseminated in a timely manner,
limiting their usefulness to inform instruction and guide student learning efforts. This literature
also identified problems with the presentation of information and general appearance of score
reports. There were few studies that looked at both the reporting elements and the effectiveness
of their presentation with educational stakeholders. Next, a review of the information design
literature was completed to identify general design guidelines to assist with the communication
of test score results. This involved a review of designing effective text using typography and
layout, as well as how to design effective quantitative displays of information such as tables and
graphs.
Then, a rationale for the development of CDA and an overview of available CDM’s were
provided. A review of the AHM as a method for cognitive diagnostic assessment was provided.
It also provides a context for illustrating diagnostic score reporting. The proposed diagnostic
reporting framework was adapted from those available in the educational measurement literature.
Each reporting element in the proposed framework was aligned to the specific AHM outcomes
focusing on attribute probabilities as diagnostic scores. To illustrate an application of the
framework, an example score report presenting student-level diagnostic information was
28
presented following the recommendations put forth by researchers in educational measurement
and information design. More specifically, the diagnostic score report was personalized,
contained basic interpretive information, provided a quick visual summary of student
performance, and outlined how to use the information to guide study efforts. Although only one
example report was presented here, the reporting framework provides a structured approach to
developing multiple alternative reporting forms that can then be piloted with target audiences.
Limitations of the Study
We noted earlier that timeliness of reporting was an issue and that web-based reporting
is a promising solution. However, the review presented in this paper did not discuss the design
and cognitive implications of a web-based environment for score reporting. A more thorough
literature review concerning web-based communication should be conducted prior to designing
online score reports. Also, the sample score report was developed from the perspective of one
person. Although the score report incorporated research recommendations, it represents one of a
possible number of equally acceptable forms that can arise from application of the proposed
framework. Ideally, the development of score reports would involve a number of disciplines
working together with the intended audiences of these reports. These score reports were
developed to respond to anticipated information needs identified in the literature, and are not
based on real user input and feedback. At this point, it is unknown as to each report’s
effectiveness with a particular audience and requires further evaluation.
Directions for Future Research
There are at least three directions for future research. First, this paper focused on
reporting student-level cognitive diagnostic results. This discussion was limited to the
development of score reports only. Score reports that implement the recommendations put forth
29
for reporting CDA results will require evaluation with intended educational stakeholders to
determine the effectiveness of the reports for imparting meaningful and useful information to
support instruction and learning. Promising methods for evaluating diagnostic reports with target
audiences of the information include: the use of focus groups and/or individual semi-structured
interviews, think-aloud methods with simulated reports to identify problematic areas of the score
report, and experimental studies to systematically evaluate the effectiveness of different
reporting schemes. User input and feedback is an important inclusion in the score reporting
development process. However, it is likely that policy will also exert influence on which aspects
of the reporting framework will be used and evaluated.
Second, the diagnostic score report in this paper are static, whether presented in print
form or on the web. The major difference between presenting information on paper than on a
computer is flexibility of presentation. Web-based environments have the capability to manage
and organize large amounts of information (Nielsen, 2000) using tools, such as ribbons and
hyperlinking, which are not available in print-based documentation. Further research can be done
to explore how elements of the score report can be changed to assist with reporting large
amounts of information. For example, in an interactive web-based score report, how does the use
of techniques such as hyperlinking reporting elements to interpretative information assist with
user-directed information management? Currently, many reporting systems are still paper based,
and accompanying this are inherent limitations such as report length and the use of color and
graphics.
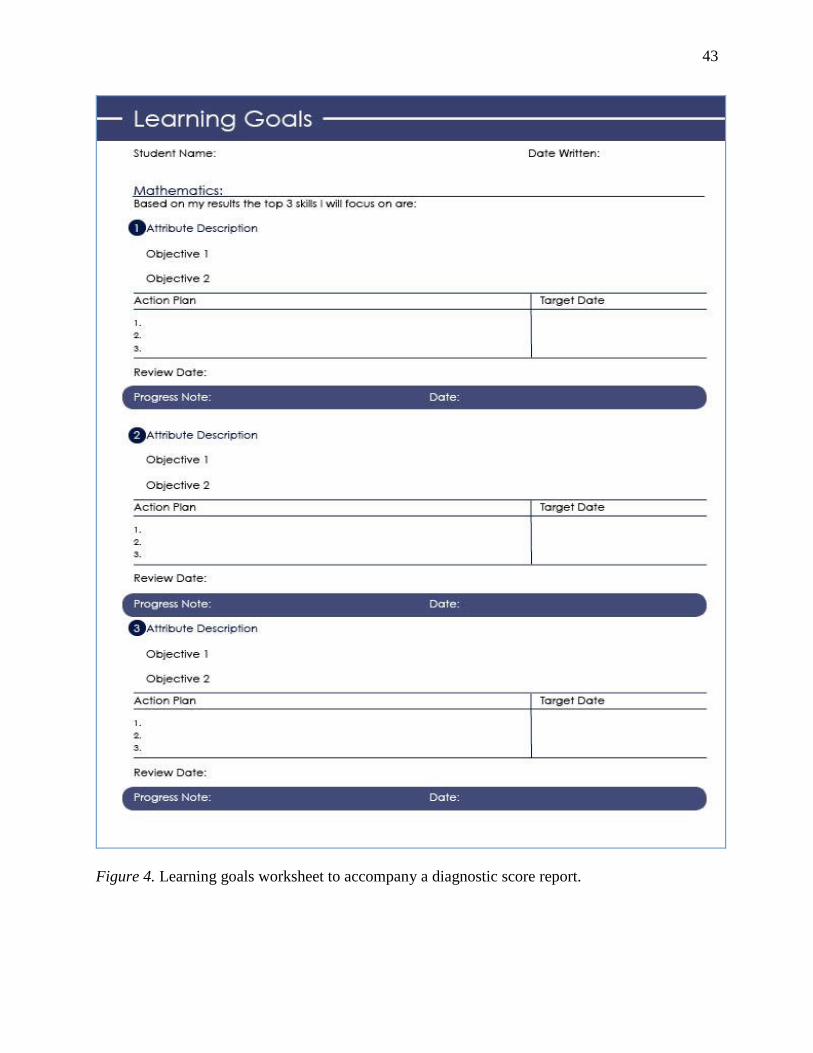
Third, an avenue of research can be pursued to investigate how diagnostic score
information is used by teachers, parents, and students to help with instruction and learning. Score
reporting can provide an opportunity for student learning by providing specific feedback on test
30
performance. Both teachers and parents can assist the student in interpreting this information and
helping the student set learning goals informed by CDA results. An example of how the function
of score reporting can expand in this direction is the provision of a printable “Learning Goals”
sheet, as presented in Figure 4. Areas requiring improvement can be selected and printed in by
the student, or in the case of an interactive web-presentation, areas identified as needing
improvement can be directly linked to the document. A “Learning Goals” sheet provided with
the score report capitalizes on the diagnostic feedback, can initiate discussions between the
student and teacher/parent in setting concrete action plans for remediation of areas of weakness,
and can encourage the student to be an active participant in his or her learning.
Conclusion
The basic requirements for score reporting are clearly identified within the Standards for
Educational and Psychological Testing (1999). However, the methods to achieve these standards
are not. There lies an implicit assumption that results are reported in a useful manner to
educational stakeholders to enable their use for communicating student performance. Effective
reporting of diagnostic results requires a multi-disciplinary effort and input from all target
audiences. Score reporting should be viewed as a form of communication between the test
developer and test user, aspiring to achieve the goal of clarity of communication. The good news
is that there are many new tools and technology available to assist us with this task. However, in
order for CDA to realize its potential for informing instruction and guiding student learning,
more research is required to further explore reporting strategies with different audiences who
have specific but diverse information needs.
31
References
American Educational Research Association (AERA), American Psychological Association,
National Council on Measurement in Education. (1999). Standards for Educational and
Psychological Testing. Washington, D.C.: AERA.
Aschbacher, P.R., & Herman, J. L. (1991). Guidelines for effective score reporting (CSE
Technical Report 326). Los Angeles, CA: National Center for Research on Evaluation,
Standards and Student Testing.
Beaton, A. E. & Allen, N. L. (1992). Interpreting Scales through Scale Anchoring. Journal of
Educational Statistics, 17, 191-204.
Bertin, J. (1983). The Semiology of Graphics. Madison, WI: University of Wisconsin Press.
Center for Universal Design (n.d.). The principles of universal design. Retrieved March 3, 2008,
from http://www.design.ncsu.edu/cud/about_ud/udprinciplestext.htm.
Cleveland, W. S. (1994). The elements of graphing data. Monterey, CA: Wadsworth.
Cleveland, W. S. & McGill, R. (1985). Graphical perception: Theory, experimentation, and
application to the development of graphical methods. Journal of American Statistical
Association 79, 531-554.
de la Torre, J., & Douglas, J. (2004). Higher-order latent trait models for cognitive diagnosis.
Psychometrika, 69, 333-353.
DiBello, L., Stout, W., & Roussos, L. (1995). Unified cognitive/psychometric diagnostic
assessment likelihood-based classification techniques. In P. Nichols, S. F. Chipman, & R.
L. Brennan (Eds.), Cognitively Diagnostic Assessment (pp. 361-389). Hillsdale, NJ:
Erlbaum.
32
Forsyth, R. A. (1991). Do NAEP Scales Yield Valid Criterion-Referenced Interpretations?
Educational measurement: Issues and practice 10, 3-9, 16.
Forte Fast, E., & The Accountability Systems and Reporting State Collaborative on Assessment
and Student Standards. (2002). A guide to effective accountability reporting. Washington,
DC: Council of Chief State School Officers.
Gierl, M. J. (2007). Making diagnostic inferences about cognitive attributes using the rule space
model and attribute hierarchy method. Journal of Educational Measurement, 44, 325-
340.
Gierl, M. J., Cui, Y., & Hunka, S. M. (2007, April). Using connectionist models to evaluate
examinees’ response patterns on tests using the attribute hierarchy method. Paper
presented at the meeting of the National Council on Measurement in Education, Chicago,
IL.
Gierl, M. J., Cui, Y., & Hunka, S. M. (in press). Using connectionist models to evaluate
examinees’ response patterns on tests. Journal of Modern Applied Statistical Methods.
Gierl, M. J., Leighton, J. P., & Hunka, S. (2007). Using the attribute hierarchy method to make
diagnostic inferences about examinees’ cognitive skills. In J. P. Leighton & M. J. Gierl
(Eds.), Cognitive diagnostic assessment for education: Theory and applications (pp. 242-
274). Cambridge, UK: Cambridge University Press.
Gierl, M. J., Wang, C., & Zhou, J. (2008). Using the attribute hierarchy method to make
diagnostic inferences about examinees’ cognitive skills in algebra on the SAT. Journal of
Technology, Learning, and Assessment, 6 (6). Retrieved January 28, 2008, from
http://www.jtla.org.
33
Goodman, D. P., & Hambleton, R. K. (2004). Student test score reports and interpretative guides:
Review of current practices and suggestions for future research. Applied Measurement in
Education 17, 145-220.
Gribbons, W. M. (1992). Organization by design: Some implications for structuring information.
Journal of Technical Writing and Communication 22, 57-75.
Haertel, E. H. (1989). Using restricted latent class models to map the skill structure of
achievement items. Journal of Educational Measurement, 26, 333-352.
Hambleton, R. K., & Slater, S. (1997). Are NAEP executive summary reports understandable to
policy makers and educators? (CSE Technical Report 430). Los Angeles, CA: National
Center for Research on Evaluation, Standards and Student Teaching.
Hartley, J. (1987). Typography and executive control processes in reading. In B. K. Britton & S.
M. Glynn (Eds.), Executive control processes in reading (pp. 57-79). Hillsdale, NJ:
Lawrence Erlbaum Associates.
Hartley, J., & Jonassen, D. H. (1985). The role of headings in printed and electronic text: The
technology of text. Englewood Cliffs, NJ: Educational Technology Publications.
Hartz, S. M. (2002). A Bayesian framework for the Unified Model for assessing cognitive
abilities: Blending theory with practicality. Unpublished doctoral dissertation.
Horton, W. (1991). Overcoming chromophobia: A guide to the confident and appropriate use of
color. IEEE Transactions on Professional Communication, 34, 160-173.
Huff, K., & Goodman, D. P. (2007). The demand for cognitive diagnostic assessment. In J. P.
Leighton & M. J. Gierl (Eds.), Cognitive diagnostic assessment for education: Theory
and applications (pp. 19-60). Cambridge, UK: Cambridge University Press.
34
Impara, J. C., Divine, K. P., Bruce, F. A., Liverman, M. R., & Gay, A. A. (1991). Does
interpretive test score information help teachers? Educational Measurement: Issues and
Practice, 10, 16-18.
Jaeger, R. M. (1998). Reporting the results of the National Assessment of Educational Progress
(NVS NAEP Validity Studies). Washington, DC: American Institutes for Research.
Jang, E. (2009). Cognitive diagnostic assessment of L2 reading comprehension ability: Validity
arguments for Fusion Model application to LanguEdge assessment. Language Testing,
26, 31-73.
Jonassen, D. H. (Ed.). (1983). The technology of text: Principles for structuring, designing, and
displaying text. Englewood Cliffs, NJ: Educational Technology Publications.
Junker, B. W., & Sijtsma, K. (2001). Cognitive assessment models with few assumptions and
connections with nonparametric item response theory. Applied Psychological
Measurement, 12, 55-73.
Koretz, D. M., & Diebert, E. (1993). Interpretations of National Assessment of Educational
Progress (NAEP) anchor points and achievements levels by the print media in 1991.
Santa Monica, CA: RAND.
Kosslyn, S. M. (1994). Elements of graph design. New York, NY: Freeman.
Kuhn, D. (2001). Why development does (and does not) occur: Evidence from the domain of
inductive reasoning. In J. L. McClelland & R. Siegler (Eds.), Mechanisms of cognitive
development: Behavioral and neural perspectives (pp. 221-249). Hillsdale, NJ: Erlbaum.
Leighton, J. P., & Gierl, M. J. (Eds.). (2007a). Cognitive diagnostic assessment for education:
Theory and applications. Cambridge, UK: Cambridge University Press.
35
Leighton, J. P., & Gierl, M. J. (2007b). Defining and evaluating models of cognition used in
educational measurement to make inferences about examinees’ thinking processes.
Educational Measurement: Issues and Practice, 26, 3-16.
Leighton, J. P., Gierl, M. J., & Hunka, S. M. (2004). The attribute hierarchy model for cognitive
assessment: A variation on Tatsuoka's rule-space approach. Journal of Educational
Measurement, 41, 205-237.
Linn, R. L. & Dunbar, S. B. (1992). Issues in the design and reporting of the National
Assessment of Educational Progress. Journal of Educational Measurement, 29, 177-194.
Lissitz, R. W. & Bourque, M. L. (1995). Reporting NAEP Results Using Standards. Educational
Measurement: Issues and Practice, 14, 14-23, 31.
Mislevy, R. J. (2006). Cognitive psychology and educational assessment. In R. L. Brennan (Ed.),
Educational measurement (4th ed., pp. 257-305). Washington, DC: American Council on
Education.
Mislevy, R. J., Almond, R. G., Yan, D., & Steinberg, L. S. (1999). Bayes nets in educational
assessment: Where do the numbers come from? In K. B. Laskey & H. Prade (Eds.),
Proceedings of the Fifteenth Conference on Uncertainty in Artificial Intelligence (pp.
437-446). San Francisco, CA: Morgan Kaufmann.
Mislevy, R. J., Steinberg, L., & Almond, R. (2003). On the structure of educational assessments.
Measurement: Interdisciplinary Research and Perspectives. Hillsdale, NJ: Lawrence
Erlbaum Associates.
Nielsen, J. (2000). Design web usability: The practice of simplicity. Indianapolis, IN: New
Riders Publishing.
36
O’Callaghan, R.K., Morley, M.E., & Schwartz, A. (2004, April). Developing skill categories for
the SAT Math section. Paper presented at the meeting of the National Council on
Measurement in Education, San Diego, CA.
Pettersson, R. (2002). Information design: An introduction. Philadelphia, PA: John Benjamins
Publishing.
Ryan, J. M. (2003). An analysis of item mapping and test reporting strategies. Retrieved
August 14, 2007, from http://www.serve.org/Assessment/assessment-
publicationh1.php#StApub.
Schriver, K. A. (1997). Dynamics in document design. New York, NY: John Wiley.
Shah, P., Mayer, R. E., & Hegarty, M. (1999). Graphs as aids to knowledge construction:
Signaling techniques for guiding the process of graph construction. Journal of
Educational Psychology 91, 690-702.
Stout, W. (2002). Psychometrics: From practice to theory and back. Psychometrika, 67, 485-518.
Swarts, H. L., Flower, J., & Hayes, J. (1980). How headings in documents can mislead readers.
Technical Report no. 9. Washington, DC: AIR, Document Design Project.
Tatsuoka, K. K. (1980). Rule space: An approach for dealing with misconceptions based on item
response theory. Journal of Educational Measurement, 20, 345-354.
Tatsuoka, K. K. (1990). Toward an integration of item-response theory and cognitive error
diagnosis. In N. Fredrickson, R. L. Glaser, A. M. Lesgold, & M. G. Shafto (Eds.),
Diagnostic monitoring of skills and knowledge acquisition (pp. 453-488). Hillsdale, NJ:
Erlbaum.
Tatsuoka, K. K. (1995). Architecture of knowledge structures and cognitive diagnosis: A
statistical pattern recognition and classification approach. In P. Nichols, S. F. Chipman,
37
& R. L. Brennan (Eds.), Cognitively Diagnostic Assessment (pp. 327-359). Hillsdale, NJ:
Erlbaum.
Trout, D. L., & Hyde, E. (2006, April). Developing score reports for statewide assessments that
are valued and used: Feedback from K-12 stakeholders. Paper presented at the meeting
of the American Educational Research Association, San Francisco, CA.
Tufte, E. R. (2001). The visual display of quantitative information. Cheshire, CT: Graphics Press.
Vaiana, M. E. & McGlynn, E. A. (2002). What cognitive science tells us about the design of
reports for consumers. Medical Care Research and Review, 59, 3-35.
Wainer, H. (1997). Improving tabular display with NAEP tables as examples and inspirations.
Journal of Educational and Behavioral Statistics, 22, 1-30.
Wainer, H. (1992). Understanding Graphs and Tables. Educational Researcher, 21, 14-23.
Wainer, H., Hambleton, R. K., & Meara, K. (1999). Alternative displays for communicating
NAEP results: A redesign and validity study. Journal of Educational Measurement, 36,
301-335.
Waller, R. (1983). Text as diagram: Using typography to improve access and understanding. In
D. H. Jonassen (Ed), The technology of text: Principles for structuring, designing, and
displaying text (pp. 137-166). Englewood Cliffs, NJ: Educational Technology
Publications.
Whitely, S. E. (1980). Multicomponent latent trait model for ability tests. Psychometrika, 62,
495-542.
Winn, W. (1991). Color in document design. IEEE Transactions on Professional
Communication, 34, 180-185.
38
Wright, P. (1977). Presenting technical information: A survey of research findings.
Instructional Sciences, 6, 93-134.
Zwick, R., Senturk, D., Wang, J., & Loomis, S. C. (2001). An Investigation of Alternative
Methods for Item Mapping in the National Assessment of Educational Progress.
Educational Measurement: Issues and Practice, 20, 15-25.
39
Table 1
Alignment of AHM Elements and Outcomes to a General Reporting Framework
Reporting Characteristic AHM Analysis Element or Outcome
Form of Reporting Results
Scale
Reference for interpretation
Assessment Unit
Reporting unit
Error of measurement
Attribute probabilities, total correct
Cognitive model, criterion-referenced
Attribute level, cognitive model level
Students, parents, teachers
Attribute reliability
Mode of Presenting Results
Numerical
Graphical
Narrative
Attribute probabilities and reliabilities
Attribute probabilities, classification of skill
mastery, attribute reliability, cognitive model
Attribute probabilities, classification of skill
mastery, summary performance descriptions,
cognitive model
Medium for Dissemination of Results Print score reports
Web-based (static or interactive) score reports
Application of Design Principles Use of contrast, repetition, proximity, and
alignment to structure text-based information
and design quantitative displays
40
A1
A3
A2
A4
A5
Figure 1. An attribute hierarchy and skill descriptors from the domain of Algebra and Functions.
Attribute Skill Descriptions
A1 represents the skill of solving one step problems involving
proportions and rates
A2
represents the skill related to identification, use, and
representation of fractions and percents in arithmetic and
algebraic settings
A3
represents skill with translating fluently among equivalent
representations of nonnegative rational numbers to fit a context
or multi-step problem situation and recognizing whether the
numbers involved are reasonable
A4 represents the skill of solving multi-step application problems
involving fractions, ratios, proportions, and percents
A5 represents skill with creating and using ratio, proportions, and
percents including algebraic expressions in solving problems
41
Figure 2. Sample diagnostic score report in one skill category using graphical representation of
skill performance.
42
Figure 3. Sample interpretive material for a diagnostic score report.
43
Figure 4. Learning goals worksheet to accompany a diagnostic score report.
![Score Stove [1] Generating electricity in developing countries using thermo-acoustics powered by burning wood Paul H. Riley, Score Project Director Professor.](https://static.fdocuments.in/doc/165x107/55141ae05503466d1a8b458e/score-stove-1-generating-electricity-in-developing-countries-using-thermo-acoustics-powered-by-burning-wood-paul-h-riley-score-project-director-professor.jpg)