

1 Rising Inequality in an Era of Austerity: The Case of the USA Presented at Special Session on: The...
45
1 Rising Inequality in an Era of Austerity: The Case of the USA Presented at Special Session on: The Big Thinkers & The Big Five in one day 51 st Annual ERSA Congress Barcelona, Spain August 31, 2011 ___________ Mark Partridge and Amanda Weinstein The Ohio State University Swank Program in Rural-Urban Policy
-
Upload
sammy-stradford -
Category
Documents
-
view
215 -
download
0
Transcript of 1 Rising Inequality in an Era of Austerity: The Case of the USA Presented at Special Session on: The...

1
Rising Inequality in an Era of Austerity: The Case of the USA
Presented at Special Session on:
The Big Thinkers & The Big Five in one day 51st Annual ERSA Congress
Barcelona, Spain August 31, 2011
___________
Mark Partridge and Amanda WeinsteinThe Ohio State University
Swank Program in Rural-Urban Policy

2
Introduction• We look in the future to what we see as an emerging US crisis.• Most of the world is fixated on surviving the Great Recession and the
subsequent “recovery.”• We argue the Great Recession covered up some structural trends. • Before the Great Recession, American families had become
increasingly vulnerable. Incomes for the vast majority of Americans had stagnated, and American cities are being globally challenged as leaders in innovation.
• Rising inequality is a cause of many of these long-term problems and its decades-long increase is reaching a tipping point that will cause significant problems unless it is addressed.– Inequality is good until it goes to far, but we believe we are pushing too far.
• We argue the rising trend in inequality is unsustainable. • Unsustainable trends either end the easy way or the hard way.
3
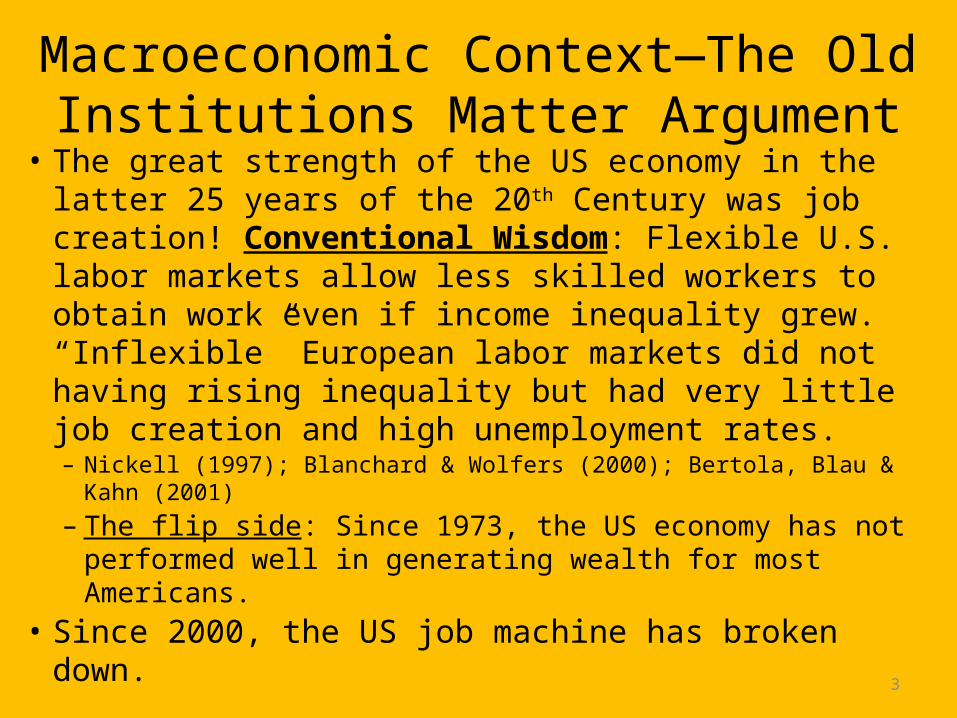
Macroeconomic Context—The Old Institutions Matter Argument
• The great strength of the US economy in the latter 25 years of the 20th Century was job creation! Conventional Wisdom: Flexible U.S. labor markets allow less skilled workers to obtain work even if income inequality grew. “Inflexible” European labor markets did not having rising inequality but had very little job creation and high unemployment rates.– Nickell (1997); Blanchard & Wolfers (2000); Bertola, Blau & Kahn
(2001)– The flip side: Since 1973, the US economy has not
performed well in generating wealth for most Americans. • Since 2000, the US job machine has broken down.
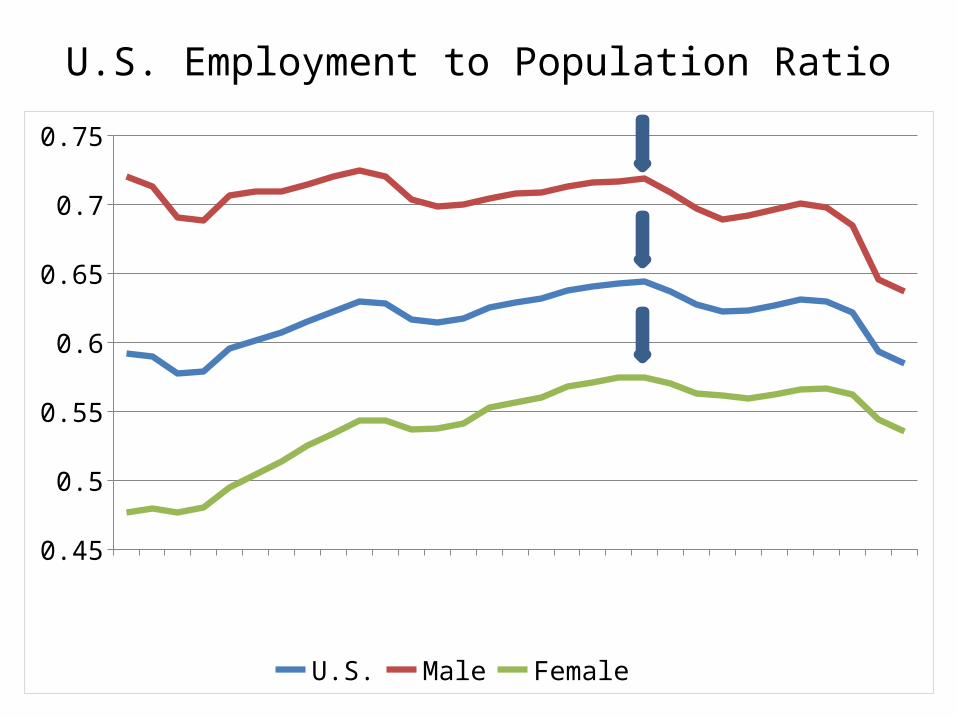
U.S. Employment to Population Ratio
19801982
19841986
19881990
19921994
19961998
20002002
20042006
20082010
0.45
0.5
0.55
0.6
0.65
0.7
0.75
U.S. Male Female

US-EU* Annual Employment Growth Comparison
2001 2002 2003 2004 2005 2006 2007 2008 2009 2010
-0.070
-0.060
-0.050
-0.040
-0.030
-0.020
-0.010
0.000
0.010
0.020
Europe United States
Empl
oym
ent G
row
th R
ate
* EU includes the EU15 plus the Czech Republic, Hungary, Iceland, Norway, Poland, Slovak Republic, Switzerland, Turkey

6
19901991
19921993
19941995
19961997
19981999
20002001
20022003
20042005
20062007
20082009
-0.05
-0.04
-0.03
-0.02
-0.01
0
0.01
0.02
0.03
0.04
U.S. Metropolitan Area U.S.
Gro
wth
Rat
eAnnual US and Metropolitan Job Growth

7
Macroeconomic Context—The Old Institutions Matter Argument• While the U.S. experienced greater inequality, this may
have promoted growth as it reflected greater incentives—– US states with more inequality had greater income growth.
• Partridge (1997, 2005); Frank (2009); Hasanov and Izraeli (2011) have a more nuanced view
– Metro areas (especially large ones) have a positive inequality-growth link. Fallah and Partridge (2007) argue more growth occurs where there are economic incentives for innovation and new market ideas—i.e. inequality (incentives) enhances agglomeration economies in promoting growth.• Inequality induces people to acquire more skills, as well as be
innovative and entrepreneurial because success has greater rewards – Welch (1999).
• Inequality promoted American cities as global leaders in innovation.
8
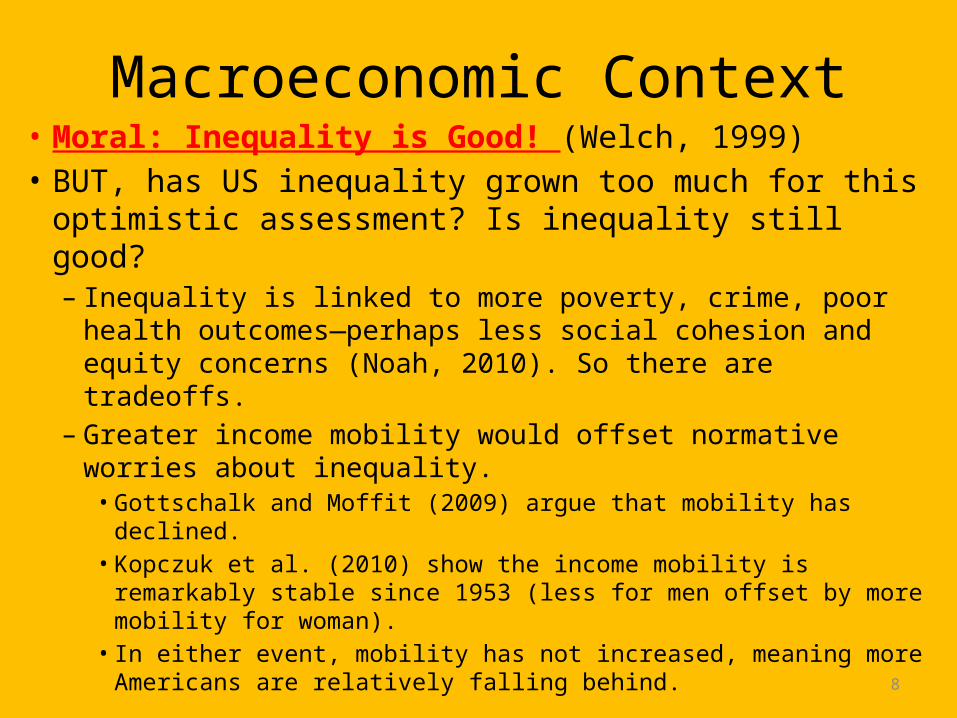
Macroeconomic Context• Moral: Inequality is Good! (Welch, 1999) • BUT, has US inequality grown too much for this
optimistic assessment? Is inequality still good?– Inequality is linked to more poverty, crime, poor health
outcomes—perhaps less social cohesion and equity concerns (Noah, 2010). So there are tradeoffs.
– Greater income mobility would offset normative worries about inequality. • Gottschalk and Moffit (2009) argue that mobility has declined. • Kopczuk et al. (2010) show the income mobility is remarkably
stable since 1953 (less for men offset by more mobility for woman).
• In either event, mobility has not increased, meaning more Americans are relatively falling behind.
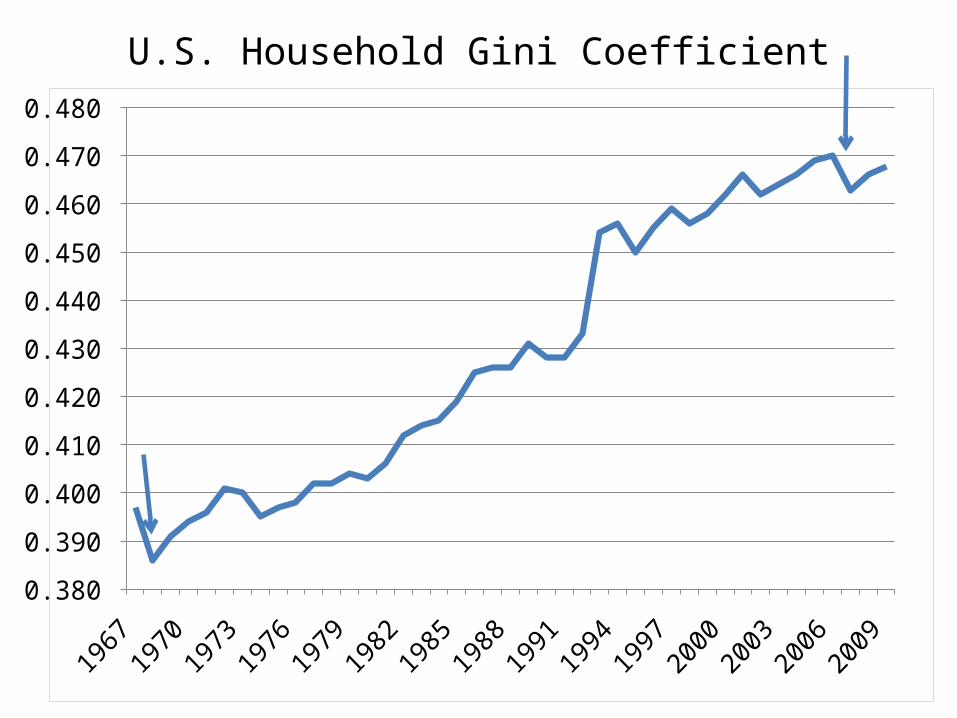
U.S. Household Gini Coefficient
1967 1970
1973 1976
1979 1982
1985 1988
1991 1994
1997 2000
2003 2006
2009 0.380
0.390
0.400
0.410
0.420
0.430
0.440
0.450
0.460
0.470
0.480
10
19731975
1977 1979
1981 1983
1985 1987
1989 1991
1993 1995
1997 1999
2001 2003
2005 2007
2009 40,000
45,000
50,000
55,000
60,000
65,000
70,000
75,000
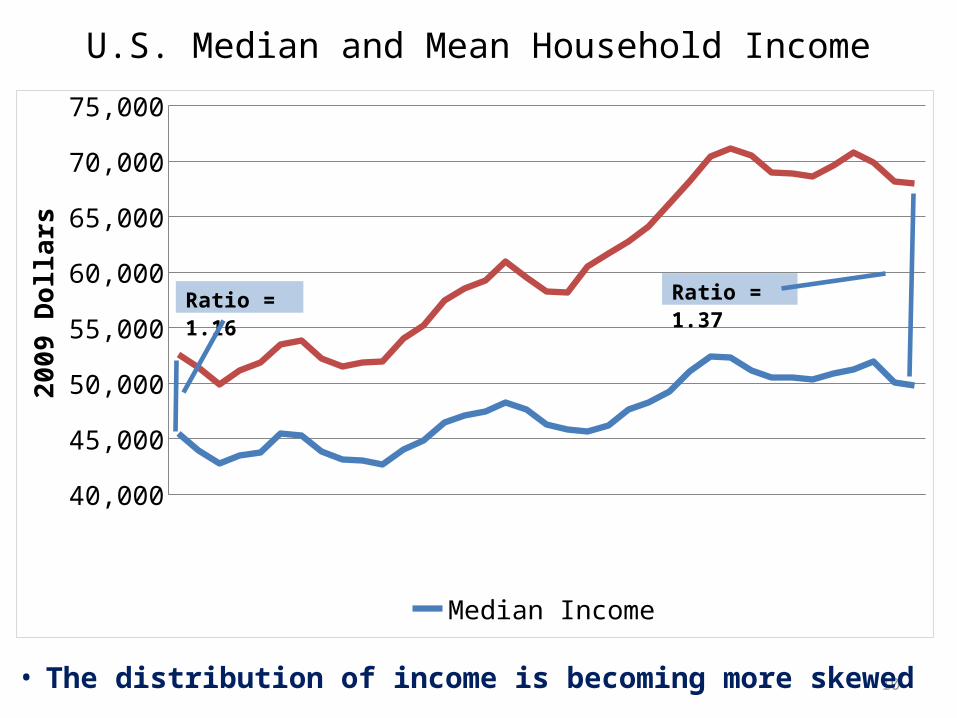
Median Income Mean Income
2009
Dol
lars
Ratio = 1.16
Ratio = 1.37
U.S. Median and Mean Household Income
• The distribution of income is becoming more skewed
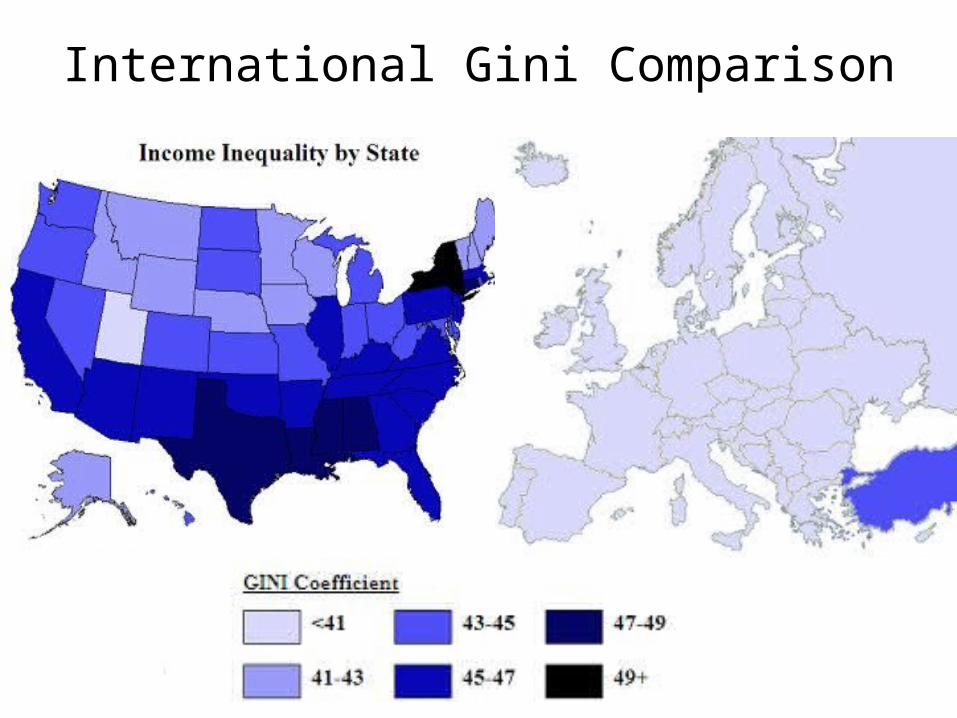
International Gini Comparison

12
U.S. Regional Inequality Trends• Regional variation in inequality tends to reflect
different trends of “good” incentives and those that reflect breakdown of social cohesion.
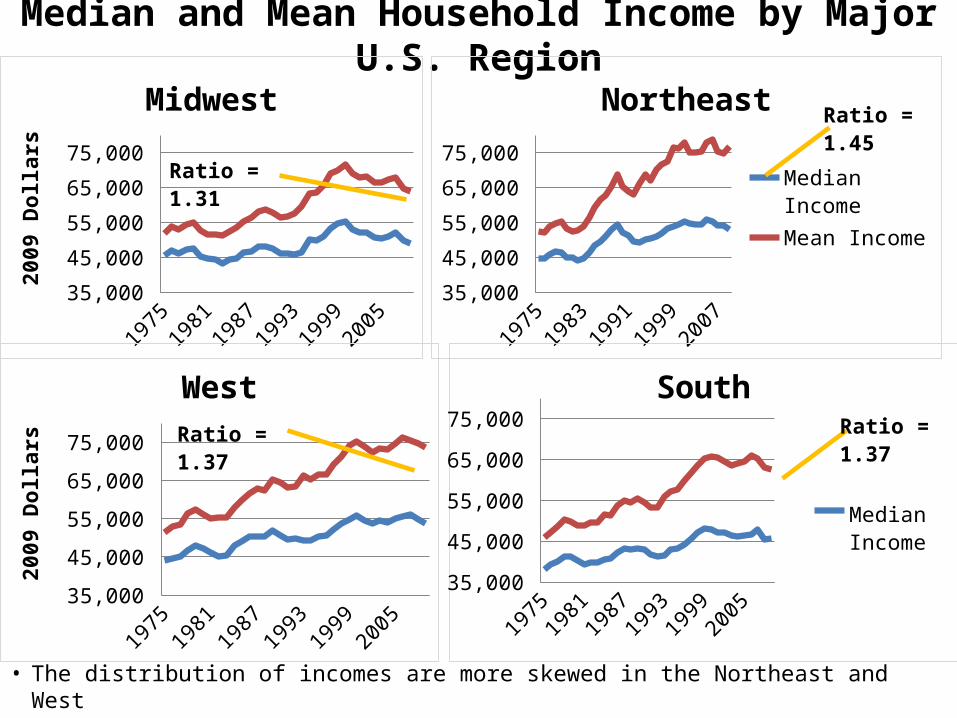
Median and Mean Household Income by Major U.S. Region
19751980
19851990
19952000
200535,000
45,000
55,000
65,000
75,000
Northeast
Median IncomeMean Income
Ratio = 1.45
19751979
19831987
19911995
19992003
200735,000
45,000
55,000
65,000
75,000
Midwest
2009
Dol
lars
Ratio = 1.31
19751979
19831987
19911995
19992003
200735,000
45,000
55,000
65,000
75,000
West
2009
Dol
lars Ratio = 1.37
19751980
19851990
19952000
200535,000
45,000
55,000
65,000
75,000
South
Median IncomeMean Income
Ratio = 1.37
• The distribution of incomes are more skewed in the Northeast and West
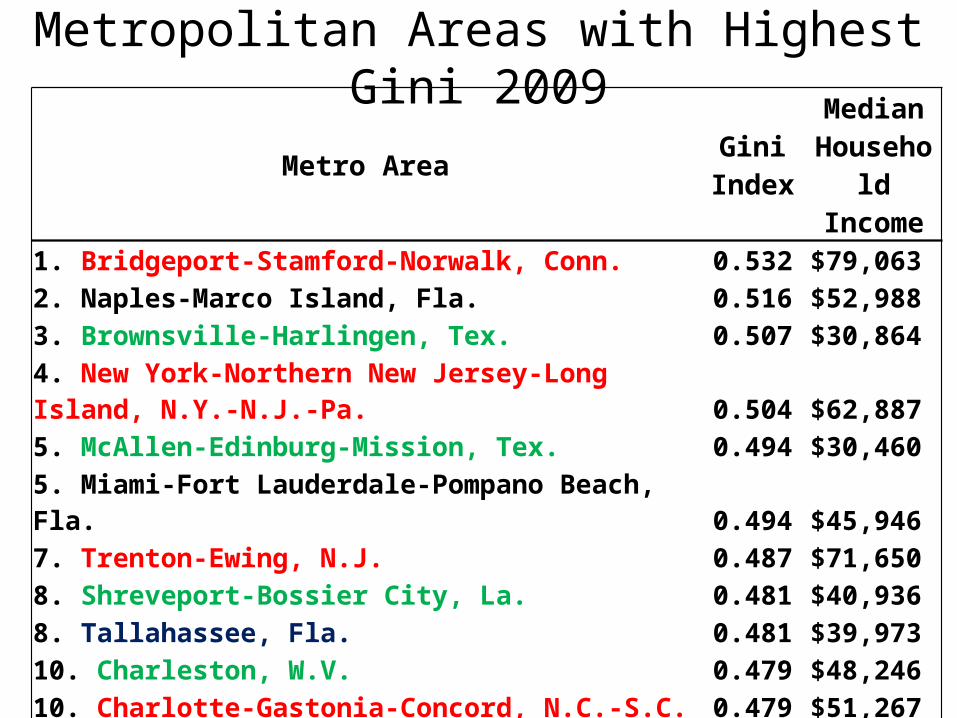
Metropolitan Areas with Highest Gini 2009Metro Area Gini
IndexMedian
Household Income
1. Bridgeport-Stamford-Norwalk, Conn. 0.532 $79,063 2. Naples-Marco Island, Fla. 0.516 $52,988 3. Brownsville-Harlingen, Tex. 0.507 $30,864 4. New York-Northern New Jersey-Long Island, N.Y.-N.J.-Pa. 0.504 $62,887 5. McAllen-Edinburg-Mission, Tex. 0.494 $30,460 5. Miami-Fort Lauderdale-Pompano Beach, Fla. 0.494 $45,946 7. Trenton-Ewing, N.J. 0.487 $71,650 8. Shreveport-Bossier City, La. 0.481 $40,936 8. Tallahassee, Fla. 0.481 $39,973 10. Charleston, W.V. 0.479 $48,246 10. Charlotte-Gastonia-Concord, N.C.-S.C. 0.479 $51,267 10. Lexington-Fayette, Ky. 0.479 $46,735 10. Los Angeles-Long Beach-Santa Ana, Calif. 0.479 $58,525 U.S. 0.468 $49,777 France (2008) 0.327 Germany (2006) 0.270
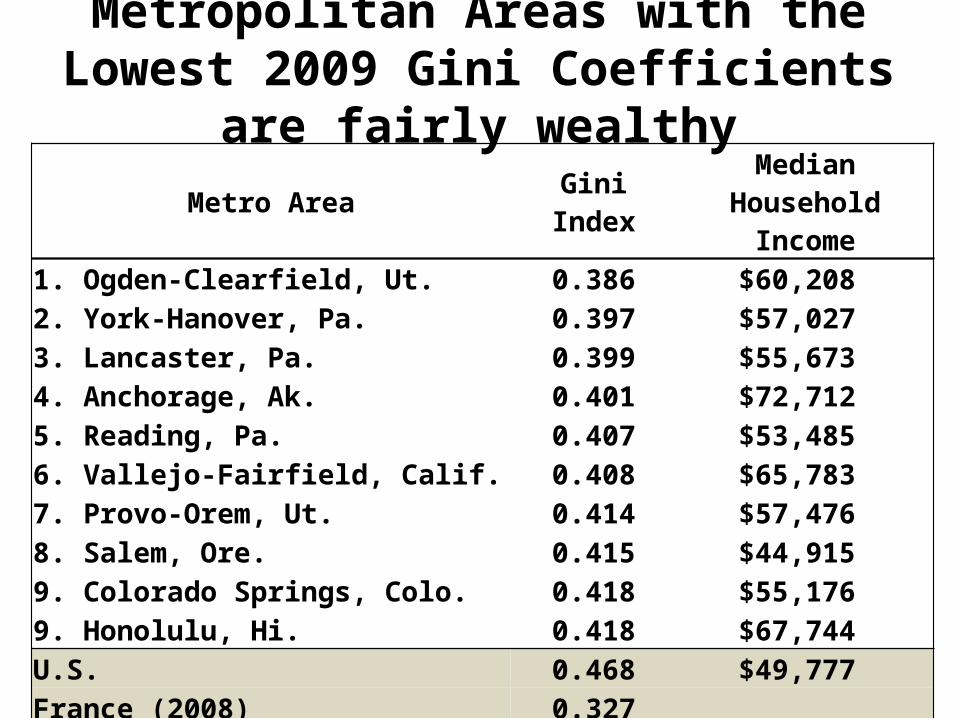
Metropolitan Areas with the Lowest 2009 Gini Coefficients are fairly wealthy
Metro Area Gini Index Median Household Income
1. Ogden-Clearfield, Ut. 0.386 $60,208 2. York-Hanover, Pa. 0.397 $57,027 3. Lancaster, Pa. 0.399 $55,673 4. Anchorage, Ak. 0.401 $72,712 5. Reading, Pa. 0.407 $53,485 6. Vallejo-Fairfield, Calif. 0.408 $65,783 7. Provo-Orem, Ut. 0.414 $57,476 8. Salem, Ore. 0.415 $44,915 9. Colorado Springs, Colo. 0.418 $55,176 9. Honolulu, Hi. 0.418 $67,744 U.S. 0.468 $49,777 France (2008) 0.327 Germany (2006) 0.270

16
How growing inequality reduces growth?• Partridge (1997, 2005) found that a greater middle-class income share
(Q3) is associated with greater income growth—Middle Class consensus.– But Q3 is falling—suggesting less future growth.
• Welch (1999) noted that inequality has adverse effects when people believe that hard work and good ideas do not matter—i.e., the system is rigged against them.
• Greater inequality may cause social instability and more political turmoil (Perotti, 1996; Persson and Tabellini, 1994) .
• Inequality may produce greater credit market constraints. Large shares of the population cannot afford to fund their education (reducing growth) or fund capital accumulation (Galor and Zeira, 1993; Aghion and Bolton, 1997).
• The last three have been thought to be not applicable to the US. Will this remain true with the rises in inequality we have seen?
17
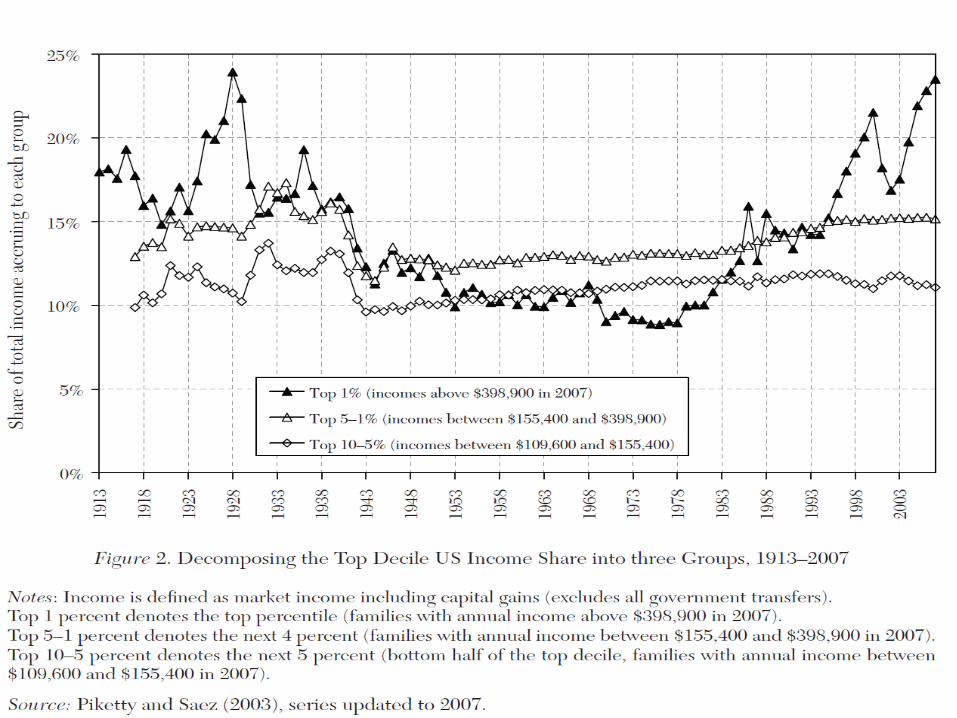
Inequality since 1990
• Since 1980, growth in inequality is more at the very top—top 1% or even top 0.1%.
• That underlies our concern that if only such a small subset are benefiting from growth, rising inequality does not promote growth.
• US levels are reaching levels that are seen in plutocracies.
18

Income Growth in the U.S. by Percentile: 1973=100
19731975
19771979
19811983
19851987
19891991
19931995
19971999
20012003
20052007
0
100
200
300
400
500
600
0 TO 90 90-100 99-100 99.9-100
Inco
me
Leve
l in
2008
Dol
lars
(1
973=
100)
Slight decline in bottom 90%
Massive rise at very top

20-20%
-15%
-10%
-5%
0%
5%
10%
15%Average Top 1% Bottom 99%
Annu
al R
eal I
ncom
e G
row
thAverage U.S. Income Growth for Selected Groups

21
22
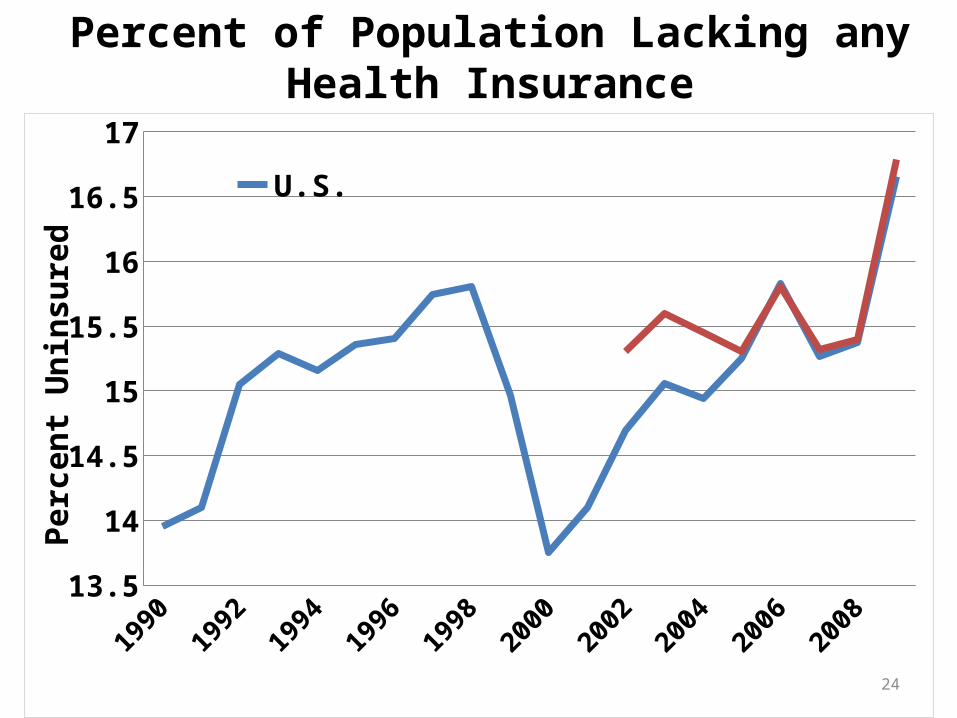
Consequences of Poverty
• As inequality increases, the US makes remarkably little progress in reducing poverty or in providing basic necessities such as healthcare.

23
Metropolitan and Non-Metropolitan Poverty
19901991
19921993
19941995
19961997
19981999
20002001
20022003
20042005
20062007
20082009
6
8
10
12
14
16
18
20
22
Metropolitan Central City Suburb Non-Metropolitan
Pove
rty
Rate
24
19901991
19921993
19941995
19961997
19981999
20002001
20022003
20042005
20062007
20082009
13.5
14
14.5
15
15.5
16
16.5
17U.S.Metropolitan Area
Perc
ent U
nins
ured
Percent of Population Lacking any Health Insurance
25
New inequality Growth relationship from Amanda regression.

26
What should the US do?• The causes of rising US inequality are:– Skill-biased technological change; immigration; declining
unionization; tax policy that is very favorable to the wealthy; falling real value of the minimum wage; globalization (tournament/star power á la Lazear and Rosen, 1981; Rosen, 1981), off-shore sourcing, etc.
• Our preferred cause is political concentration of power in the wealthy and corporations—how else can we explain the top 1% benefitting. We can’t argue they are computer geeks?– All of the above except skill-biased technical change are
ultimately political decisions (Hacker and Pierson, 2010; Noah, 2010; Atkinson et al., 2011).
27
What should the US do?—cont.• What about political economy causes? • US political campaigns are drawn out. Not the short
parliamentary elections found elsewhere. The US system has less attachment to political party. Each campaign has added importance.
• Together, this produces a race for political contributions to fund lengthy expensive “modern” campaigns that require TV ads to be competitive. – Today there are very few limitations on contributions or
expenditures on elections by special interests.• Wealthy actors that make large contributions have
disproportionate influence.

28
What should the US do?—cont.• Hence—we argue the US needs major political
institutional change before it will make the policies to address rising income inequality.
• Other “economic” changes in an age of “austerity”—– Reform the way U.S. corporate executives are paid.– Better education—especially for low income groups and
early childhood education. (Haskins and Sawhill, 2009).– Reform U.S. tax structure to make it more balanced across
economic groups.– While other structural changes would be “nice”, they will
not matter or happen until political reform is undertaken.
29
What should the US do?—cont.• A ray of hope is that the US “robber baron” era
ended with the Progressive era at the turn of the 20th Century, followed by the New Deal. While we can debate the success of the economic reforms, there were major political reforms despite similar headwinds.– E.g., woman gained the right to vote, direct election of
Senators, referendum, initiative, and recall in many states.
• Thus, while the US faces challenges, there is a precedent for being able to adapt.

30
Conclusion• Inequality is good for providing the incentives to
promote skill development, enhance innovation, and it promotes entrepreneurship and risk taking.– Fallah and Partridge (2007) argue that inequality
facilitates/enhances the effects of agglomeration economies. Helps build global cities.
• Inequality becomes a negative when social cohesion breaks down and people no longer believe that hard work and good ideas are rewarded.

31
Conclusion• As the growth in U.S. inequality has shifted away
from the broad upper income groups (say top 25%) to just the top 1%, we argue that its positive effects in promoting growth and facilitating global US cities has waned.
• We worry that current trends in inequality are unsustainable and that it will increasingly cause reduced growth and hurt the development of American cities.
• We conclude that only political institutional change will make a tangible difference.

33
Appendix

Effect on Per Capita Income
Parameter
Variable Estimate t-Value
Intercept -0.1661 -2.60
Population (2000) 0.0000 -0.50
Mean/Median (2000) 0.0708 1.46
Household Mean Income (2000) 0.0000 0.90
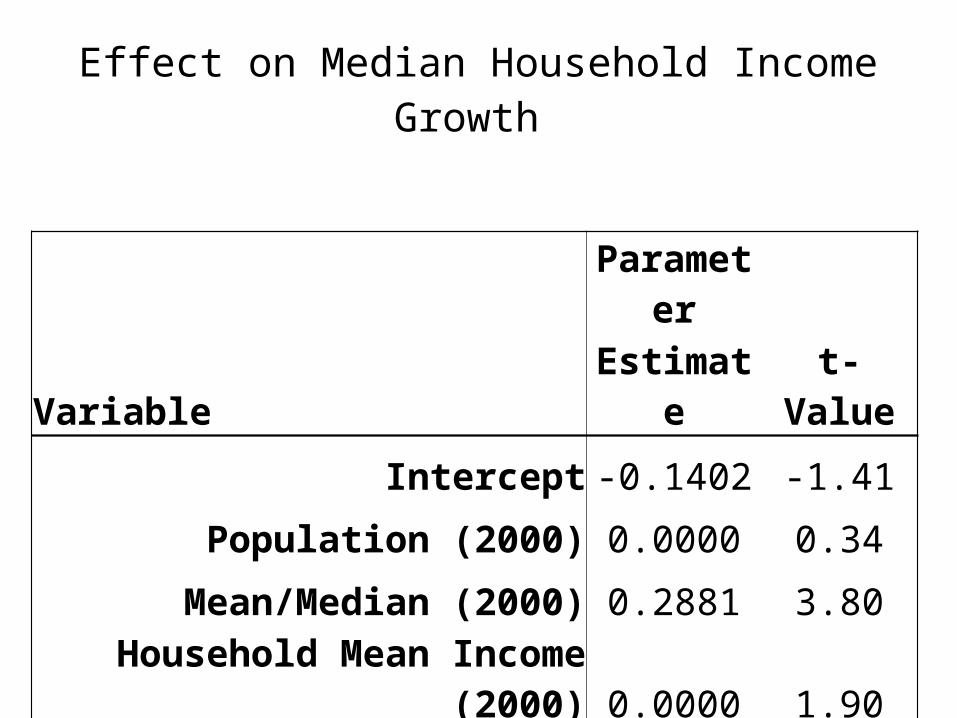
Effect on Median Household Income Growth
Parameter
Variable Estimate t-Value
Intercept -0.1402 -1.41
Population (2000) 0.0000 0.34
Mean/Median (2000) 0.2881 3.80
Household Mean Income (2000) 0.0000 1.90

Global Comparison
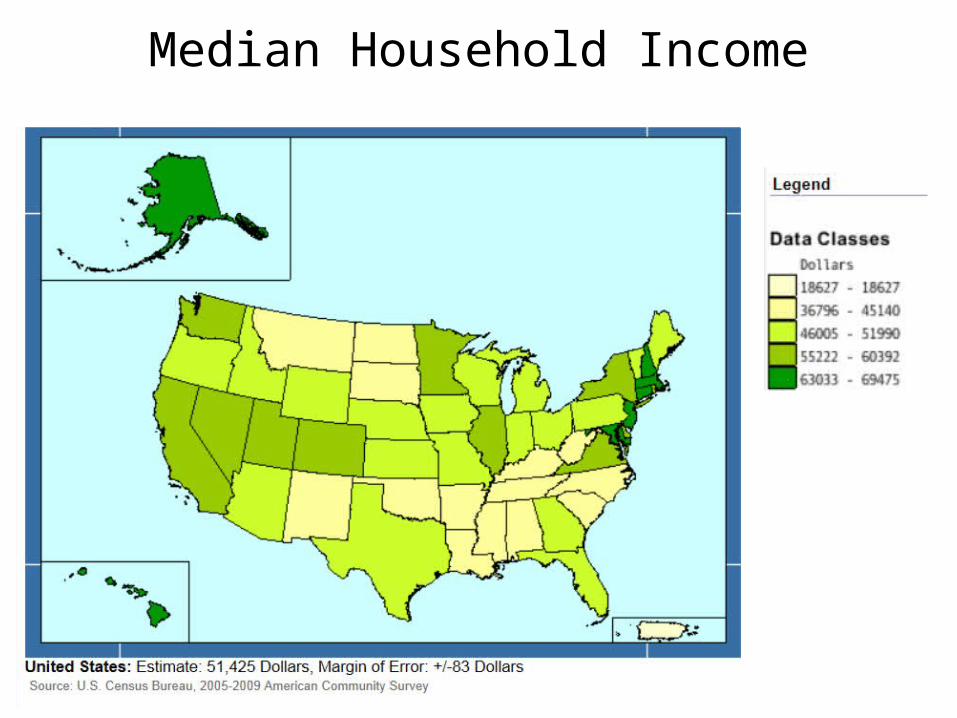
Median Household Income

Average Annual Employment Growth 1990-2009
39
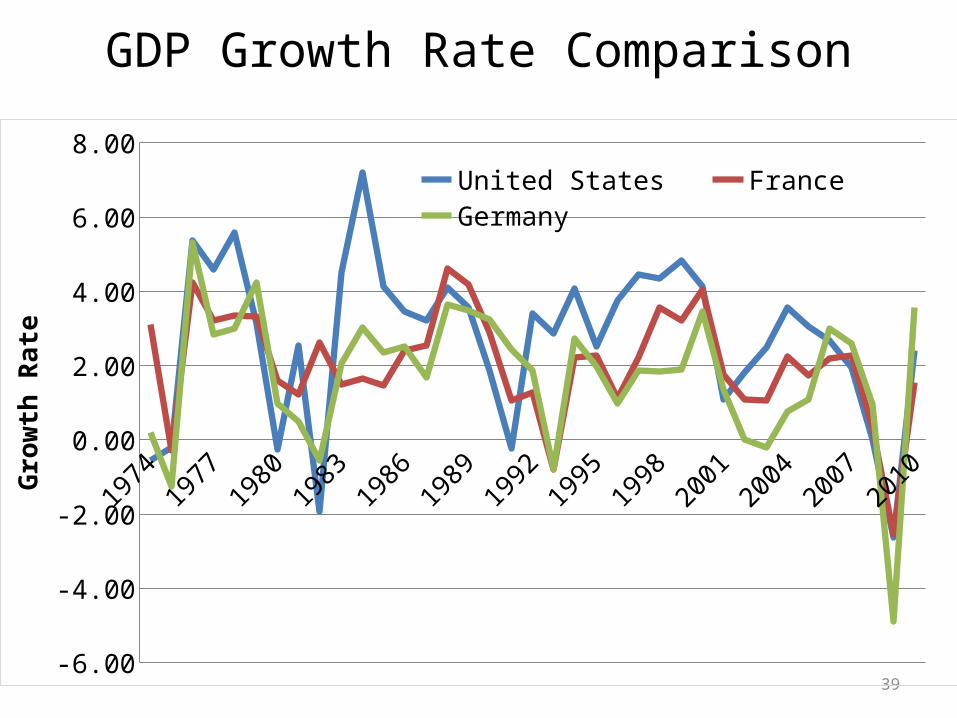
GDP Growth Rate Comparison
19741976
19781980
19821984
19861988
19901992
19941996
19982000
20022004
20062008
2010
-6.00
-4.00
-2.00
0.00
2.00
4.00
6.00
8.00
United States France Germany
Gro
wth
Rat
e

40
GDP Comparison
19741976
19781980
19821984
19861988
19901992
19941996
19982000
20022004
20062008
20100
2000
4000
6000
8000
10000
12000
14000
United States France Germany
GD
P (b
illio
ns 2
005
Dol
lars
)

Household Income and Per Capita Income
1999 2000 2001 2002 2003 2004 2005 2006 2007 2008 2009 94
95
96
97
98
99
100
101
102
103
Median Income Mean Income Per Capita Income
2009
Dol
lars
(199
9=10
0)
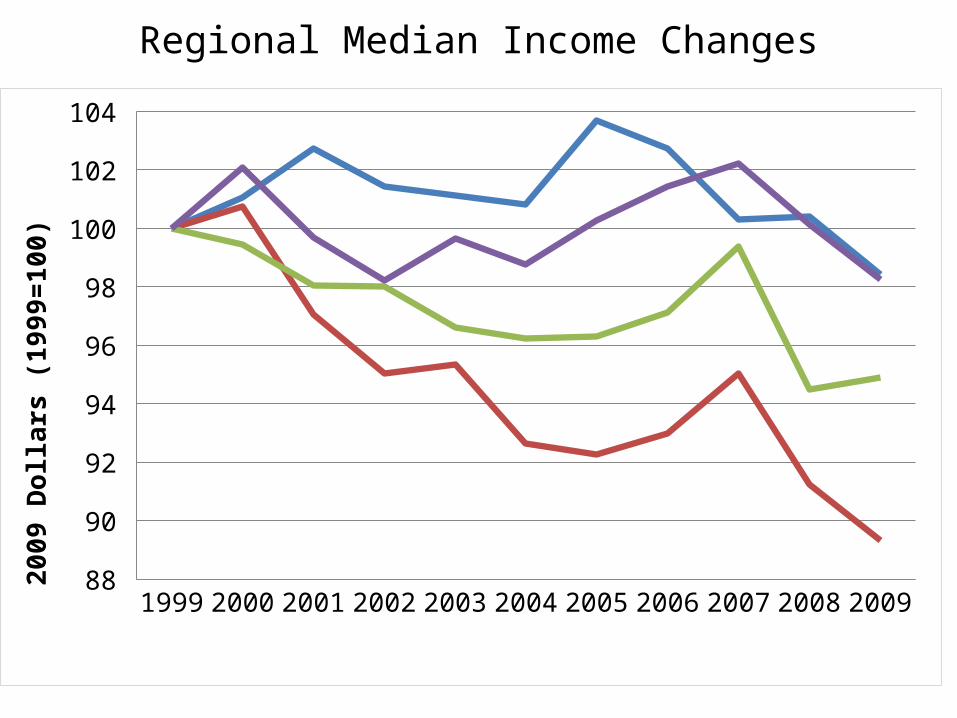
Regional Median Income Changes
1999 2000 2001 2002 2003 2004 2005 2006 2007 2008 200988
90
92
94
96
98
100
102
104
Northeast Midwest South West
2009
Dol
lars
(199
9=10
0)

Quintile Upper Limit Comparison
1973 1975
1977 1979
1981 1983
1985 1987
1989 1991
1993 1995
1997 1999
2001 2003
2005 2007
2009 15,000
35,000
55,000
75,000
95,000
115,000
135,000
155,000
175,000
195,000
Lowest Quintile Upper Limit Second Quintile Upper LimitThird Quintile Upper Limit Fourth Quintile Upper LimitTop 5 Percent Lower Limit
2009
Dol
lars
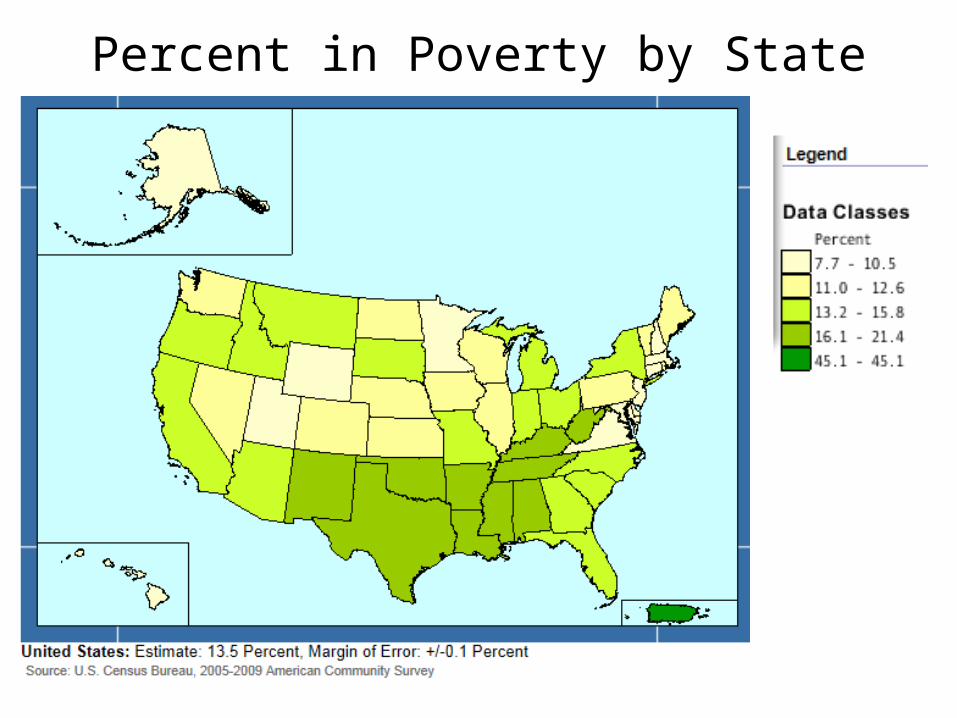
Percent in Poverty by State

Percentage of Individuals Living in Poverty by County (2000)