Communications Strategy for implementation of Millennium Development Goals(MDGs) in Nigeria
Upload
derick-richardsonCategory
view
216download
1
1. Re-Distribution with Growth (RWG)2. Millennium Development Goals (MDGs)
Lecture 9

Re-Distribution with Growth (RWG):The reports of ILO, World Bank and other international
agencies promoted this view that along with economic growth there should be a fairer distribution of incomes.
Therefore, the economists present a set of four theories to attain the combination of economic growth and fairer distribution of wealth.
By following them individually or collectively the incomes of lower classes can be increased.
However, how such methods will be implemented depends upon the social and economic conditions of a country. 2
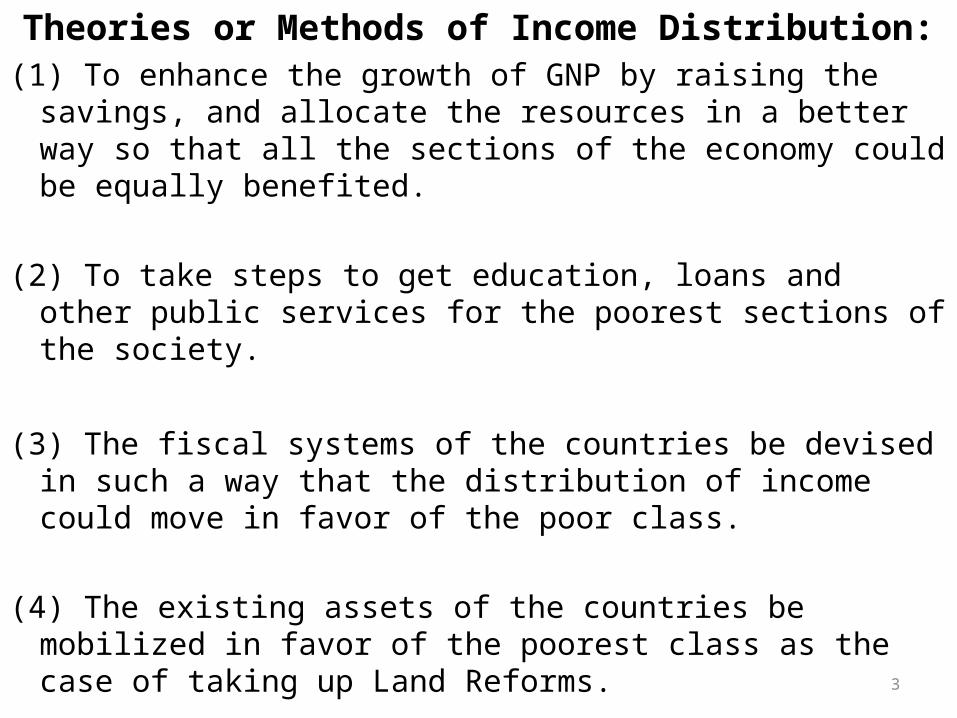
Theories or Methods of Income Distribution:(1) To enhance the growth of GNP by raising the savings, and
allocate the resources in a better way so that all the sections of the economy could be equally benefited.
(2) To take steps to get education, loans and other public
services for the poorest sections of the society.
(3) The fiscal systems of the countries be devised in such a way that the distribution of income could move in favor of the poor class.
(4) The existing assets of the countries be mobilized in favor of the poorest class as the case of taking up Land Reforms.3

Components of RWG: (1) As far as growth of GNP is concerned it is a necessary
condition to remove the poverty, but it is not a sufficient condition.
Just depending upon growth it will require a greater time on the part of the poor people to increase their incomes.
As there exists a weaker relationship between the incomes of the poor people and the remaining economy, therefore, the incomes of the poor class will always lag behind the overall growth of the economy.
No doubt, the poor class will also be benefited as compared with no rise in GNP, yet, to avail the better benefits due to the strategy of growth of GNP, some package of redistribution will have to be implemented.
4
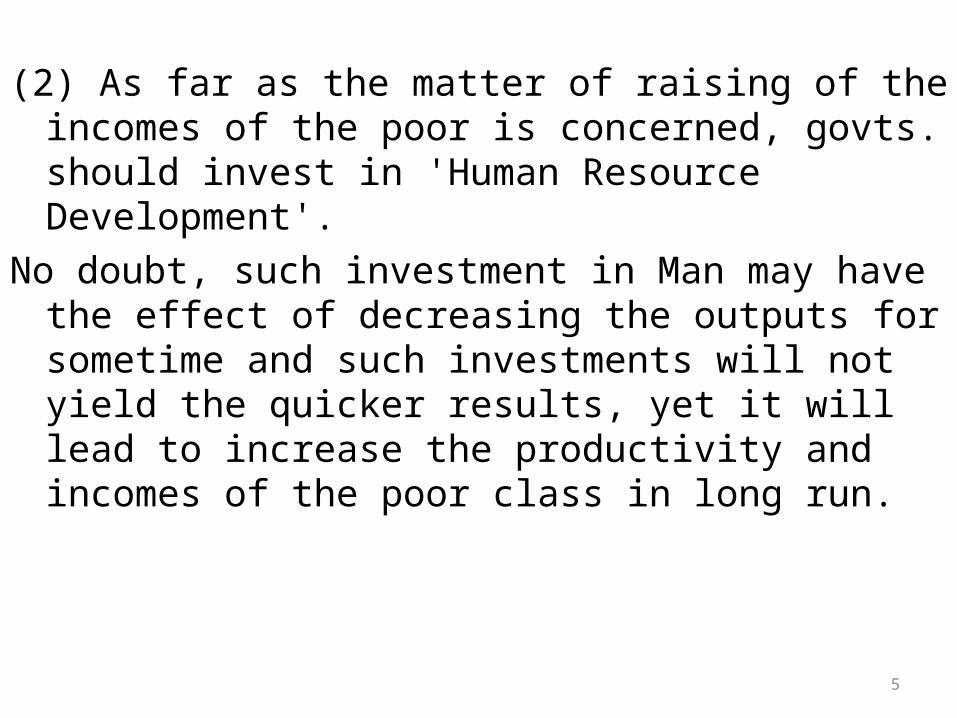
(2) As far as the matter of raising of the incomes of the poor is concerned, govts. should invest in 'Human Resource Development'.
No doubt, such investment in Man may have the effect of decreasing the outputs for sometime and such investments will not yield the quicker results, yet it will lead to increase the productivity and incomes of the poor class in long run.
5

(3) The redistributional policies will be consisting of taxing the rich and exempting the poor from taxes.
Moreover, the poor class be provided with the subsidies in consumption. This will improve the efficiency of the poor class.
But in case of so many UDCs the income levels are poor and they cannot be redistributed.
Moreover, taxing the rich for re-shuffling of income and wealth may have a negative effect on savings and investment.
Again, the rich in a country are a few, but they are very much influential they would never allow to shift the resources towards the poor.
6
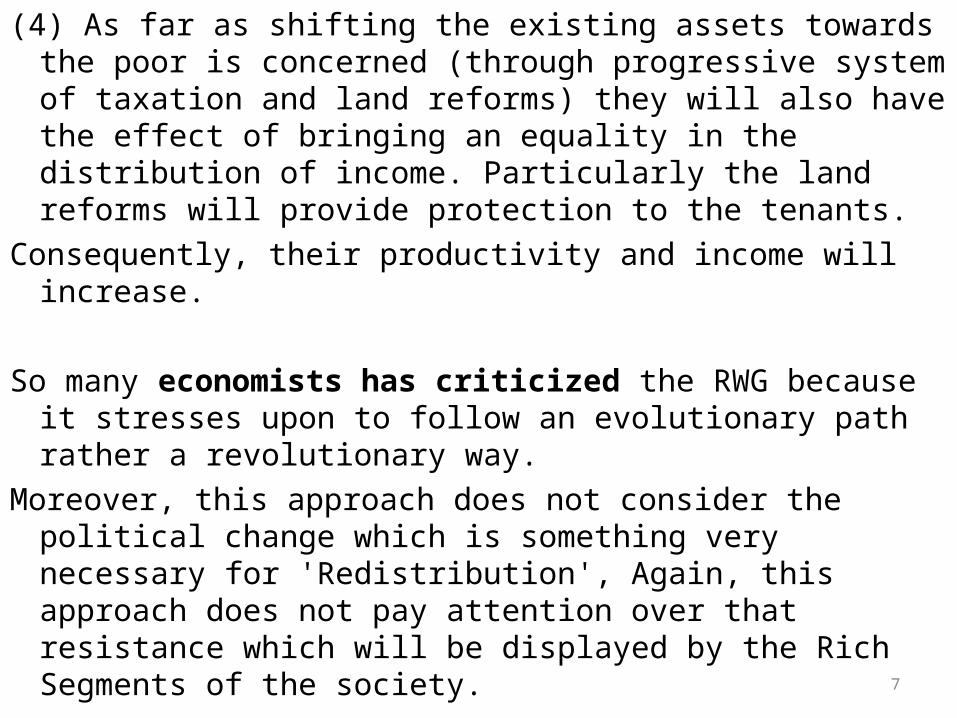
(4) As far as shifting the existing assets towards the poor is concerned (through progressive system of taxation and land reforms) they will also have the effect of bringing an equality in the distribution of income. Particularly the land reforms will provide protection to the tenants.
Consequently, their productivity and income will increase.
So many economists has criticized the RWG because it stresses upon to follow an evolutionary path rather a revolutionary way.
Moreover, this approach does not consider the political change which is something very necessary for 'Redistribution', Again, this approach does not pay attention over that resistance which will be displayed by the Rich Segments of the society. 7

Experience with Growth and Distribution: Kuznets Curve or U-Shaped Curve: Regarding 'Growth and
Distribution' Simon Kuznets (1955) gave the following views:
In the initial stage of economic development the issue of distribution of income gets worsened.
But later on it is improved. On the basis of statistical data Kuznets obtained an inverted 'U-shaped' curve.
Later on after Kuznets in 1976 Ahluwalia improved inverted U-shaped curve on the basis of statistical data of 50 to 60 poor countries.
8
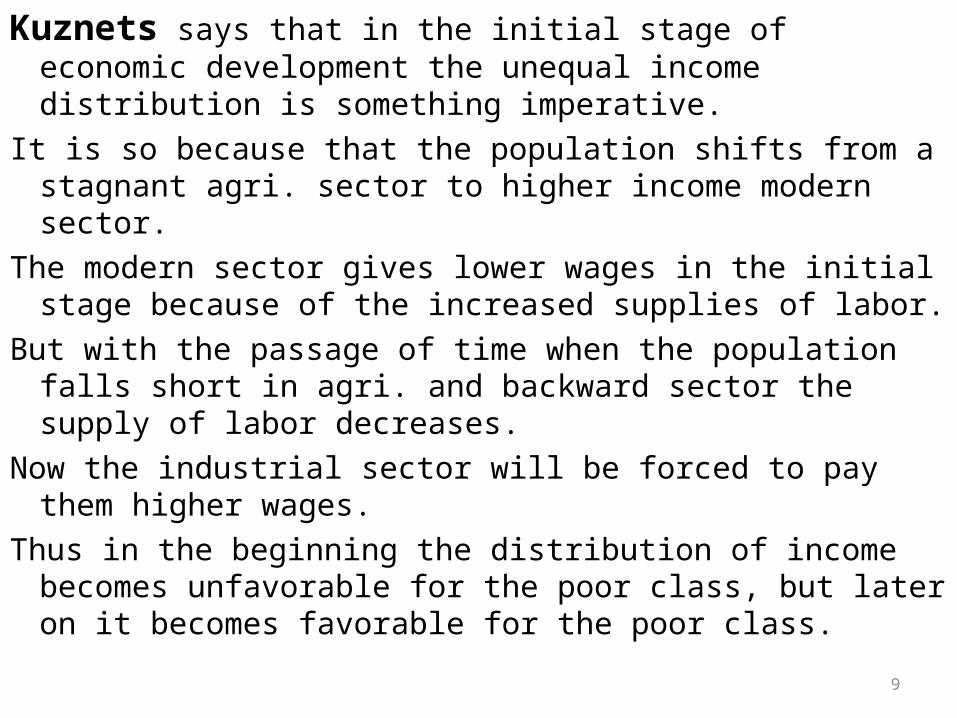
Kuznets says that in the initial stage of economic development the unequal income distribution is something imperative.
It is so because that the population shifts from a stagnant agri. sector to higher income modern sector.
The modern sector gives lower wages in the initial stage because of the increased supplies of labor.
But with the passage of time when the population falls short in agri. and backward sector the supply of labor decreases.
Now the industrial sector will be forced to pay them higher wages.
Thus in the beginning the distribution of income becomes unfavorable for the poor class, but later on it becomes favorable for the poor class.
9
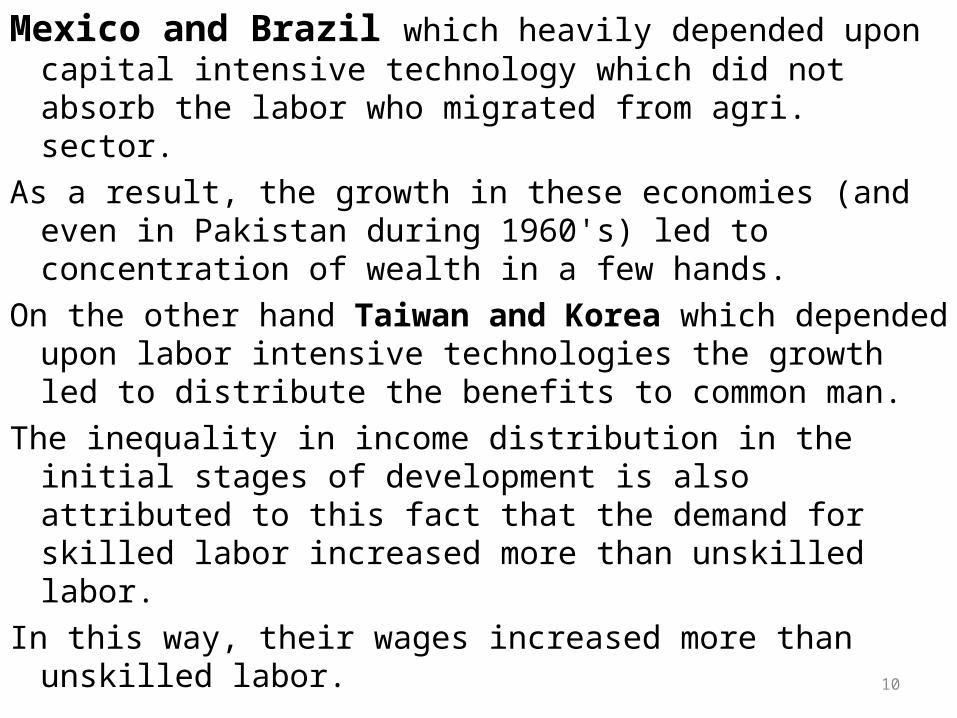
Mexico and Brazil which heavily depended upon capital intensive technology which did not absorb the labor who migrated from agri. sector.
As a result, the growth in these economies (and even in Pakistan during 1960's) led to concentration of wealth in a few hands.
On the other hand Taiwan and Korea which depended upon labor intensive technologies the growth led to distribute the benefits to common man.
The inequality in income distribution in the initial stages of development is also attributed to this fact that the demand for skilled labor increased more than unskilled labor.
In this way, their wages increased more than unskilled labor.
10

Again, in the initial stages of development for creation of infrastructure etc., govts., have to spend more in the urban areas.
This also led to raise the incomes of those residing in urban areas In this way, the income inequalities grew between the classes in the UDCs.
11
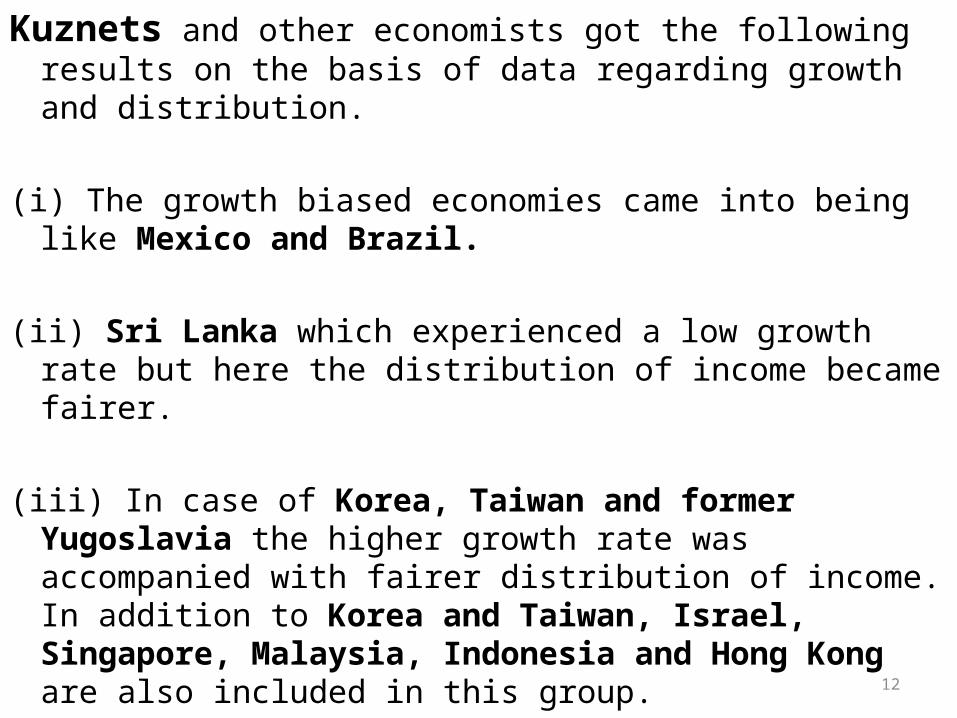
Kuznets and other economists got the following results on the basis of data regarding growth and distribution.
(i) The growth biased economies came into being like Mexico and Brazil.
(ii) Sri Lanka which experienced a low growth rate but here the distribution of income became fairer.
(iii) In case of Korea, Taiwan and former Yugoslavia the higher growth rate was accompanied with fairer distribution of income. In addition to Korea and Taiwan, Israel, Singapore, Malaysia, Indonesia and Hong Kong are also included in this group. 12

The marvelous and remarkable performance of East Asian Countries is attributed to the followings:
(i) The saving rates heavily increased due to better policies.(ii) The labor force of these countries was found highly
efficient, dutiful and hardworking.(iii) The govts. of these countries left no stone unturned to
encourage the entrepreneurs.(iv) These countries laid heavy stress upon boosting their
exports.(v) These countries did not hesitate in importing technologies
and knowledge etc.(vi) These economies altered themselves in the purview of
world circumstances.(vii) They attempted to maintain macro economic stability.13
MILLENIUM DEVELOPMENT GOALS (MDGs)
A global agenda for development
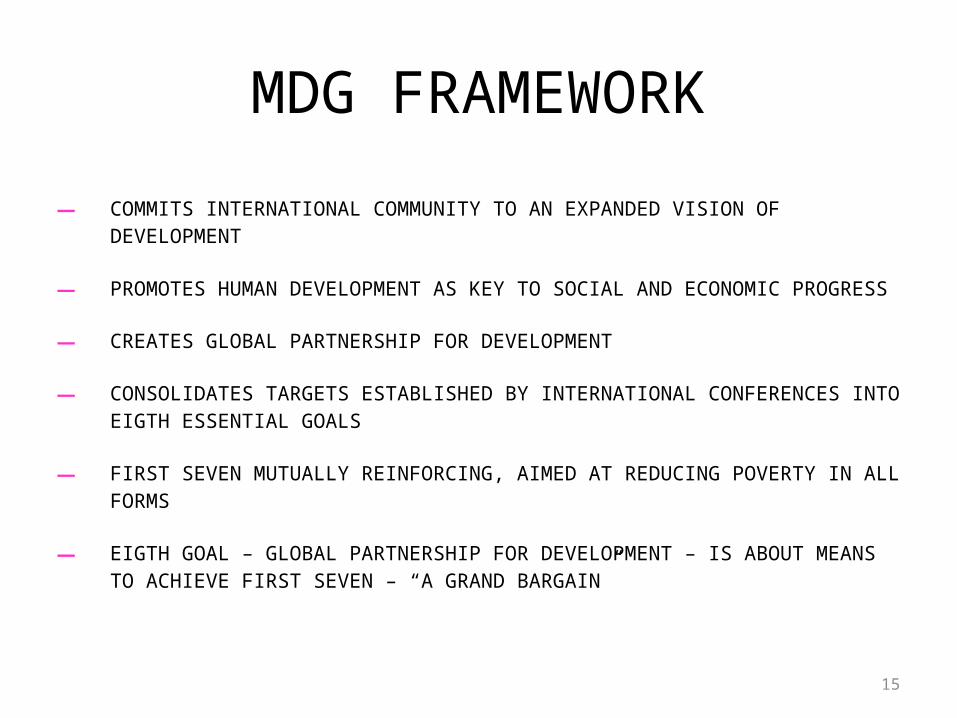
MDG FRAMEWORK
― COMMITS INTERNATIONAL COMMUNITY TO AN EXPANDED VISION OF DEVELOPMENT
― PROMOTES HUMAN DEVELOPMENT AS KEY TO SOCIAL AND ECONOMIC PROGRESS
― CREATES GLOBAL PARTNERSHIP FOR DEVELOPMENT
― CONSOLIDATES TARGETS ESTABLISHED BY INTERNATIONAL CONFERENCES INTO EIGTH ESSENTIAL GOALS
― FIRST SEVEN MUTUALLY REINFORCING, AIMED AT REDUCING POVERTY IN ALL FORMS
― EIGTH GOAL – GLOBAL PARTNERSHIP FOR DEVELOPMENT – IS ABOUT MEANS TO ACHIEVE FIRST SEVEN – “A GRAND BARGAIN”
15
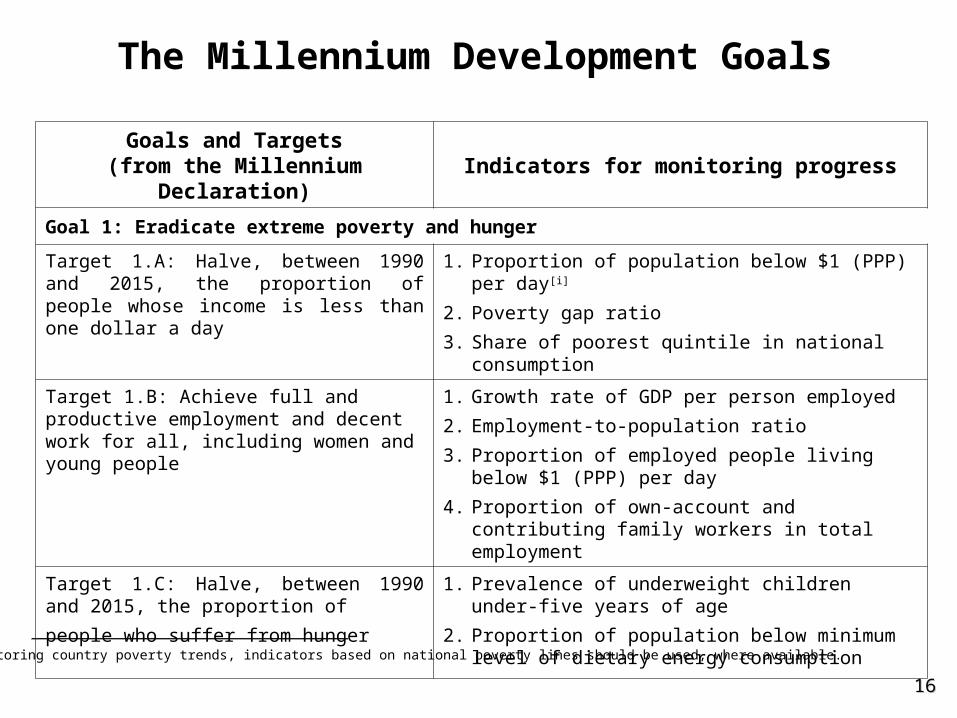
The Millennium Development Goals
[i] For monitoring country poverty trends, indicators based on national poverty lines should be used, where available.
Goals and Targets(from the Millennium
Declaration)Indicators for monitoring progress
Goal 1: Eradicate extreme poverty and hunger
Target 1.A: Halve, between 1990 and 2015, the proportion of people whose income is less than one dollar a day
1. Proportion of population below $1 (PPP) per day[i]
2. Poverty gap ratio
3. Share of poorest quintile in national consumption
Target 1.B: Achieve full and productive employment and decent work for all, including women and young people
1. Growth rate of GDP per person employed
2. Employment-to-population ratio
3. Proportion of employed people living below $1 (PPP) per day
4. Proportion of own-account and contributing family workers in total employment
Target 1.C: Halve, between 1990 and 2015, the proportion of
people who suffer from hunger
1. Prevalence of underweight children under-five years of age
2. Proportion of population below minimum level of dietary energy consumption
1616
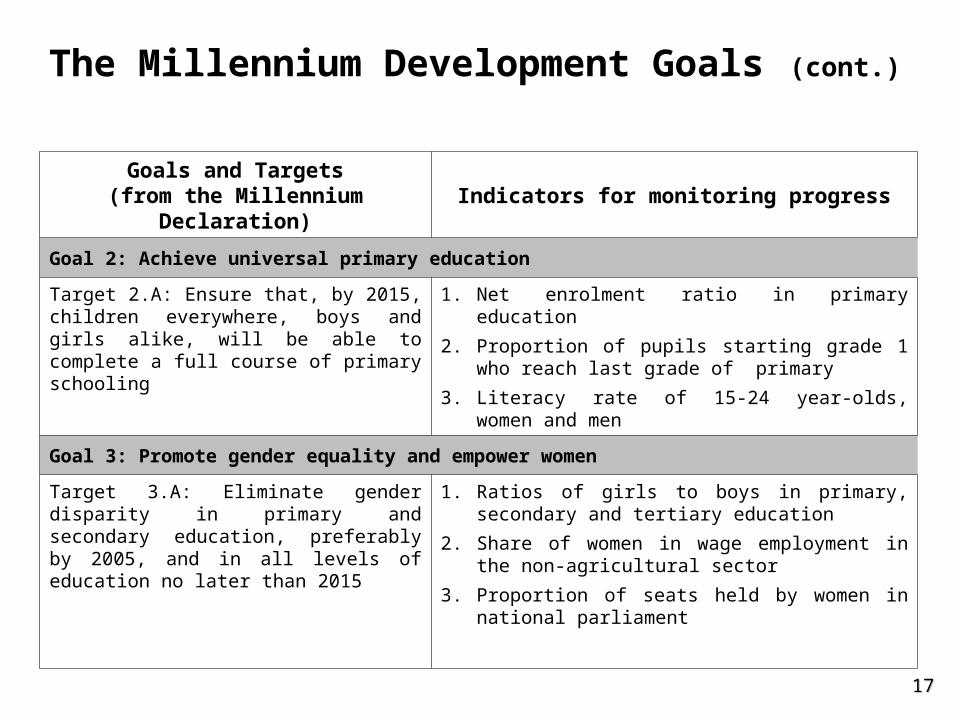
The Millennium Development Goals (cont.)
Goals and Targets(from the Millennium
Declaration)Indicators for monitoring progress
Goal 2: Achieve universal primary education
Target 2.A: Ensure that, by 2015, children everywhere, boys and girls alike, will be able to complete a full course of primary schooling
1. Net enrolment ratio in primary education
2. Proportion of pupils starting grade 1 who reach last grade of primary
3. Literacy rate of 15-24 year-olds, women and men
Goal 3: Promote gender equality and empower women
Target 3.A: Eliminate gender disparity in primary and secondary education, preferably by 2005, and in all levels of education no later than 2015
1. Ratios of girls to boys in primary, secondary and tertiary education
2. Share of women in wage employment in the non-agricultural sector
3. Proportion of seats held by women in national parliament
1717

The Millennium Development Goals (cont.)
Goals and Targets(from the Millennium
Declaration)Indicators for monitoring progress
Goal 4: Reduce child mortality
Target 4.A: Reduce by two-thirds, between 1990 and 2015, the under-five mortality rate
1. Under-five mortality rate
2. Infant mortality rate
3. Proportion of 1 year-old children immunised against measles
Goal 5: Improve maternal health
Target 5.A: Reduce by three quarters, between 1990 and 2015, the maternal mortality ratio
1. Maternal mortality ratio
2. Proportion of births attended by skilled health personnel
Target 5.B: Achieve, by 2015, universal access to reproductive health
1. Contraceptive prevalence rate
2. Adolescent birth rate
3. Antenatal care coverage (at least one visit and at least four visits)
4. Unmet need for family planning
1818
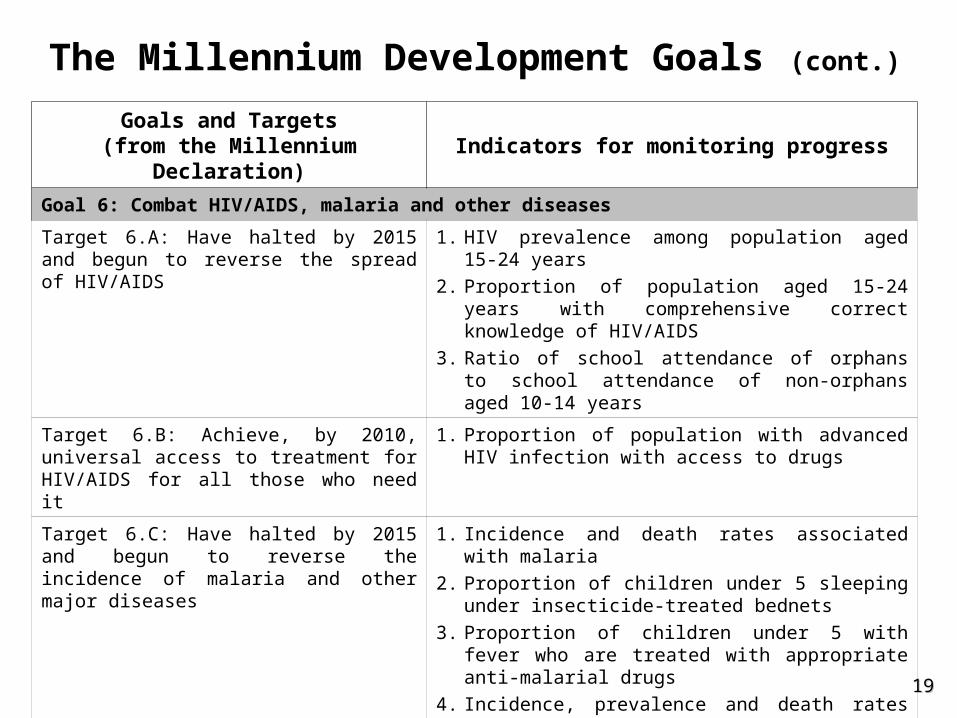
The Millennium Development Goals (cont.)
Goals and Targets(from the Millennium
Declaration)Indicators for monitoring progress
Goal 6: Combat HIV/AIDS, malaria and other diseases
Target 6.A: Have halted by 2015 and begun to reverse the spread of HIV/AIDS
1. HIV prevalence among population aged 15-24 years
2. Proportion of population aged 15-24 years with comprehensive correct knowledge of HIV/AIDS
3. Ratio of school attendance of orphans to school attendance of non-orphans aged 10-14 years
Target 6.B: Achieve, by 2010, universal access to treatment for HIV/AIDS for all those who need it
1. Proportion of population with advanced HIV infection with access to drugs
Target 6.C: Have halted by 2015 and begun to reverse the incidence of malaria and other major diseases
1. Incidence and death rates associated with malaria
2. Proportion of children under 5 sleeping under insecticide-treated bednets
3. Proportion of children under 5 with fever who are treated with appropriate anti-malarial drugs
4. Incidence, prevalence and death rates associated with tuberculosis
5. Proportion of tuberculosis cases detected and cured under directly observed treatment short course
1919
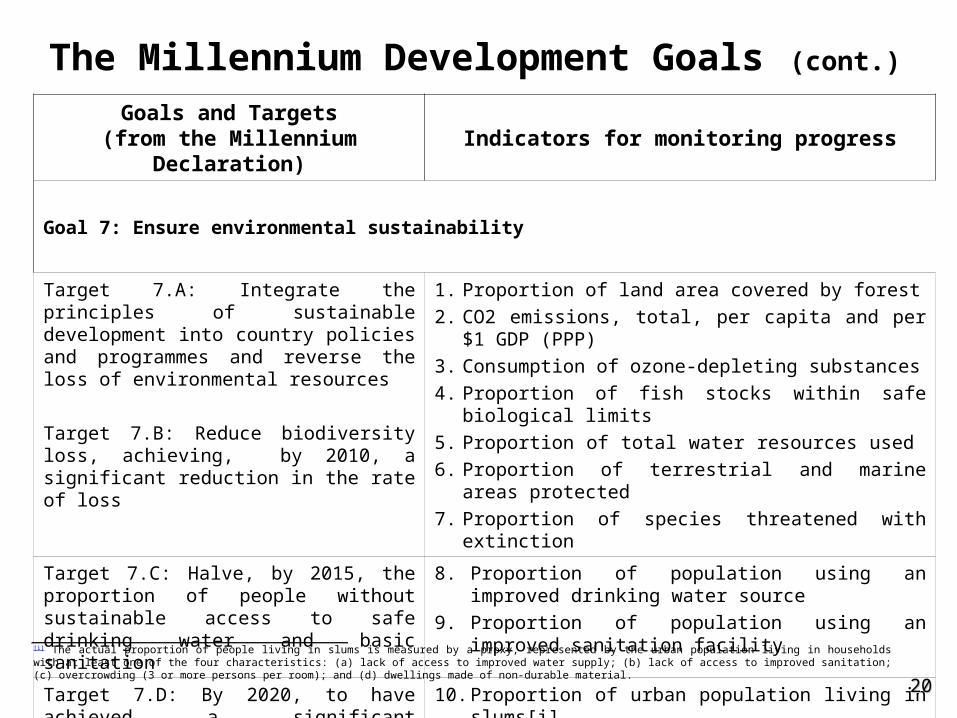
The Millennium Development Goals (cont.)
Goals and Targets(from the Millennium
Declaration)Indicators for monitoring progress
Goal 7: Ensure environmental sustainability
Target 7.A: Integrate the principles of sustainable development into country policies and programmes and reverse the loss of environmental resources Target 7.B: Reduce biodiversity loss, achieving, by 2010, a significant reduction in the rate of loss
1. Proportion of land area covered by forest2. CO2 emissions, total, per capita and per $1 GDP
(PPP)3. Consumption of ozone-depleting substances4. Proportion of fish stocks within safe biological
limits5. Proportion of total water resources used 6. Proportion of terrestrial and marine areas
protected7. Proportion of species threatened with extinction
Target 7.C: Halve, by 2015, the proportion of people without sustainable access to safe drinking water and basic sanitation
8. Proportion of population using an improved drinking water source
9. Proportion of population using an improved sanitation facility
Target 7.D: By 2020, to have achieved a significant improvement in the lives of at least 100 million slum dwellers
10. Proportion of urban population living in slums[i]
[i] The actual proportion of people living in slums is measured by a proxy, represented by the urban population living in households with at least one of the four characteristics: (a) lack of access to improved water supply; (b) lack of access to improved sanitation; (c) overcrowding (3 or more persons per room); and (d) dwellings made of non-durable material.
2020
The Millennium Development Goals (cont.)
Goals and Targets(from the Millennium
Declaration)Indicators for monitoring progress
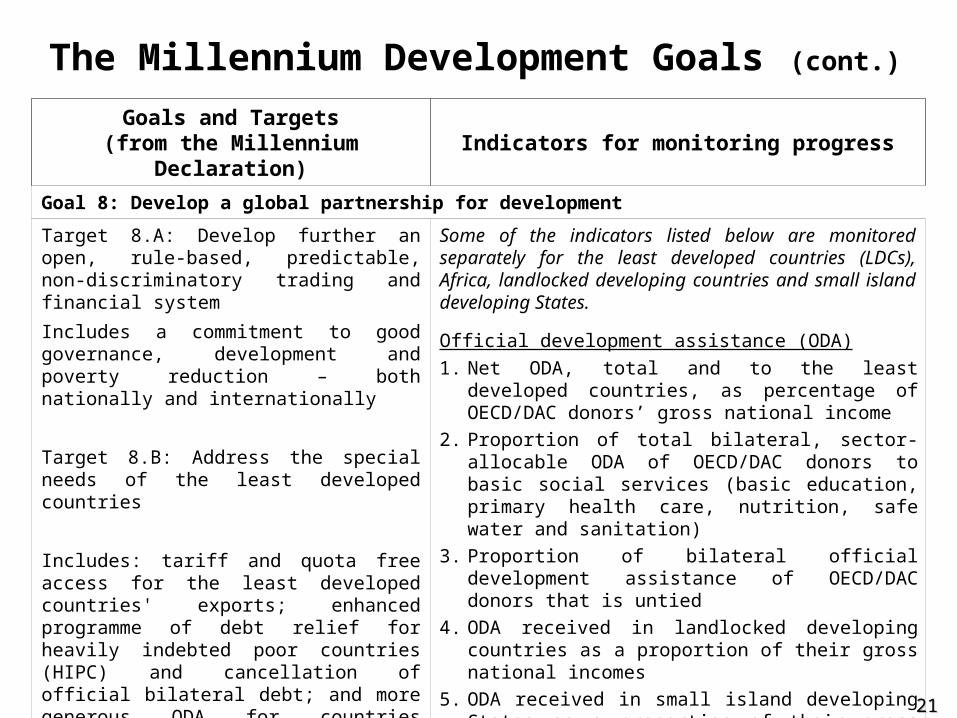
Goal 8: Develop a global partnership for development
Target 8.A: Develop further an open, rule-based, predictable, non-discriminatory trading and financial system
Includes a commitment to good governance, development and poverty reduction – both nationally and internationally
Target 8.B: Address the special needs of the least developed countries
Includes: tariff and quota free access for the least developed countries' exports; enhanced programme of debt relief for heavily indebted poor countries (HIPC) and cancellation of official bilateral debt; and more generous ODA for countries committed to poverty reduction
Some of the indicators listed below are monitored separately for the least developed countries (LDCs), Africa, landlocked developing countries and small island developing States.
Official development assistance (ODA)
1. Net ODA, total and to the least developed countries, as percentage of OECD/DAC donors’ gross national income
2. Proportion of total bilateral, sector-allocable ODA of OECD/DAC donors to basic social services (basic education, primary health care, nutrition, safe water and sanitation)
3. Proportion of bilateral official development assistance of OECD/DAC donors that is untied
4. ODA received in landlocked developing countries as a proportion of their gross national incomes
5. ODA received in small island developing States as a proportion of their gross national incomes
2121

The Millennium Development Goals (cont.)
Goals and Targets(from the Millennium
Declaration)Indicators for monitoring progress
Goal 8: Develop a global partnership for development (cont.)
Target 8.C: Address the special needs of landlocked developing countries and small island developing States (through the Programme of Action for the Sustainable Development of Small Island Developing States and the outcome of the twenty-second special session of the General Assembly)
Target 8.D: Deal comprehensively with the debt problems of developing countries through national and international measures in order to make debt sustainable in the long term
Market access6. Proportion of total developed country imports (by value and excluding arms) from developing countries and least developed countries, admitted free of duty
7. Average tariffs imposed by developed countries on agricultural products and textiles and clothing from developing countries
8. Agricultural support estimate for OECD countries as a percentage of their gross domestic product
9. Proportion of ODA provided to help build trade capacity )
10.Total number of countries that have reached their HIPC decision points and number that have reached their HIPC completion points (cumulative)
11.Debt relief committed under HIPC and MDRI Initiatives
12.Debt service as a percentage of exports of goods and services
Debt sustainability
2222

The Millennium Development Goals (cont.)
Goals and Targets(from the Millennium
Declaration)Indicators for monitoring progress
Goal 8: Develop a global partnership for development (cont.)
Target 8.E: In cooperation with pharmaceutical companies, provide access to affordable essential drugs in developing countries
13.Proportion of population with access to affordable essential drugs on a sustainable basis
Target 8.F: In cooperation with the private sector, make available the benefits of new technologies, especially information and communications
14.Telephone lines per 100 population
15.Cellular subscribers per 100 population
16.Internet users per 100 population
2323
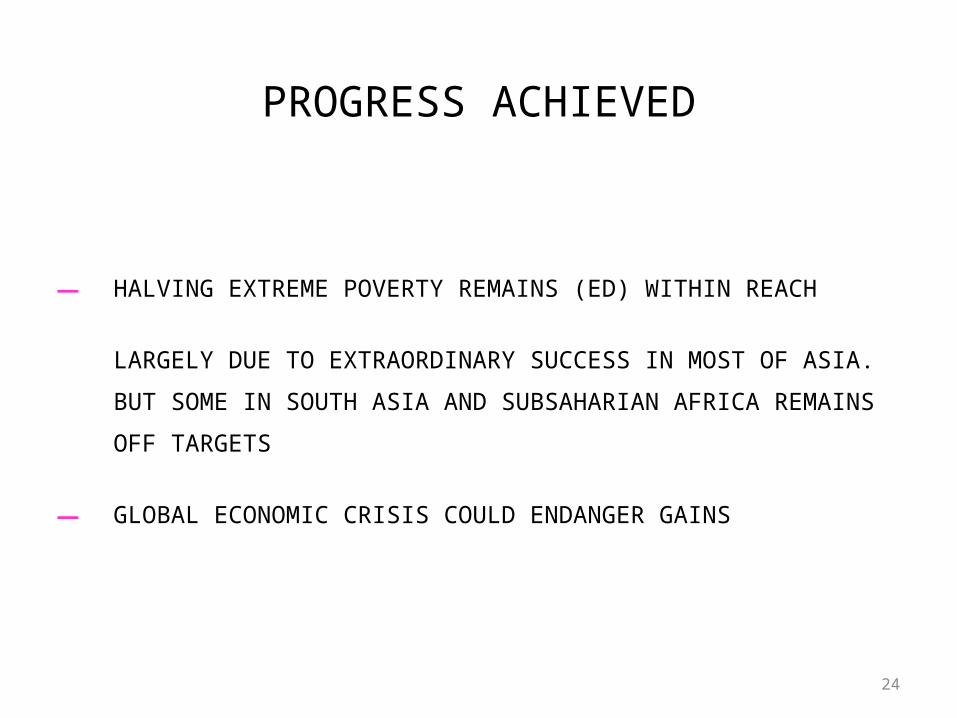
PROGRESS ACHIEVED
― HALVING EXTREME POVERTY REMAINS (ED) WITHIN REACH
LARGELY DUE TO EXTRAORDINARY SUCCESS IN MOST OF ASIA. BUT SOME IN
SOUTH ASIA AND SUBSAHARIAN AFRICA REMAINS OFF TARGETS
― GLOBAL ECONOMIC CRISIS COULD ENDANGER GAINS
24

PROGRESS ACHIEVED (CONT.)
― OTHER SOCIAL GOALS – SOME PROMISE
PRIMARY SCHOOL ENROLMENT
90% REACHED IN EIGTH OUT OF TEN REGION
GENDER PARITY 95% IN SCHOOL IN SIX OF TEN REGIONS
DEATH FROM MEASLES CUT ONE THIRD 2000-2006
VACCINATION RATE 80% FOR CHILDREN IN DEVELOPING WORLD
1.5 BILLION PEOPLE GAINED ACCESS TO CLEAN DRINKING WATER
ACCESS TO MEDICINES SPREADING
THANKS TO DEBT WRITE OFFS AND REDUCED DEBT SERVICE, SOCIAL SERVICES SPENDING UP
25
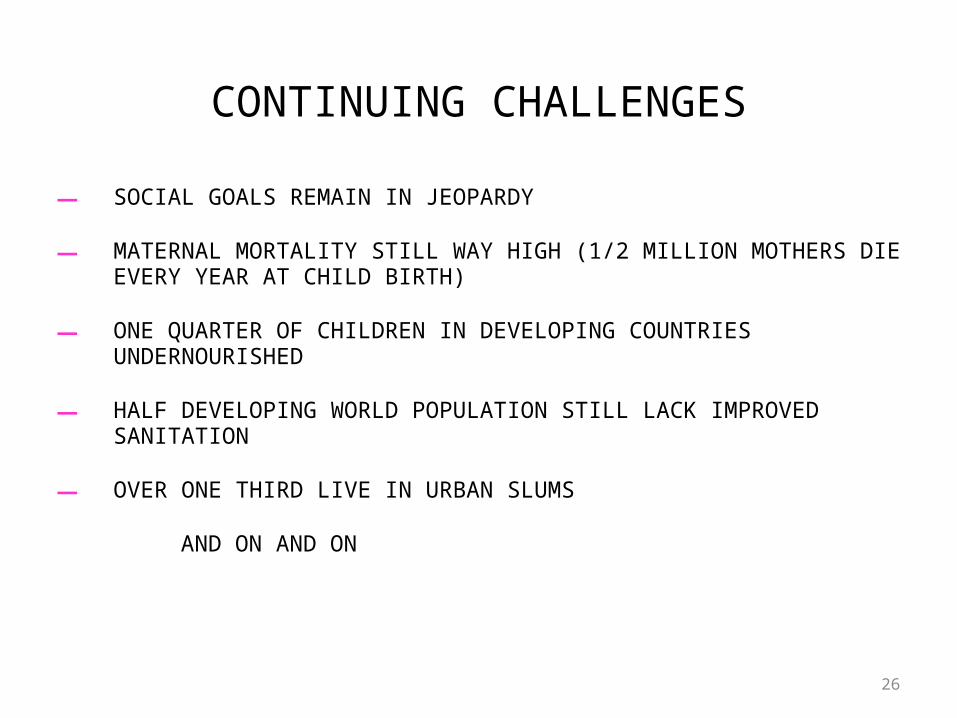
CONTINUING CHALLENGES
― SOCIAL GOALS REMAIN IN JEOPARDY
― MATERNAL MORTALITY STILL WAY HIGH (1/2 MILLION MOTHERS DIE EVERY YEAR AT CHILD BIRTH)
― ONE QUARTER OF CHILDREN IN DEVELOPING COUNTRIES UNDERNOURISHED
― HALF DEVELOPING WORLD POPULATION STILL LACK IMPROVED SANITATION
― OVER ONE THIRD LIVE IN URBAN SLUMS
AND ON AND ON
26


