

1 QPE Algorithm Update Bob Kuligowski, NOAA/NESDIS/STAR Walt Petersen, NASA-MSFC Nai-Yu Wang, U....
29
1 QPE Algorithm Update QPE Algorithm Update Bob Kuligowski, NOAA/NESDIS/STAR Bob Kuligowski, NOAA/NESDIS/STAR Walt Petersen, NASA-MSFC Walt Petersen, NASA-MSFC Nai-Yu Wang, U. Maryland Nai-Yu Wang, U. Maryland 3 3 rd rd Annual GOES-R GLM Science Meeting Annual GOES-R GLM Science Meeting Huntsville, AL 1-3 December 2010 Huntsville, AL 1-3 December 2010
-
Upload
delilah-lawrence -
Category
Documents
-
view
213 -
download
0
Transcript of 1 QPE Algorithm Update Bob Kuligowski, NOAA/NESDIS/STAR Walt Petersen, NASA-MSFC Nai-Yu Wang, U....
1
QPE Algorithm UpdateQPE Algorithm Update
Bob Kuligowski, NOAA/NESDIS/STARBob Kuligowski, NOAA/NESDIS/STAR
Walt Petersen, NASA-MSFCWalt Petersen, NASA-MSFC
Nai-Yu Wang, U. MarylandNai-Yu Wang, U. Maryland
33rdrd Annual GOES-R GLM Science Meeting Annual GOES-R GLM Science Meeting
Huntsville, AL 1-3 December 2010Huntsville, AL 1-3 December 2010
2
OutlineOutline
GOES-R Rainfall Rate Algorithm Update Walt Petersen’s Update Nai-Yu Wang’s GOES-R3 Work
3
Rainfall Rate Algorithm Rainfall Rate Algorithm DescriptionDescription
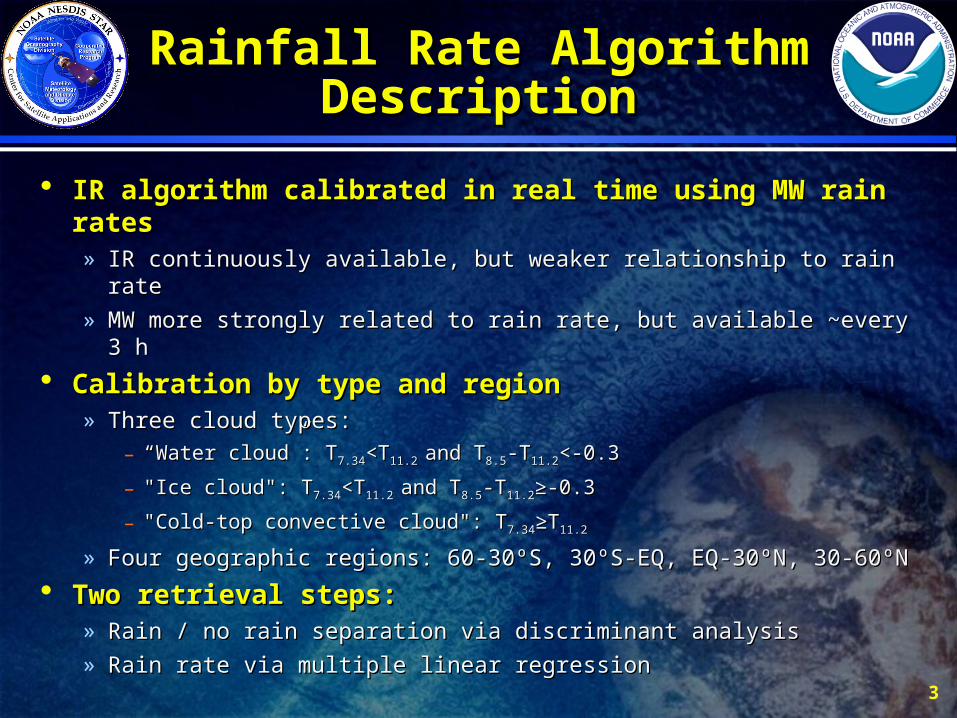
IR algorithm calibrated in real time using MW rain ratesIR algorithm calibrated in real time using MW rain rates» IR continuously available, but weaker relationship to rain rateIR continuously available, but weaker relationship to rain rate
» MW more strongly related to rain rate, but available ~every 3 hMW more strongly related to rain rate, but available ~every 3 h
Calibration by type and regionCalibration by type and region» Three cloud types:Three cloud types:
– ““Water cloud”: TWater cloud”: T7.347.34<T<T11.2 11.2 and Tand T8.58.5-T-T11.211.2<-0.3<-0.3
– "Ice cloud": T"Ice cloud": T7.347.34<T<T11.2 11.2 and Tand T8.58.5-T-T11.211.2≥-0.3≥-0.3
– ""Cold-top convective cloudCold-top convective cloud"": T: T7.347.34≥T≥T11.211.2
» Four geographic regions: 60-30ºS, 30ºS-EQ, EQ-30ºN, 30-60ºNFour geographic regions: 60-30ºS, 30ºS-EQ, EQ-30ºN, 30-60ºN
Two retrieval steps:Two retrieval steps:» Rain / no rain separation via discriminant analysisRain / no rain separation via discriminant analysis
» Rain rate via multiple linear regression Rain rate via multiple linear regression
4
Rainfall Rate Algorithm Rainfall Rate Algorithm DescriptionDescription
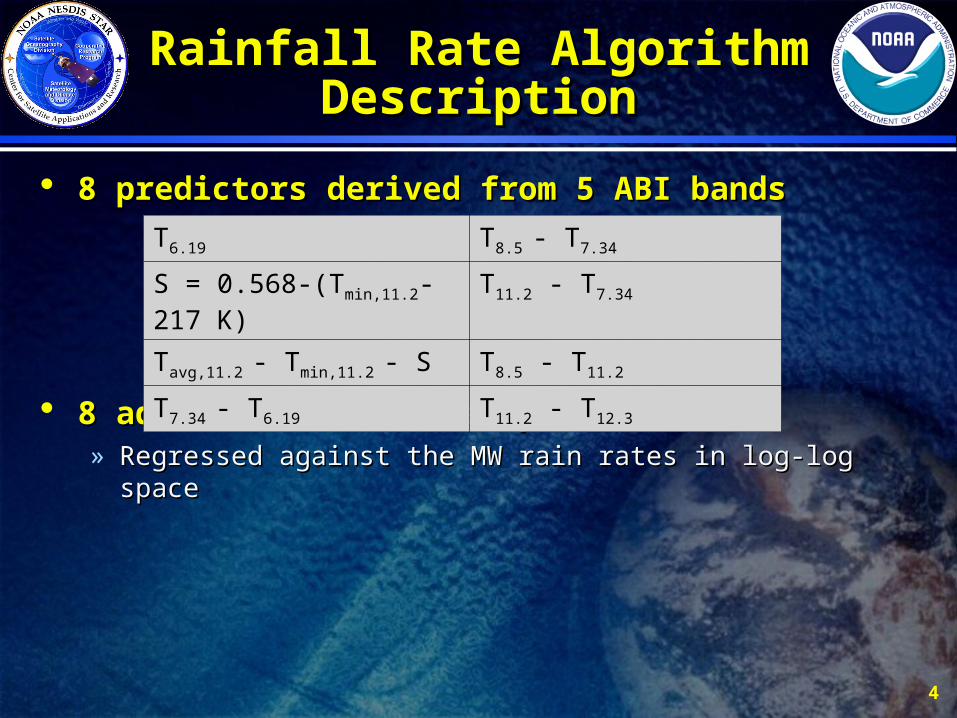
8 predictors derived from 5 ABI bands8 predictors derived from 5 ABI bands
8 additional nonlinear predictors8 additional nonlinear predictors» Regressed against the MW rain rates in log-log spaceRegressed against the MW rain rates in log-log space
T6.19 T8.5 - T7.34
S = 0.568-(Tmin,11.2-217 K) T11.2 - T7.34
Tavg,11.2 - Tmin,11.2 - S T8.5 - T11.2
T7.34 - T6.19 T11.2 - T12.3
5
Rainfall Rate Algorithm Rainfall Rate Algorithm DescriptionDescription
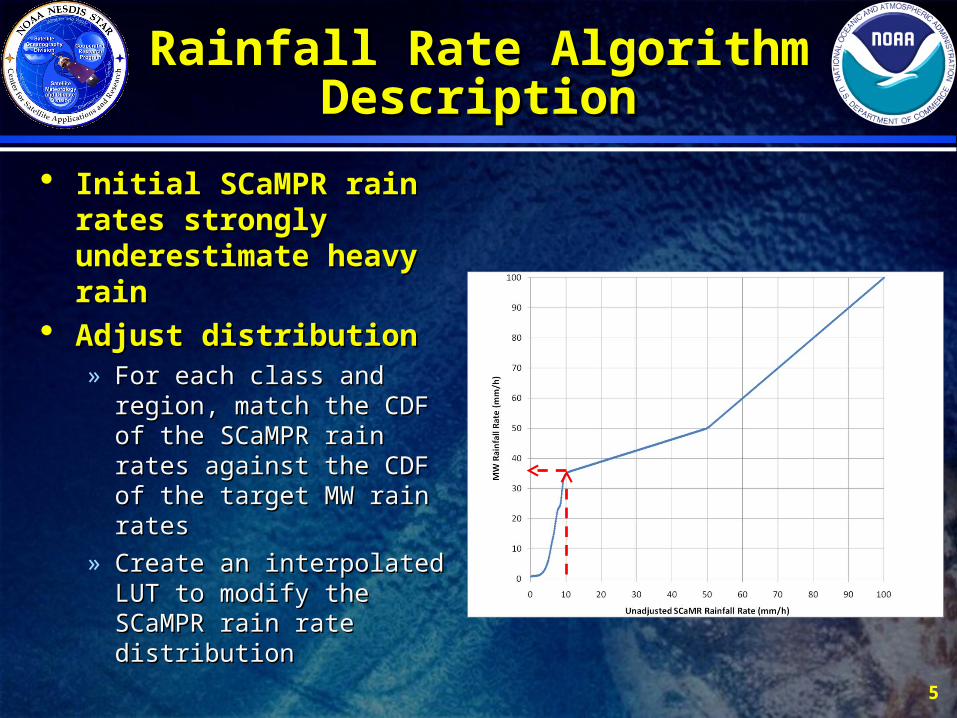
Initial SCaMPR rain rates Initial SCaMPR rain rates strongly underestimate strongly underestimate heavy rainheavy rain
Adjust distributionAdjust distribution» For each class and region, For each class and region,
match the CDF of the match the CDF of the SCaMPR rain rates against SCaMPR rain rates against the CDF of the target MW the CDF of the target MW rain ratesrain rates
» Create an interpolated LUT Create an interpolated LUT to modify the SCaMPR rain to modify the SCaMPR rain rate distributionrate distribution

Rainfall Rate Algorithm Rainfall Rate Algorithm DescriptionDescription
Update calibration when new MW rain rates available
Apply most recent calibration in between new MW overpasses
Retrieve rain rates from ABI data 6

7
Rainfall Rate ExamplesRainfall Rate Examples
Radar
Rainfall Rate
8
Validation: Truth DataValidation: Truth Data
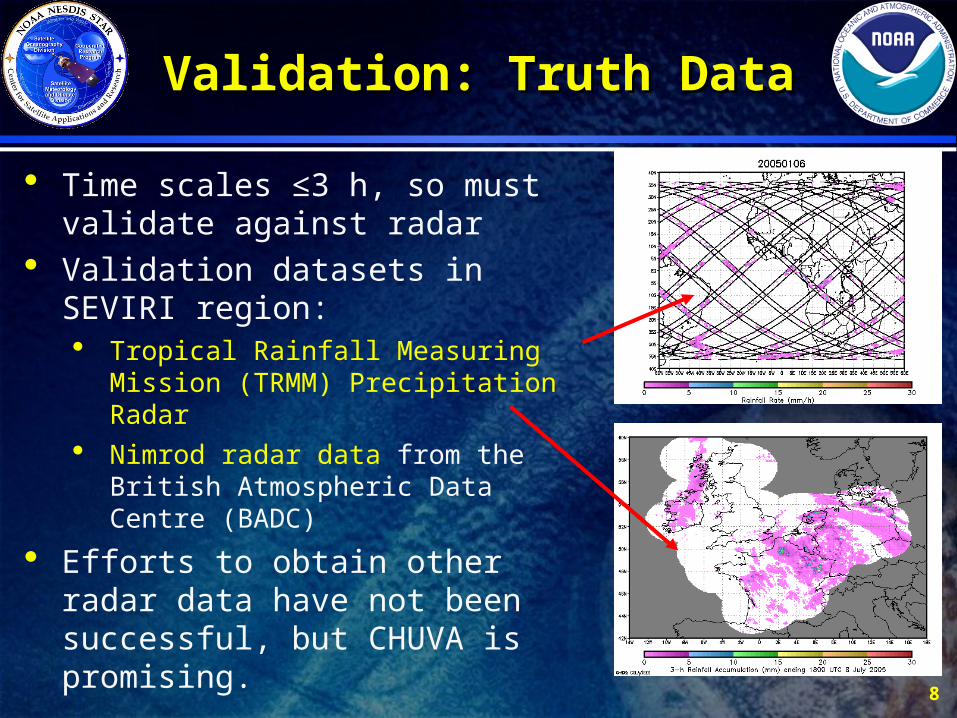
Time scales ≤3 h, so must validate against radar
Validation datasets in SEVIRI region: Tropical Rainfall Measuring Mission
(TRMM) Precipitation Radar Nimrod radar data from the British
Atmospheric Data Centre (BADC)
Efforts to obtain other radar data have not been successful, but CHUVA is promising.
999
Rainfall Rate “Fuzzy” Rainfall Rate “Fuzzy” ValidationValidation
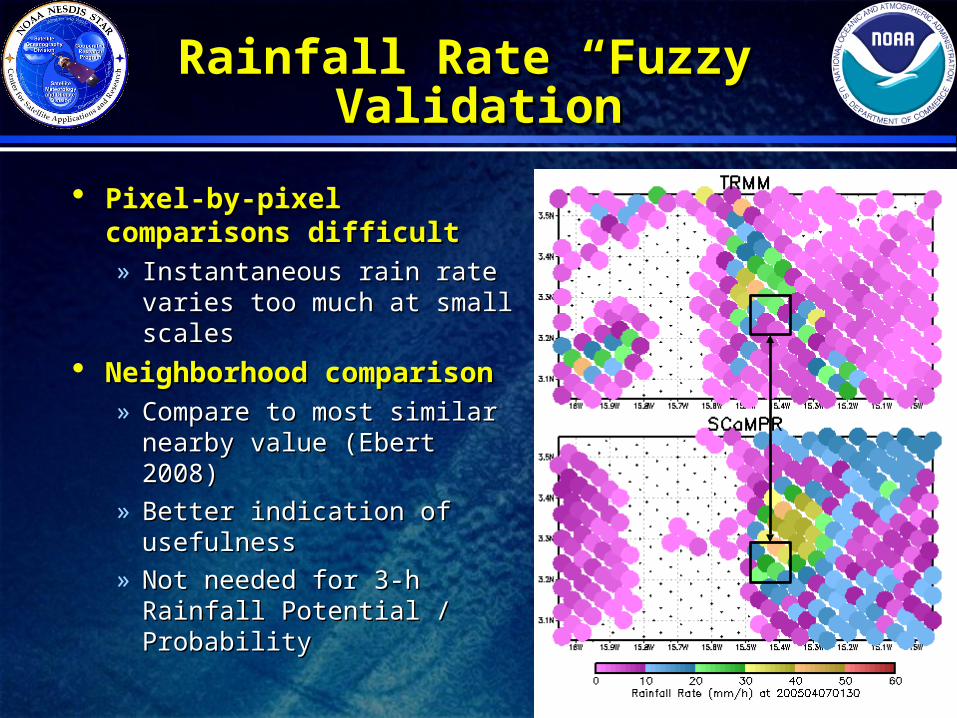
Pixel-by-pixel comparisons Pixel-by-pixel comparisons difficultdifficult» Instantaneous rain rate Instantaneous rain rate
varies too much at small varies too much at small scalesscales
Neighborhood comparison Neighborhood comparison » Compare to most similar Compare to most similar
nearby value (Ebert 2008) nearby value (Ebert 2008)
» Better indication of Better indication of usefulnessusefulness
» Not needed for 3-h Rainfall Not needed for 3-h Rainfall Potential / ProbabilityPotential / Probability
10
Rainfall Rate ValidationRainfall Rate Validation
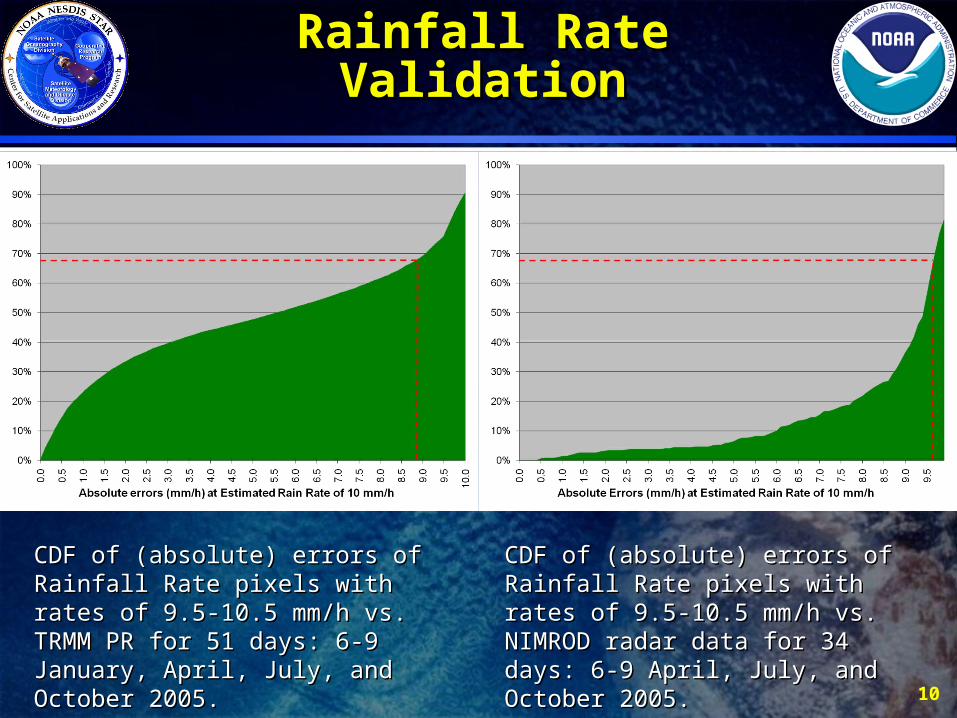
CDF of (absolute) errors of Rainfall CDF of (absolute) errors of Rainfall Rate pixels with rates of 9.5-10.5 mm/h Rate pixels with rates of 9.5-10.5 mm/h vs.vs. NIMROD radar data for 34 days: 6-NIMROD radar data for 34 days: 6-9 April, July, and October 2005.9 April, July, and October 2005.
CDF of (absolute) errors of Rainfall CDF of (absolute) errors of Rainfall Rate pixels with rates of 9.5-10.5 mm/h Rate pixels with rates of 9.5-10.5 mm/h vs. TRMM PR for 51 days: 6-9 vs. TRMM PR for 51 days: 6-9 January, April, July, and October 2005.January, April, July, and October 2005.
11
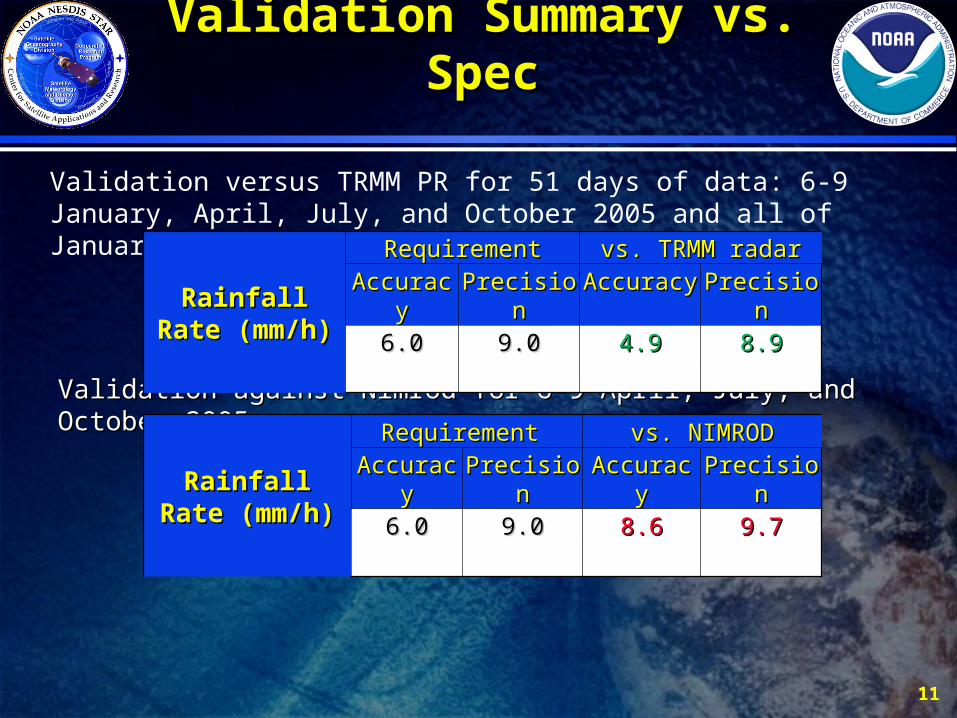
Validation Summary vs. Validation Summary vs. SpecSpec
Validation against Nimrod for 6-9 April, July, and October 2005:Validation against Nimrod for 6-9 April, July, and October 2005:
Validation versus TRMM PR for 51 days of data: 6-9 January, April, July, and October 2005 and all of January 2008:
Rainfall Rate Rainfall Rate (mm/h)(mm/h)
RequirementRequirement vs. TRMM radarvs. TRMM radar
AccuracyAccuracy PrecisionPrecision AccuracyAccuracy PrecisionPrecision
6.06.0 9.09.0 4.94.9 8.98.9
Rainfall Rate Rainfall Rate (mm/h)(mm/h)
Requirement Requirement vs. NIMRODvs. NIMROD
AccuracyAccuracy PrecisionPrecision AccuracyAccuracy PrecisionPrecision
6.06.0 9.09.0 8.68.6 9.79.7
12
Status and Future WorkStatus and Future Work
Delivered “final” algorithm to System Prime 30 Sep Delivered “final” algorithm to System Prime 30 Sep 20112011
Validation against an additional 4 months of data Validation against an additional 4 months of data ongoingongoing
Developing real-time and “deep-dive” validation tools Developing real-time and “deep-dive” validation tools for further evaluation and potential improvementfor further evaluation and potential improvement
““Maintenance” delivery 30 September 2012 that Maintenance” delivery 30 September 2012 that incorporates feedback from “deep-dive” validationincorporates feedback from “deep-dive” validation

1) Rainfall Detection and Convective and Stratiform (C/S) Precipitation
• Focus: Presence/amount of lightning for establishing systematic differences (e.g., constraints) in cloud-system-wide C/S precipitation and/or SCaMPR cloud ID behavior
GLM QPE Guidance for SCaMPR (W. Petersen, MSFC; A. Leroy, UAH)
• Assume you could identify “cells”……….
Passive Microwave Tuning and Cloud (cell) Characteristics

Identifying Systematic C/S behavior in TRMM Features
14
For a given feature area:When lightning present, clear increase in convective area-fraction and convective
rain volume.Stratiform behavior virtually identical between lightning/non-lightning case
Implication: Benefit to knowing both lightning and C/S property.
“Thorns”: • Lifecycle bias? Need to verify with ground based datasets (radar + C/S + LMA)• Features are a “blurry” way to do the job. Need to do things on finer (cell) scales
and take advantage of “locating” capability of lightning information.
Con
vect
ive
Fra
ctio
n.
Feature area
Vol
um
e R
ain.
Feature area
Largeconvective
regions
Smallconvective
cells
Convectivecells with LIS
flashes
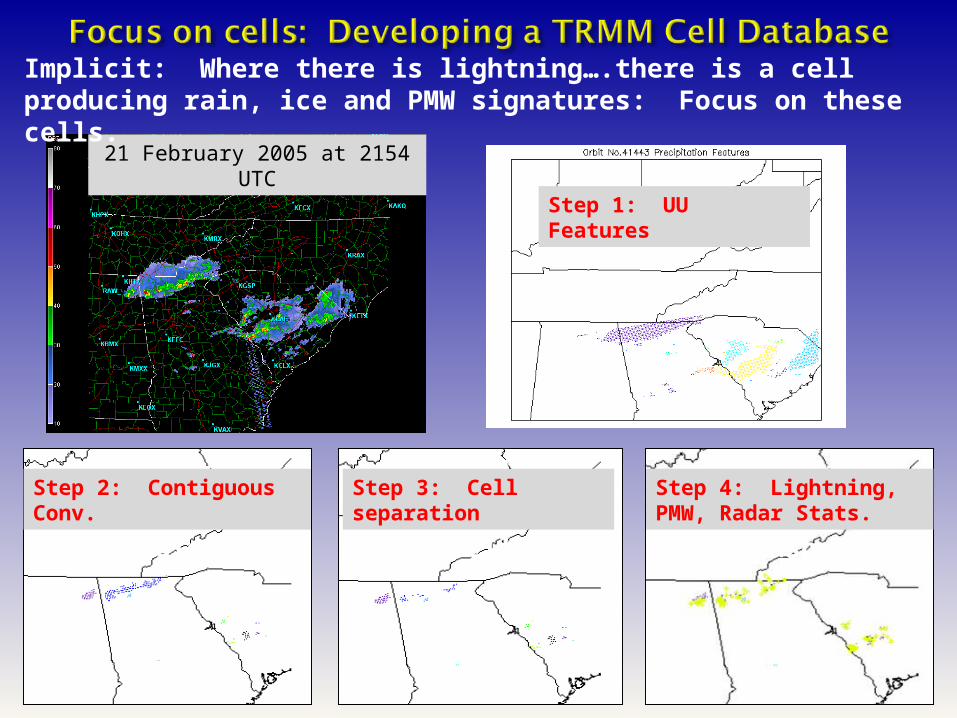
21 February 2005 at 2154 UTC
Step 1: UU Features
Step 2: Contiguous Conv. Step 3: Cell separation Step 4: Lightning, PMW, Radar Stats.
Implicit: Where there is lightning….there is a cell producing rain, ice and PMW signatures: Focus on these cells.
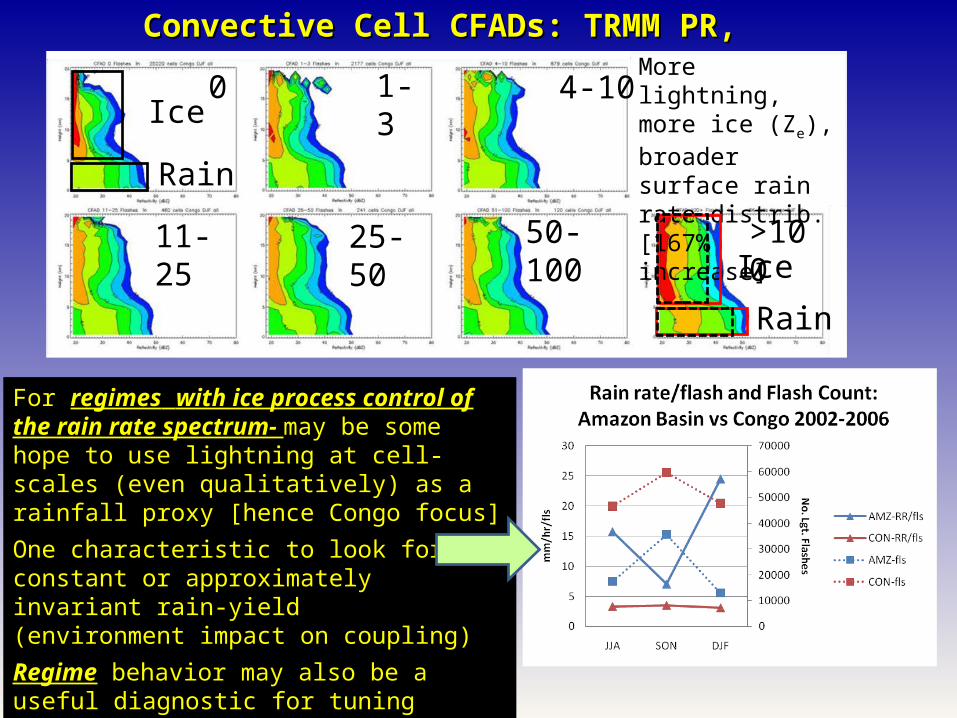
Convective Cell CFADs: TRMM PR, CongoConvective Cell CFADs: TRMM PR, Congo
For regimes with ice process control of the rain rate spectrum- may be some hope to use lightning at cell-scales (even qualitatively) as a rainfall proxy [hence Congo focus]
One characteristic to look for- a constant or approximately invariant rain-yield(environment impact on coupling)
Regime behavior may also be a useful diagnostic for tuning satellite QPE algorithm
More lightning, more ice (Ze), broader surface rain rate distrib. [167% increase]
Ice
Rain
Ice
Rain
0 1-3 4-10
11-25 25-50 50-100 >100

From LEO, given a cell size, what is the “expected” flash count?
Given a cell size, what is the “expected” minimum 85 GHz TB?
Obvious limitation is LEO- but this is the PMW tuning provided
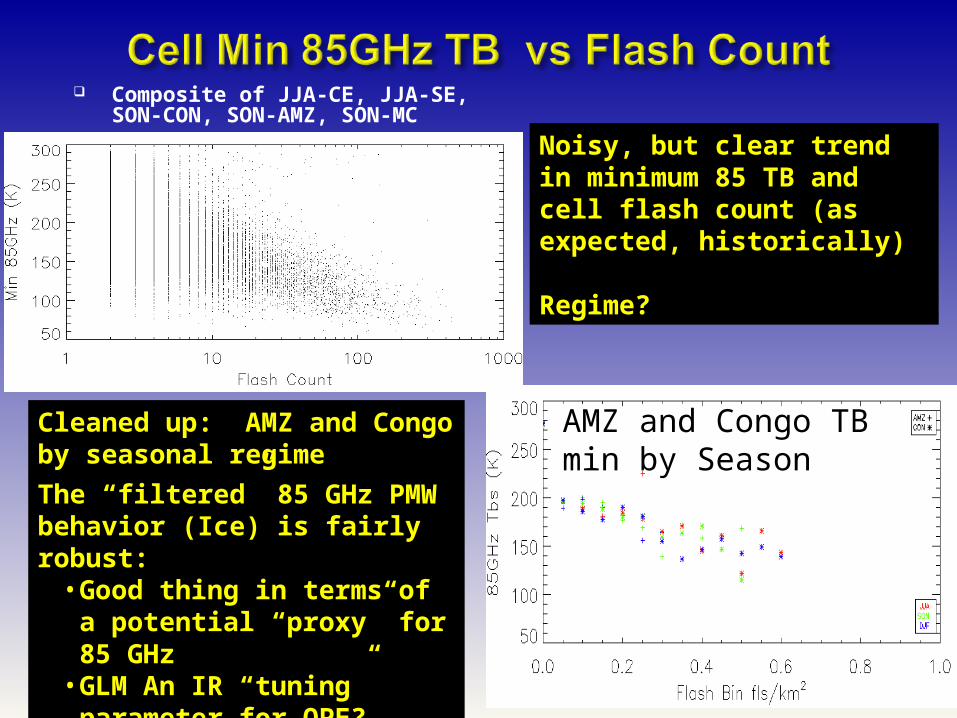
Composite of JJA-CE, JJA-SE, SON-CON, SON-AMZ, SON-MC
Cleaned up: AMZ and Congo by seasonal regime
The “filtered” 85 GHz PMW behavior (Ice) is fairly robust:
• Good thing in terms of a potential “proxy” for 85 GHz
• GLM An IR “tuning” parameter for QPE?
Noisy, but clear trend in minimum 85 TB and cell flash count (as expected, historically)
Regime?
AMZ and Congo TB min by Season

Moving Forward……..
•Effort 1: Convective Partitioning (Sat. only): Been done….can be improved•Effort 2: A priori Convective Cell statistics (Bayesian data base) as related to GLM (LIS/Proxy flash/areas), IR, PMW (85 and 37), rain rate: Underway. Continue a QPE research collaboration with NASA-GPM
•Effort 3: Parallel SCaMPR algorithm for easy testing of algorithm insertion mechanics, approaches, and impact assessment.
Rapid scan + Ground Val.
LEO Lightning + Radar + PMWDatasets
GOES-R3 FY2010 New StartGOES-R3 FY2010 New Start
Combining GOES-R and GPM to Combining GOES-R and GPM to
improve GOES-R rainrate productimprove GOES-R rainrate product
Nai-Yu Wang, Nai-Yu Wang, University of Maryland, CICSUniversity of Maryland, CICS
Kaushik Gopalan, Kaushik Gopalan, University of Maryland, CICS University of Maryland, CICS
Rachel AlbrechtRachel Albrecht, INPE, Brazil, INPE, Brazil
Eric Bruning, Eric Bruning, Texas Tech UniversityTexas Tech University
Robert Kuligowski, Robert Kuligowski, NOAA/NESDIS/STARNOAA/NESDIS/STAR
Ralph Ferraro, Ralph Ferraro, NOAA/NESDIS/STARNOAA/NESDIS/STAR

MotivationMotivation
• Multi-platform and multi-sensor Multi-platform and multi-sensor synergy of combining GOES-R synergy of combining GOES-R and GPM to improve and GPM to improve precipitation productsprecipitation products
• (1) To improve (1) To improve microwave-based precipitation by connecting the ice-phased microphysics commonly observed by GOES-R lighting and GPM microwave instruments.
• (2) To provide GOES-R QPE algorithm:
Self-Calibrating Multivariate Precipitation Retrieval (SCaMPR) (Kuligowski, 2002)
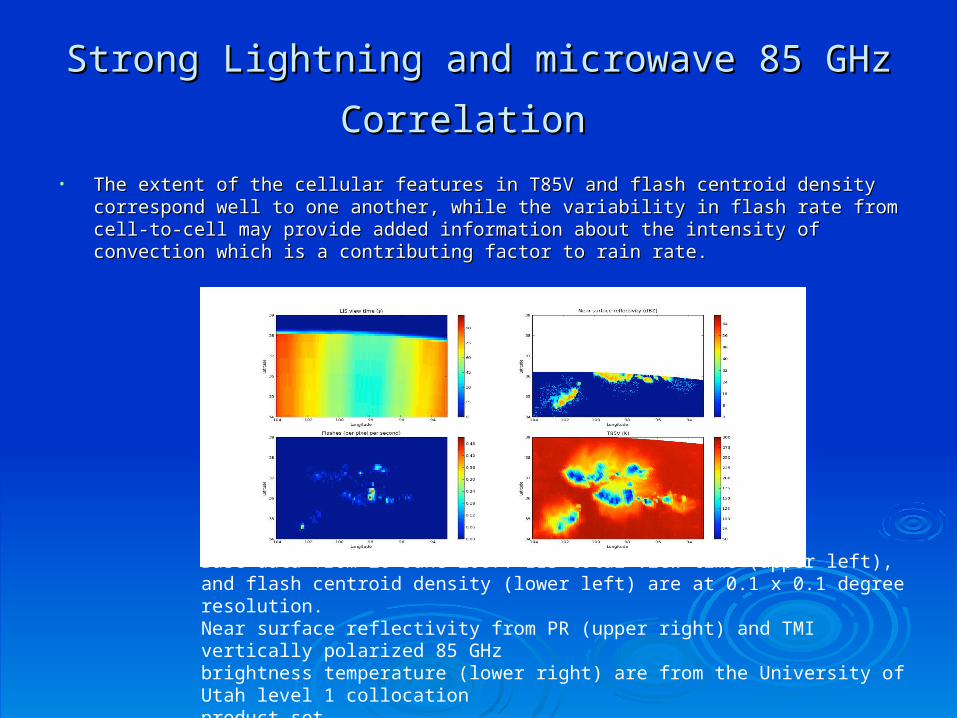
• The extent of the cellular features in T85V and flash centroid density correspond well to one The extent of the cellular features in T85V and flash centroid density correspond well to one another, while the variability in flash rate from cell-to-cell may provide added information about another, while the variability in flash rate from cell-to-cell may provide added information about the intensity of convection which is a contributing factor to rain rate. the intensity of convection which is a contributing factor to rain rate.
Base data from 20 June 2007. LIS total view time (upper left), and flash centroid density (lower left) are at 0.1 x 0.1 degree resolution. Near surface reflectivity from PR (upper right) and TMI vertically polarized 85 GHz brightness temperature (lower right) are from the University of Utah level 1 collocation product set.
Strong Lightning and microwave 85 GHz Strong Lightning and microwave 85 GHz
CorrelationCorrelation
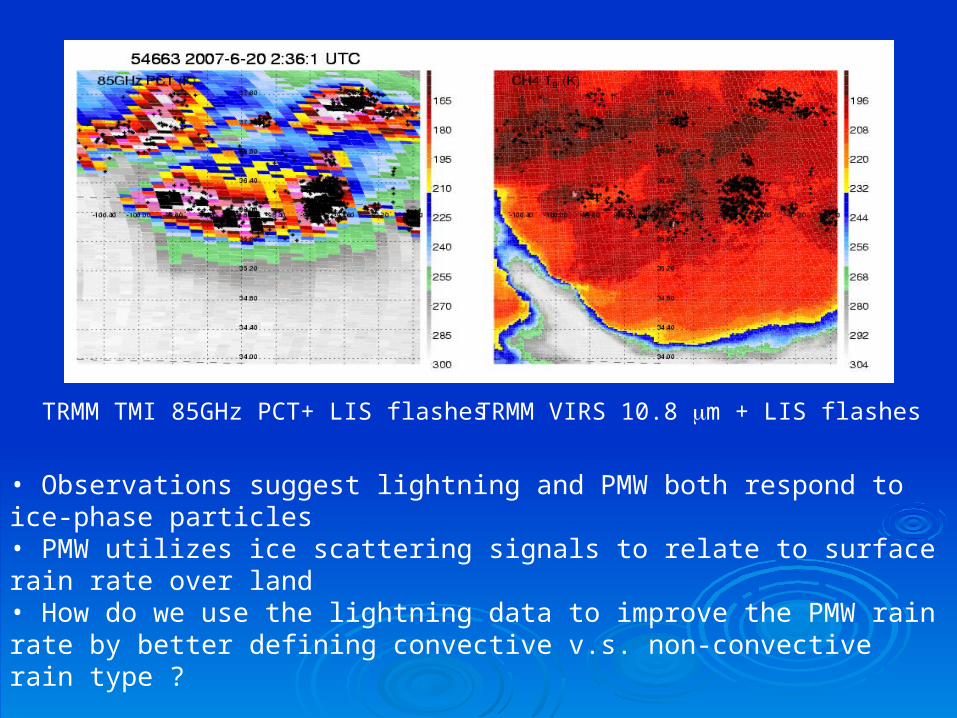
TRMM VIRS 10.8 m + LIS flashesTRMM TMI 85GHz PCT+ LIS flashes
• Observations suggest lightning and PMW both respond to ice-phase particles• PMW utilizes ice scattering signals to relate to surface rain rate over land• How do we use the lightning data to improve the PMW rain rate by better defining convective v.s. non-convective rain type ?
Review of Lightning and Precipitation Previous WorkReview of Lightning and Precipitation Previous Work
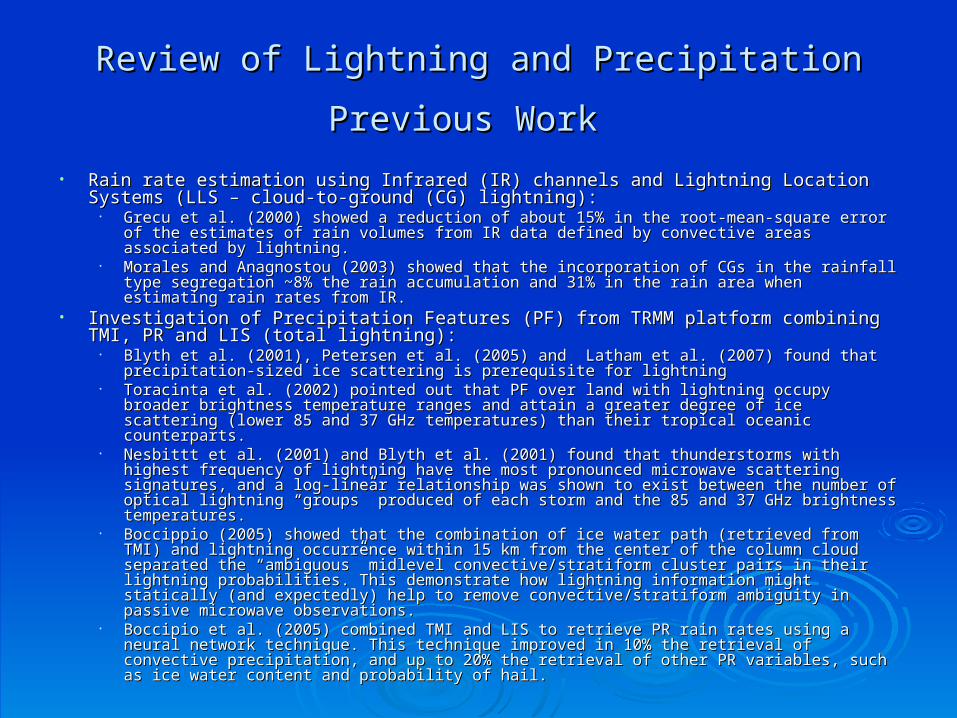
• Rain rate estimation using Infrared (IR) channels and Lightning Location Systems Rain rate estimation using Infrared (IR) channels and Lightning Location Systems (LLS – cloud-to-ground (CG) lightning):(LLS – cloud-to-ground (CG) lightning):
• Grecu et al. (2000) showed a reduction of about 15% in the root-mean-square error of the Grecu et al. (2000) showed a reduction of about 15% in the root-mean-square error of the estimates of rain volumes from IR data defined by convective areas associated by lightning.estimates of rain volumes from IR data defined by convective areas associated by lightning.
• Morales and Anagnostou (2003) showed that the incorporation of CGs in the rainfall type Morales and Anagnostou (2003) showed that the incorporation of CGs in the rainfall type segregation ~8% the rain accumulation and 31% in the rain area when estimating rain rates segregation ~8% the rain accumulation and 31% in the rain area when estimating rain rates from IR. from IR.
• Investigation of Precipitation Features (PF) from TRMM platform combining TMI, PR Investigation of Precipitation Features (PF) from TRMM platform combining TMI, PR and LIS (total lightning):and LIS (total lightning):
• Blyth et al. (2001), Petersen et al. (2005) and Latham et al. (2007) found that precipitation-Blyth et al. (2001), Petersen et al. (2005) and Latham et al. (2007) found that precipitation-sized ice scattering is prerequisite for lightningsized ice scattering is prerequisite for lightning
• Toracinta et al. (2002) pointed out that PF over land with lightning occupy broader Toracinta et al. (2002) pointed out that PF over land with lightning occupy broader brightness temperature ranges and attain a greater degree of ice scattering (lower 85 and brightness temperature ranges and attain a greater degree of ice scattering (lower 85 and 37 GHz temperatures) than their tropical oceanic counterparts.37 GHz temperatures) than their tropical oceanic counterparts.
• Nesbittt et al. (2001) and Blyth et al. (2001) found that thunderstorms with highest frequency Nesbittt et al. (2001) and Blyth et al. (2001) found that thunderstorms with highest frequency of lightning have the most pronounced microwave scattering signatures, and a log-linear of lightning have the most pronounced microwave scattering signatures, and a log-linear relationship was shown to exist between the number of optical lightning “groups” produced relationship was shown to exist between the number of optical lightning “groups” produced of each storm and the 85 and 37 GHz brightness temperatures.of each storm and the 85 and 37 GHz brightness temperatures.
• Boccippio (2005) showed that the combination of ice water path (retrieved from TMI) and Boccippio (2005) showed that the combination of ice water path (retrieved from TMI) and lightning occurrence within 15 km from the center of the column cloud separated the lightning occurrence within 15 km from the center of the column cloud separated the “ambiguous” midlevel convective/stratiform cluster pairs in their lightning probabilities. This “ambiguous” midlevel convective/stratiform cluster pairs in their lightning probabilities. This demonstrate how lightning information might statically (and expectedly) help to remove demonstrate how lightning information might statically (and expectedly) help to remove convective/stratiform ambiguity in passive microwave observations. convective/stratiform ambiguity in passive microwave observations.
• Boccipio et al. (2005) combined TMI and LIS to retrieve PR rain rates using a neural Boccipio et al. (2005) combined TMI and LIS to retrieve PR rain rates using a neural network technique. This technique improved in 10% the retrieval of convective precipitation, network technique. This technique improved in 10% the retrieval of convective precipitation, and up to 20% the retrieval of other PR variables, such as ice water content and probability and up to 20% the retrieval of other PR variables, such as ice water content and probability of hail.of hail.
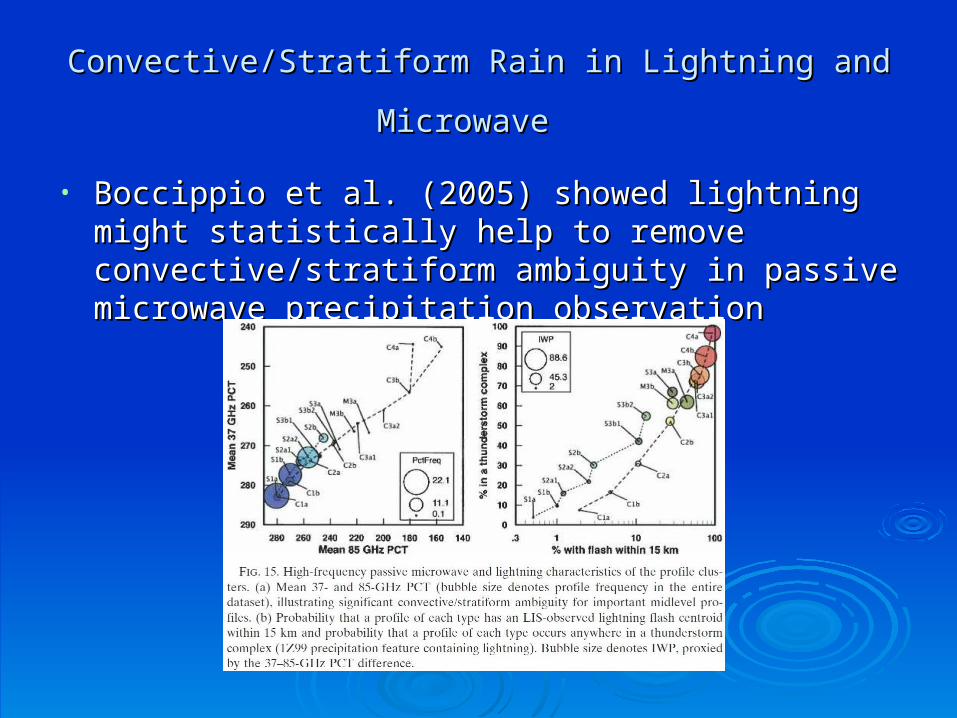
Convective/Stratiform Rain in Lightning and MicrowaveConvective/Stratiform Rain in Lightning and Microwave
• Boccippio et al. (2005) showed lightning might Boccippio et al. (2005) showed lightning might statistically help to remove convective/stratiform statistically help to remove convective/stratiform ambiguity in passive microwave precipitation observationambiguity in passive microwave precipitation observation

Proxy data : TRMM LIS/TMI/PR DatabaseProxy data : TRMM LIS/TMI/PR Database
• Seven years (2002-2008) of TRMM radar/radiometer/lightning data at 0.1° grid resolutionSeven years (2002-2008) of TRMM radar/radiometer/lightning data at 0.1° grid resolution• PR Convective fraction estimates PR Convective fraction estimates • TMI convective fraction estimate (using 19/37/85 GHz), brightness temperatures, rain-rates (using 85 TMI convective fraction estimate (using 19/37/85 GHz), brightness temperatures, rain-rates (using 85
GHz)GHz)• LIS radiance, event rate, group rate and flash rateLIS radiance, event rate, group rate and flash rate
• 15 million15 million raining pixels are used to investigate correlation between lightning frequency/occurrence and raining pixels are used to investigate correlation between lightning frequency/occurrence and convective/stratirom partition in the precipitation system observed by microwave convective/stratirom partition in the precipitation system observed by microwave

Result: Lightning and Microwave C/S Result: Lightning and Microwave C/S
PartitionPartition Convective AllStratiform
• Clearly the presence of lightning is prominent in convective rain
• 10% RMS error improvement in microwave convective rain identification when using lightning data
• Virtually no improvement from lightning in C/S in stratiform rain
• Overall (all rain) 5% error reduction in microwave C/S identification with lightning data

Summary Summary
• Preliminary analysis indicated that lightning data can Preliminary analysis indicated that lightning data can help microwave convective/stratiform partition, especially help microwave convective/stratiform partition, especially over convective rain regime (10% convective, 5% over convective rain regime (10% convective, 5% overall)overall)
• Next step is to investigate lightning data on microwave Next step is to investigate lightning data on microwave rain-rate estimates through the lightning/microwave rain-rate estimates through the lightning/microwave training of the C/S partition.training of the C/S partition.
• Work in progress of redoing the TRMM database at 85 Work in progress of redoing the TRMM database at 85 GHz resolution, and adding additional parameters for GHz resolution, and adding additional parameters for analysis such as PR rain-rate/storm height and LIS flash analysis such as PR rain-rate/storm height and LIS flash extent density.extent density.