1 Program of Projects Study The Impacts of Regional Transit Investment Forum March 21, 2013 Move LA...
24
1 Program of Projects Study The Impacts of Regional Transit Investment Forum March 21, 2013 Move LA - "LA's Got Lines"
-
Upload
piers-wade -
Category
Documents
-
view
213 -
download
0
Transcript of 1 Program of Projects Study The Impacts of Regional Transit Investment Forum March 21, 2013 Move LA...
1
Program of Projects Study
The Impacts of Regional Transit Investment ForumMarch 21, 2013
Move LA - "LA's Got Lines"

2
Regions Ranked by Size of Metro Economy
RANK CITY 2010 GROSS METRO PRODUCT
2 Los Angeles 737.95 Houston 378.96 Dallas 376.88 San Francisco 337.49 Boston 311.3
10 Atlanta 270.612 Seattle 231.413 Minneapolis/St. Paul 198.315 Phoenix 190.616 San Diego 172.217 Denver 157.118 San Jose 151.620 St. Louis 128.721 Portland 122.827 Cleveland 105.143 Salt Lake 66.5
Source: US Conference of Mayors and the Council for the New American City, U.S. Metro Economics: GMP and Employment Forecast, 2011

3
Transit Investment: Streetcars

4
Then came freeways…

5
Expansion to the Suburbs

6
The Plan: A Program of Projects
• Funded by Corridors of Opportunity initiative (March 2011)
• Comprehensive new approach to regional development
• Accelerate the build-out of the regional transit system
.

7
Shared Regional Vision

8
Shared Regional Vision
A regional transit system that will enhance our ability to
compete in the global economy, help attract and
retain jobs, connect to highways and roads, increase
mobility and protect our qualify of life.

9
The Study: A Program of Projects
Components: 6 core projects9 expansion projects (multiple
modes)
Total Cost: Capital: up to $5.7 BillionOperating Subsidy: $102
million/year
Funding Partners: Federal, State, CTIB and Local Government

10
Six Core + 9 Expansion Projects
• Hiawatha LRT• Northstar Commuter Rail• Cedar Avenue BRT (all phases)• Central Corridor LRT• Southwest LRT• I-35W South BRT (all phases)
Core Projects have approved alignments and modes (LPAs) and are in Preliminary Engineering , construction or operation.
Core Projects have approved alignments and modes (LPAs) and are in Preliminary Engineering , construction or operation.
11
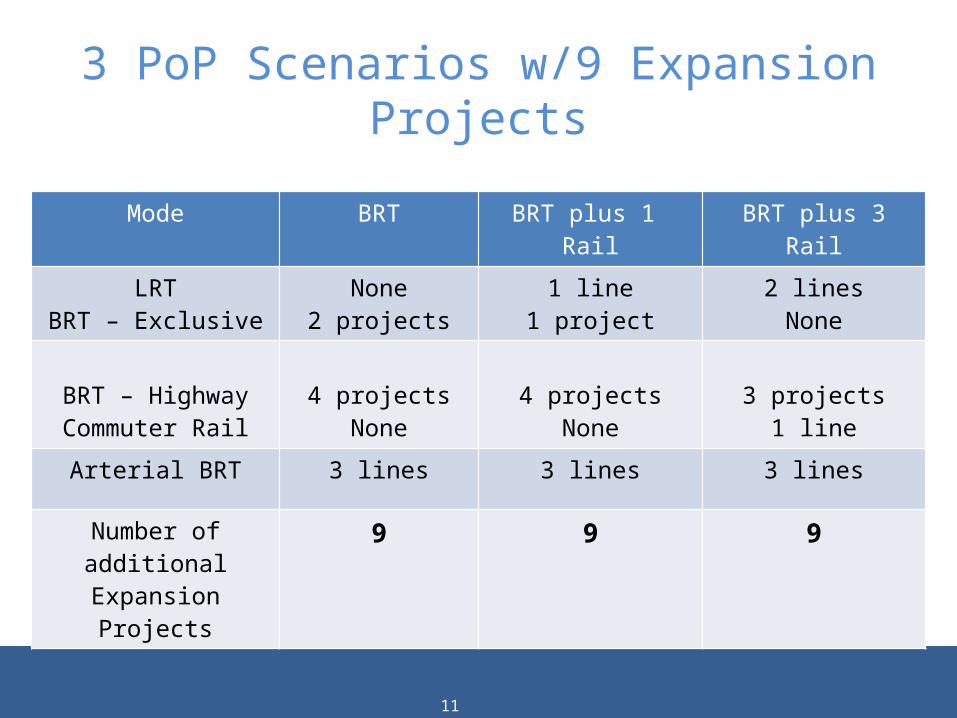
3 PoP Scenarios w/9 Expansion Projects
Mode BRT BRT plus 1 Rail BRT plus 3 Rail
LRTBRT – Exclusive
None2 projects
1 line1 project
2 linesNone
BRT – HighwayCommuter Rail
4 projectsNone
4 projectsNone
3 projects1 line
Arterial BRT 3 lines 3 lines 3 lines
Number of additional Expansion Projects
9 9 9

1212
BRT plus 3 PoP Scenario
Mode Core Projects
Expansion Projects Total
LRT 3 2 5
BRT – Highway 2 3 5
Commuter Rail 1 1 2
Arterial BRT 0 3 3
Total 6 9 15
Building Blocks

13
Financial Analysis: Program of Projects Study
1. Is it possible:– To complete our shared vision given current funding
practices and policy?– To build our vision more quickly given current
funding practices?Sneak peak at the answers: No
2. How have other cities accelerated their building?3. What might work in our region? What are our
options?
1414
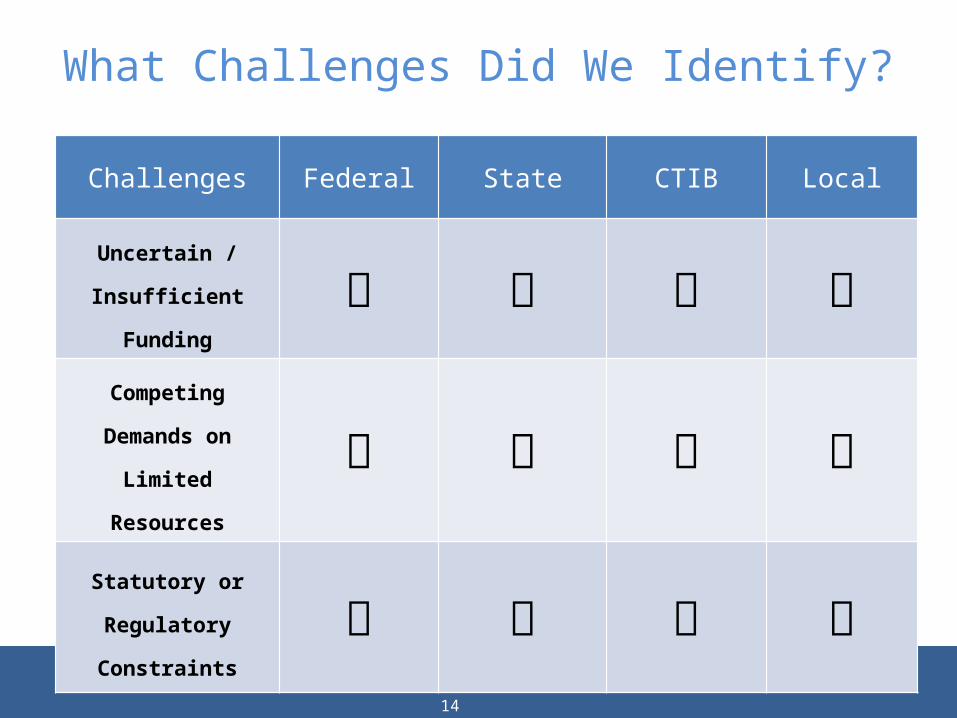
What Challenges Did We Identify?
Challenges Federal State CTIB Local
Uncertain / Insufficient Funding
Competing Demands on Limited Resources
Statutory or Regulatory Constraints

15
How have Peer Regions Addressed Funding Challenges?
• Capital funding sources?• Financing tools?• Project delivery methods?• Operations and maintenance funding?• Innovative approaches to fast tracking projects?

16
Peer Regions SummaryCity Program Total
Program Cost
Base Sales Tax
Sales TaxIncrease
Total Sales Tax
Modes Capital vs O&M
State Funding
Dallas DART Rail Expansion
$1.6 billion 1 cent No, bonding only
1 cent Transit only Both No
Denver FasTracks $6.8 billion 0.6 cent 0.4 cent 1 cent Transit only Both Yes
Houston METRO Solutions
$6 billion 1 cent No, bonding only
1 cent Transit only Both No
Los Angeles
LA 30/10 Initiative
$17.5 billion 0.0 cent 1.5 cent 1.5 cent Transit and roadway projects
Both Yes
Phoenix Future High Speed Transit Corridors
$3 billion 0.5 cent Tempe0.4 cent Phoenix
0.5 cent regional
1.0 & 0.9 cent respect-ively
Cities for transit only
Regional for transit and roadways
Cities BothRegional for rail capitalRegional for bus capital and O&M
No
Seattle ST2 $17.8 billion 0.4 cent 0.5 cent 0.9 cent Transit only Both No
Salt Lake FrontLines 2015
$2.3 billion 0.50 cent 0.25 cent 0.75 cent Transit only Both No

17
Peer Cities Findings
1. All cities defined and developed a specific program of projects.
2. All cities use sales taxes as the primary local funding source.3. All cities use sales taxes for transit and transitway capital
and operations. 4. All cities use FTA New Starts funding5. Several of the cities are implementing projects using all
non-federal funds.6. Most of the cities had to raise their sales tax rate to fund a
Program of Projects.7. Only two of the seven cities receive state funding.
18
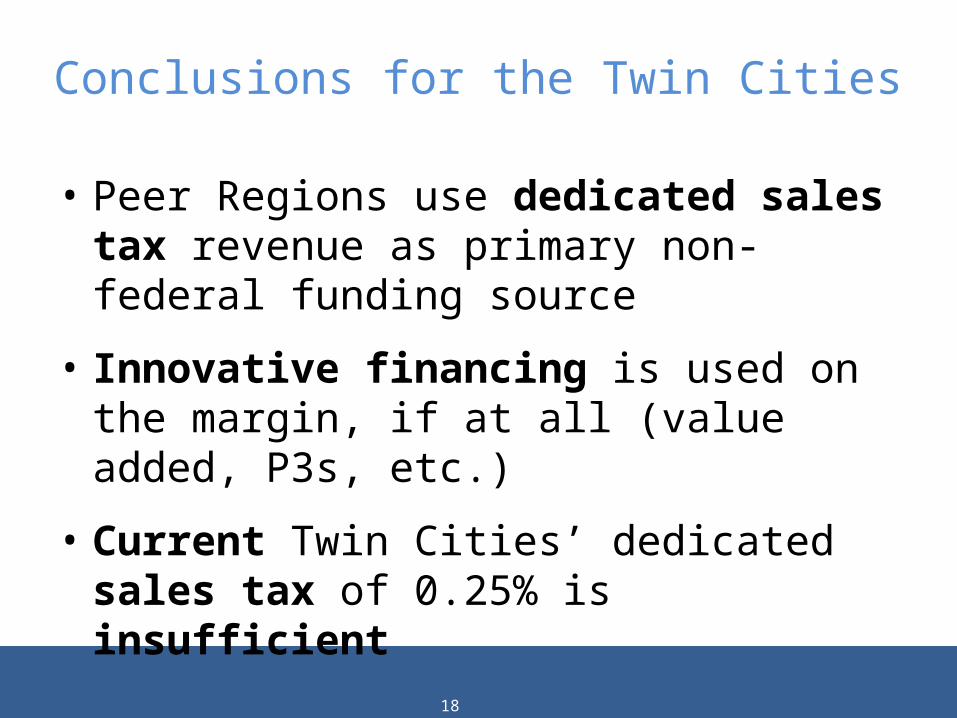
Conclusions for the Twin Cities
• Peer Regions use dedicated sales tax revenue as primary non-federal funding source
• Innovative financing is used on the margin, if at all (value added, P3s, etc.)
• Current Twin Cities’ dedicated sales tax of 0.25% is insufficient
19
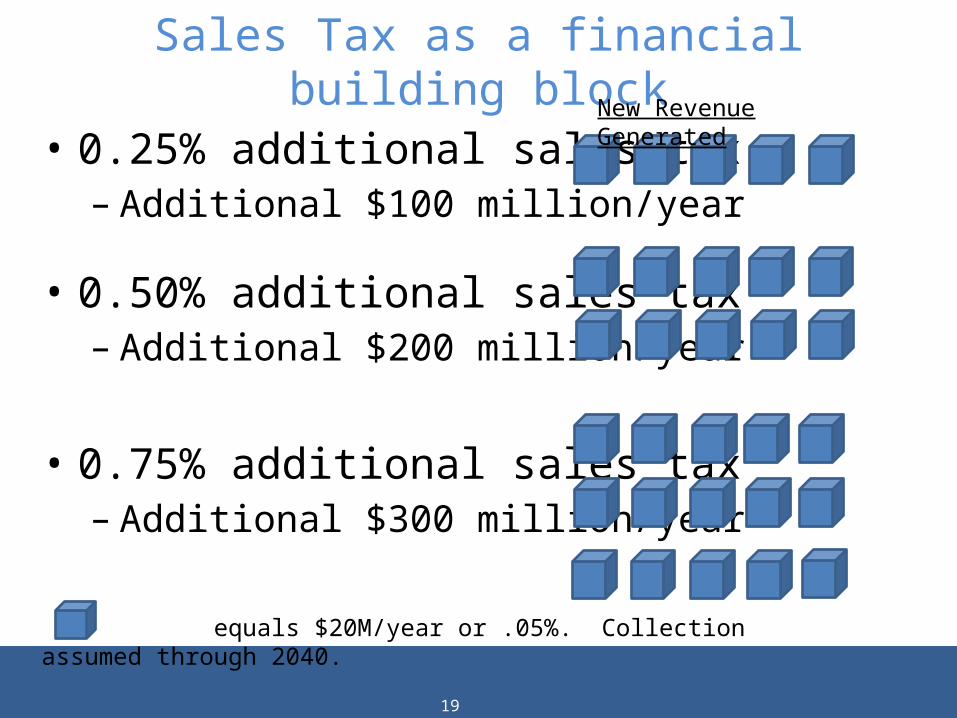
Sales Tax as a financial building block
• 0.25% additional sales tax– Additional $100 million/year
• 0.50% additional sales tax– Additional $200 million/year
• 0.75% additional sales tax– Additional $300 million/year
equals $20M/year or .05%. Collection assumed through 2040.
New Revenue Generated

20
PoP Building Blocks
37.5% Federal share - LRT .08%0% State share - PoP capital .14%0% State share - PoP operation .16% Unfunded CTIB share of PoP .10% 0% RRA share - PoP capital .10%Addn’l. tax needed 12 blocks .58%
$232,000,000/yrNOTE: Sales tax rates are estimates and have been rounded.
Sales tax rate

21
Other Building Blocks
State $70M bus op. approp. .18%State share of bus expansion Capital .03% Operations .11%State capital & op. share of 9 more arterial BRT (12) .16%
Addn’l. tax needed 9+ blocks 0.48%.
$198,000,000/yrNOTE: Sales tax rates are estimates and have been rounded.
Sales tax rate

22
Prioritize
• System Expansion/ System Stabilization• Elements– State share – capital, new and existing– State share – operating– RRA share – capital– Commuter rail – No– Bus expansion: regular route & arterial BRT– Federal share
• Use of Financing

23
Next Steps: Program of Projects • Support Governor’s ½-cent increase in transit
tax for expansion of transit and stabilization of operations
• Continue work with FTA:– MAP-21 includes POP provisions– Policy guidance expected to be issued this summer
• Develop scenarios for the POP build out• Back to #1: Get the money!!!!!

24
Thank You
Commissioner Peter McLaughlin, ChairCounties Transit Improvement Board
www.mnrides.org