1. POTENTIAL FAILURE MODE ANALYSIS STUDY … 01, 2003 · 1. Conduct a Potential Failure Modes...
43
Oroville Dam Page i 2009 Update PFMA Report 1. P OTENTIAL F AILURE M ODE A NALYSIS S TUDY R EPORT
Transcript of 1. POTENTIAL FAILURE MODE ANALYSIS STUDY … 01, 2003 · 1. Conduct a Potential Failure Modes...

Oroville Dam Page i 2009 Update PFMA Report
1. POTENTIAL FAILURE MODE ANALYSIS STUDY REPORT

Oroville Dam Page 1-1 2009 Update PFMA Report
1. INTRODUCTION AND BACKGROUND
Beginning in 2003, the Federal Energy Regulatory Commission (FERC) implemented a new
Dam Safety Performance Monitoring Program (DSPMP). The DSPMP requirements are
included in Chapter 14 of FERC‟s Engineering Guidelines dated April 11, 2003. The new
program consists of three parts:
1. Conduct a Potential Failure Modes Analysis (PFMA) and prepare a PFMA report.
The PFMA is intended to broaden the scope of traditional dam safety
evaluations. A Core Team consisting of the FERC inspector, Independent
Consultants, Owner‟s representatives, and PFMA Facilitator participate in a
workshop to identify potential failure modes under hydrologic, seismic, normal,
and operating conditions.
2. Prepare a Supporting Technical Information Document (STID) that includes the
PFMA report. The STID is a summary of background information and analyses
that do not change significantly between Part 12D safety inspection reports.
3. Prepare the Part 12D Safety Inspection report. The Part 12D inspection and
report will focus on the identified Potential Failure Modes (PFMs) and the
information and findings presented in the PFMA report and will include an
evaluation of the current performance monitoring and surveillance program as it
relates to the identified potential failure modes.
2004 PFMA Workshop: The original PFMA workshop for Oroville Dam was performed on
September 15, 2004 according to the process outlined in FERC Engineering Guidelines
Chapter 14 dated April 11, 2003. The workshop was conducted jointly by DWR, the
Independent Consultants, and FERC with guidance from the Independent Facilitator. A list
of the participants is presented in Table 1A below.
Prior to the workshop, the Independent Consultants and DWR representatives gathered
background documentation including previous safety inspection reports, stability analyses,
hydrologic analyses, geologic and seismic information, construction history, and surveillance
data for Oroville Dam. The Independent Consultants reviewed the information and prepared
data summary sheets and the draft STID. Lists of the documents (reports and drawings)
reviewed for the workshop are presented in Appendices A and B.
The core team met at the Oroville Field Division office at 7:30 am on Monday, September
13, 2004 and visited the dam to become familiar with the site conditions and relative location
and relationship of the project components (See photos in Appendix C) and their general
condition. On Tuesday, September 14, 2004, the core team met at the Joint Operations
Center in Sacramento and read the available documentation for Oroville Dam. On
Wednesday, September 15, 2004, the core team, other persons familiar with the project,
and invited observers identified Potential Failure Modes (PFMs) for the dam. If the candidate
mode was considered a credible potential failure mode it was carried forward and the team
discussed factors that made it more or less likely to occur. Each PFM was then rated by
category (see Table 2). If, after discussion the candidate mode was judged to be not a
Oroville Dam Page 1-2 2009 Update PFMA Report
realistic, viable potential failure mode, it would be noted as an “other consideration” and the
reasons why it was not a viable potential failure mode would be noted. Finally, the major
findings and understandings were developed by the Core Team.
2009 PFMA Update: As noted in FERC letter to DWR dated July 21, 2009, the PFMA report
is regarded as a living document and the report should be updated as conditions at the site
change and as new information is obtained. Since a comprehensive PFMA workshop was
conducted in 2004 for Oroville Dam, a formal PFMA was not required by FERC for the 2009
Part 12D review. As part of the preparation for the Part 12D inspections, DWR personnel
and the Part 12D ICs reviewed the 2004 PFMAs, STIDs and other project documents
relating to the operation and dam safety of the dams since the last Part 12D inspections.
Following the data review, an informal one-day workshop was conducted on September 17,
2009, to review, update and reclassify, as necessary, the PFMs developed at the 2004
PFMA workshop. The workshop also included review of the Major Findings and
Understandings (Section 1.2), Potential Risk Reduction Actions Identified (Section 1.5) and
Other Considerations (Section 1.6) from the PFMA report. These sections were discussed
and updates were suggested based on new or changed information since the PFMA report
was originally issued in 2004. The workshop was conducted jointly by DWR and the 2009
FERC Independent Consultants (also referred to as the DWR Board of Consultants). A list of
the participants is presented in Table 1B below.
Based on the results of the 2009 PFMA Update Workshop, this revision to the original 2004
PFMA report has been prepared and replaces the original 2004 PFMA report. Minor edits
are indicated by strikeout (deletions) and bold text (insertions). More substantial edits and
discussion from the 2009 PFMA workshop are indicated as “2009 PFMA Updates”. The
original 2004 report and the 2009 update together document the progression and variety of
analyses and professional opinions that went into the current updated/appended PFMA
report findings. The “updated” PFMA will be the foundation for the next Part 12D
Independent Consultant Safety inspection report scheduled for 2014.
Oroville Dam Page 1-3 2009 Update PFMA Report
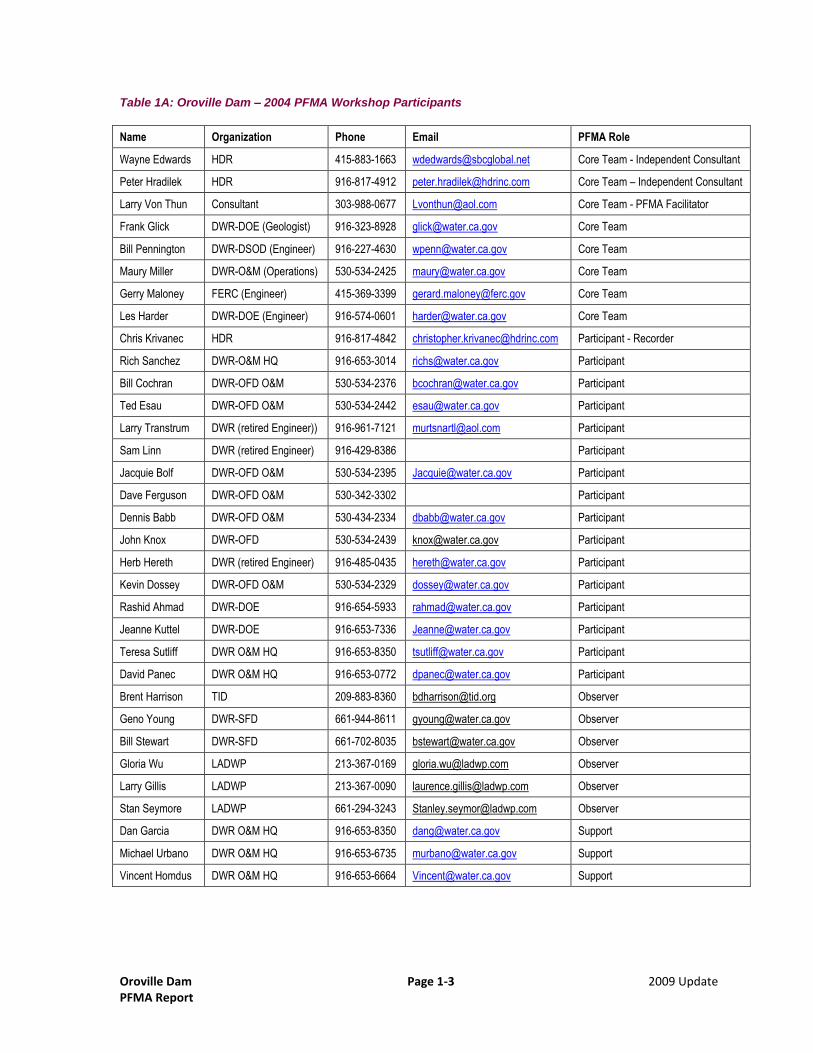
Table 1A: Oroville Dam – 2004 PFMA Workshop Participants
Name Organization Phone Email PFMA Role
Wayne Edwards HDR 415-883-1663 [email protected] Core Team - Independent Consultant
Peter Hradilek HDR 916-817-4912 [email protected] Core Team – Independent Consultant
Larry Von Thun Consultant 303-988-0677 [email protected] Core Team - PFMA Facilitator
Frank Glick DWR-DOE (Geologist) 916-323-8928 [email protected] Core Team
Bill Pennington DWR-DSOD (Engineer) 916-227-4630 [email protected] Core Team
Maury Miller DWR-O&M (Operations) 530-534-2425 [email protected] Core Team
Gerry Maloney FERC (Engineer) 415-369-3399 [email protected] Core Team
Les Harder DWR-DOE (Engineer) 916-574-0601 [email protected] Core Team
Chris Krivanec HDR 916-817-4842 [email protected] Participant - Recorder
Rich Sanchez DWR-O&M HQ 916-653-3014 [email protected] Participant
Bill Cochran DWR-OFD O&M 530-534-2376 [email protected] Participant
Ted Esau DWR-OFD O&M 530-534-2442 [email protected] Participant
Larry Transtrum DWR (retired Engineer)) 916-961-7121 [email protected] Participant
Sam Linn DWR (retired Engineer) 916-429-8386 Participant
Jacquie Bolf DWR-OFD O&M 530-534-2395 [email protected] Participant
Dave Ferguson DWR-OFD O&M 530-342-3302 Participant
Dennis Babb DWR-OFD O&M 530-434-2334 [email protected] Participant
John Knox DWR-OFD 530-534-2439 [email protected] Participant
Herb Hereth DWR (retired Engineer) 916-485-0435 [email protected] Participant
Kevin Dossey DWR-OFD O&M 530-534-2329 [email protected] Participant
Rashid Ahmad DWR-DOE 916-654-5933 [email protected] Participant
Jeanne Kuttel DWR-DOE 916-653-7336 [email protected] Participant
Teresa Sutliff DWR O&M HQ 916-653-8350 [email protected] Participant
David Panec DWR O&M HQ 916-653-0772 [email protected] Participant
Brent Harrison TID 209-883-8360 [email protected] Observer
Geno Young DWR-SFD 661-944-8611 [email protected] Observer
Bill Stewart DWR-SFD 661-702-8035 [email protected] Observer
Gloria Wu LADWP 213-367-0169 [email protected] Observer
Larry Gillis LADWP 213-367-0090 [email protected] Observer
Stan Seymore LADWP 661-294-3243 [email protected] Observer
Dan Garcia DWR O&M HQ 916-653-8350 [email protected] Support
Michael Urbano DWR O&M HQ 916-653-6735 [email protected] Support
Vincent Homdus DWR O&M HQ 916-653-6664 [email protected] Support

Oroville Dam Page 1-4 2009 Update PFMA Report
Table 1B: Oroville Dam – 2009 PFMA Update Workshop Participants
NAME COMPANY/ORGANIZATION PFMA ROLE/SPECIALTY
Steve Verigin GEI Consultants, Inc. Co-Independent Consultant/Board of Consultants
Bill Rettberg GEI Consultants, Inc. Co-Independent Consultant/Board of Consultants
Bill Cole Geoinsite, Inc. Board of Consultants/Geology
David Panec DWR O&M HQ Facilitator/Participant
Paul Dunlap DWR- O&M HQ Participant
Donald Walker DWR- O&M HQ Participant
Kevan Samsam DWR- O&M HQ Participant
Dave Samson DWR- O&M HQ Participant
Brent Lamkin DWR-DOE Participant/Geology
Joseph Royer DWR-DOE Participant
Frank Glick DWR-DOE Participant/Geology
Maury Miller, DWR-OFD Participant
Bill Cochran DWR-OFD Participant
Alex Samaan DWR-OFD Participant
Y Nhi Ensler California DSOD Participant
Bill Pennington California DSOD Participant
Leon Holden FERC Participant
Carol Buckles Terra Mater, Inc. (under subcontract to GEI).
Participant/Recorder
1.1 DESCRIPTION OF PROJECT
1.1.1 General Project Description
Oroville Dam is part of the Oroville-Thermalito Complex, which also includes Hyatt
Powerplant, Thermalito Diversion Dam and Powerplant, Fish Barrier Dam, the Feather River
Hatchery, Thermalito Power Canal, Thermalito Forebay Dam, Thermalito Afterbay Dam, and
the Thermalito Pumping-Generating Plant. In all, the Oroville-Thermalito Complex stores
approximately 3.6 million acre-feet of water and can generate 841 MWs of power from
releases through three powerplants.
Beginning at the upstream end of the Oroville-Thermalito Complex, water released from
Lake Oroville is used to produce electricity at the Hyatt Powerplant, or may be directly
released into the Diversion Dam Forebay. At the Thermalito Diversion Dam the water from
Lake Oroville then either is used to produce electricity at the Thermalito Diversion Dam
Powerplant, enters the Feather River directly, or is diverted into the Thermalito Power Canal
which leads to the Thermalito Forebay. At the end of the Forebay, water either discharges
directly into the Thermalito Afterbay or is used to generate power at the Thermalito
Pumping-Generating Plant before entering the Afterbay. See Figure 2-1 (figures located in
STID Section 2.0).

Oroville Dam Page 1-5 2009 Update PFMA Report
The Oroville portion of the complex consists of Oroville Dam, Edward Hyatt Powerplant,
Hyatt Powerplant Intake, Bidwell Canyon Saddle Dam, Parish Camp Saddle Dam, Flood
Control and Emergency Spillways, the River outlet, and the Palermo outlet.
Pertinent Data Location 5 mi. NE of Oroville, CA
Stream/River Feather River
Project Features/Function Water storage for Edward Hyatt Powerplant, Oroville-Thermalito Power Complex
Drainage Basin 3,607 sq. mi.
Reservoir Capacity 3,537,577 acre-feet
Reservoir Area 15,800 acres
Dam Type Zoned Earth and Rockfill dam; two small embankment dams (Bidwell Canyon Saddle Dam and Parish Camp Saddle Dam)
Hazard Classification High
Date of Construction/Significant Modifications Construction, 1968; Radial gates retrofitted, 2002
Height Oroville - 770 ft; Bidwell Canyon – 47 ft; Parish Camp – 27 ft
Dam Crest Length Oroville - 5,420 ft; Bidwell Canyon – 2,270 ft; Parish Camp – 260 ft
Dam Crest Width Oroville – 50.6 ft; Bidwell Canyon – 30 ft; Parish Camp – 27 ft
Dam Crest Elev. Oroville - 922 ft. +/- camber; Bidwell Canyon & Parish Camp – 922 ft.
Normal Maximum Reservoir Elev. 900 ft.
Spillway Type Gated flood control outlet structure, Emergency overpour weir (two components: 800-foot broad-crested weir, 930-foot gravity ogee weir)
Spillway Crest Elev. 901 ft.
Spillway Length Gated Flood Control Outlet Structure – 140.7 ft, Overpour emergency spillway – 1,730 ft.
Top of Gates/Flashboards 847 ft.
PMF/IDF Summary PMF (2003 study) based on HMR 59 – inflow 725,000 cfs/outflow 671,000 cfs starting at Elev. 901 ft; PMF (1983 study) based on HMR 36 – inflow 1,167,000 cfs/outflow 798,000 includes failure of Butt Valley Dam upstream; PMF (1980 study) based on HMR 36 – inflow 960,000 cfs/outflow not recorded; PMF (1968 study) based on HMR 36 – inflow 718,000 cfs/outflow 624,000 cfs
Maximum PMF Water Surface Elev. 917.5 ft (2003 study)
Minimum PMF Freeboard 4.5 ft. to nominal crest elevation (922 ft) based on 2003 PMF study; no Thunderstorm PMF determined for Oroville
Controlling Fault and Peak Ground Acceleration Cleveland Hill – M 6.5 at 3 mi; 0.6g at the base of the dam. (See STID, Section 5.)
1.1.2 Dam
Oroville Dam is a zoned earth and rockfill embankment dam rising 770 feet above streambed
excavation with a crest length (including the spillway) of 6,920 feet. The dam axis is slightly
curved into the reservoir. The embankment is approximately 5,420 feet in length and is
comprised of 80,000,000 cubic yards of material. Specifically, the embankment is made up of
an inclined impervious clay core set on a concrete core block, with appropriate transitions and
rock-filled shell zones on both sides; see Figure 2-15. The zone descriptions are given
below:
Zones 1, 1A, 1B – Impervious core from the deposit adjacent to the pervious
borrow areas consisting of a well-graded mixture of clays, silts, sands, gravels,
and cobbles to 3-inch maximum size.

Oroville Dam Page 1-6 2009 Update PFMA Report
Zones 2, 2A – Transition zones consisting of a well-graded mixture of silts, sands,
gravels, cobbles, and boulders to 15-inch maximum size; 6% limit on minus No.
200 sieve material.
Zone 3 – Shell zone of predominately sands, gravels, cobbles, and boulders to
24-inch maximum; 25% limit on minus No. 4 sieve material.
Zone 4 – Impervious core from selected abutment stripping containing from 15%
to 45% material passing No. 200 sieve, with an 8-inch maximum size.
Zone 4A – Buffer zone designed to compress; with same grading as Zone 4 (but
less stringent compaction requirements).
Zones 5A, 5B – Drainage zones consisting of gravels, cobbles, and boulders with
a maximum of 12% minus No. 4 sieve size permitted.
Bidwell Canyon Saddle Dam and Parish Camp Saddle Dam are two small embankment
dams that aid Oroville Dam in containing the 3,537,577-acre-foot Lake Oroville. They have
maximum heights of 47 and 27 feet, respectively. Bidwell Canyon Saddle Dam consists of a
zoned main embankment and a homogenous west embankment; see Figure 2-32. The
main embankment encompasses the former Miners‟ Ranch Dike built by the Oroville-
Wyandotte Irrigation District. Parish Camp Saddle Dam consists of one homogeneous
embankment; see Figure 2-33.
1.1.3 Spillway
The spillway is located on the right abutment of the dam and has two components: a 140.7-
foot long gated flood control outlet structure, and a 1,730-foot uncontrolled emergency
overpour spillway with its crest set one foot above normal maximum storage level (Elev. 900
feet). The flood control outlet consists of an unlined approach channel, a gated headwork,
and a lined chute extending to just above the river channel. The ungated, concrete
emergency spillway is an overpour weir located to the right of the flood control outlet; it is
made up of an 800-foot broad-crested weir on a bench excavation on the right, and a 930-
foot gravity ogee weir on the left that reaches a maximum height of 50 feet. Emergency spill
flows to the river over natural terrain.
1.1.4 Intakes
The intake for the Edward Hyatt Powerplant is a sloping concrete structure upstream of the
dam on the left abutment. The structure is comprised of two parallel intake channels, one for
each of the 22-foot-diameter penstocks.
1.1.5 Conveyance Systems
The intake for the powerplant is a sloped concrete structure on the left abutment consisting
of two parallel channels, one for each of the 22-foot diameter penstock tunnels. The intakes
are protected by trashracks, covering a shutter system with settings determined by water
temperature needs for agriculture and fishery purposes. Hydraulically activated roller gates
located at the entrance to the penstocks can close the opening in case of emergency.

Oroville Dam Page 1-7 2009 Update PFMA Report
Discharges from the powerplant are conveyed to the Feather River
. . The facility has a
maximum release capability of 5,000 cfs, and was used to make downstream releases until
the reservoir reached the penstock intake level. It is being preserved to serve the same
function in the event there is ever a prolonged total outage of Hyatt Powerplant.
1.1.6 Powerhouse
The majority of the water released from Lake Oroville passes through the underground
Edward Hyatt Powerplant, located in the left abutment of Oroville Dam. The plant is capable
of 678.75-Megawatts of output due to three conventional generators rated at 123.2 MVA
each, driven by Francis-type turbines, and three motor-generators rated at 115 MVA each,
coupled to Francis-type reversible pump-turbines.
1.1.7 Outlets
The reservoir has three outlets, the Hyatt powerplant intake (16,900 cfs generating, 5,610
cfs pumping maximum capacity), the river outlet (5,000 cfs maximum capacity), and the
Palermo outlet tunnel (40 cfs).
1.1.8 Vicinity Map and Project Drawings
A vicinity map is presented in Figures 2-1 and 2-2. Pertinent project drawings are
reproduced in Figures 2-3 through 2-36.
1.1.9 Standard Operating Procedures
The reservoir has three outlets, the Hyatt powerplant intake (16,900 cfs generating, 5,610
cfs pumping maximum capacity), the river outlet (5,000 cfs maximum capacity), and the
Palermo outlet tunnel (40 cfs).
A list of operating criteria for regulating Lake Oroville has been established by the
Department of Water Resources (DWR, The August 1st, 1975 Oroville Earthquake
Investigations, February, 1976), which is shown as Figure 4-1 in Section 4 of the STID.
Reservoir pool elevation fluctuates due to runoff, power production, flood control, and
recreational demands. Historically, the reservoir level has varied 255 feet between El. 645
feet to El. 900 feet. Over the past four years, the reservoir has varied on average 121 feet
during the year, from El. 731 feet to El. 852 feet.
The flood control outlet spillway has eight radial gates that have a top elevation of 847 feet.
The gates are normally closed, but are opened as necessary to pass flood flows. The
spillway gates are operated by gate hoists powered by electric motors. Primary power is
from the Hyatt Powerplant station service power system. The emergency generators for the
hoists are tested on a monthly basis. Once a year they are load test by opening the gate
approximately one foot. The emergency spillway, an ungated ogee weir, is located to the
right of the flood control outlet spillway.
Oroville Dam Page 1-8 2009 Update PFMA Report
1.2 MAJOR FINDINGS AND UNDERSTANDINGS
1. Original 2004 MFU: The most recent (2003 study) estimated PMF inflow, based
on HMR 58/59 is only slightly higher than the maximum project flood used for
design of Oroville Dam. The original maximum project flood based on a 72 hour
storm was specified in 1968 and had a peak inflow of 718,000 cfs and a peak
discharge of 624,000 cfs. Subsequently in 1983 a Probable Maximum Flood
(PMF) was developed for the site which had a peak of inflow of 1,167,000 cfs
and a peak discharge of 798,000 cfs. This study (because of the size of the
flood) included the assumed failure of the upstream Butt Valley Dam. The most
recent PMF, based on HMR 58/59, was developed in 2003 and has a peak inflow
of 725,000 cfs and a peak discharge of 671,000 cfs (assuming an initial reservoir
elevation of 901 ft). It is important to note that although the Oroville Dam can
pass the PMF, the downstream channel capacity is considerably less than the
PMF and the discharge capacity of the Thermalito Diversion Dam below Oroville
Dam is considerable less that the PMF peak discharge.
2009 Update: The channel below the emergency spillway is heavily vegetated with
brush and trees. The participants of the 2009 PFMA Update workshop discussed
that if emergency spillway were to operate, the vegetation below the channel would
likely be uprooted and may accumulate at the Thermalito Diversion Dam. Vegetation
could also accumulate on the piers of the railroad bridge upstream of Thermalito
Diversion Dam. This was not necessarily considered a dam safety issue requiring
risk-reduction measures, but it emphasizes the importance of proper operation of the
spillway gates and releases, both at Oroville Dam and Thermalito Diversion Dam, to
avoid problems at even lesser flows.
2. New PMF routing studies show that with all gates open and the initial reservoir
pool at the emergency spillway crest elevation (El. 901 feet), the PMF still passes
with 4-5 feet of freeboard to the nominal dam crest (El. 922 feet).
3. Major floods up to PMF can be passed through Oroville spillway successfully
without significant concern relative to debris blockage, power supply, some gate
malfunctions or delays in releases due to City, State or Federal control of
operations because of downstream impact concerns. These delays are related to
the possibility that the inflow could be “held back” to avoid downstream damages
rather than routed fully in accordance with the spillway‟s capability and thus could
ultimately create a higher reservoir elevation. However, review of the routings
along with recognition that the emergency spillway will kick in once the reservoir
elevation exceeds 901 obviated that concern. Thus, it appeared clear to the
PFMA team that even if some discharge delay may occur, such delay would not
threaten overtopping of the main dam under the current understanding of the
nature of major floods up to the PMF.
4. The latest survey shows that the Oroville Dam crest ranges from El. 924.8 feet
(at the groins) to 927.9 feet (in the central portion), thus providing additional
freeboard. Considerable camber was provided in anticipation of settlement of the

Oroville Dam Page 1-9 2009 Update PFMA Report
dam. Actual settlement has been far less than anticipated leaving the dam higher
than the nominal design crest elevation of 922 feet.
5.
6.
2009 Update: Inundation studies have been performed for Oroville, Parish Camp
and Bidwell Canyon and Parish Camp, and based on the results Bidwell Canyon and
Parish Camp are now also considered to be high hazard dams.
7. The flood control outlet gates are reliable with multiple sources of power.
8. There is substantial spillway capacity through the emergency spillway even if all
gates are closed. The spillway rating curve shows that the emergency spillway
has a capacity of 445,000 cfs at Elev. 920 feet. With zero freeboard to the
nominal crest of the dam (Elev. 922 feet) it is estimated that the emergency
spillway can pass 520,000 cfs.
9. Original 2004 MFU: Flood control rules would be superseded under PMF
conditions and operation would be in “save the dam” mode.
10. Original 2004 MFU: It was recognized that City, State, or Federal concerns
could affect flood operations and spillway rating assumptions. Any delay due to
City, State or Federal concerns becomes moot after reservoir reaches
approximately El. 901 feet since the emergency overflow spillway takes over.
2009 Update: The 2009 workshop participants edited the MFU to “It was recognized
that City, State, or Federal concerns could affect flood operations and spillway

Oroville Dam Page 1-10 2009 Update PFMA Report
release assumptions. Any delay due to City, State or Federal concerns becomes
moot after reservoir reaches approximately El. 901 feet since the emergency
overflow spillway begins to spill.”
11. Some spill control is available above El. 901 feet because the flood control gates
can be shut to send the comparable flow over the emergency spillway and to
maintain control for later increase in spill at the gated spillway.
12. Original 2004 MFU: A shear zone in the foundation of the west dam of Bidwell
Canyon Saddle Dam may be an extension of the Cleveland Hill fault which was
responsible for the 1975 Oroville Earthquake. An evaluation of this situation had
been made by the State of California (Bulletin 203-88) and was reviewed
carefully by the PFMA team. Although this is a significant geologic feature, it was
found that displacement on the shear zone should not cause a dam safety
problem because the shear zone cuts obliquely across the dam and daylights
above the maximum normal reservoir level El. 900 feet creating a long seepage
path with a low enough gradient that even if an offset should occur, seepage
erosion of the dam materials would be practically nil.
2009 Update: The participants of the 2009 PFMA Update workshop indicated that
their current review of information confirms the assessment made in 2004.
13. The 2003 stability analysis of Oroville Dam illustrated that the dam was stable
and met all accepted minimum factor of safety requirements. Further, these
analyses used original design strength estimates which subsequent evaluations
have shown to be conservative. It is expected, based on Les Harder‟s
understanding, that factors of safety would increase about 40% in reanalysis.
14.

Oroville Dam Page 1-11 2009 Update PFMA Report
15. Total seepage from Oroville Dam (under-seepage in the rock as well as seepage
through the dam itself) is extremely low for this size of dam. Typical seepage is of
the order of 25 to 30 gpm.
16. Steady-state seepage may not have yet developed in the dam due to the very
impervious core and reservoir fluctuation.
17. The discussions during the PFMA led to a clear understanding by the participants
of the instrumentation in the dam, past problems with that instrumentation, and
current procedures for monitoring the conditions and effects of the failed
instrumentation. Many of the instruments have failed, especially piezometers,
due to broken tubing bundles. Adequate data related to leakage and phreatic
surface are still being collected. Much of the instrumentation was installed for
construction monitoring and is not providing useful information.
18. Only one Potential Failure Mode (PFM) was identified for Oroville Dam.
. After
discussion of this mode as a candidate potential failure mode it was recognized
by the PFMA team that this potential failure mode was probably not credible but it
was carried forward as a PFM because of the long history of discussion
investigation and evaluation and the desire
to fully document the issue using the likely and not likely factors. Further, it was
agreed that of the several candidate potential failure modes that were postulated
relative to this PFM was, at the time,
considered most plausible. During the discussion, of the likely and not likely
factors for this potential failure mode, it
would likely preclude development of a
sustainable potential failure mode scenario. Subsequently this inference was
reinforced
The PFM which was rated a
Category II/IV at the session is now, based on this additional information
considered to be a Category IV because
is not considered credible.

Oroville Dam Page 1-12 2009 Update PFMA Report
19.
20. DWR is currently redoing the deformation analyses using the higher strengths
determined by U.C. Berkeley using large-scale tests. Expected results are
seismic deformations of about 1 foot if updated strength properties are used.
21. The seismicity studies and re-evaluations made following the 1975 Oroville
Earthquake appear to still be valid today and indicate the structures will withstand
the predicted seismic loads.
22. Although it was already well known that the foundation rock for these structures
is strong, it was surprising to see the hundreds of shears shown on the detailed
foundation geology maps (see Fig 2-34). As reported in the final design report,
the structures were sited to avoid the shear zones.
23. Hyatt Power Plant could flood if the tail pond established by the Diversion Dam
(and the Feather River) backs up / rises due to large spillway releases
themselves, blockages at the diversion dam from the raised spillway gates and
debris against the gate operators and guard rail and/or blockages in the pond
due to debris from those releases. Preliminary estimates of tail pond elevations
under successful operation of the Diversion Dam indicate that the power plant
would not flood,
.
24. Original 2004 MFU: A large amount of soil, rock and trees will be washed into
the Feather River if the emergency spillway is utilized. It is unknown if this debris
will make it to Thermalito Diversion Dam and causes any adverse effects on flow
passage or tail water. From observations it appears that significant adverse
effects are unlikely.
2009 Update: An evaluation of the erosion potential at Oroville Dam during spills and
the effect of deposition of eroded material in the channel at Thermalito Diversion
Dam reservoir has been performed and findings are summarized in a memorandum
dated April 21, 2009 (from J. Royer, DOE to D. Panec, O&M). Based on the amount
of sediment deposition calculated for the Diversion Dam reservoir, the study
recommends that a stability analysis of the additional lateral earth pressures on the
Diversion Dam be performed. The erosion study did not account for vegetation that
might be eroded and transported downstream
25. The main dam portion of Bidwell Canyon Saddle Dam was built on top of and tied
into a pre-existing dam. The pre-existing dam had been constructed just a few
years earlier with the anticipation of being raised.
26. Parish Camp Saddle Dam is almost entirely above elevation 900 and therefore
will almost never store water.
Oroville Dam Page 1-13 2009 Update PFMA Report
27. At Parish Camp Saddle Dam, the contact between two geologic units in the
foundation may be a fault contact but future offset would not be a problem
because the contact is above elevation 900 feet.
28. DSOD considered median earthquake ground motion parameters appropriate to
use for Oroville Dam in combination with a conservatively estimated MCE. The
re-analysis of the dam also considered an MCE (slightly less conservative) along
with mean plus 1 standard deviation ground motion parameters.
29. Original 2004 MFU: No effective low level dewatering capacity exists at Oroville
Dam. At reservoir elevations below 605 feet (elevation of bottom of power plant
intake structure) normal inflows exceed outflow capacity.
2009 Update: The 2009 workshop participants edited the MFU to “No effective low
level release capacity exists at Oroville Dam. At reservoir elevations below 605 feet
(elevation of bottom of power plant intake structure) normal inflows exceed outflow
capacity.”
30.
.
31.
.
32. Hydraulic fracturing of the core as a
result of arching from the differential stress condition between the shell and the
core) was not carried forward as a PFM since the core is filtered by the shell
material. This filtering requirement was an appropriate design consideration
because of the potential for arching and it fortunately covers the situation
locally allowing reservoir pressure into the core.
33. No viable PFM related to the bundled instrument cables was identified. The
cables are separated in trays as they pass horizontally through the upstream
shell and the core and are bundled as they pass through vertical openings in the
core (see Figure 2-17).
.
. Currently, at
the point water can be observed
but there is no free water
running along the outside . (Note that a likely scenario is that the
water is simply being absorbed by the embankment soil such that
there is no “free water” seepage to travel except by a wetting front. The visual
evidence cited above supports this scenario.) The PFMA team was not able to
develop a potential failure scenario for this situation

Oroville Dam Page 1-14 2009 Update PFMA Report
tubing along the tubing trenches and vertical passages within the core) because
any free water that escaping
would be resisted by a significant thickness of a
very impervious core material with a filter downstream of it. Leakage
was therefore not considered a major concern leading
to an identified potential failure mode.
34. Seepage occurred through the downstream weir prior to filling at levels similar to
present readings. The downstream weir elevation is 242 which is up to 76 feet
higher than the lowest elevation of the bedrock beneath the dam. Records
reportedly show that prior to filling, groundwater seepage and rainfall passing
through the downstream face reached and spilled over this weir which exits at
the outlet of an “underground dam built to capture and measure the seepage” at
levels similar to seepage levels that have occur subsequent to filling.
35. The downstream pervious zone and seepage barrier dam result in and
underground “lake”.
36.
37. Reverse seepage at the main dam at Bidwell Canyon Saddle Dam is probably
not an issue. The main dam embankment has a reservoir (Miners Ranch) at its
downstream toe. Some minor seepage (roughly 5 gpm) probably originating in
that reservoir has been observed at the upstream toe.
38. All significant landslides are mapped and monitored. Largest is Bloomer Hill
which has been investigated and found to be stable. Okay to dismiss since it is
highly unlikely that a pre-formed slide could move fast enough to generate a
significant wave; furthermore Oroville Dam has 22 feet of freeboard at normal
maximum reservoir level.
39. The “green spot” located on the downstream slope existed prior to reservoir
impoundment. This fact is documented in photos and the reason for its existence
was the dumping and non-removal of fines in the shell which was known (and
witnessed by Larry Transtrum).
40.

Oroville Dam Page 1-15 2009 Update PFMA Report
1.3 POTENTIAL FAILURE MODES IDENTIFIED
2004 PFMA Workshop: During the 2004 workshop, the participants brainstormed candidate
potential failure modes associated with hydrologic, seismic, static, and operating conditions.
For each credible identified PFM, the group discussed factors and conditions that made the
failure scenario more or less likely to occur. Possible risk reduction measures were identified
for various candidate PFMs as well as the one Potential Failure Mode identified. The team
members rated the identified PFM according to the criteria in Table 2 (below) based on the
information available, the adverse and favorable conditions, and the likelihood that the PFM
could lead to failure of the dam.
Only one potential failure mode was identified during the 2004 workshop for Oroville Dam; it
is listed in Table 3. The table includes a description of the failure mode, facts and data
relevant to the failure mode, conditions considered adverse or favorable to its occurrence,
possible risk reduction measures, and finally the classification arrived at by the session
participants. Due to special interest in this issue based on past evaluations and discussions,
and on the suggestion of the facilitator, the other candidate potential failure modes
considered but not carried forward as credible potential failure modes
are also entered here (rather then being discussed in the Other
Considerations – Section 1.6) in order to facilitate understanding of the issue and illustrate
the comprehensive consideration of this topic by the PFMA team. The description of the
candidate potential failure mode along with the primary rationale for not carrying these
candidate modes forward is provided in each case in Table 4.
Table 2: Potential Failure Mode Categories Category Description
I Highlighted Potential Failure Modes
Those potential failure modes of greatest significance considering need for awareness, potential for occurrence, magnitude of consequence and likelihood of adverse response (physical possibility is evident, fundamental flaw or weakness is identified and conditions and events leading to failure seemed reasonable and credible) are highlighted.
II Potential Failure Modes Considered but not Highlighted
These are judged to be of lesser significance and likelihood. Note that even though these potential failure modes are considered less significant than Category I, they are also described and included with reasons for and against the occurrence of the potential failure mode. The reason for the lesser significance is noted and summarized in the documentation report or notes.
III More Information or Analyses Needed in Order to Classify
These potential failure modes to some degree lacked information to allow a confident judgment of significance and thus a dam safety investigative action or analyses can be recommended. Because action is required before resolution, the need for this action may also be highlighted.
IV Potential Failure Mode Ruled Out
Potential failure modes may be ruled out because the physical possibility does not exist, information came to light which eliminated the concern that had generated the development of the potential failure mode, or the potential failure mode is clearly so remote as to be non-credible or not reasonable to postulate.
Oroville Dam Page 1-16 2009 Update PFMA Report
2009 PFMA Update: During the 2009 PFMA Update workshop, the only PFM for Oroville
Dam identified during the 2004 workshop was reviewed and discussed. The revisions to the
PFM development based on the 2009 review are shown in Table 3 (in bold face type). By
unanimous vote, the workshop participants confirmed that this PFM is still appropriately
classified as Category IV.
During the 2009 PFMA Update workshop, an additional Potential Failure Mode (PFM 2) was
proposed and discussed. The development of PFM 2 is documented in Table 3 below. After
discussion and consideration, the PFM was rated Category IV (Ruled Out).

Oroville Dam Page 1-17 2009 Update PFMA Report
Table 3: Failure Mode Analysis - Oroville Dam (2009 Update)
STATIC / NORMAL OPERATION
PFM 1 Potential Failure Mode Description –– Piping of Core Material leading to failure of the dam.
Potential Failure Mode Scenario –
Facts/Conditions:
Adverse (likely) Conditions:
Favorable (Unlikely) Conditions:
It would be hard for the postulated conveyance to carry enough material to cause a cavity large enough to cause a dam failure condition upon collapse.
Not enough gradient to move material (the Zone 1 is quite impermeable and it is unlikely that a pressurized water flow could develop).
Zone 3 may act as filter so material may not move into shell.
Historically had higher pressure monitored.
It is likely that a self filtering zone would develop in front of the postulated entry point of the flow
Possible Risk Reduction Measures:
.
Continue monitoring seepage quantity and determine if core material is being transported.
Observe crest for any signs of settlement or displacement. 2009 Update: It is unlikely that any evidence would be observed on the crest due to depth of burial
2009 Update: Since the piping mechanism has been ruled out, the risk reduction measures are probably not needed but it would be prudent to continue visually monitor seepage until a long-term monitoring system is in place.
2004 Classification - Category IV- “Potential failure mode is clearly so remote as to be non-credible or not reasonable to postulate” ---During the PFMA, prior to learning , the PFM was tentatively rated Category II/Category IV, primarily on the basis of the likelihood of self filtering developing in front of the and on the basis of – when it was learned that a Category IV seemed more appropriate.
2009 Update: Category IV (unanimous vote). The workshop participants confirmed the Category IV rating for this PFM since there has been no substantial change i.e. O&M changes) since the 2004 PFMA workshop.

Oroville Dam Page 1-18 2009 Update PFMA Report
Table 3 Continued: Failure Mode Analysis - Oroville Dam (2009 Update)
STATIC / NORMAL OPERATION
PFM 2 Potential Failure Mode Description ––
Facts/Conditions:
Adverse (likely) Conditions:
Favorable (Unlikely) Conditions:
Possible Risk Reduction Measures:
.
Classification - Category IV (unanimous vote) The 2009 workshop participants felt that the possibility of this PFM occurring is too remote to consider this a viable PFM.
Oroville Dam Page 1-19 2009 Update PFMA Report
Table 4: Failure Mode Analysis - Oroville Dam – Candidate Failure Modes Not Carried Forward
STATIC / NORMAL OPERATION
Candidate 1 Potential Failure Mode Description ---
Facts/Conditions:
.
Adverse (likely) Conditions:
Favorable (Unlikely) Conditions:
Possible Risk Reduction Measures:
Candidate mode not carried forward (2009 Board Concurs)
Oroville Dam Page 1-20 2009 Update PFMA Report
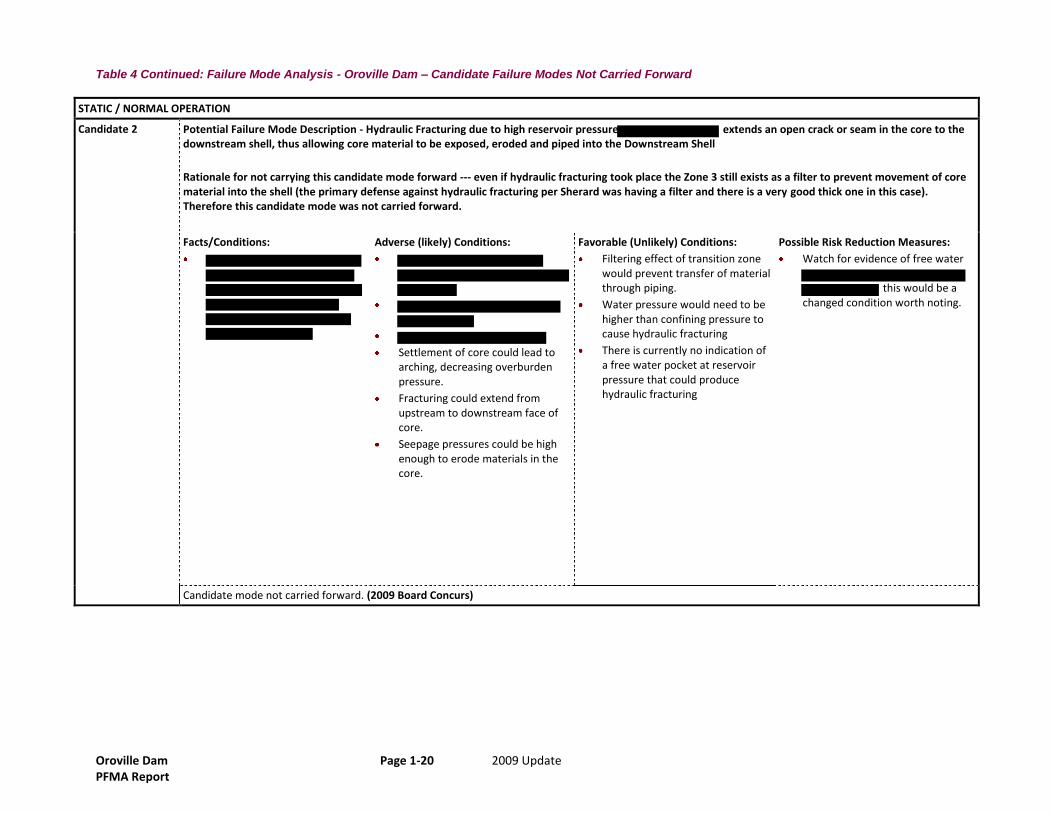
Table 4 Continued: Failure Mode Analysis - Oroville Dam – Candidate Failure Modes Not Carried Forward
STATIC / NORMAL OPERATION
Candidate 2 Potential Failure Mode Description - Hydraulic Fracturing due to high reservoir pressure extends an open crack or seam in the core to the downstream shell, thus allowing core material to be exposed, eroded and piped into the Downstream Shell
Rationale for not carrying this candidate mode forward --- even if hydraulic fracturing took place the Zone 3 still exists as a filter to prevent movement of core material into the shell (the primary defense against hydraulic fracturing per Sherard was having a filter and there is a very good thick one in this case). Therefore this candidate mode was not carried forward.
Facts/Conditions:
Adverse (likely) Conditions:
Settlement of core could lead to arching, decreasing overburden pressure.
Fracturing could extend from upstream to downstream face of core.
Seepage pressures could be high enough to erode materials in the core.
Favorable (Unlikely) Conditions:
Filtering effect of transition zone would prevent transfer of material through piping.
Water pressure would need to be higher than confining pressure to cause hydraulic fracturing
There is currently no indication of a free water pocket at reservoir pressure that could produce hydraulic fracturing
Possible Risk Reduction Measures:
Watch for evidence of free water
this would be a changed condition worth noting.
Candidate mode not carried forward. (2009 Board Concurs)

Oroville Dam Page 1-21 2009 Update PFMA Report
Table 4 Continued: Failure Mode Analysis - Oroville Dam – Candidate Failure Modes Not Carried Forward
STATIC / NORMAL OPERATION
Candidate 3 Potential Failure Mode Description - Hydraulic Fracturing due to high reservoir pressure leads to Piping Failure of Core
Rationale for not carrying potential failure mode forward --- Flow could develop along this path, which follows and hydraulic fracturing could facilitate the flow and exacerbate the erosion of material. However there is no physical evidence of any free flow of
water at this time let alone any material movement – furthermore the project closely monitors the opening on a weekly basis to block the free exit of material if there was ever evidence of material movement. Thus this potential failure mode is not considered reasonably viable at this time.
Facts/Conditions:
Adverse (likely) Conditions:
Settlement of core could lead to arching, decreasing overburden pressure.
Fracturing could extend from upstream to downstream face of core.
Seepage pressures could be high enough to erode materials in the core.
Favorable (Unlikely) Conditions:
Water pressure would need to be higher than confining pressure to cause hydraulic fracturing
Possible Risk Reduction Measures:
Continue to monitor seepage .
Watch for evidence of free water
– this would
be a changed condition worth noting.
Candidate mode not carried forward. (2009 Board Concurs)

Oroville Dam Page 1-22 2009 Update PFMA Report
Table 4 Continued: Failure Mode Analysis - Oroville Dam – Candidate Failure Modes Not Carried Forward
STATIC / NORMAL OPERATION
Candidate 4 Potential Failure Mode Description -
Rationale for not carrying potential failure mode forward -
Facts/Conditions:
Adverse (likely) Conditions:
Favorable (Unlikely) Conditions:
Possible Risk Reduction Measures:
Continue to monitor seepage
Watch for evidence of free water
– this
would be a changed condition worth noting.
Candidate mode not carried forward. (2009 Board Concurs)

Oroville Dam Page 1-23 2009 Update PFMA Report
1.4 LIKELY CONSEQUENCES OF EACH POTENTIAL FAILURE
MODE
1.4.1 Flood Related Potential Failure Modes
No flood related potential failure modes were identified. Issues related to hydrologic loading
at Oroville Dam are included in Section 1.6 – Other Considerations1.
1.4.2 Normal Operating Related Potential Failure Modes
A potential failure mode, PFM 1, related to the piping of core materials
was identified. Subsequently it was learned that
Because of this, piping of Oroville Dam core material
is not considered credible. Additional issues related to
normal operating conditions are included in Section 1.6 – Other Considerations.
1.4.3 Earthquake Related Potential Failure Modes
No earthquake related potential failure modes were identified. Issues related to seismic
loading at Oroville Dam are included in Section 1.6 – Other Considerations.
1.4.4 Other Condition Potential Failure Modes
No potential failure modes for other conditions were identified in the workshop. Issues
related the River Outlet and penstocks at Oroville Dam are included in Section 1.6 – Other
Considerations.
1 Section 1.4, Likely Consequences of Each Potential Failure Mode, was not updated during the 2009 PFMA
Update workshop

Oroville Dam Page 1-24 2009 Update PFMA Report
1.5 POTENTIAL RISK REDUCTION ACTIONS IDENTIFIED
The following are risk reduction actions associated with the identified potential failure mode.
They are also included in Table 3 in Section 1.3.
1.
2. Original 2004 Potential Risk Reduction Action: Continue monitoring seepage
quantity and turbidity for any material
2009 Update: The Potential Risk Reduction Action was revised to “Continue
monitoring seepage quantity and visually monitor for clarity.” Seepage
measurements are currently taken once per week. The need for turbidity
measurements is questionable and the logistics of taking turbidity measurements
are difficult. However, visual monitoring for turbidity (i.e. clarity) may also be
difficult. Algae growth also makes monitoring of sediment difficult. Nonetheless, it
was generally agreed that a subjective (qualitative) assessment could be made
based on visual observations.
A number of risk reduction actions were also identified that were related to failure mode
candidates that were not carried forward. These actions are listed below.
3.
4. Original 2004 Potential Risk Reduction Action: Consider periodic crest
surveys every 5 years for Bidwell Canyon and Parish Camp Saddle Dams. The
survey monuments, located at the downstream edge of the crest, are currently
surveyed biannually.
2009 Update: Crest surveys were completed in summer 2009. The survey results
show that Oroville Dam still has camber and the dam was considerably “overbuilt”
(3-5 ft). The Oroville crest is currently above design El. 922. ft.
5.
6. Original 2004 Potential Risk Reduction Action:
2009 Update:
Oroville Dam Page 1-25 2009 Update PFMA Report
7. Check frequency curve update based on new hydrology
8. Check recent flood study report indicating a peak inflow of 341,000 cfs for the
1997 flood
9. Resolve discrepancy in spillway rating documents on upper flows (305,000 cfs
vs. 296,000 cfs)
10. Check the effects on the rating curve of the changed conditions upstream of the
emergency spillway (paved area, curbs, fences, trees)
11. Original 2004 Potential Risk Reduction Action:
12.
13. Verify the tensile strength of the
14. Check functionality of spillway gates after significant earthquakes.
15.

Oroville Dam Page 1-26 2009 Update PFMA Report
1.6 OTHER CONSIDERATIONS RELATED TO STUDY
During the PFMA workshop, several candidate potential failure modes were postulated.
However, after further discussion, it was agreed that they were not likely enough to warrant
further evaluation. These candidate modes are categorized as “other considerations” and
are documented in the report along with the primary reason or reasons that they were not
carried forward as a potential failure mode. These candidate PFMs are described below
along with other facts and conditions related to them.
2. Normal flood control operating criteria is not to exceed 150,000 cfs or 10,000 cfs
change in 2 hours. Then emergency release procedures apply and release
schedule is defined by USACE. However, once the reservoir reaches Elev. 901
feet, the emergency spillway will kick in. Discussed use of forecast based
operation. No viable potential failure mode was identifiable.
3. Original 2004 Other Consideration: There is enough freeboard to handle an
earthquake induced landslide in the reservoir. Assessments of the potential
landslide areas indicated that they are submerged at high reservoir elevations
and hence not generate significant displacement waves if they were to fail then.
Conversely, if the reservoir was low enough for the slides to generate bigger
displacement waves, the additional existing freeboard would be more than
enough to contain them. No viable potential failure mode was identifiable.
2009 Update: Workshop participants agreed there is enough freeboard to handle
a landslide in the reservoir. Assessments indicate that some of the landslides are
partially or fully submerged at high reservoir elevations, and some are partially or
fully above the varying elevations of the reservoir. The effect of a landslide would
depend on the landslide location and reservoir level. The largest identified
landslides are located in upstream arms of the reservoir and not on the main
reservoir body. Regardless, the existing freeboard would be more than enough to
contain waves generated by landslides entering the reservoir. Therefore, no
visible potential failure mode was identifiable.

Oroville Dam Page 1-27 2009 Update PFMA Report
If sump pumps in drainage gallery stopped working, water level would only get as
high as the bypass gallery which can free drain. Also have backup pumping. No
viable potential failure mode was identifiable.
5. Since the candidate potential failure mode is piping of core material
leading to collapse of crest into cavity and
overtopping breach, the following applies.
Algae build up would make monitoring for
sediment difficult. No viable potential failure mode was identifiable and this mode
was not carried forward for the following reasons. The gradation of the core
material is such that piping through the cracks is highly unlikely and it is likely
that a self-filtering zone would develop at the seepage entrance. There has been
no evidence of material movement to date and the seepage condition / material
movement evidence is able to be regularly monitored so that intervention (further
remediation grouting)/ could occur before failure could occur.
6.
.

Oroville Dam Page 1-28 2009 Update PFMA Report
2009 Update: This scenario was developed as PFM 2 and was unanimously
classified as Category IV. The workshop participants felt that the possibility of this
PFM occurring was too remote to be credible.
10. Piping of core through the dam was examined as a candidate potential failure
mode. It was not carried forward as a potential failure mode for two primary
reasons: (1) The Zone 3 serves as a filter for the core and (2) there is essential
no seepage through the core to produce the possibility of piping.
Piping of core from the dam into the foundation was examined as a candidate
potential failure mode. It was not carried forward for two primary reasons: (1)
Although there may be open joints within the foundation the nature of the core
gradation is such that it would be difficult to sustain movement of the core
material through the joints (they would plug and or a filter would form at the entry
point), also the length / continuity of open joints would have to be exceptionally
long (2) there is very little seepage through the core into the foundation to
produce the possibility of piping material.
12. 2009 Update:

Oroville Dam Page 1-29 2009 Update PFMA Report
1.7 SUMMARY OF POTENTIAL ACTIONS IDENTIFIED IN THE
PFMA WITH RESPECT TO PERFORMANCE MONITORING
The following action items with respect to performance monitoring were identified during the
2004 PFMA2:
Continue monitoring seepage quantity and turbidity of flow
3. Continue monitoring weirs
4. Consider periodic crest surveys every 5 years for Bidwell Canyon and Parish
Camp Saddle Dams to determine actual crest elevations. Note that crest
monuments are surveyed biannually.
2 Section 1.7, Summary of Potential Actions Identified in the PFMA with Respect to Performance Monitoring,
was not updated during the 2009 PFMA workshop.

Oroville Dam Page 1-30 2009 Update PFMA Report
1.8 SUMMARY AND CONCLUSIONS
Only one potential failure mode related to Oroville Dam was identified.
After discussion of this mode as a candidate potential failure mode it was recognized
that this potential failure mode was probably not credible. However, it was carried forward as
a PFM because of the long history of discussion of this issue and the desire to fully
document it, using the “likely” and “not likely” factors. During the discussion of these factors
it became clear that the
would likely preclude
development of a sustainable potential failure mode scenario. This inference was reinforced
subsequently
. The PFM, which was rated a Category II/IV at the
session is now, based on this additional information, considered to be a Category IV
because is not
considered credible.
The following additional conclusions are based on the 2004 PFMA workshop for Oroville
Dam3:
1. The new PMF, based on HMR 58/59, can be passed through the spillway with
adequate freeboard on Oroville Dam and the Saddle Dams.
2.
3.
4. The emergency spillway has significant capacity even if the flood control gates
are closed.
5. The rating of the emergency spillway may be affected by the upstream parking
area and the security fencing.
6. Total seepage from Oroville Dam is very small for such a large dam.
7. Steady-state seepage may not have yet developed in the dam due to the very
impervious core and the large reservoir fluctuation.
8. Recent stability analyses of Oroville Dam show that the dam has adequate
factors of safety for all loading conditions based on original design material
strengths. With updated material strengths, it is estimated that factors of safety
will increase by about 40% in reanalysis.
3 Section 1.8, Summary and Conclusions was not updated during the 2009 PFMA workshop.

Oroville Dam Page 1-31 2009 Update PFMA Report
9.

Oroville Dam Page 1 -A1 2009 Update PFMA Report
Appendix A – List of Reference Reports (2004 PFMA)
1. California Department of Water Resources, 1968, Final Geologic Report on
Foundation Conditions and Grouting, Oroville Peripheral Dams, June 1968.
2. California Department of Water Resources, 1968, Final Geologic Report on
Foundation conditions and Grouting, Oroville Dam, Part II, Foundation Grouting, July
1968.
3. California Department of Water Resources, 1968, Final Geologic Report on
Foundation Conditions and Grouting, Oroville Dam, Part I, Foundation Geology
(December 1968)
4. California Department of Water Resources, Project Surveillance, 1969, Oroville Dam
and Lake Performance of the Flood Control Outlet During the Storms of January-
February 1969, March 1969.
5. California Department of Water Resources, 1972, Final Design Report, Bidwell
Canyon and Parish Camp Saddle Dams, June 1972.
6. Chadwick, Wallace L. and Thomas M. Leps for California Department of Water
Resources, 1973, Inspection and Review of Oroville - Thermalito Project Facilities
(Oroville Dam, Thermalito Diversion Dam, Thermalito Forebay Dam, Thermalito
Afterbay Dam, Feather River Hatchery Dam) (1973)
7. California Department of Water Resources, 1974, Bulletin 200, California State
Water Project, Volume III, Storage Facilities, November 1974.
8. California Department of Water Resources, 1977, Bulletin 203, Performance of the
Oroville Dam and Related Facilities During the August 1, 1975 Earthquake, April
1977.
9. California Department of Water Resources, 1979, Bulletin 203-78, The August 1,
1975 Oroville Earthquake Investigations, February 1979.
10. Leps, Thomas M. for California Department of Water Resources, 1980, 1979
Inspection and Review of Safety of Orville - Thermalito Project Facilities (Second
Five-Year Review), February 1980.
11. Thomas Leps, Inc. Consulting Civil Engineering, 1981, Oroville Reservoir Flood
Routing (Response to letter), April 20, 1981.
12. California Department of Water Resources, 1982, Oroville Dam – Investigation of the
Causes and Consequences of Abrupt Changes in Piezometer Readings,
Memorandum Report, May 1982.
13. California Department of Water Resources, 1989, Bulletin 203-88, The August 1,
1975 Oroville Earthquake Investigations, Supplement to Bulletin 203-78, May 1989.
14. Wahler Associates for California Department of Water Resources, 1989, 1989
Inspection and Safety Review (Fourth Independent Safety Evaluation), Oroville Dam
and Bidwell Canyon and Parish Camp Saddle Dams, November 1989.

Oroville Dam Page 1 -A2 2009 Update PFMA Report
15. California Department of Water Resources, 1991, Oroville Dam, State Dam No. 1-48,
Performance Report No. 9, July 1987 – December 1990, January 1, 1991.
16. California Department of Water Resources, 1992, Investigation of Recent
Instrumentation performance at Oroville Dam, Memorandum Report, October 1992.
17. Woodward-Clyde Consultants for California Department of Water Resources, 1994,
Fifth Safety Inspection Report of the Oroville Dam Facilities, May 1994.
18. Independent Review of Safety of Oroville Dam and Associated Dams and Structures,
May 1994.
19. Independent Consulting Board Meeting to Review Design of Remedial
Instrumentation Grouting Program for Oroville Dam, Information Package, August 17
& 18, 1994.
20. Centers for Water and Wildland Resources University of California Davis, 1994,
Hydraulic Model Study of the Oroville Dam River Outlet Works, October 28, 1994.
21. Second Independent Consulting Board Meeting to Review Design of Remedial
Instrumentation Grouting Program for Oroville Dam, Information Package, December
7, 1994.
22. OD A/B Joint Pre-Grouting Conference, April 4, 1995.
23. FERC Special Consulting Board, 1995, Remedial Instrumentation Grouting for
Oroville Dam, December 12, 1995, Third Meeting, December 1995.
24. California Department of Water Resources, 1996, Oroville Dam Remedial
Instrumentation Grouting Program, Appendix, October 1996.
25. California Department of Water Resources, Oroville Division Lake Oroville, 1996,
Geologic Assessment of the Bloomer Hill Landslide, Project Geology Section Report
No 20-11-33, December 1996.
26. California Department of Water Resources, 1997, Structural Inspection of the Radial
Gates at Oroville Dam Spillway, Memorandum Report, May 1997.
27. California Department of Water Resources, 1997, Spillway Repair Oroville Dam,
Specifications Bid and Contract, Contract No C51141, Specification No. 97-22.
28. California Department of Water Resources, 1999, Structural Reevaluation of the
Radial Gates at Oroville Dam Spillway, February 1999.
29. Independent Review of Safety of Oroville Dam (Oroville Dam, Thermalito Diversion,
Forebay, Afterbay Dams, Feather River Fish Barrier Dam), May 1999.
30. Gomez & Sullivan Engineers, P.E., Findlay Engineering Inc. for California
Department of Water Resources, 1999, Sixth Part 12 Safety Inspection Report for
the Oroville Dam, Oroville-Thermalito Power-Complex, September 1999.
31. California Department of Water Resources by Ken Carroll & Melissa Madison,
Project Surveillance, 2000, Ultrasonic Inspection of Radial Gate Tendons, Lake
Oroville Spillway and Pyramid Lake Spillway, March 23, 2000.
Oroville Dam Page 1 -A3 2009 Update PFMA Report
32. California Department of Water Resources, 2000, Oroville Dam, Performance Report
No. 10, January 1991- July 2000, August 2000.
33. California Department of Water Resources by Tim Kennelly, 2001, Chief Corrosion
Engineering Services, 2001, Oroville Dam Radial Gate 4 Trunnion Pin Inspection,
November 1, 2001.
34. California Department of Water Resources, 2003, Memorandum of Inspection, Hyatt
Powerplant Penstock Number 1, Oroville Dam, March 17, 2003.
35. California Department of Water Resources by Dan Salyers and reviewed by Tim
Kennelly, 2003, Hyatt Pump-Generating Plan Penstock Number 1, Inspection
Report, March 17, 2003.
36. California Department of Water Resources by David L. Panec, PE, 2003,
Memorandum of Inspection, Hyatt Powerplant Penstock Number 2, Oroville Dam,
April 28, 2003.
37. California Department of Water Resources, 2003, Lake Oroville Updated Probable
Maximum Flood Memorandum, June 1, 2003
38. California Department of Water Resources, 2003, Investigation of Spillway Routing
During Probable Maximum Flood at Oroville Dam, Memorandum Report (December
2003)
39. California Department of Water Resources, 2004, Oroville Dam Performance Report
No. 11, August 2000 - June 2004, August 2004.
40. California Department of Water Resources, 2005, Oroville Facilities Slope Stability
Analysis, Oroville Dam, Bidwell Bar Canyon Saddle Dam, and Parish Camp Saddle
Dam August 2005.
41. California Department of Water Resources, Division of Operations and Maintenance,
Standard Operating Order Number PC 700.20.
Oroville Dam Page 1-B1 2009 Update PFMA Report
Appendix B – List of Reference Drawings/Figures (2004 PFMA)

Oroville Dam Page 1-B2 2009 Update PFMA Report

Oroville STID 11-1 December 2011
Appendix C – Photos Taken During 2004 Field Review
Photo 1. Oroville Dam – Bidwell Canyon Saddle Dam,
Main Embankment Downstream Slope
Photo 2. Oroville Dam – Bidwell Canyon Saddle Dam
Main Embankment Upstream Slope

Oroville STID 11-2 December 2011
Photo 3. Oroville Dam – Bidwell Canyon Saddle Dam
Looking Downstream to Miner‟s Ranch Reservoir
Photo 4. Hyatt Powerplant Intake

Oroville STID 11-3 December 2011
Photo 5. Oroville Dam – Flood Control Structure
Photo 6. Oroville Dam – Spillway Chute

Oroville STID 11-4 December 2011
Photo 7. Oroville Dam – Emergency Spillway
Ogee Crest with Broadcrested Weir beyond

Oroville STID 11-5 December 2011
Photo 9. Oroville Dam – Main Embankment – Downstream Face

Oroville STID 11-6 December 2011