1 Peter Fox Data Analytics – ITWS-4963/ITWS-6965 Week 1b, January 30, 2015 Introductory...
40
1 Peter Fox Data Analytics – ITWS-4963/ITWS-6965 Week 1b, January 30, 2015 Introductory Statistics/ Refresher and Relevant software installation.
-
Upload
leslie-bennett -
Category
Documents
-
view
214 -
download
0
Transcript of 1 Peter Fox Data Analytics – ITWS-4963/ITWS-6965 Week 1b, January 30, 2015 Introductory...

1
Peter Fox
Data Analytics – ITWS-4963/ITWS-6965
Week 1b, January 30, 2015
Introductory Statistics/ Refresher and Relevant
software installation.
Admin info (keep/ print this slide)• Class: ITWS-4963/ITWS 6965• Hours: 12:00pm-1:50pm Tuesday/ Friday• Location: Lally 102• Instructor: Peter Fox• Instructor contact: [email protected], 518.276.4862 (do not
leave a msg)• Contact hours: Monday** 3:00-4:00pm (or by email appt)• Contact location: Winslow 2120 (sometimes Lally 207A
announced by email)• TA: Jiaju Shen [email protected] and help from James Ryan (
[email protected])• Web site: http://tw.rpi.edu/web/courses/DataAnalytics/2015
– Schedule, lectures, syllabus, reading, assignments, etc.– http://escience.rpi.edu/data/DA
2

Today• Initial review of stats and terms that are
important for this course
• Then… check in on installation of application software, and
• Getting some data and read, explore, etc.
3
Definitions/ topics• Statistic• Statistics• Population and
Samples• Sampling• Distributions and
parameters• Central Tendencies• Frequency• Probability
4
• Significance tests• Hypothesis (null and
alternate)• P-value• Density and cumulative
distributions

Statistic and Statistics• Statistic (not to be confused with Statistics)
– Characteristic or measure obtained from a sample.
• Statistics– Collection of methods for planning experiments,
obtaining data, and then organizing, summarizing, presenting, analyzing, interpreting, and drawing conclusions.
5

• A population is defined (“all” of the data)– We must be able to say, for every object, if it is in the population or
not– We must be able, in principle, to find every individual of the
population– Inferential statistics apply here - Generalizing from samples to
populations using probabilities. Performing hypothesis testing, determining relationships between variables, and making predictions.
• A sample is a subset of a population (“some” of the data)– We must be able to say, for every object in the population, if it is in
the sample or not (detecting “outliers”, “errors”, etc.)– Sampling is the process of selecting a sample from a population– Descriptive statistics apply here (especially distributions)
Populations and samples
6

E.g. Election prediction• Exit polls versus election results
– Human versus cyber• How is the “population” defined here?
• What is the sample, how chosen?– What is described and how is that used to
predict?– Are results categorized? (where from, M/F, age)
• What is the uncertainty?– It is reflected in the “sample distribution”– And controlled/ constraints by “sampling theory”
7

Sampling Types (basic)• Random Sampling
– Sampling in which the data is collected using chance methods or random numbers.
• Systematic Sampling– Sampling in which data is obtained by selecting every kth object.
• Convenience Sampling– Sampling in which data is which is readily available is used.
• Stratified Sampling– Sampling in which the population is divided into groups (called strata)
according to some characteristic. Each of these strata is then sampled using one of the other sampling techniques.
• Cluster Sampling– Sampling in which the population is divided into groups (usually
geographically). Some of these groups are randomly selected, and then all of the elements in those groups are selected. 8

Random Numbers• Can a computer generate a random number?
• Can you?
• Origin – to reduce selection bias!
• In R – many ways – see help on Random {base} and get familiar with set.seed
9
Sampling Theory• See Nyquist–Shannon – for time-series*
• Basically if there are no frequencies greater than x, then you need to sample at 2 x /time unit
• Not well known application: good, better, best– How many samples?
10

Minimum Sample Size• Typical formula** is
– N=(z * std deviation)^2/ (margin of error)^2
– May need to estimate std deviation
– z is from confidence intervals (normal distribution)
– Margin of error is your tolerance for being wrong
– E.g. for elections ~7000 ! Based on 1% error and 95% confidence…
11

Bias difference: between cyber and human data
• Election results and exit polls– What are examples of bias in election results?
– In exit polls?
12

Distributions• http://www.quantitativeskills.com/sisa/rojo/alld
ist.zip
• Shape• Character• Parameter(s)
– Mean– Standard deviation– Skewness– Etc.
13
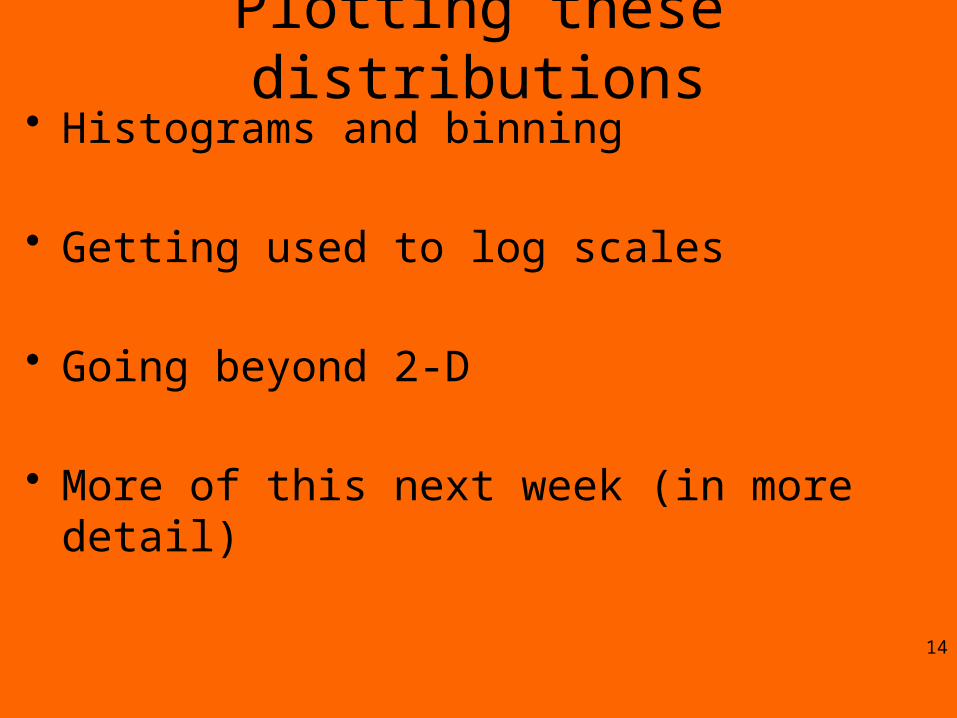
Plotting these distributions• Histograms and binning
• Getting used to log scales
• Going beyond 2-D
• More of this next week (in more detail)
14

In applications• Scipy:
http://docs.scipy.org/doc/scipy/reference/stats.html
• R: http://stat.ethz.ch/R-manual/R-patched/library/stats/html/Distributions.html
• Matlab: http://www.mathworks.com/help/stats/_brn2irf.html
• Excel: HAH!
15

Heavy-tail distributions• are probability distributions whose tails are
not exponentially bounded• Common – long-tail… human v. cyber…
16
Few that dominate More that add up
Equal areas
http://en.wikipedia.org/wiki/Heavy-tailed_distribution

Spatial example
17
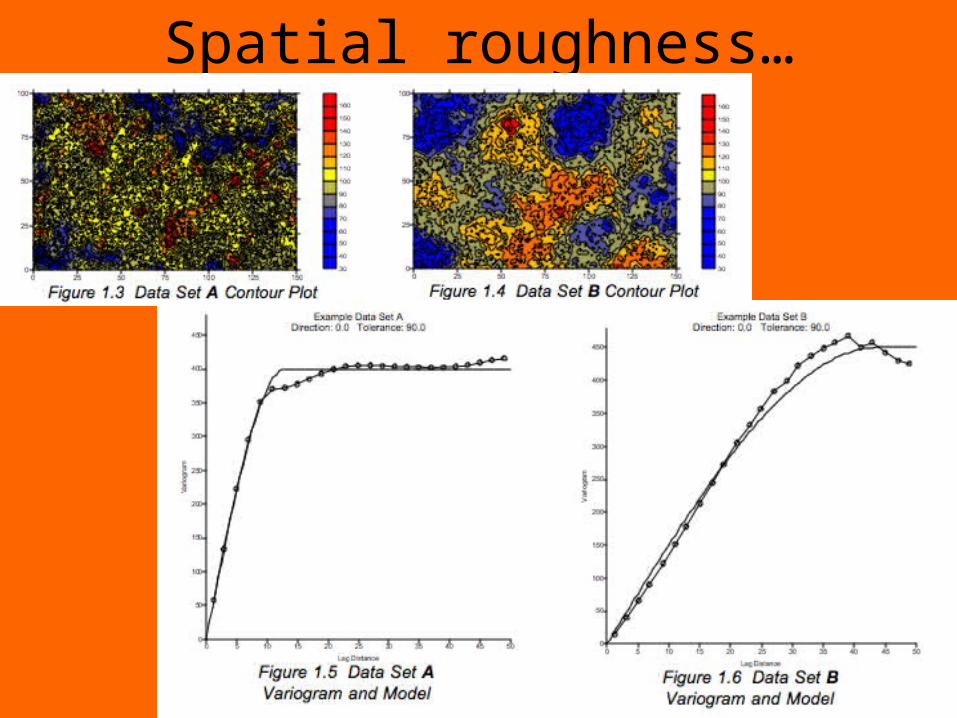
Spatial roughness…
18
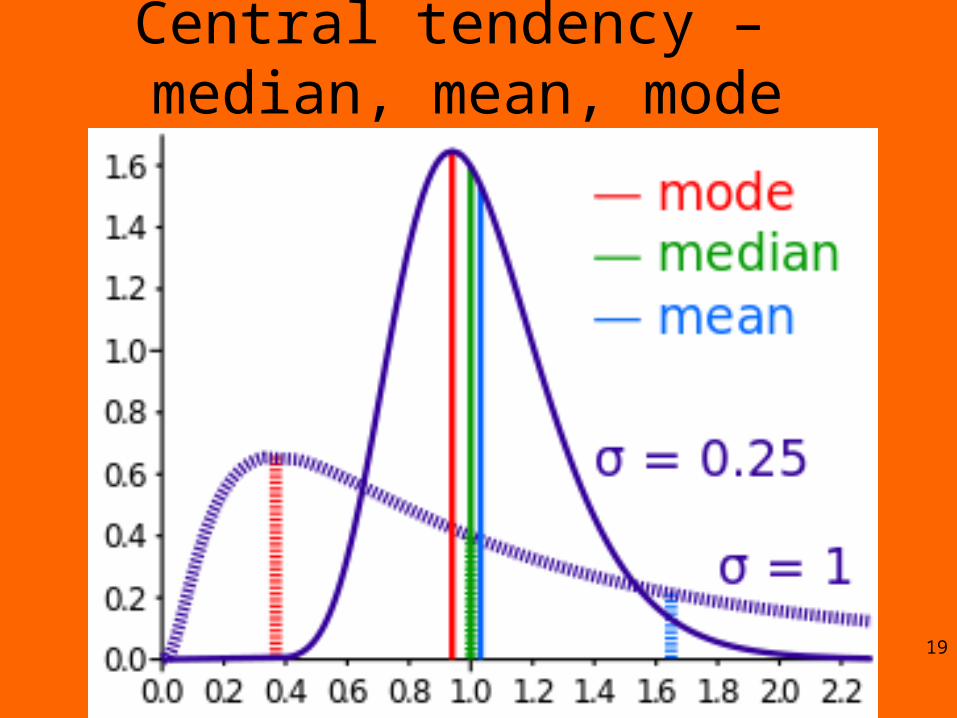
Central tendency – median, mean, mode
19

Significance Tests• Confidence intervals allow you to accept or
reject hypotheses… (critical region) - two-tailed test.– If the hypothesized value of the parameter lies
within the confidence interval with a 1-alpha level of confidence, then the decision at an alpha level of significance is to fail to reject the null hypothesis, i.e. accept
– If the hypothesized value of the parameter lies outside the confidence interval with a 1-alpha level of confidence, then the decision at an alpha level of significance is to reject the null hypothesis.
20

Variability in normal distributions
21

F-test
22
F = S12 / S2
2
where S1 and S2 are the
sample variances.
The more this ratio deviates from 1, the stronger the evidence for unequal population variances.

T-test
23

Note on Standard Error• Versus standard deviation (i.e. from the
mean)• SE ~ SD/sample size
• So, as size increases SE << SD !! Big data
24

Frequencies v. Probabilities• Actual rate of occurrence in a sample or
population – frequency• Expected or estimate likelihood of a value or
outcome
• Coin toss – two outcomes (binomial)– p=0.5
25
Ranges: z, Percentiles, Quartiles• The standard score is obtained by subtracting
the mean and dividing the difference by the standard deviation. The symbol is z, which is why it's also called a z-score.
• Percentiles (100 regions)– The kth percentile is the number which has k% of
the values below it. The data must be ranked. • Quartiles (4 regions)
– The quartiles divide the data into 4 equal regions. – Note: The 2nd quartile is the same as the median.
The 1st quartile is the 25th percentile, the 3rd quartile is the 75th percentile.
26

Hypothesis1. Write the original claim and identify whether it is
the null hypothesis or the alternative hypothesis.
2. Write the null and alternative hypothesis. Use the alternative hypothesis to identify the type of test.
3. Write down all information from the problem.
4. Find the critical value using the tables
5. Compute the test statistic
6. Make a decision to reject or fail to reject the null hypothesis. A picture showing the critical value and test statistic may be useful.
7. Write the conclusion.27

Hypothesis• What are you exploring?• Regular data analytics features ~ well defined
hypotheses– Big Data messes that up
• E.g. Stock market performance / trends versus unusual events (crash/ boom):– Populations versus samples – which is which?– Why?
• E.g. Election results are predictable from exit polls
28

Null and Alternate Hypotheses• H0 - null• H1 – alternate• If a given claim contains equality, or a
statement of no change from the given or accepted condition, then it is the null hypothesis, otherwise, if it represents change, it is the alternative hypothesis.
• It never snows in Troy in January• Students will attend their scheduled classes 29

P-value• One common way to evaluate significance,
especially in R output– approaches hypothesis testing from a different
manner. Instead of comparing z-scores or t-scores as in the classical approach, you're comparing probabilities, or areas.
• The level of significance (alpha) is the area in the critical region. That is, the area in the tails to the right or left of the critical values.
30

P-value• The p-value is the area to the right or left of
the test statistic. – If it is a two tail test, then look up the probability
in one tail and double it.• If the test statistic is in the critical region, then
the p-value will be less than the level of significance. – It does not matter whether it is a left tail, right tail,
or two tail test. This rule always holds.
31

Accept or Reject?• Reject the null hypothesis if the p-value is
less than the level of significance.
• You will fail to reject the null hypothesis if the p-value is greater than or equal to the level of significance.
• Typical significance 0.05 (!)
32

Probability Density
33

Cumulative…
34

Pause…
35

Gnu R• http://lib.stat.cmu.edu/R/CRAN/ - load this first• http://cran.r-project.org/doc/manuals/ • http://cran.r-project.org/doc/manuals/R-lang.html • R Studio – see R-intro.html in manualshttp
://www.rstudio.com/ide/download/ – Manuals - Libraries – at the command line –
library(), or select the packages tab, and check/ uncheck as needed
36

Files • http://escience.rpi.edu/data/DA • This is where the files for assignments,
exercise will be placed
37

Exercises – getting data in• Rstudio
– read in csv file (two ways to do this) - GPW3_GRUMP_SummaryInformation_2010.csv
– Read in excel file (directly or by csv convert) - 2010EPI_data.xls (2010EPI_data tab)
– See if you can plot some variables– Anything in common between them?
38

If time or for fun…• se_eqs.xls
– Plot it– Fit it
• PRESSURE.xls– Plot it– Smooth it– Fit it …
39

No reading this week• Complete the installs as best you can
40