1 Pertemuan 06 Peluang Beberapa Sebaran Khusus Peubah Acak Diskrit Mata kuliah: A0392 - Statistik...
26
1 Pertemuan 06 Peluang Beberapa Sebaran Khusus Peubah Acak Diskrit Mata kuliah : A0392 - Statistik Ekonomi Tahun : 2010
-
Upload
adrianna-whitcomb -
Category
Documents
-
view
250 -
download
0
Transcript of 1 Pertemuan 06 Peluang Beberapa Sebaran Khusus Peubah Acak Diskrit Mata kuliah: A0392 - Statistik...

1
Pertemuan 06
Peluang Beberapa Sebaran Khusus Peubah Acak Diskrit
Mata kuliah : A0392 - Statistik Ekonomi
Tahun : 2010

2
Outline Materi:
• Sebaran Binomial• Sebaran Poisson• Sebaran Hypergeometrik
3
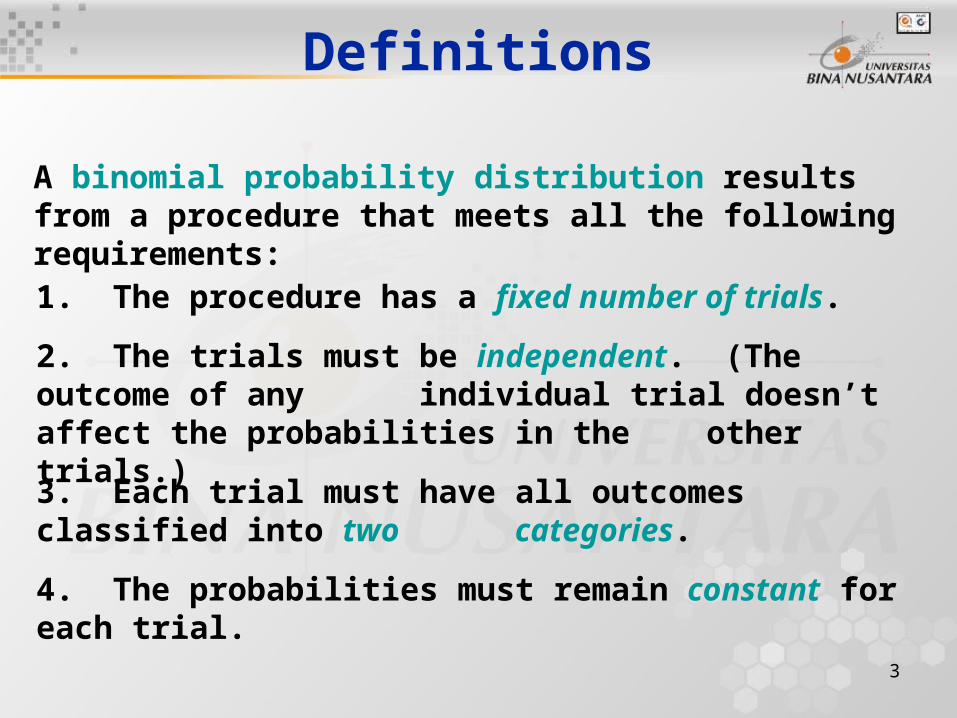
Definitions
A binomial probability distribution results from a procedure that meets all the following requirements:
1. The procedure has a fixed number of trials.
2. The trials must be independent. (The outcome of any individual trial doesn’t affect the probabilities in the other trials.)
3. Each trial must have all outcomes classified into two categories.
4. The probabilities must remain constant for each trial.
4
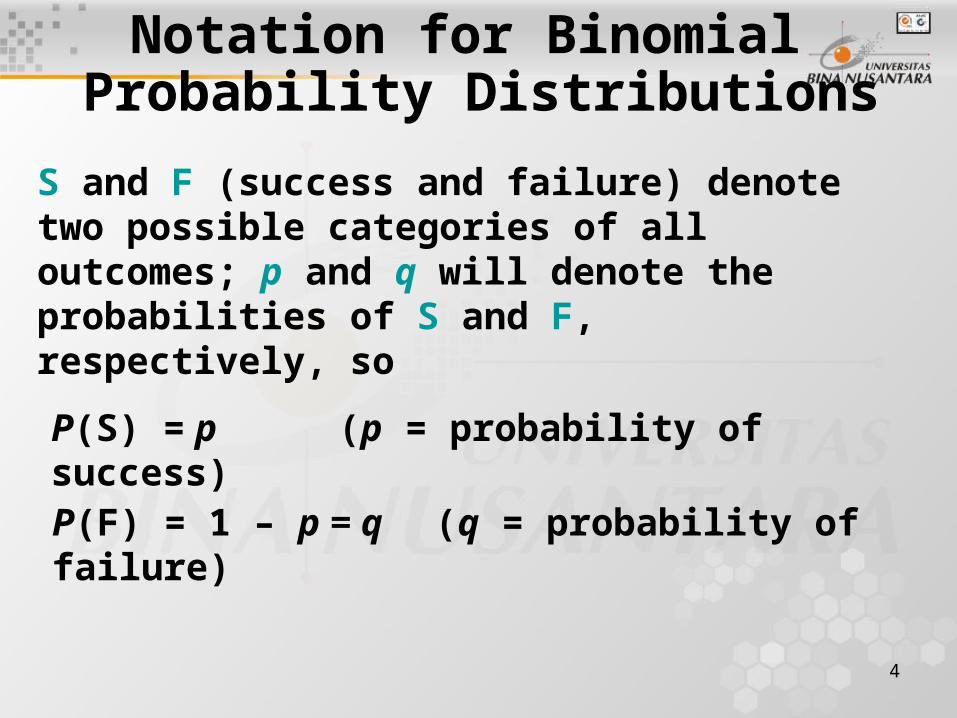
Notation for Binomial Probability Distributions
S and F (success and failure) denote two possible categories of all outcomes; p and q will denote the probabilities of S and F, respectively, so
P(S) = p (p = probability of success)
P(F) = 1 – p = q (q = probability of failure)
5
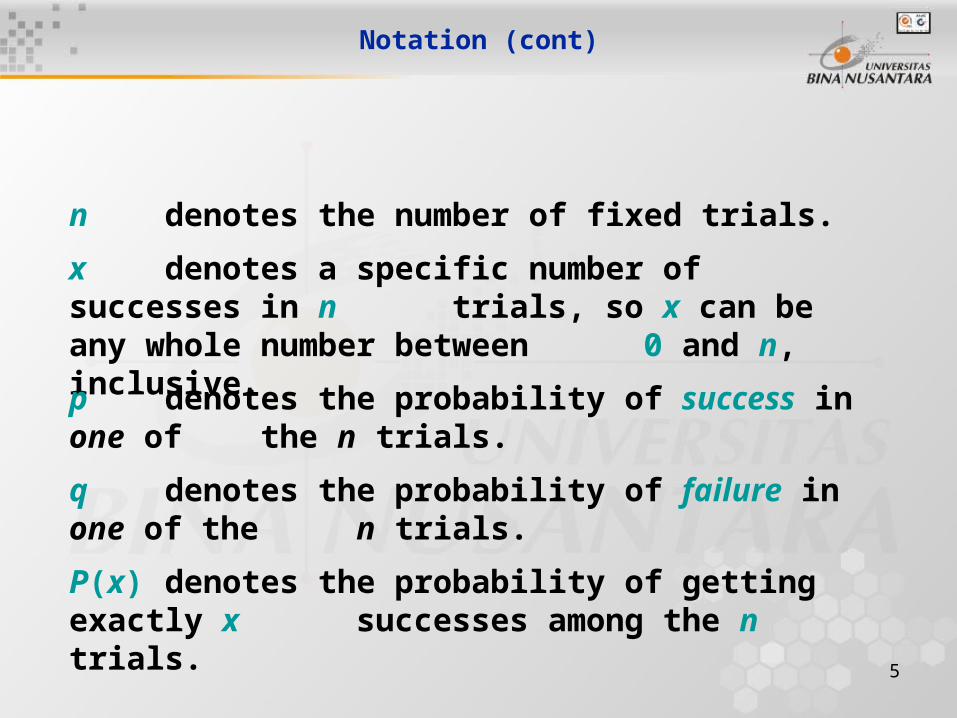
Notation (cont)
n denotes the number of fixed trials.
x denotes a specific number of successes in n trials, so x can be any whole number between 0 and n, inclusive.
p denotes the probability of success in one of the n trials.
q denotes the probability of failure in one of the n trials.
P(x) denotes the probability of getting exactly x successes among the n trials.
6
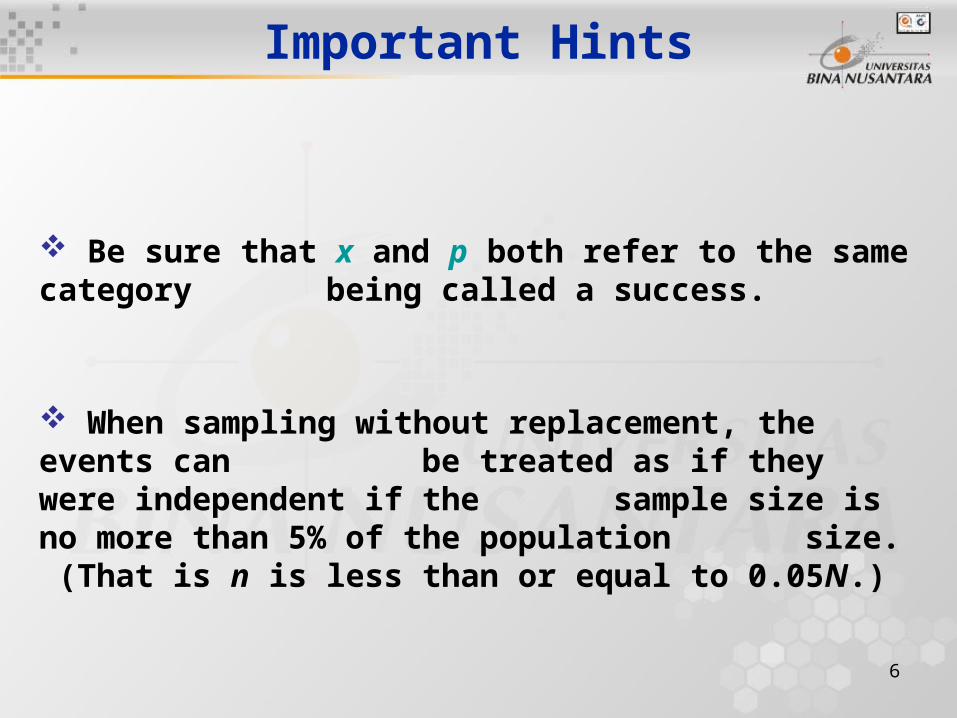
Important Hints
Be sure that x and p both refer to the same category being called a success.
When sampling without replacement, the events can be treated as if they were independent if the sample size is no more than 5% of the population size. (That is n is less than or equal to 0.05N.)
7
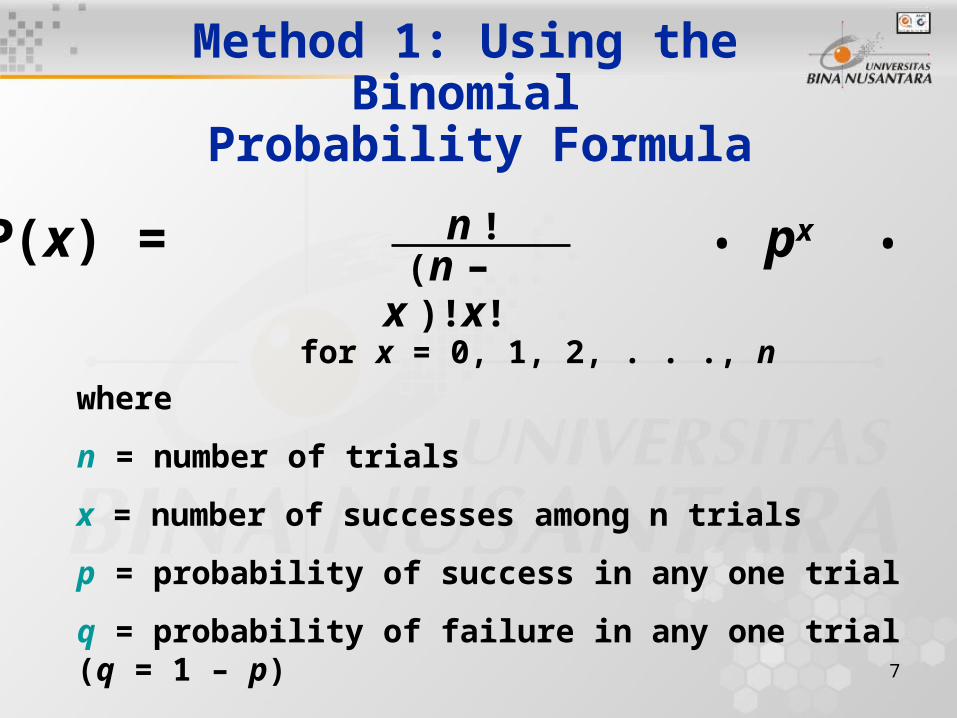
Method 1: Using the Binomial
Probability Formula
P(x) = • px • qn-x (n – x )!x!
n !
for x = 0, 1, 2, . . ., n
where
n = number of trials
x = number of successes among n trials
p = probability of success in any one trial
q = probability of failure in any one trial (q = 1 – p)
8
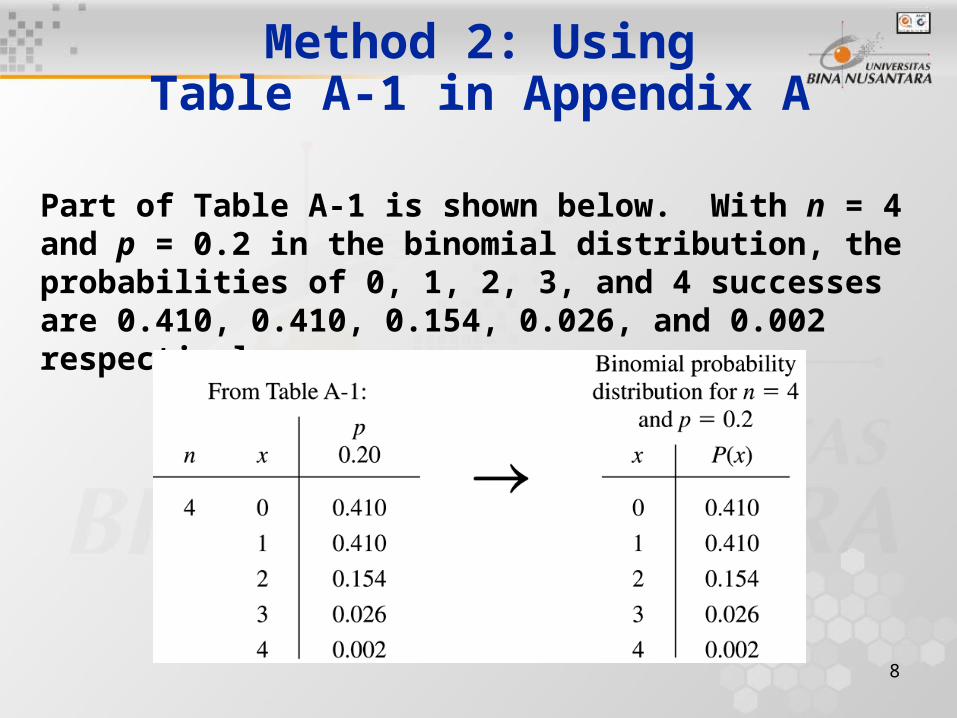
Method 2: UsingTable A-1 in Appendix A
Part of Table A-1 is shown below. With n = 4 and p = 0.2 in the binomial distribution, the probabilities of 0, 1, 2, 3, and 4 successes are 0.410, 0.410, 0.154, 0.026, and 0.002 respectively.

9
P(x) = • px • qn-xn ! (n – x )!x!
Number of outcomes with
exactly x successes
among n trials
Rationale for the Binomial Probability Formula
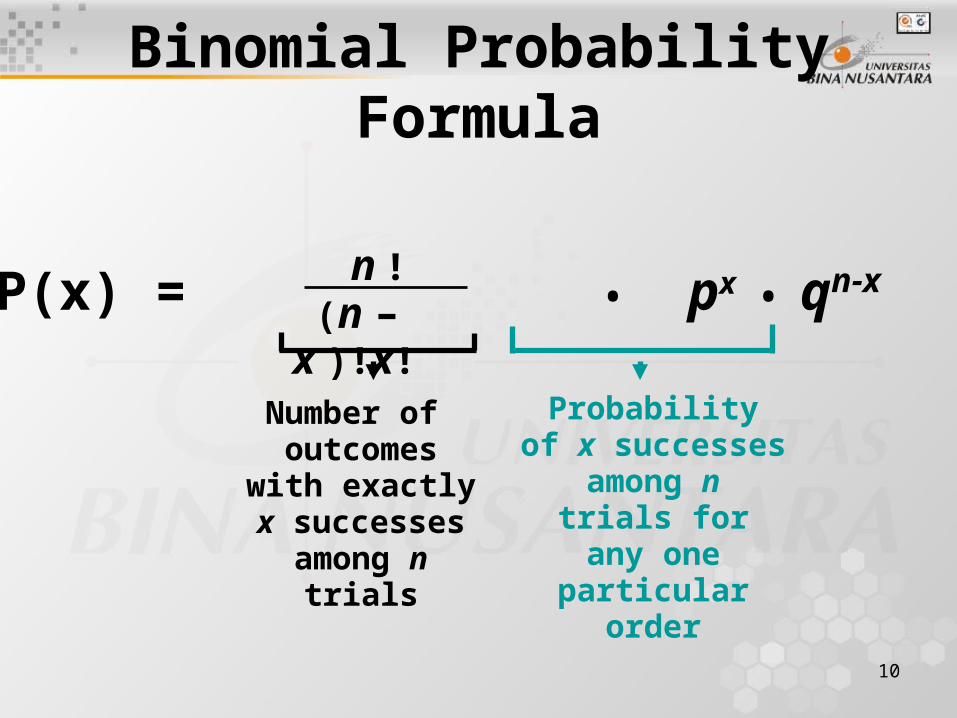
10
P(x) = • px • qn-xn ! (n – x )!x!
Number of outcomes with
exactly x successes
among n trials
Probability of x successes
among n trials for any one
particular order
Binomial Probability Formula
11
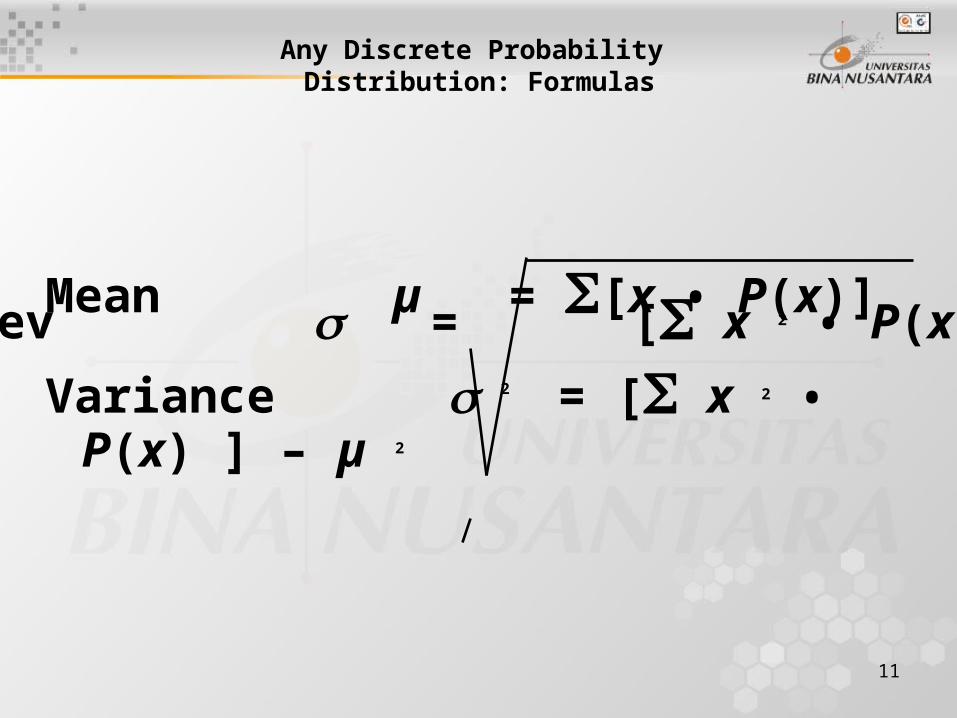
Any Discrete Probability Distribution: Formulas
Std. Dev = [ x 2 • P(x) ] – µ 2Mean µ = [x • P(x)]
Variance 2= [ x 2 • P(x) ] – µ 2
12
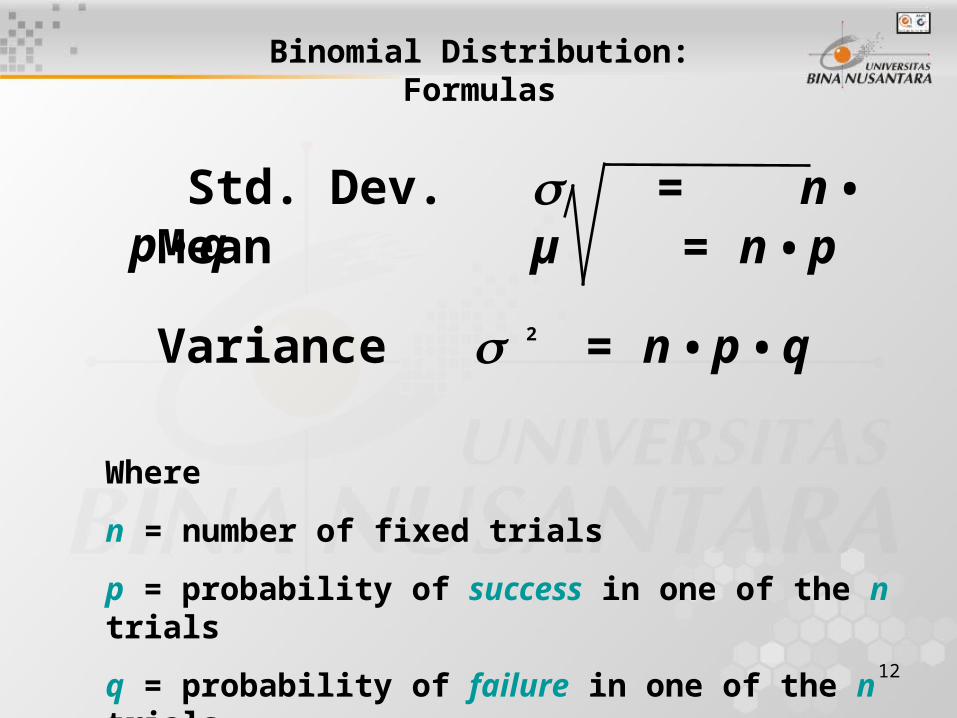
Binomial Distribution:Formulas
Std. Dev. = n • p • q
Where
n = number of fixed trials
p = probability of success in one of the n trials
q = probability of failure in one of the n trials
Mean µ = n • p
Variance 2= n • p • q

13
This scenario is a binomial distribution where:
n = 14
p = 0.5
q = 0.5
Using the binomial distribution formulas:
Example
Find the mean and standard deviation for the number of girls in groups of 14 births.
14
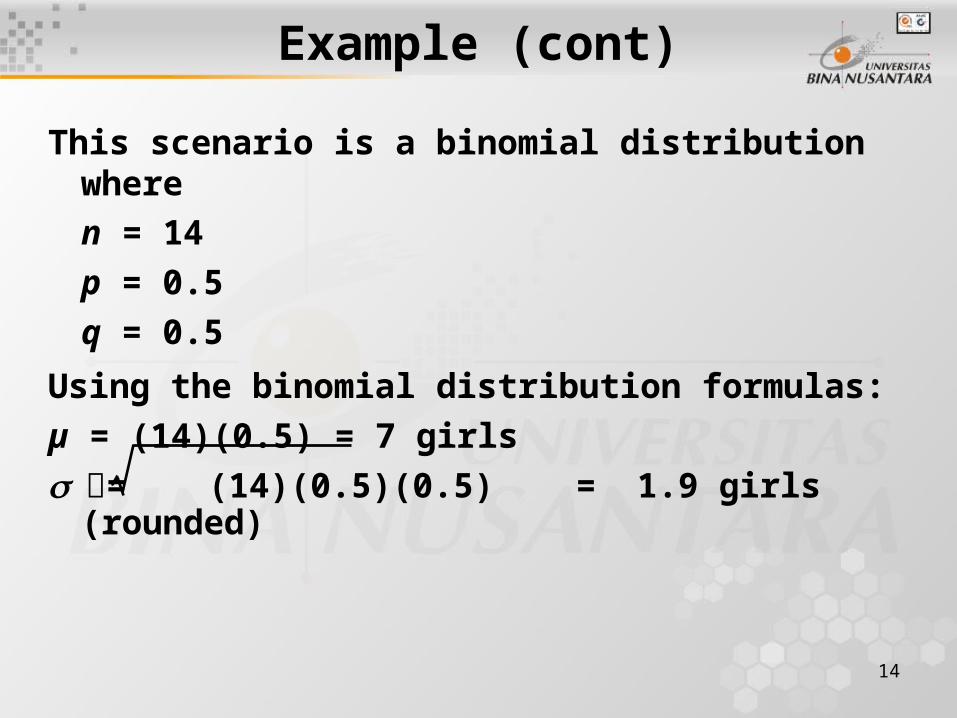
This scenario is a binomial distribution where
n = 14
p = 0.5
q = 0.5
Using the binomial distribution formulas:
µ = (14)(0.5) = 7 girls
= (14)(0.5)(0.5) = 1.9 girls (rounded)
Example (cont)
15
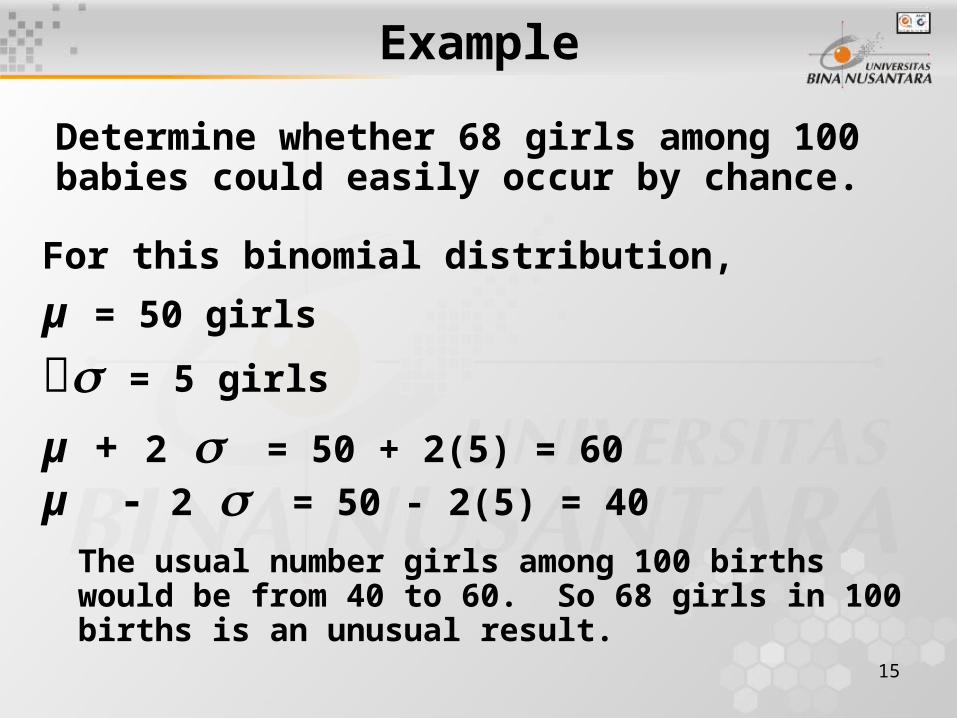
For this binomial distribution,
µ = 50 girls
= 5 girls
µ + 2 = 50 + 2(5) = 60
µ - 2 = 50 - 2(5) = 40
The usual number girls among 100 births would be from 40 to 60. So 68 girls in 100 births is an unusual result.
Example
Determine whether 68 girls among 100 babies could easily occur by chance.

16
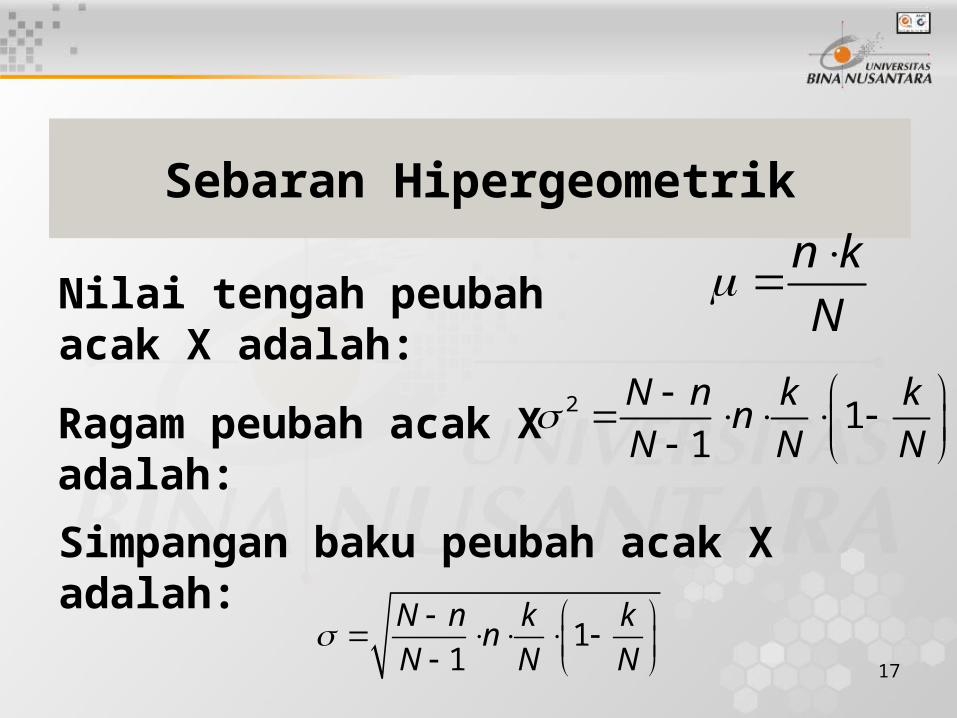
Sebaran Hipergeometrik
Besarnya peluang bagi peubah acak hipergeometrik yang menyatakan banyak keberhasilan dalam contoh acak berukuran n adalah :
n
N
xn
kN
x
k
xXP
0 1 2 untuk x , , , ... ,n
17
Sebaran Hipergeometrik
Nilai tengah peubah acak X adalah:
n k
N
Ragam peubah acak X adalah:
Simpangan baku peubah acak X adalah:
2 11
N n k kn
N N N
11
N n k kn
N N N
18
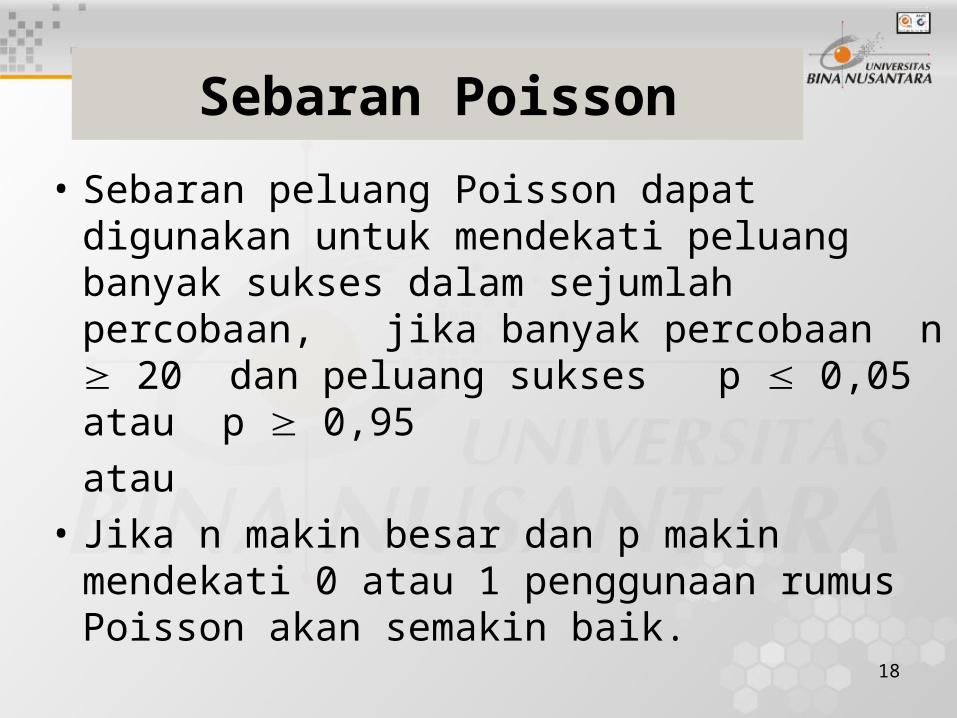
Sebaran Poisson
• Sebaran peluang Poisson dapat digunakan untuk mendekati peluang banyak sukses dalam sejumlah percobaan, jika banyak percobaan n 20 dan peluang sukses p 0,05 atau p 0,95
atau
• Jika n makin besar dan p makin mendekati 0 atau 1 penggunaan rumus Poisson akan semakin baik.
19
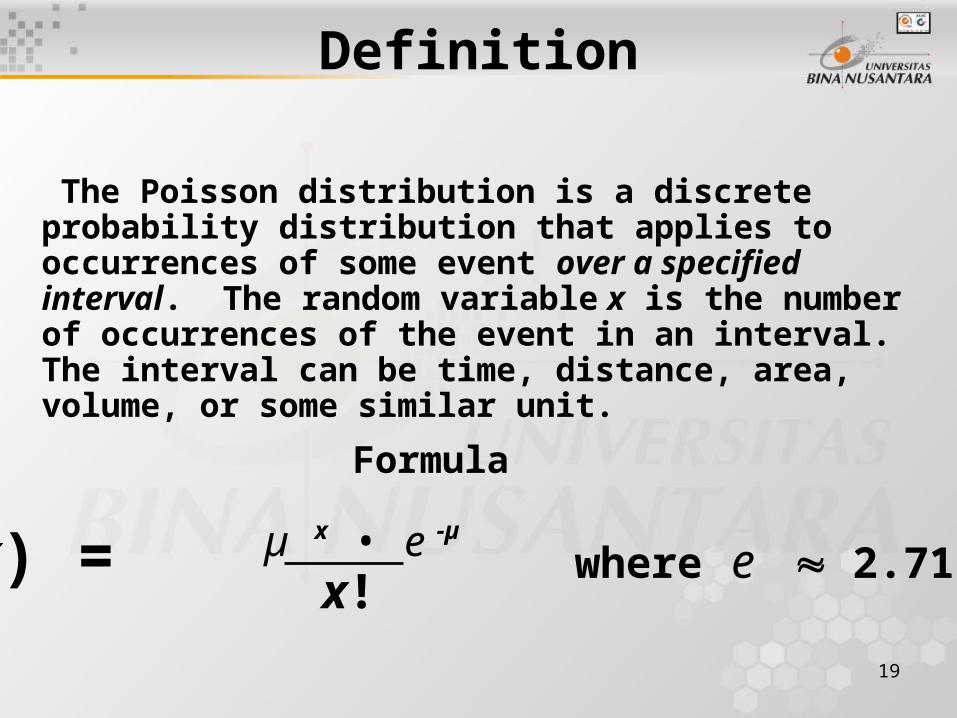
Definition
The Poisson distribution is a discrete probability distribution that applies to occurrences of some event over a specified interval. The random variable x is the number of occurrences of the event in an interval. The interval can be time, distance, area, volume, or some similar unit.
P(x) = where e 2.71828µ x • e -µ
x!
Formula
20
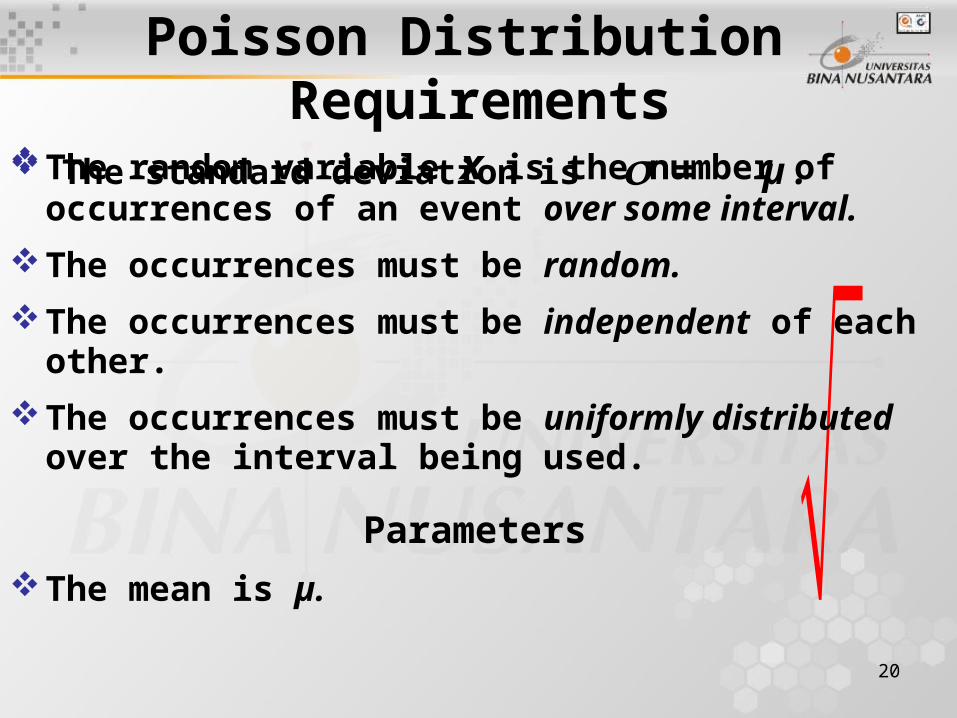
Poisson Distribution Requirements
The standard deviation is = µ .The random variable x is the number of occurrences of an event over some interval.
The occurrences must be random.
The occurrences must be independent of each other.
The occurrences must be uniformly distributed over the interval being used.
Parameters
The mean is µ.
21
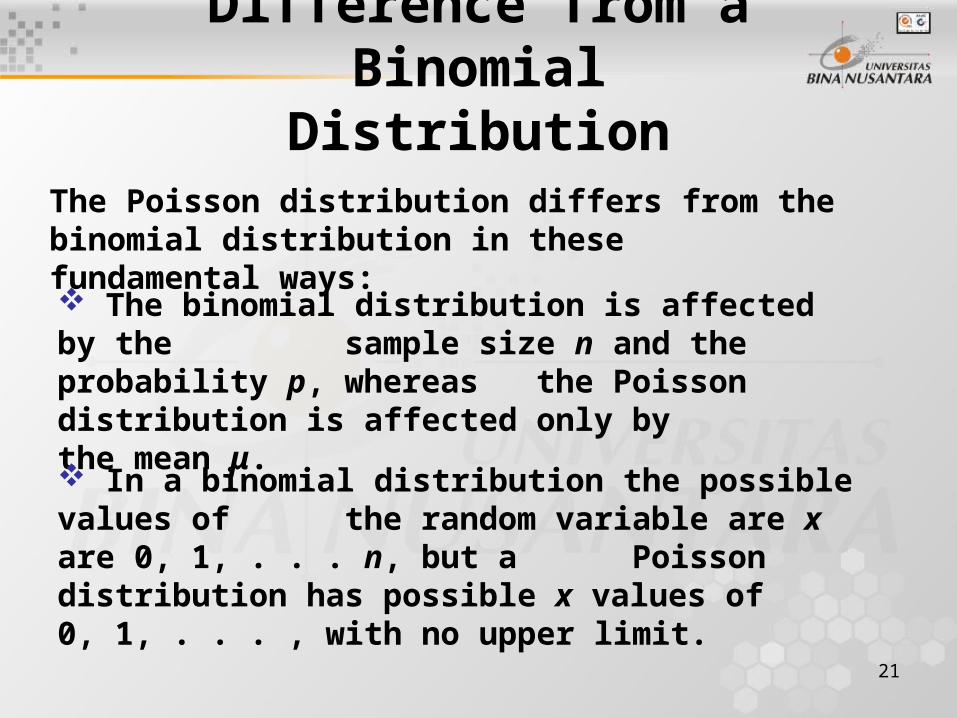
Difference from aBinomial Distribution
The Poisson distribution differs from the binomial distribution in these fundamental ways:
The binomial distribution is affected by the sample size n and the probability p, whereas the Poisson distribution is affected only by the mean μ.
In a binomial distribution the possible values of the random variable are x are 0, 1, . . . n, but a Poisson distribution has possible x values of 0, 1, . . . , with no upper limit.
22
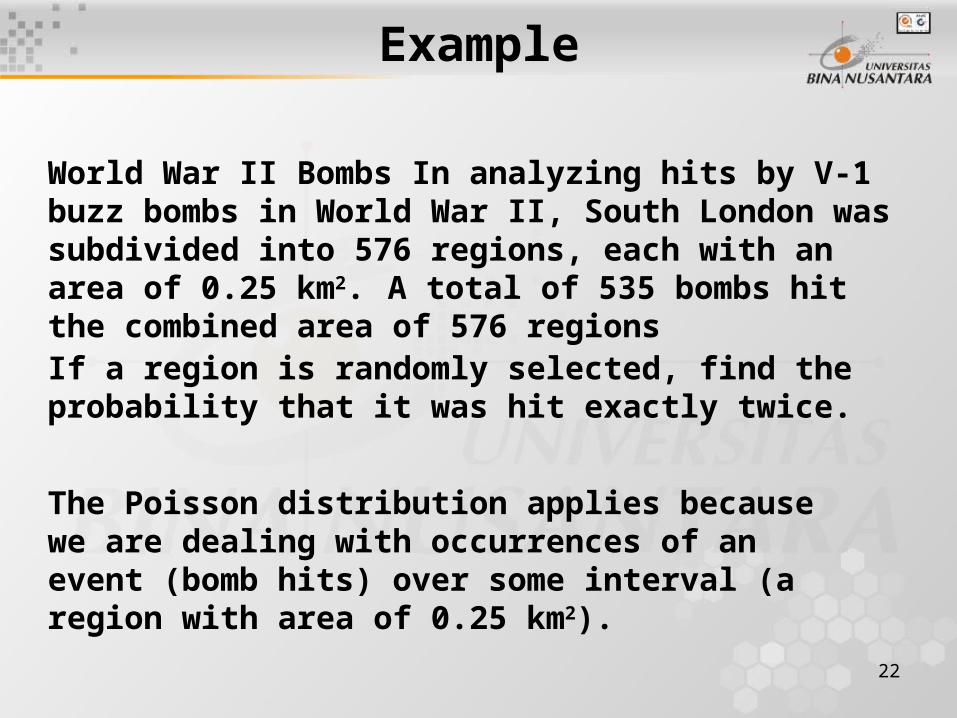
Example
World War II Bombs In analyzing hits by V-1 buzz bombs in World War II, South London was subdivided into 576 regions, each with an area of 0.25 km2. A total of 535 bombs hit the combined area of 576 regions
If a region is randomly selected, find the probability that it was hit exactly twice.
The Poisson distribution applies because we are dealing with occurrences of an event (bomb hits) over some interval (a region with area of 0.25 km2).

23
Example
The mean number of hits per region is
μ number of bomb hits
number of regions
5350.929
576
x
P xxe 2 0.9290.929 2.71828 0.863 0.395
( ) 0.170! 2! 2
The probability of a particular region being hit exactly twice is P(2) = 0.170.
24
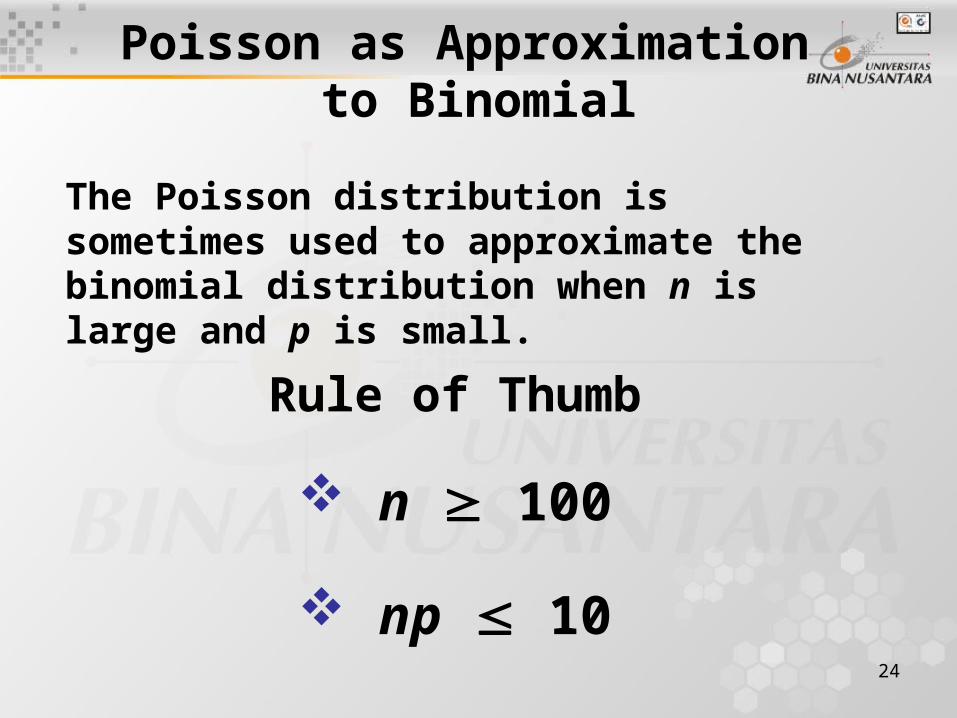
Poisson as Approximation to Binomial
Rule of Thumb
n 100
np 10
The Poisson distribution is sometimes used to approximate the binomial distribution when n is large and p is small.
25
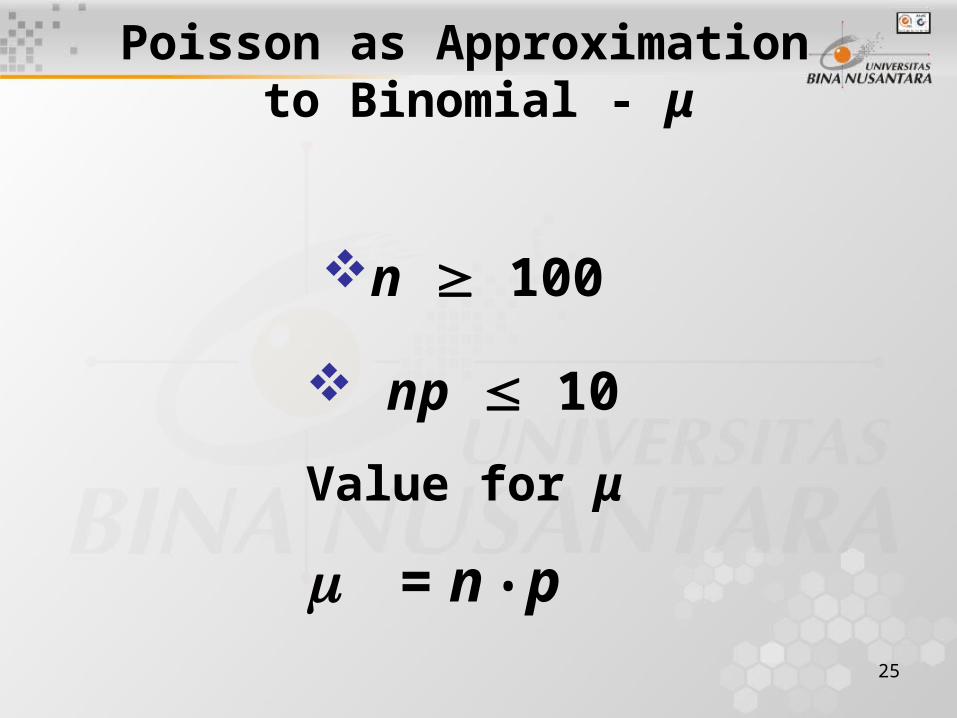
Poisson as Approximation to Binomial - μ
Value for μ
= n • p
n 100
np 10

2626
SELAMAT BELAJAR SEMOGA SUKSES SELALU