1. Performance Highlights 2 CONTENTS - kribhco.net
84
Transcript of 1. Performance Highlights 2 CONTENTS - kribhco.net


1. Performance Highlights 2
2. Growth at a Glance 3
3. Sources and Application of Funds 4
4. Board of Directors 5
5. Financials at a Glance 10
6. Directors’ Report 11
7. Independent Auditors’ Report 32
8. Financial Statements 35
9. Cash Flow Statement 39
CO
NTE
NTS
1

2
Ammonia Production 13.87 Lakh MT
Urea Production 23.53 Lakh MT
Bio-Fertiliser Production (Liquid) 5.76 Lakh Litre
Urea Dispatch (Rail + Road) 23.52 Lakh MT
Urea Sales (KRIBHCO - HAZIRA) 22.50 Lakh MT
Total Urea Sales (KRIBHCO + OMIFCO + KFL + Govt. A/C) 41.18 Lakh MT
Imported DAP Sales (KRIBHCO + KFL) 4.17 Lakh MT
Bio-Fertilisers Sale (Liquid) 5.76 Lakh Litre
PERFORMANCE HIGHLIGHTS

3
GROWTH AT A GLANCE
( ` in crore)
2016-2017 2015-2016 2014-2015 2013-2014 2012-2013 2011-2012 2010-2011 2009-2010 2008-2009 2007-2008
EARNINGS
Sales 3,027.61 3,282.00 2,552.03 2,558.28 2,206.54 2,131.84 2,073.44 1,637.39 1,512.40 1,385.62
Concession/ Remuneration from Govt. of India 3,572.13 4,079.45 3,125.52 2,495.91 2,031.08 1,548.35 1,543.47 959.69 1,046.72 844.79
Other Revenue 80.59 167.69 72.43 209.83 316.42 333.78 228.24 304.78 409.75 266.56
6,680.33 7,529.14 5,749.98 5,264.02 4,554.04 4,013.97 3,845.15 2,901.86 2,968.87 2,496.97
OUTGOINGS
Raw Material, Packing, Stores, Power, Fuel, etc. 3,183.62 3,575.79 3,067.52 2,480.54 1,834.45 975.10 1,341.61 966.46 1,501.74 1,111.16
Purchases - Fertilisers, Seeds & Chemicals 2,015.88 2,231.21 1,294.90 1,345.87 1,251.56 2,045.77 1,569.82 916.29 527.07 454.50
Changes in Inventory (Accretion/Decretion) (393.32) (138.94) 46.87 (46.70) (7.21) (37.22) (50.50) 38.20 58.90 36.77
Employees' Remuneration & Benefits 345.20 323.21 300.98 304.79 281.22 238.09 241.31 224.89 169.66 173.40
Other Expenses (including Net Prior Period Income/Expenditure) 1,013.90 942.00 703.93 734.86 622.08 517.54 473.28 467.45 404.25 420.89
Finance Cost 225.21 219.70 178.60 162.14 113.68 49.21 8.89 5.18 10.38 5.32
Depreciation 99.24 101.26 105.18 100.01 93.38 33.32 30.48 30.62 27.53 22.79
6,489.73 7,254.23 5,697.98 5,081.51 4,189.16 3,821.81 3,614.89 2,649.09 2,699.53 2,224.83
PROFIT BEFORE TAX 190.60 274.91 52.00 182.51 364.88 192.16 230.26 252.77 269.34 272.14
Provision for Taxation (Net) 69.12 86.56 28.12 60.58 69.33 15.40 29.71 24.60 19.21 62.94
PROFIT AFTER TAX 121.48 188.35 23.88 121.93 295.55 176.76 200.55 228.17 250.13 209.20
Amount Transferred to/from Div. Equalisation Fund - 25.00 (43.78) - - - - - - -
Dividend Payout 58.46 77.85 58.47 73.06 78.03 78.01 69.29 77.67 71.28 79.20
Contribution to Cooperative Education Fund 1.21 1.63 0.24 1.22 2.95 1.77 2.00 2.28 2.47 1.84
Donations 0.40 0.40 0.40 0.40 0.40 0.40 0.40 0.40 0.40 0.40
RETAINED PROFIT 61.41 83.47 8.55 47.25 214.17 96.58 128.86 147.82 175.98 127.76
4
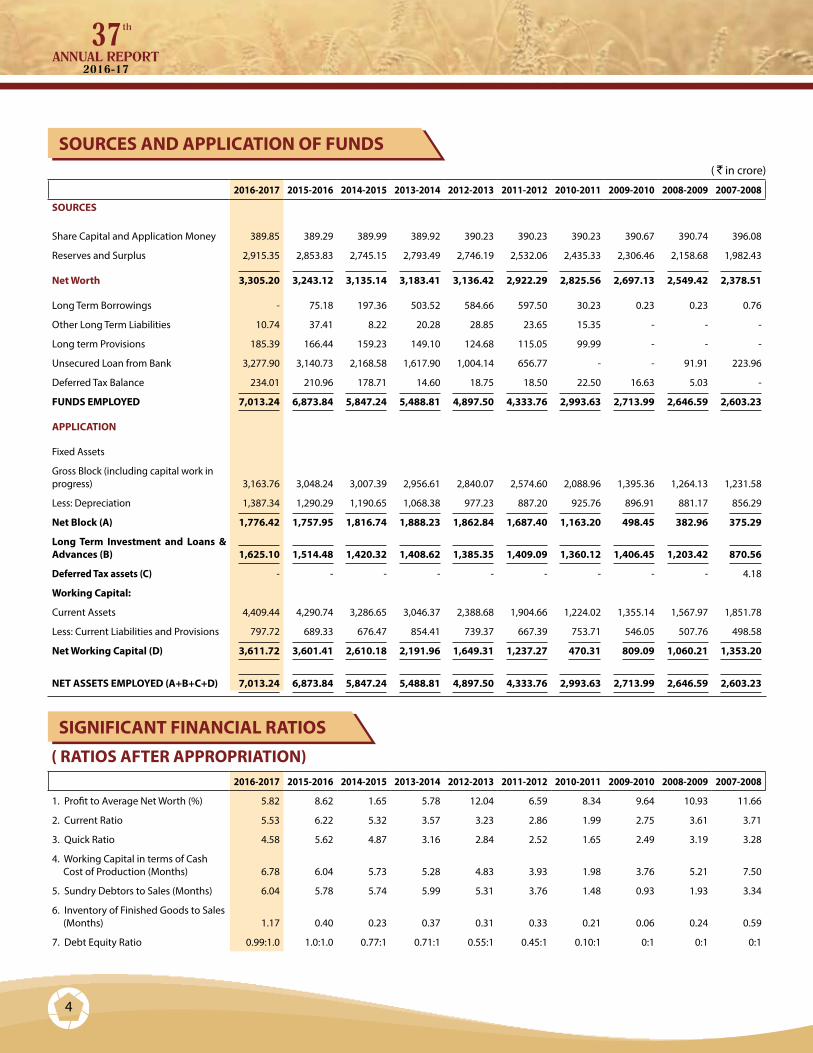
SOURCES AND APPLICATION OF FUNDS
SIGNIFICANT FINANCIAL RATIOS
( ` in crore)
2016-2017 2015-2016 2014-2015 2013-2014 2012-2013 2011-2012 2010-2011 2009-2010 2008-2009 2007-2008
SOURCES
Share Capital and Application Money 389.85 389.29 389.99 389.92 390.23 390.23 390.23 390.67 390.74 396.08
Reserves and Surplus 2,915.35 2,853.83 2,745.15 2,793.49 2,746.19 2,532.06 2,435.33 2,306.46 2,158.68 1,982.43
Net Worth 3,305.20 3,243.12 3,135.14 3,183.41 3,136.42 2,922.29 2,825.56 2,697.13 2,549.42 2,378.51
Long Term Borrowings - 75.18 197.36 503.52 584.66 597.50 30.23 0.23 0.23 0.76
Other Long Term Liabilities 10.74 37.41 8.22 20.28 28.85 23.65 15.35 - - -
Long term Provisions 185.39 166.44 159.23 149.10 124.68 115.05 99.99 - - -
Unsecured Loan from Bank 3,277.90 3,140.73 2,168.58 1,617.90 1,004.14 656.77 - - 91.91 223.96
Deferred Tax Balance 234.01 210.96 178.71 14.60 18.75 18.50 22.50 16.63 5.03 -
FUNDS EMPLOYED 7,013.24 6,873.84 5,847.24 5,488.81 4,897.50 4,333.76 2,993.63 2,713.99 2,646.59 2,603.23
APPLICATION
Fixed Assets
Gross Block (including capital work in progress) 3,163.76 3,048.24 3,007.39 2,956.61 2,840.07 2,574.60 2,088.96 1,395.36 1,264.13 1,231.58
Less: Depreciation 1,387.34 1,290.29 1,190.65 1,068.38 977.23 887.20 925.76 896.91 881.17 856.29
Net Block (A) 1,776.42 1,757.95 1,816.74 1,888.23 1,862.84 1,687.40 1,163.20 498.45 382.96 375.29
Long Term Investment and Loans & Advances (B) 1,625.10 1,514.48 1,420.32 1,408.62 1,385.35 1,409.09 1,360.12 1,406.45 1,203.42 870.56
Deferred Tax assets (C) - - - - - - - - - 4.18
Working Capital:
Current Assets 4,409.44 4,290.74 3,286.65 3,046.37 2,388.68 1,904.66 1,224.02 1,355.14 1,567.97 1,851.78
Less: Current Liabilities and Provisions 797.72 689.33 676.47 854.41 739.37 667.39 753.71 546.05 507.76 498.58
Net Working Capital (D) 3,611.72 3,601.41 2,610.18 2,191.96 1,649.31 1,237.27 470.31 809.09 1,060.21 1,353.20
NET ASSETS EMPLOYED (A+B+C+D) 7,013.24 6,873.84 5,847.24 5,488.81 4,897.50 4,333.76 2,993.63 2,713.99 2,646.59 2,603.23
( RATIOS AFTER APPROPRIATION)2016-2017 2015-2016 2014-2015 2013-2014 2012-2013 2011-2012 2010-2011 2009-2010 2008-2009 2007-2008
1. Profit to Average Net Worth (%) 5.82 8.62 1.65 5.78 12.04 6.59 8.34 9.64 10.93 11.66
2. Current Ratio 5.53 6.22 5.32 3.57 3.23 2.86 1.99 2.75 3.61 3.71
3. Quick Ratio 4.58 5.62 4.87 3.16 2.84 2.52 1.65 2.49 3.19 3.28
4. Working Capital in terms of Cash Cost of Production (Months) 6.78 6.04 5.73 5.28 4.83 3.93 1.98 3.76 5.21 7.50
5. Sundry Debtors to Sales (Months) 6.04 5.78 5.74 5.99 5.31 3.76 1.48 0.93 1.93 3.34
6. Inventory of Finished Goods to Sales (Months) 1.17 0.40 0.23 0.37 0.31 0.33 0.21 0.06 0.24 0.59
7. Debt Equity Ratio 0.99:1.0 1.0:1.0 0.77:1 0.71:1 0.55:1 0.45:1 0.10:1 0:1 0:1 0:1
5
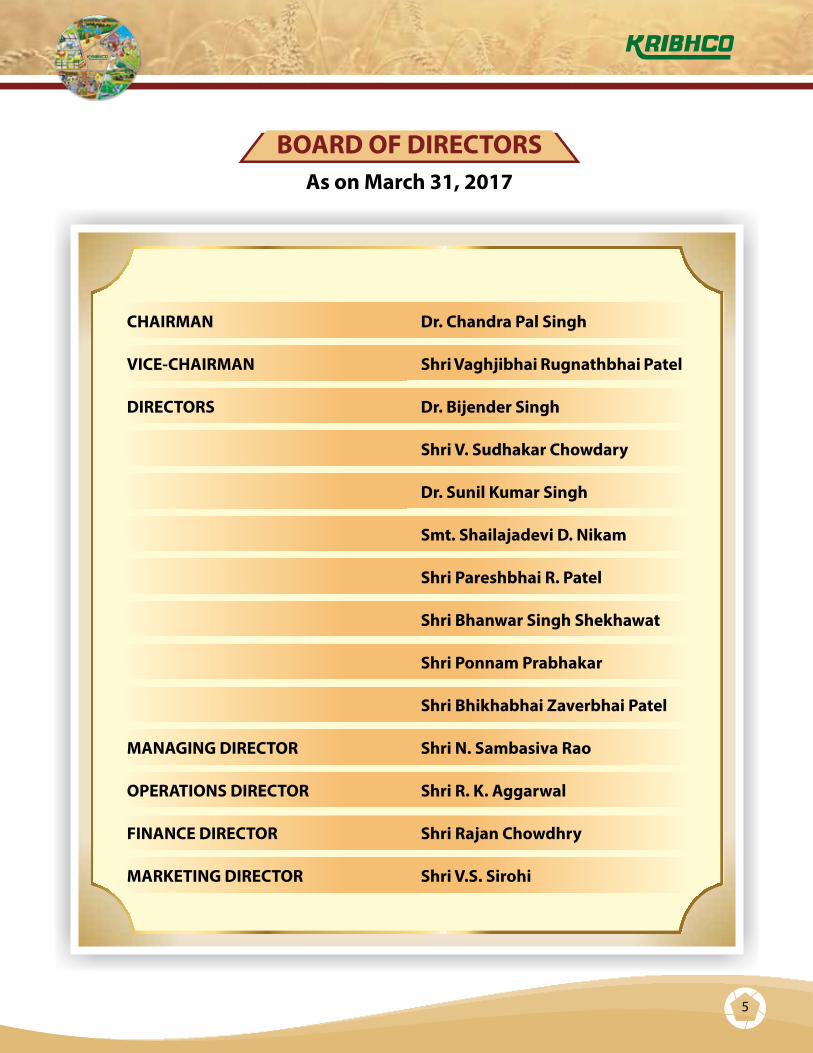
BOARD OF DIRECTORSAs on March 31, 2017
CHAIRMAN Dr. Chandra Pal Singh
VICE-CHAIRMAN Shri Vaghjibhai Rugnathbhai Patel
DIRECTORS Dr. Bijender Singh
Shri V. Sudhakar Chowdary
Dr. Sunil Kumar Singh
Smt. Shailajadevi D. Nikam
Shri Pareshbhai R. Patel
Shri Bhanwar Singh Shekhawat
Shri Ponnam Prabhakar
Shri Bhikhabhai Zaverbhai Patel
MANAGING DIRECTOR Shri N. Sambasiva Rao
OPERATIONS DIRECTOR Shri R. K. Aggarwal
FINANCE DIRECTOR Shri Rajan Chowdhry
MARKETING DIRECTOR Shri V.S. Sirohi
6
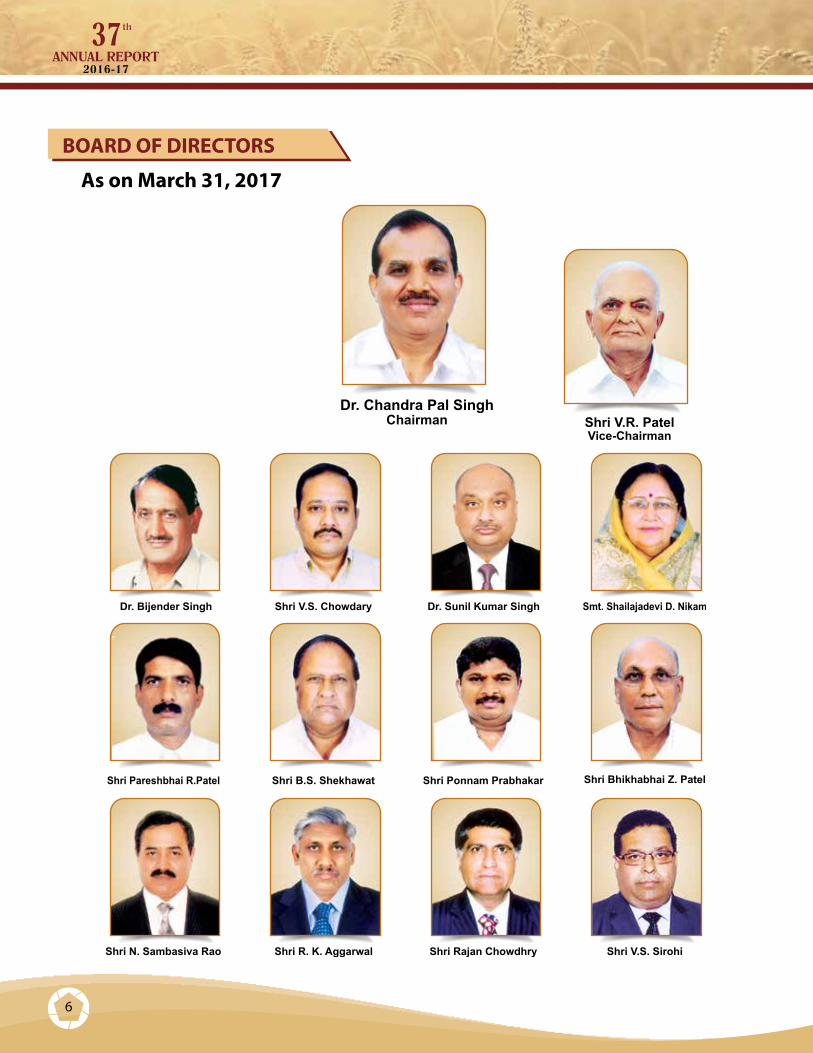
As on March 31, 2017
BOARD OF DIRECTORS
7
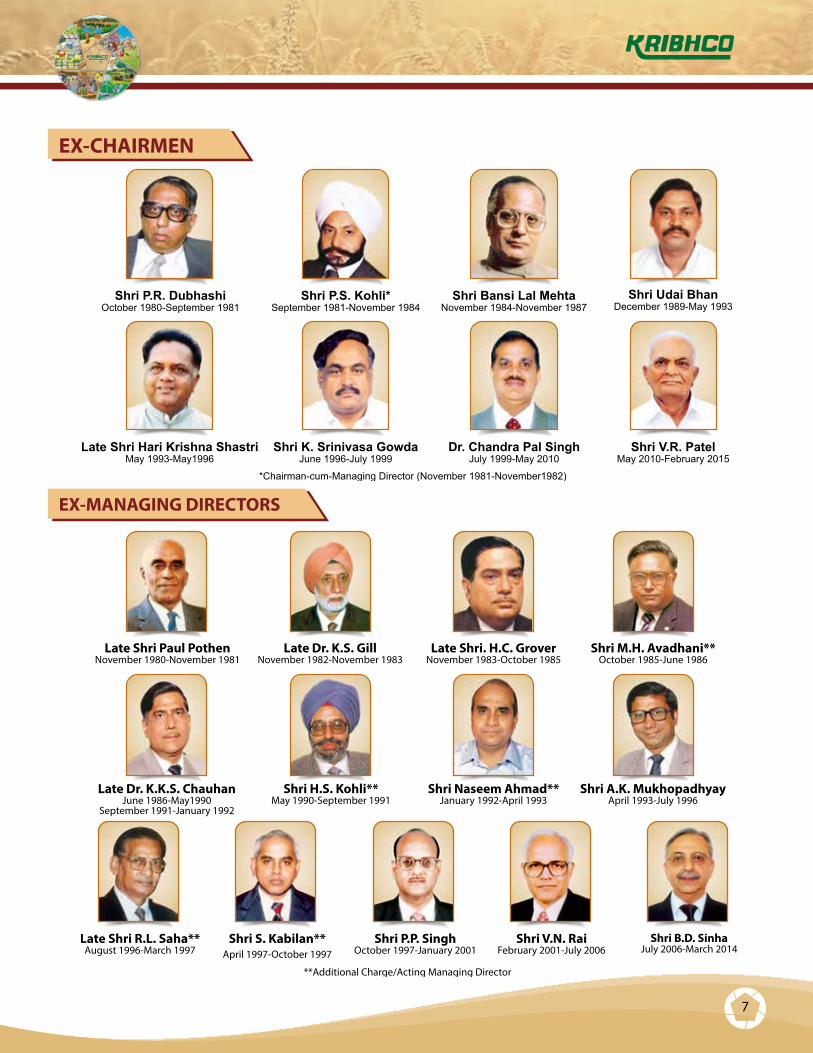
EX-CHAIRMEN
EX-MANAGING DIRECTORS
8
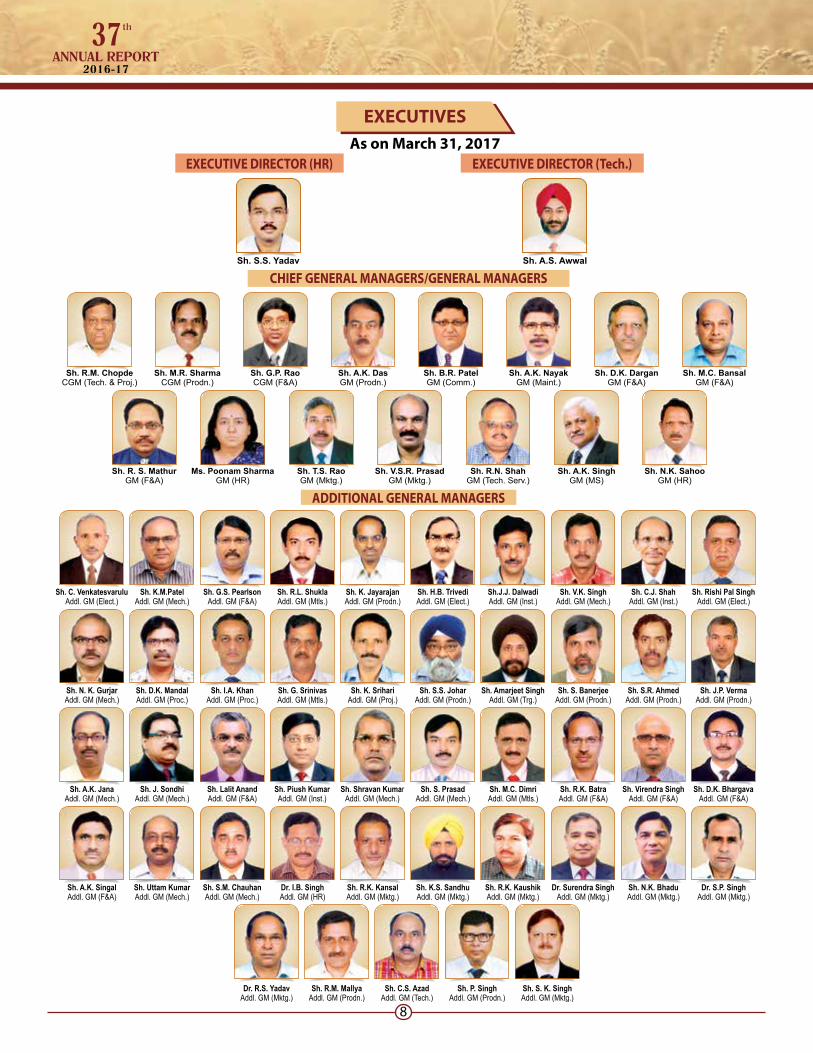
As on March 31, 2017
EXECUTIVES
EXECUTIVE DIRECTOR (HR)
CHIEF GENERAL MANAGERS/GENERAL MANAGERS
ADDITIONAL GENERAL MANAGERS
EXECUTIVE DIRECTOR (Tech.)

9
As on March 31, 2017
EXECUTIVES
CORPORATE OFFICE
HAZIRA COMPLEX
MARKETING DIVISION
MAIN BANKERS REGISTERED OFFICE CORPORATE OFFICE PLANT OFFICE
JOINT STATUTORY AUDITORS
Shri Sanjeev Kumar Dy. General Manager (HR)
Shri Vinay Kumar SinghDy. General Manager (Prodn.)
Shri Avinash M BhaleraoDy. General Manager (MS)
Shri Anil P. DesaiDy. General Manager (Prodn.)
Shri Swadheen Kumar MahapatraDy. General Manager (Prodn.)
Shri Shantilal Tulshibhai MakwanaDy. General Manager (Proj.)
Shri Upendra KumarDy. General Manager (Prodn.)
Shri Devjit SinghDy. General Manager (F&A)
M/s S.S. Kothari Mehta & Co.Chartered Accountants146-148, Tribhuvan Complex Ishwar Nagar, Mathura RoadNew Delhi-110 065
State Bank of IndiaHDFC BankSaraswat BankICICI Bank.
A-60Kailash ColonyNew Delhi - 110 048
KRIBHCO BhawanA8-10, Sector-1, Noida-201 301Distt. Gautam Budh Nagar (U.P.)
P. O. KRIBHCO Nagar,Distt. Surat-394 515,Gujarat
Shri Anup Kumar PandeyDy. General Manager (Mktg.)
Shri Shamsher Singh RanaDy. General Manager (Mktg.)
M/s V. Sankar Aiyar & Co.Chartered Accountants202-301, Satyam Cinema Complex Ranjit Nagar Community CentreNew Delhi-110 008
M/s G. K. Choksi & Co.Chartered Accountants207, Tolstoy House, Tolstoy Marg, JanpathNew Delhi-110 001

10
FINANCIALS AT A GLANCE

11
DIRECTOR’S REPORT
Dear Cooperators,
The Directors of the Society take this opportunity of presenting to you the Thirty Seventh Annual Report and the Audited Statement of Accounts of your Society for the Financial Year 2016-17 and the programme of activities for the year 2017-18 for your approval.
The year 2016-17 has been a challenging year, not only for the Society but also for the entire Fertilizer Industry. The Urea and DAP sales were adversely affected and decreased on all India basis. Although, the total area sown during the year 2016-17 was more than the previous year, the rainfall pattern was erratic and marginally deficient in some
parts of India leading to reduction in urea sales by 7% than the previous year and higher inventories of Urea. However, your Society was able to maintain its second place in Urea Sales in the country with marginally increased market share from the previous year.
Delay in payments of subsidy by GOI further added financial stress leading to higher borrowing for working capital and higher interest cost on working capital. Lower sales, higher inventory carrying and interest cost adversely affected your Society’s profitability.
Board of Directors, KRIBHCO, addressing 36th AGM held on 22nd September, 2016 in New Delhi.
36th AGM...Dr. Chandra Pal Singh
ChairmanKRIBHCO, addressing the RGB delegates
in 36th AGM
12
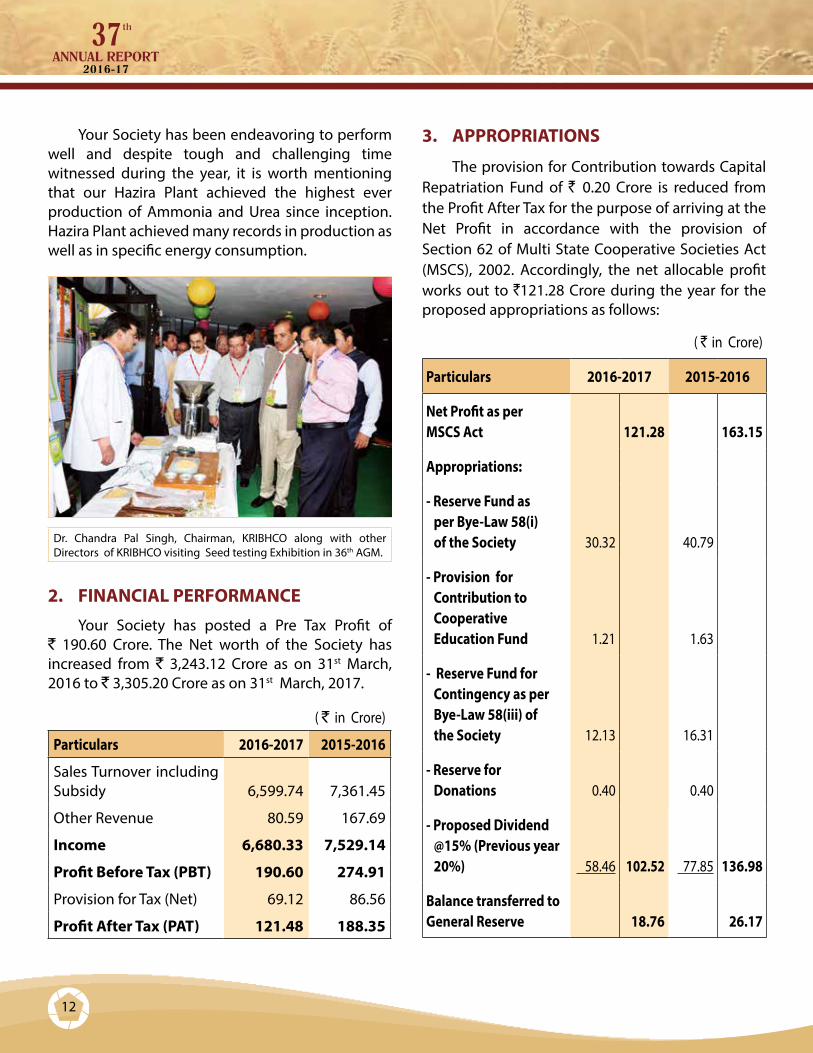
Your Society has been endeavoring to perform well and despite tough and challenging time witnessed during the year, it is worth mentioning that our Hazira Plant achieved the highest ever production of Ammonia and Urea since inception. Hazira Plant achieved many records in production as well as in specific energy consumption.
Dr. Chandra Pal Singh, Chairman, KRIBHCO along with other Directors of KRIBHCO visiting Seed testing Exhibition in 36th AGM.
2. FINANCIAL PERFORMANCE Your Society has posted a Pre Tax Profit of ` 190.60 Crore. The Net worth of the Society has increased from ` 3,243.12 Crore as on 31st March, 2016 to ` 3,305.20 Crore as on 31st March, 2017.
( ` in Crore)
Particulars 2016-2017 2015-2016
Sales Turnover including Subsidy 6,599.74 7,361.45
Other Revenue 80.59 167.69
Income 6,680.33 7,529.14
Profit Before Tax (PBT) 190.60 274.91
Provision for Tax (Net) 69.12 86.56
Profit After Tax (PAT) 121.48 188.35
3. APPROPRIATIONS
The provision for Contribution towards Capital Repatriation Fund of ` 0.20 Crore is reduced from the Profit After Tax for the purpose of arriving at the Net Profit in accordance with the provision of Section 62 of Multi State Cooperative Societies Act (MSCS), 2002. Accordingly, the net allocable profit works out to `121.28 Crore during the year for the proposed appropriations as follows:
( ` in Crore)
Particulars 2016-2017 2015-2016
Net Profit as per MSCS Act 121.28 163.15
Appropriations:
- Reserve Fund as per Bye-Law 58(i) of the Society 30.32 40.79
- Provision for Contribution to Cooperative Education Fund 1.21 1.63
- Reserve Fund for Contingency as per Bye-Law 58(iii) of the Society 12.13 16.31
- Reserve for Donations 0.40 0.40
- Proposed Dividend @15% (Previous year 20%) 58.46 102.52 77.85 136.98
Balance transferred to General Reserve 18.76 26.17
13
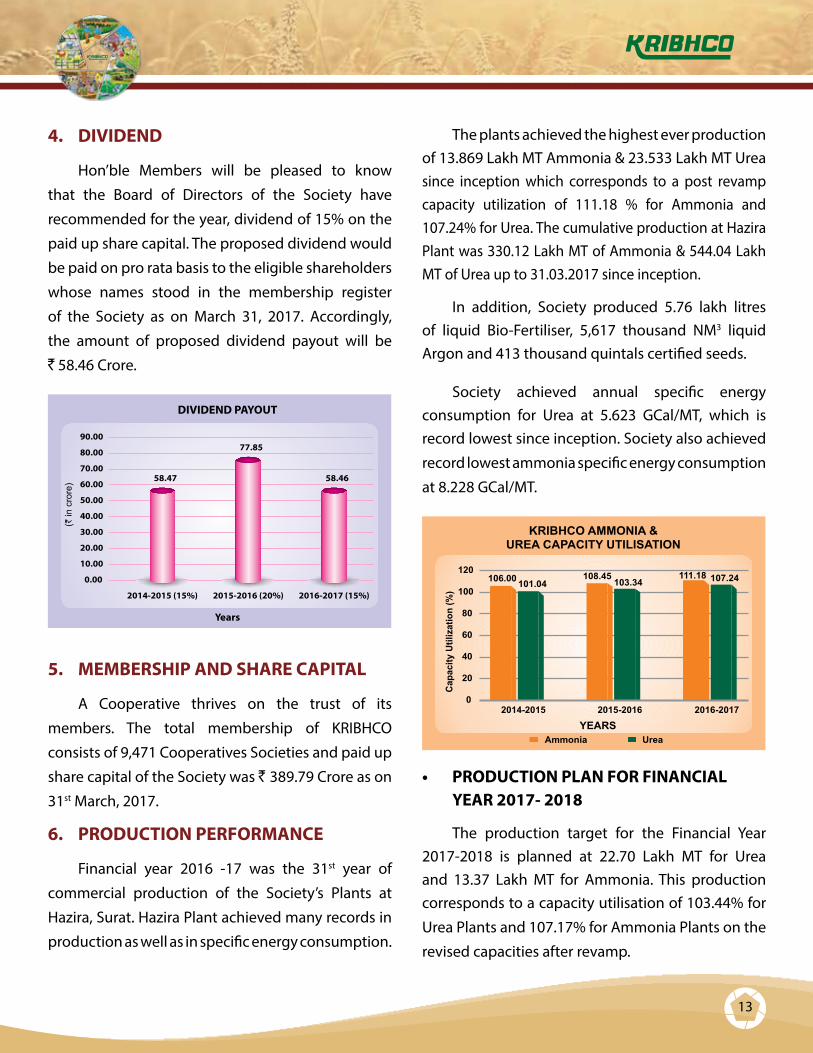
4. DIVIDEND
Hon’ble Members will be pleased to know
that the Board of Directors of the Society have
recommended for the year, dividend of 15% on the
paid up share capital. The proposed dividend would
be paid on pro rata basis to the eligible shareholders
whose names stood in the membership register
of the Society as on March 31, 2017. Accordingly,
the amount of proposed dividend payout will be
` 58.46 Crore.
5. MEMBERSHIP AND SHARE CAPITAL
A Cooperative thrives on the trust of its
members. The total membership of KRIBHCO
consists of 9,471 Cooperatives Societies and paid up
share capital of the Society was ` 389.79 Crore as on
31st March, 2017.
6. PRODUCTION PERFORMANCE
Financial year 2016 -17 was the 31st year of
commercial production of the Society’s Plants at
Hazira, Surat. Hazira Plant achieved many records in
production as well as in specific energy consumption.
The plants achieved the highest ever production of 13.869 Lakh MT Ammonia & 23.533 Lakh MT Urea since inception which corresponds to a post revamp capacity utilization of 111.18 % for Ammonia and 107.24% for Urea. The cumulative production at Hazira Plant was 330.12 Lakh MT of Ammonia & 544.04 Lakh MT of Urea up to 31.03.2017 since inception.
In addition, Society produced 5.76 lakh litres of liquid Bio-Fertiliser, 5,617 thousand NM3 liquid Argon and 413 thousand quintals certified seeds.
Society achieved annual specific energy consumption for Urea at 5.623 GCal/MT, which is record lowest since inception. Society also achieved
record lowest ammonia specific energy consumption
at 8.228 GCal/MT.
• PRODUCTION PLAN FOR FINANCIAL YEAR 2017- 2018
The production target for the Financial Year 2017-2018 is planned at 22.70 Lakh MT for Urea and 13.37 Lakh MT for Ammonia. This production corresponds to a capacity utilisation of 103.44% for
Urea Plants and 107.17% for Ammonia Plants on the
revised capacities after revamp.
14
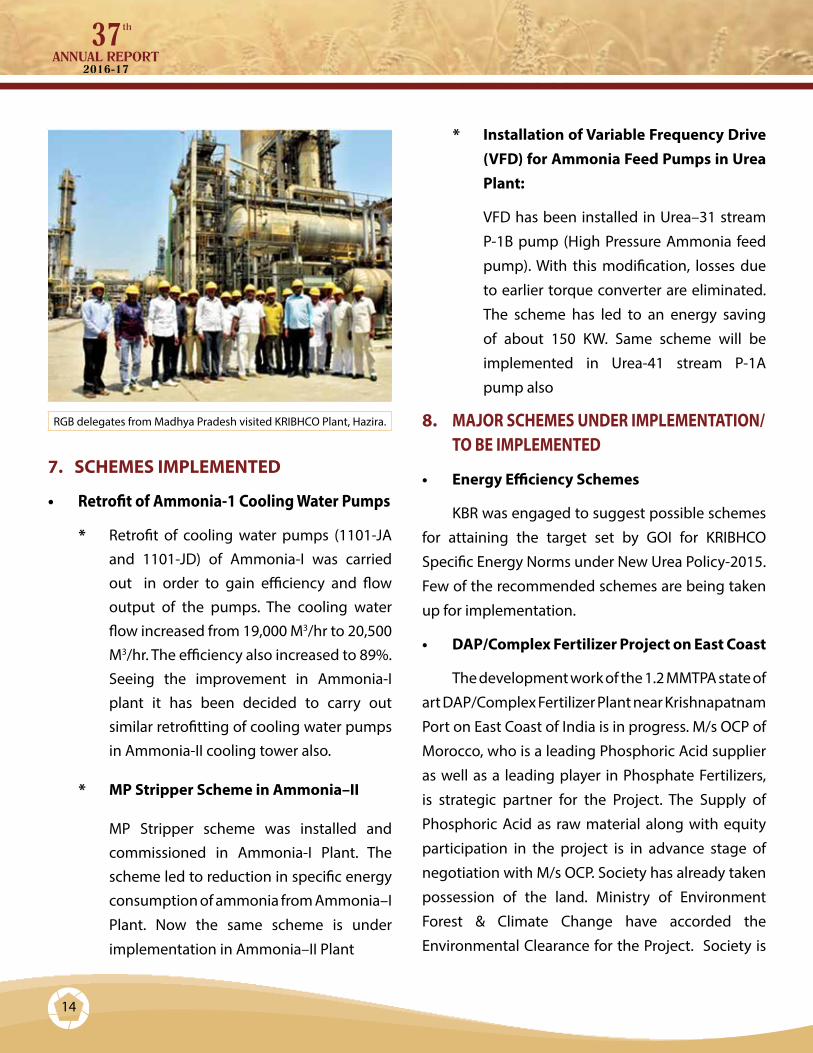
RGB delegates from Madhya Pradesh visited KRIBHCO Plant, Hazira.
7. SCHEMES IMPLEMENTED
• Retrofit of Ammonia-1 Cooling Water Pumps
* Retrofit of cooling water pumps (1101-JA and 1101-JD) of Ammonia-I was carried out in order to gain efficiency and flow output of the pumps. The cooling water flow increased from 19,000 M3/hr to 20,500 M3/hr. The efficiency also increased to 89%. Seeing the improvement in Ammonia-I plant it has been decided to carry out similar retrofitting of cooling water pumps in Ammonia-II cooling tower also.
* MP Stripper Scheme in Ammonia–II
MP Stripper scheme was installed and commissioned in Ammonia-I Plant. The scheme led to reduction in specific energy consumption of ammonia from Ammonia–I
Plant. Now the same scheme is under
implementation in Ammonia–II Plant
* Installation of Variable Frequency Drive (VFD) for Ammonia Feed Pumps in Urea Plant:
VFD has been installed in Urea–31 stream
P-1B pump (High Pressure Ammonia feed
pump). With this modification, losses due
to earlier torque converter are eliminated.
The scheme has led to an energy saving
of about 150 KW. Same scheme will be
implemented in Urea-41 stream P-1A
pump also
8. MAJOR SCHEMES UNDER IMPLEMENTATION/ TO BE IMPLEMENTED
• EnergyEfficiencySchemes
KBR was engaged to suggest possible schemes
for attaining the target set by GOI for KRIBHCO
Specific Energy Norms under New Urea Policy-2015.
Few of the recommended schemes are being taken
up for implementation.
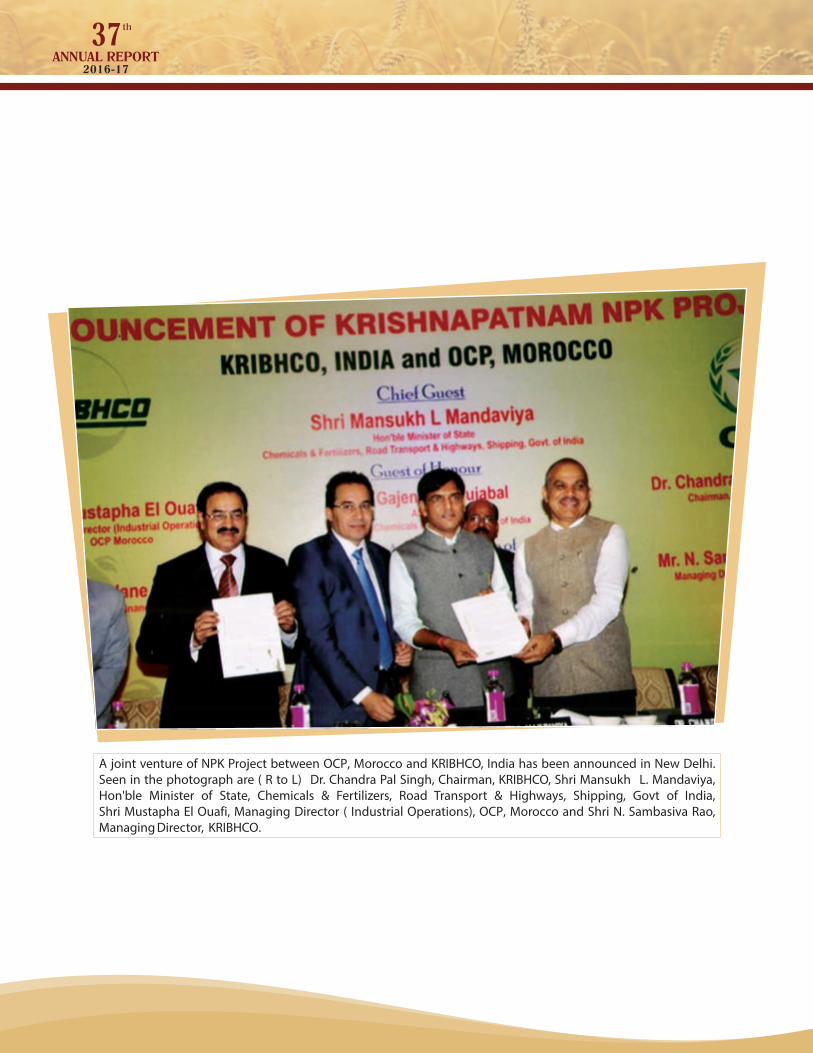
• DAP/ComplexFertilizerProjectonEastCoast
The development work of the 1.2 MMTPA state of
art DAP/Complex Fertilizer Plant near Krishnapatnam
Port on East Coast of India is in progress. M/s OCP of
Morocco, who is a leading Phosphoric Acid supplier
as well as a leading player in Phosphate Fertilizers,
is strategic partner for the Project. The Supply of
Phosphoric Acid as raw material along with equity
participation in the project is in advance stage of
negotiation with M/s OCP. Society has already taken
possession of the land. Ministry of Environment
Forest & Climate Change have accorded the
Environmental Clearance for the Project. Society is

15
in the process of selection of EPC Contractor who
will implement the project on Lump Sum Turn Key
mode.
9. SAFETY MANAGEMENT
The safety setup of KRIBHCO Hazira Plant has
been established with a vision to achieve its slogan
“SAFETY FIRST; PRODUCTION MUST.” KRIBHCO
considers the field of Safety, Health and Environment
(SHE) an utmost priority. KRIBHCO has incorporated
ISO 9001-2008, and integrated ISO 14001 & ISO
18000 Management Systems as an integral part of
its operations. KRIBHCO has separate departments
to look into the safety, health and the environment
aspects respectively. Your Society has full-fledged
Fire Station at Hazira Plant.
Periodical Audits are conducted by Internal
& External Auditors of Integrated Management
System (IMS). Specialized 3rd party Safety Audit,
Risk Assessment, Hazard & Operability analysis is
conducted periodically by Gujarat Safety Council.
State- of - art automatic and manual fire and toxic
gas alarm and gas detection system are kept in
healthy mode. On Site and Off-site Emergency Drills
are conducted regularly. The Year 2016 was the third
consecutive accident free year.
A mutual aid scheme has been developed
amongst nearby industries i.e. Reliance Industries,
Essar Steel, ONGC, and GSEG. Major emergency
exercises are carried out once in a year.
10. ENVIRONMENTAL PROTECTION
Your Society is highly concerned with the
environmental impact of its operations and its
products and through the use of best available
technology and adoption of sustainable practices
endeavors to minimize the impact. Society has
implemented ISO 14001 certified Environmental
Management System to ensure continual
improvement of organization on environmental
front. Considering the importance of water
conservation, the Society has implemented various
recycle/ re-uses schemes for water conservation.
Tertiary treated water is being re-used as cooling
tower make up. Deep hydrolyser was installed in
Urea plant to re-use the effluent as boiler feed water
after treatment. A number of energy efficient and
pollution abatement projects have recently been
commissioned.
Continuous efforts are being made to check the
emission of pollutants in air. Wet de-dusting system
at Prilling tower top has been installed to restrict
the Urea dust. Emissions from all the stacks are well
below the prescribed limits. Six ambient air quality-
monitoring stations have been set up within a radius
of 10 km from our complex for periodic monitoring
of air quality in surrounding area.
The Society has undertaken afforestation by
planting trees of different species every year in order
to improve the ambient air quality. Lush green lawns
are also developed in an area of 100 acres. More so,
a demonstration farm in an area of 41 acres has also
been developed.
11. FERTILIZER POLICY
Government has notified the New Urea
Policy-2015 effective from 01.06.2015 under which
the existing pre-set energy norm of 5.952 Gcal/MT
16
for urea fixed for KRIBHCO have been revised to 5.5
Gcal/MT for urea w.e.f 01.04.2018. Many Fertilizer
Units including your Society has requested the
Government for amendment of New Urea Policy –
2015 to address their concerns
Non-implementation of G o v e r n m e n t
Notification dated 02.04.2014 on revision of fixed
cost for the Financial Year 2014-15 to 2016-17 has
adversely affected the liquidity.
12. MARKETING
12.1 WEATHER CONDITIONS DURING 2016-17
The main rainfall season (South West
Monsoon) was marginally below normal i.e. 97%
of Long Period Average (LPA) for the country as
a whole. The deficit was around 3% of its LPA i.e.
862.0 mm as against normal of 887.5 mm. Out of the
total 36 meteorological subdivisions, 4 subdivisions
received excess season rainfall and 23 subdivisions
received normal season rainfall and the remaining
9 subdivisions received deficit rainfall. The deficient
subdivisions are Kerala (-34%), Assam & Meghalaya
(-30%), Punjab (-28%), Haryana (-27%), Gujarat
(-24%), Himachal Pradesh (-24%), South Interior
Karnataka (-24%), Coastal Karnataka (-21%) and
Lakshadweep (-26%).
The cumulative rainfall in the country during
the Post Monsoon Season (October-December) was
45% lower than Long Period Average (LPA) i.e. 69.7
mm as against normal of 127.2 mm. The cumulative
Winter Rainfall (January-February) was lower by 5%
than its LPA i.e. 39.3 mm as against normal of 41.4 mm.
As per the estimates, total food grain production for
2016-17 was expected to be 271.98 million tonnes as
compared to previous best of 265.04 million tonnes
during 2013-14, despite deficit monsoon for three
straight years.
12.2 FERTILIZER SCENERIO IN THE COUNTRY
As per the iFMS Data, there was a downward
trend in the sales of major fertilizers except MOP.
This can largely be attributed to deficit monsoon in
the country. Fertilizer industry witnessed decrease
in Urea sales with a total sales volume of 296.07 Lakh
MT in the country, as compared to 319.73 Lakh MT
during 2015-16, which is around lower by 7.4% over
last year. DAP sales was 88.19 Lakh MT as against
97.64 Lakh MT indicating considerable decrease of
9.76% over previous year. Similarly, sales of complex
fertilizers also registered a decreasing trend and the
quantity sold was 84.41 Lakh MT with a decrease
of 4.90% over last year sales of 88.79 Lakh MT. Sale
of MOP has increased considerably by 12.5% from
24.42 Lakh MT in the Financial Year 2015-16 to
28.22 Lakh MT in 2016-17.
12.3 MARKETING INFRASTRUCTURE
Marketing channel of KRIBHCO includes
Cooperative Apex Marketing Federations,
Institutional Agencies and Grass Root level Primary
Agriculture Cooperative Societies. The Society’s
cooperative development programmes help its
channel partners, especially Primary Agricultural
Cooperatives (PACS) to acquire marketing skills and
other agriculture practices for inclusive development
of the cooperatives. Direct supplies to PACS help
these societies enormously as the timely supplies
enable them to increase fertilizer consumption and

17
agriculture productivity as well as to draw maximum
financial benefits.
The inter disciplinary team of marketing
and extension experts spread all over the major
states have worked extensively to reach farming
community in all crop production cycles. The Society
has Pan India presence. KRIBHCO is an established
brand in the key market territories. The major
marketing territories consists of Andhra Pradesh,
Bihar, Chhattisgarh, Gujarat, Haryana, Jharkhand,
Karnataka, Kerala, Madhya Pradesh, Maharashtra,
Orissa, Pondicherry, Punjab, Rajasthan, Tamil Nadu,
Uttar Pradesh, Uttrakhand and West Bengal.
The Society’s product range covers major
agri-inputs like Hybrid Seed, Certified Seeds, Bio
Fertilizers (Liquid), City Compost and procured/
imported Fertilizers like SSP, DAP and MOP, apart
from Neem Coated Urea. The Society believes that
Marketing and Agriculture expertise can assist the
farming communities by integrating KRIBHCO’s
cooperative principles into strategic planning,
extension, communications and other initiatives.
From agricultural consultations to cooperative
workshop, KRIBHCO aligns its goals, measurable
objectives, key messages with its brand image
among the rural communities.
12.4 MARKETING BUSINESS PLAN
The Society has expanded its product basket
and added new dimensions to marketing activities
over last seven years. Market potential of each
product / segment and situational analysis for each
product were considered and the product wise
marketing business plan for the year 2016-17 was
developed, which served as the guiding benchmark.
All the marketing activities were planned and
measured against the targets and brought desired
results.
12.5 SALES AND DISTRIBUTION OF FERTILIZERS
The Society made timely dispatches of
KRIBHCO Urea, as per Monthly Movement Order
issued by Department of Fertiliser, Ministry of
Chemicals and Fertilisers, Government of India for
allocation as per Essential Commodities Act and for
de-regulated quantity from Hazira Plant to various
destinations. The Society dispatched 23.52 Lakh MT
of KRIBHCO Urea by utilizing the Rail and Road mix
to different destinations in its Marketing Territories.
The Society continued to maintain the second
highest Urea sales in the country and has sold 41.18
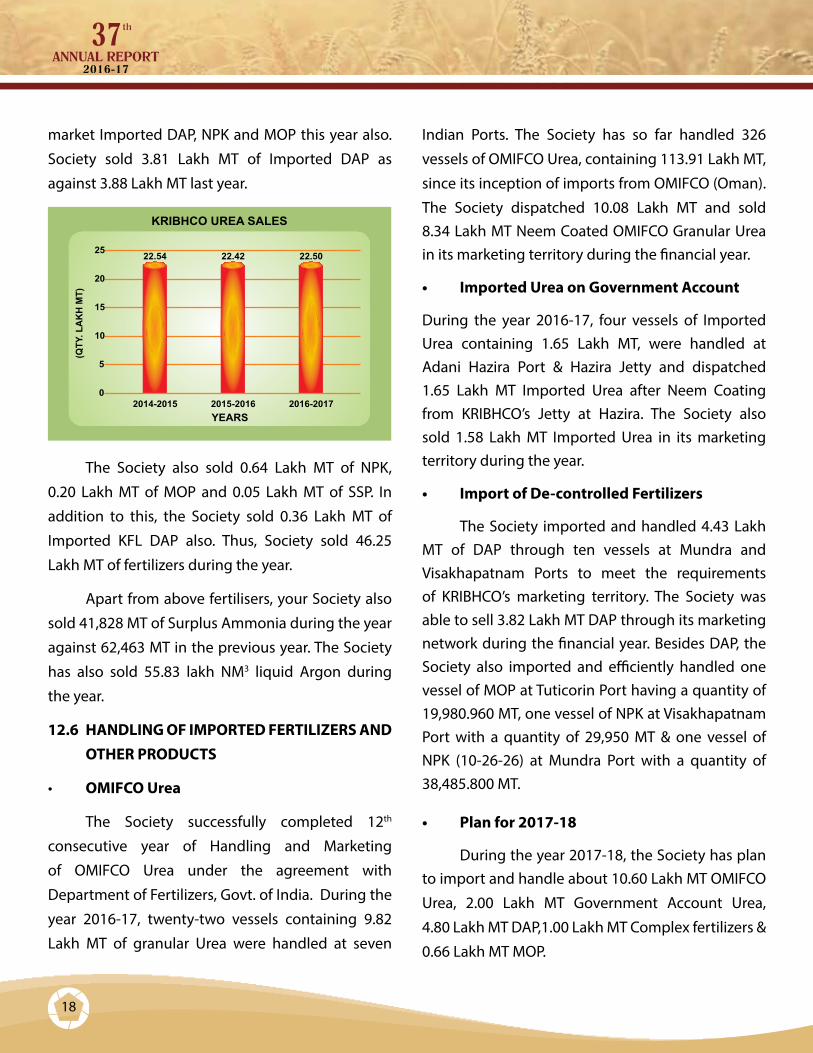
Lakh MT during the year. It consisted of 22.50 Lakh
MT of KRIBHCO Urea, 8.35 Lakh MT of OMIFCO
Urea, 8.75 Lakh MT of KFL Urea and 1.58 Lakh MT
of Government account Urea during the year.
KRIBHCO`s Neem Coated Urea has acquired a prime
place in the minds of farmers. In order to promote
balanced fertilization, the Society continued to
18
market Imported DAP, NPK and MOP this year also.
Society sold 3.81 Lakh MT of Imported DAP as
against 3.88 Lakh MT last year.
The Society also sold 0.64 Lakh MT of NPK,
0.20 Lakh MT of MOP and 0.05 Lakh MT of SSP. In
addition to this, the Society sold 0.36 Lakh MT of
Imported KFL DAP also. Thus, Society sold 46.25
Lakh MT of fertilizers during the year.
Apart from above fertilisers, your Society also
sold 41,828 MT of Surplus Ammonia during the year
against 62,463 MT in the previous year. The Society
has also sold 55.83 lakh NM3 liquid Argon during
the year.
12.6 HANDLING OF IMPORTED FERTILIZERS AND OTHER PRODUCTS
• OMIFCO Urea
The Society successfully completed 12th
consecutive year of Handling and Marketing
of OMIFCO Urea under the agreement with
Department of Fertilizers, Govt. of India. During the
year 2016-17, twenty-two vessels containing 9.82
Lakh MT of granular Urea were handled at seven
Indian Ports. The Society has so far handled 326
vessels of OMIFCO Urea, containing 113.91 Lakh MT,
since its inception of imports from OMIFCO (Oman).
The Society dispatched 10.08 Lakh MT and sold 8.34 Lakh MT Neem Coated OMIFCO Granular Urea in its marketing territory during the financial year.
• ImportedUreaonGovernmentAccount
During the year 2016-17, four vessels of Imported Urea containing 1.65 Lakh MT, were handled at Adani Hazira Port & Hazira Jetty and dispatched 1.65 Lakh MT Imported Urea after Neem Coating from KRIBHCO’s Jetty at Hazira. The Society also sold 1.58 Lakh MT Imported Urea in its marketing territory during the year.
• ImportofDe-controlledFertilizers
The Society imported and handled 4.43 Lakh MT of DAP through ten vessels at Mundra and Visakhapatnam Ports to meet the requirements of KRIBHCO’s marketing territory. The Society was able to sell 3.82 Lakh MT DAP through its marketing network during the financial year. Besides DAP, the Society also imported and efficiently handled one vessel of MOP at Tuticorin Port having a quantity of 19,980.960 MT, one vessel of NPK at Visakhapatnam Port with a quantity of 29,950 MT & one vessel of NPK (10-26-26) at Mundra Port with a quantity of 38,485.800 MT.
• Planfor2017-18
During the year 2017-18, the Society has plan to import and handle about 10.60 Lakh MT OMIFCO
Urea, 2.00 Lakh MT Government Account Urea,
4.80 Lakh MT DAP,1.00 Lakh MT Complex fertilizers &
0.66 Lakh MT MOP.

19
Shri N. Sambasiva Rao, Managing Director, KRIBHCO along with Shri Khalid bin Saleh Al- Mudaifer CEO, Ma’aden (Saudi Arabia) Shri V.S. Sirohi, Marketing Director, KRIBHCO and Shri Ayed H. Al Mutairi Director Marketing, Ma’aden in the IFA Conference at Morocco.
• Infrastructure at Ports
The infrastructure developed at Visakhapatnam, Tuticorin Ports and Hazira Jetty was used for storage and bagging of Imported fertilizers. The Society could handle 3.87 Lakh MT of OMIFCO and Government Account Urea at Hazira Jetty, 2.98 Lakh MT imported fertilizers at Visakhapatnam port and 0.64 Lakh MT Imported fertilizers at Tuticorin Port.
12.7 OTHER TRADED PRODUCTS
• SingleSuperPhosphate(SSP)
Your Society has procured and marketed 5,224.90 MT of SSP from various suppliers in Haryana, Punjab and Gujarat states which contributed ` 19.40 lakh to the profit
• ZincSulphate
Zinc is an essential nutrient for normal healthy
growth of plants, human beings and animals. As per
the statistics, 50% of the soil in our country is found
deficit in zinc. During 2016-17, your Society has sold
1,786.409 MT of Zinc Sulphate 21% & 33% grades
in 8 states. The Society plans to procure 8,044 MT
Zinc Sulphate during the year 2017-18 for sale in an
extended market territory of 16 states.
12.8 SEED BUSINESS
• CertifiedSeeds
The Indian Seed Market is one of the largest in
the world; however, it is mostly supplied by locally
produced seeds. Farmers retain seeds of major crops
(Wheat, Rice, Sorghum, Millets, Maize, and Pulses
etc.) and commercial crops for years. The largest
volumes in seed trade involve local exchange of self-
pollinating varieties. The seed replacement rates in
most crops are very low, with exception of cotton,
maize, sunflower and some vegetables. However,
awareness of higher yield and quality of produce from
hybrid and improved seeds is attracting farmers to
use improved seeds produced by organized sector.
Timely availability of seeds in adequate quantity at
consuming point at affordable price is essential to
increase food grain production.
Seed Multiplication Programme, initiated by
KRIBHCO in the year 1990-91, provides quality seed
of the main crops to farmers. The seeds produced
by the Society are made available to the farmers
through Krishak Bharati Sewa Kendra, Co-operative
societies and State Co-operative Marketing
Federations in different states. The main crops under
seed multiplication are Paddy, Wheat, Barley, Gram,
Pea, Moong, Lentil, Soyabean, Mustard and Guar.
20
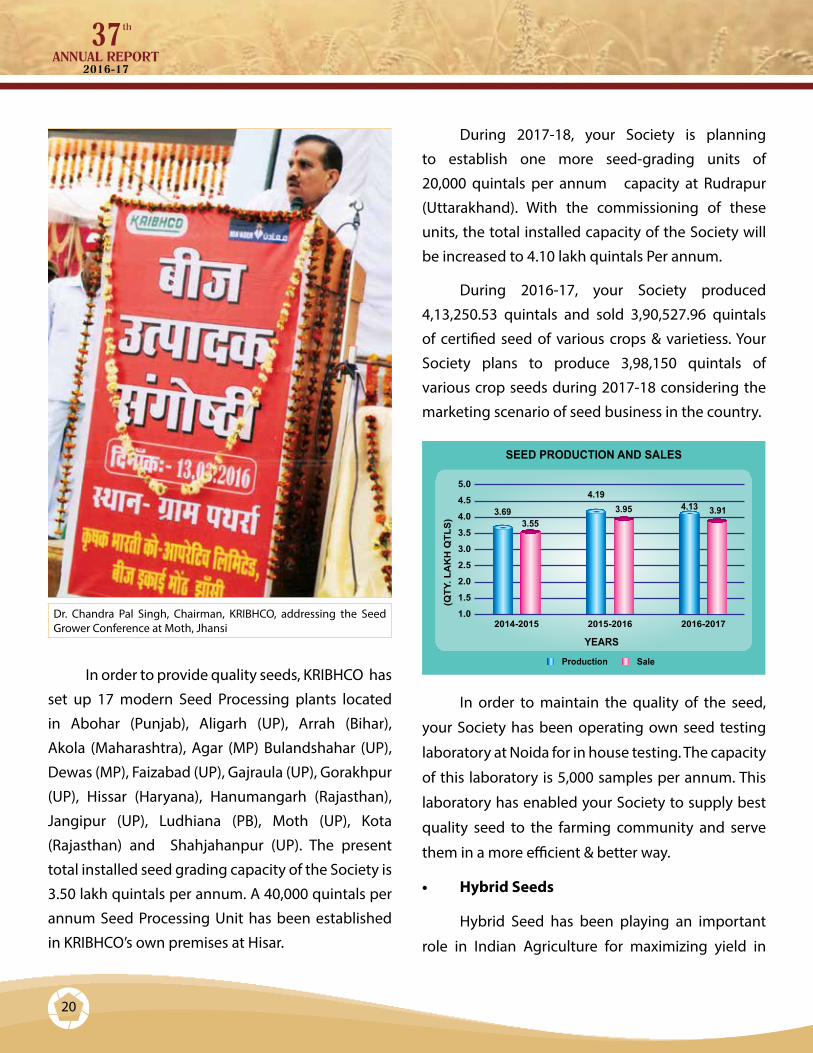
Dr. Chandra Pal Singh, Chairman, KRIBHCO, addressing the Seed Grower Conference at Moth, Jhansi
In order to provide quality seeds, KRIBHCO has
set up 17 modern Seed Processing plants located
in Abohar (Punjab), Aligarh (UP), Arrah (Bihar),
Akola (Maharashtra), Agar (MP) Bulandshahar (UP),
Dewas (MP), Faizabad (UP), Gajraula (UP), Gorakhpur
(UP), Hissar (Haryana), Hanumangarh (Rajasthan),
Jangipur (UP), Ludhiana (PB), Moth (UP), Kota
(Rajasthan) and Shahjahanpur (UP). The present
total installed seed grading capacity of the Society is
3.50 lakh quintals per annum. A 40,000 quintals per
annum Seed Processing Unit has been established
in KRIBHCO’s own premises at Hisar.
During 2017-18, your Society is planning
to establish one more seed-grading units of
20,000 quintals per annum capacity at Rudrapur
(Uttarakhand). With the commissioning of these
units, the total installed capacity of the Society will
be increased to 4.10 lakh quintals Per annum.
During 2016-17, your Society produced
4,13,250.53 quintals and sold 3,90,527.96 quintals
of certified seed of various crops & varietiess. Your
Society plans to produce 3,98,150 quintals of
various crop seeds during 2017-18 considering the
marketing scenario of seed business in the country.
In order to maintain the quality of the seed,
your Society has been operating own seed testing
laboratory at Noida for in house testing. The capacity
of this laboratory is 5,000 samples per annum. This
laboratory has enabled your Society to supply best
quality seed to the farming community and serve
them in a more efficient & better way.
• HybridSeeds
Hybrid Seed has been playing an important
role in Indian Agriculture for maximizing yield in

21
Dr. Chandra Pal Singh, Chairman, KRIBHCO inaugurating new building of Bio Fertiliser Plant- Hazira along with the Board of Directors Dr. Bijender Singh, Shri Pareshbhai R. Patel and Shri Bhikhabhai Z. Patel.
1 (strains of Azotobactor + PSB + KMB) and NPK-2
(strains of Azospirillum + PSB + KMB). In addition
to these strains, the Society plans to produce NPK-
3 (strains of Rhizobium – Soya + PSB + KMB) from
next year.
During the year 2016–17, your Society
produced 5.76 lakh litre of liquid Bio-fertilizers and
has successfully sold 5.76 lakh litre of liquid Bio-
fertilizers keeping in view its appreciable response
order to provide quality Hybrid Seed to farming
community. Your Society has tied up with a leading
Hybrid Seed Company and the seeds are marketed
in KRIBHCO brand.
Society marketed 1,45,694 Packets of Bt.
Cotton, 304.40 quintals of Paddy Hybrid, 4,860.46
quintals of Paddy Research, 4,744.21 quintals of
Hybrid Maize and 53.18 quintals of Hybrid Bajra
Seeds.
Based on the performance of the crop, plant
vigor and potential of high yields, your Society
plans to market 2,16,900 packets of Bt. Cotton, 7,450
quintals of Hybrid Maize, 5,705 quintals of Paddy
Research Seed, 250 quintals of Paddy Hybrid and 70
quintals of Bajra, in the Financial Year 2017-18.
12.9 ORGANIC FERTILIZERS
• CityCompost
The Society initiated co-marketing of City
Compost since December 2009. During the Financial
Year 2016-17, your Society has sold 19,621.10 MT
of Compost. In order to popularize Compost, the
Society is constantly educating farmers for its
application in addition to chemical fertilizers. The
Society plans to sell 22,000 MT of Compost during
the Financial Year 2017-18.
• Bio-fertilizers
The Society is presently producing nine types
of bacterial strains namely Azotobacter, Azospirillum,
Rhizobium, Acetobacter, Phosphorus Solubilizing
Bacteria (PSB), Potash Mobilizing Bacteria (KMB),
Zinc Solubilizing Bacteria, Liquid Consortia NPK-
22
due to its longer shelf life, survival at higher
temperature, easy application and low prices. During
the year 2017-18, the Society has a production and
marketing plans of 8.00 lakh liters of Liquid Bio-
fertilizers.
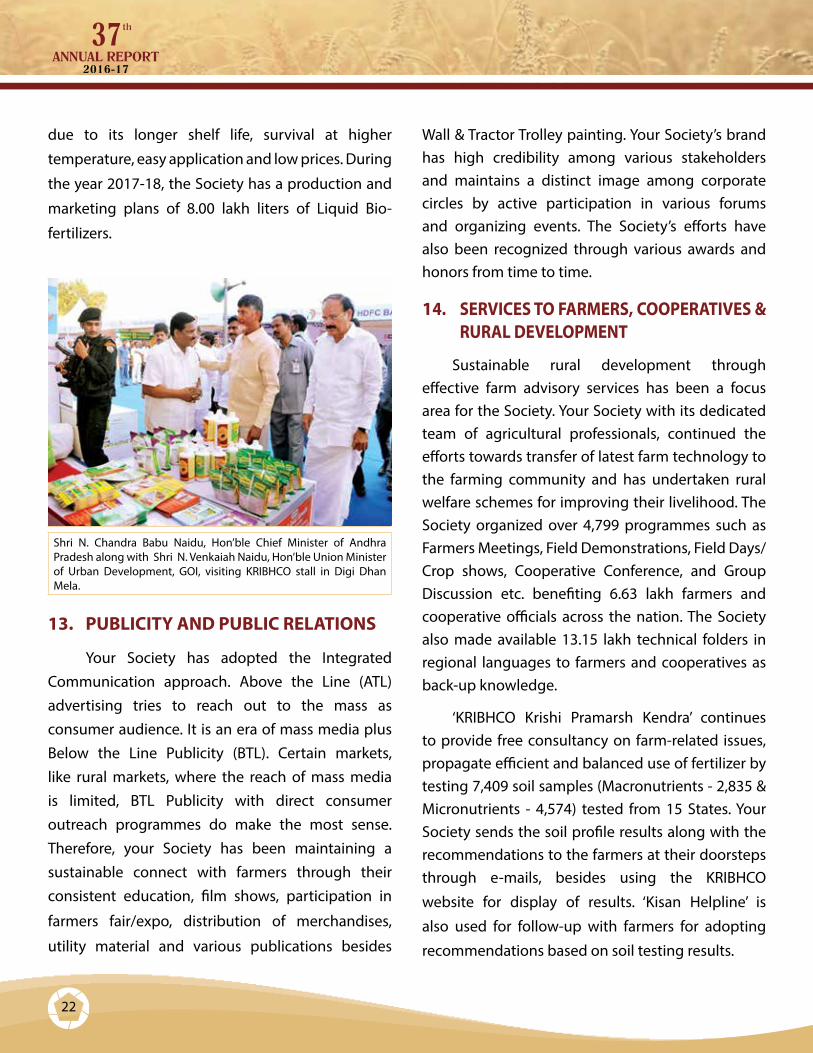
Shri N. Chandra Babu Naidu, Hon’ble Chief Minister of Andhra Pradesh along with Shri N. Venkaiah Naidu, Hon’ble Union Minister of Urban Development, GOI, visiting KRIBHCO stall in Digi Dhan Mela.
13. PUBLICITY AND PUBLIC RELATIONS
Your Society has adopted the Integrated Communication approach. Above the Line (ATL) advertising tries to reach out to the mass as consumer audience. It is an era of mass media plus Below the Line Publicity (BTL). Certain markets, like rural markets, where the reach of mass media is limited, BTL Publicity with direct consumer outreach programmes do make the most sense. Therefore, your Society has been maintaining a sustainable connect with farmers through their consistent education, film shows, participation in
farmers fair/expo, distribution of merchandises,
utility material and various publications besides
Wall & Tractor Trolley painting. Your Society’s brand has high credibility among various stakeholders and maintains a distinct image among corporate circles by active participation in various forums and organizing events. The Society’s efforts have also been recognized through various awards and honors from time to time.
14. SERVICES TO FARMERS, COOPERATIVES & RURAL DEVELOPMENT
Sustainable rural development through effective farm advisory services has been a focus area for the Society. Your Society with its dedicated team of agricultural professionals, continued the efforts towards transfer of latest farm technology to the farming community and has undertaken rural welfare schemes for improving their livelihood. The Society organized over 4,799 programmes such as Farmers Meetings, Field Demonstrations, Field Days/Crop shows, Cooperative Conference, and Group Discussion etc. benefiting 6.63 lakh farmers and cooperative officials across the nation. The Society also made available 13.15 lakh technical folders in regional languages to farmers and cooperatives as back-up knowledge.
‘KRIBHCO Krishi Pramarsh Kendra’ continues to provide free consultancy on farm-related issues, propagate efficient and balanced use of fertilizer by testing 7,409 soil samples (Macronutrients - 2,835 & Micronutrients - 4,574) tested from 15 States. Your Society sends the soil profile results along with the recommendations to the farmers at their doorsteps through e-mails, besides using the KRIBHCO
website for display of results. ‘Kisan Helpline’ is
also used for follow-up with farmers for adopting
recommendations based on soil testing results.

23
Shri N. Sambasiva Rao, Managing Director, KRIBHCO addressing a cooperative conference at Guntur (AP).
The Society has participated in International/
National level exhibitions including 4th International
Agronomy Congress at PUSA, New Delhi, and Krishi
Unnati Mela at IARI-Pusa.
For inclusive development of Cooperatives, the
Society adopted 106 cooperative societies, trained
15,364 cooperative managers in 148 cooperative
conferences. The Society also organized 20 health
campaigns for human, livestock, and 13 rural sports
programmes, 15 income generation programmes
for integrated rural development.
15. COMMUNITY DEVELOPMENT
Your Society is conscious of its responsibility
towards various sections of the Society. Accordingly,
it has been undertaking extensive community
developmental activities throughout the country.
Storage-cum-community centre scheme started
on the occasion of Golden Jubilee of India’s
Independence is still being continued and so far 178
centers have been completed and are properly used
by rural community.
16. CORPORATE SOCIAL RESPONSIBILITY
Your Society’s mission and vision is to serve the agrarian community. In line with this, the Society has facilitated in creating alternate livelihood option through Income generating activities, organized health camps for humans & animals, created drinking water facilities, undertaken sanitation campaigns, rural sports etc for rural communities. These programmes are undertaken need based by
your Society in a spirit much more than an obligation
under CSR.
KRIBHCO distributing Sewing machines among poor and marginal families to enhance income to empower women.
17. KRISHAK BHARATI SEWA KENDRAS (KBSKs)
The Society is operating 61 KBSKs (36 in Uttar
Pradesh, 16 in Haryana and 9 in Punjab states). These
are own retail outlets of the Society in countryside
to cater the farmers’ needs for quality Agro-inputs
at a reasonable price at their doorsteps. KBSKs are
also instrumental in transmitting to the farming
community the latest technical knowledge of the
Agricultural practices. These centers fulfill twin

24
objective of “Sales and Services” under one roof.
They bridge the gap between KRIBHCO and rural
masses for socio-economic development as well as
provide first-hand information/feedback about the
actual needs of the farming community.
KBSKs are selling various Agro Products like
Urea (Neem coated), DAP, NPK, MOP, SSP, ZnSO4,
Compost, Water Soluble Fertilizers, Bio-Fertilizers,
Certified & Hybrid Seeds, Cattle feed & so on. Various
kinds of crop literature and pamphlets are also made
available to farmers free of cost.
Society intends to open additional 20 KBSKs
(5 in Haryana and 15 in Uttar Pradesh). These new
KBSKs are likely to be functional in the year 2017-18.
A view of Krishak Bharati Sewa Kendra ( KBSK).
Apart from these KBSKs, your Society has initiated
franchisee concept in the States of UP, Bihar, West
Bengal, and Punjab by giving franchise to Fertilizer
Dealers. They are named as “Kisan Suvidha Kendras”
as per the directions from Department of Fertilizers,
Government of India.
18. INVESTMENTS/ JOINT VENTURES/ SUBSIDIARIES/OTHERS
18.1 Joint Ventures and Subsidiaries
• OmanIndiaFertilizerCompanySAOC
KRIBHCO had made an investment of US$ 69.5
MM (Equivalent to ` 328.53 Crore) representing 25%
of paid up equity capital of Oman India Fertilizer
Company (OMIFCO). OMIFCO has a world scale
fertilizer plant of 16.52 lakh MTPA of granular Urea
and 11.9 lakh MTPA Ammonia at Sur Industrial estate
in the Sultanate of Oman.
Sultanate of Oman has committed to supply
the gas feedstock for the entire life of OMIFCO
spanning a period of 20 years under a Gas Supply
Agreement. Government of India has committed
to purchase all the Urea produced by OMIFCO
under a long term Urea Off-take Agreement (UOTA)
for 15 years i.e., up to the year 2020. Highly skilled
workforce from KRIBHCO contributes in a big way
in operation and maintenance of the fertilizer plant
under a “Personnel Supply Agreement”.
For the financial year 2016-17, OMIFCO
produced 20.35 Lakh MT Urea, and 13.15 Lakh MT
of Ammonia, which is 123.20% and 110.50% of
the annual rated capacity of 16.52 Lakh MT and
11.9 Lakh MT respectively. Your Society is handling &
marketing 50% of the Urea produced by OMIFCO. For
the financial year 2016-17, OMIFCO paid a dividend
of 13.31% on paid up capital. KRIBHCO received US$
9.25 MM (` 60.98 Crore) as dividend income from
OMIFCO during the financial year.

25
Unloading of Imported Urea from Oman at Jetty, KRIBHCO, Surat, Gujarat.
• KRIBHCOFertilizersLimited(KFL)
Kribhco Fertilizers Limited (formerly Kribhco Shyam Fertilizers Ltd) is a 100% subsidiary of
KRIBHCO. After the exit by Shyam Group, the
Company’s name has been changed on 03.07.2017
to KRIBHCO FERTILIZERS LIMITED from its earlier
name of Kribhco Shyam Fertilizers Ltd. The Society
has invested ` 914.69 Crore in KFL. KFL owns
and operates a gas based Fertilizer Complex at
Shahjahanpur, U.P. strategically located in North
India, in high Urea consumption belt. The Fertilizer
Complex consists of 1,520 MTPD Ammonia Plant
(annual capacity of 5.02 Lakh MT) and 2,620 MTPD
Urea Plant (annual capacity of 8.64 Lakh MT). The
Fertilizer Plant is based on Natural Gas as feedstock
supplied through the Hazira-Vijaypur-Jagdishpur
(“HVJ”) gas pipeline. The marketing of Urea and
other products is undertaken by KRIBHCO.
During the year 2016-17, KFL produced
9.32 Lakh MT of Urea and 5.48 Lakh MT of Ammonia
with capacity utilization of 107.8% and 109.2% for Urea and Ammonia respectively. During the year 9.38 Lakh MT Urea was dispatched to various destinations and a total of 8.75 Lakh MT Urea was sold. During the year KFL also imported and traded in DAP.
• KribhcoInfrastructureLimited(KRIL)
KRIBHCO Infrastructure Limited (KRIL) is wholly owned subsidiary of the Society. KRIL has an authorized share capital of ` 500 Crore and paid up capital of ` 185 Crore.
KRIL possess category– I License to operate container trains on Indian Railway network on PAN India basis. KRIL owns eight container trains and 1,350 containers, which are being deployed in different circuits. KRIL has set up and is operating Rail linked Container Depots (ICDs)/ Private Freight Terminals at Hazira (Gujarat), Rewari (Haryana), Modinagar (Uttar Pradesh) and Hindaun City (Rajasthan), which offers comprehensive door to door Logistic Solutions for handling of wide range of cargo, including liquid cargo. KRIL has developed liquid (oil) handling facilities at its Modinagar & Rewari Terminals. KRIL has developed coal handling facilities at its Hazira Terminal, which is being used for handling imported coal from Adani‘s Hazira Port. KRIL is presently handling EXIM traffic at its ICD at Hazira and Rewari.
KRIL has generated total revenue of ` 96.80 Crore during the Financial Year 2016-17. KRIL is exploring possibilities to set up Free Trade Zone/Logistic Park/Inland Container Depots/ Private Freight Stations/Domestic Container Terminals etc at various strategic locations in strategic alliances/Joint Venture subject to techno-commercial
considerations.
26
• GujaratStateEnergyGeneration Ltd. (GSEG)
Gujarat State Energy Generation Limited (GSEG)
is a joint venture between Gujarat State Petroleum
Corporation Ltd (GSPC), other Government of
Gujarat Companies, KRIBHCO and GAIL (India) Ltd. In
addition, SBI and IFCI are strategic partners. KRIBHCO
has so far made equity contribution of ̀ 102.04 Crore
(27.9%). During the financial year 2016-17, GSEG has
earned profit before tax of `46.60 Crore.
18.2 OTHER INVESTMENT
• IndianCommodityExchange(ICEX)
Your Society holds 4% equity (` 8.40 Crore)
in the Indian Commodity Exchange (ICEX). ICEX
was incorporated as a wholly owned subsidiary of
India Bulls Housing Finance Limited on August 18,
2008 as International Multi Commodity Exchange.
Subsequently, Reliance Exchange Next Limited (Anil
Ambani Group) acquired 26% Equity from India
Bulls. ICEX has been declared as a recognized Stock
Exchange under Securities Contract Regulation
Act. ICEX has introduced new set of commodities
contracts for Diamonds, which presently are not
traded on any other exchange in the world. ICEX
has also plans to form International Exchange at
GIFT City in Gujarat to become a ‘Global Exchange’
and creating value for exchange. ICEX came up with
Right Issue in the month of February- March 2017 of
8.50 crore equity shares for ` 85 Crore of face value
of ` 5/- at a premium of ` 5/- per share, which was
fully subscribed.
• NagarjunaOilRefinery Ltd. (NORL)
Your Society holds an equity investment of
` 476.19 lakh, which is 2.34% of NORL’s paid up share
capital. The equity shares of the company are listed
on Bombay Stock Exchange (BSE) and National Stock
Exchange (NSE). The company holds 46.78% of paid
up equity capital in Nagarjuna Oil Corporation Ltd.
(NOCL).
• Nagarjuna Fertilizers and Chemicals Ltd.
(NFCL)
The Society holds equity capital of ` 523.81
Lakh in NFCL which is 1.84% of paid up share capital
of NFCL. During the Financial Year 2016-17, NFCL
produced 14.98 Lakh MT of Urea and sold 15.27 Lakh
MT of Urea. Total Urea sales for both manufactured
and imported was 18.91 Lakh MT. Micro irrigation
division achieved a production of 1,278 Lakh MT.
19. GRAMIN VIKAS TRUST (GVT)
GVT, as per its commitment to improve rural
livelihoods, has made meaningful contributions
through its interventions and added more than
21,000 hectares of land under watershed treatment
coverage, 14,625 acres of land under horticultural
plantations and impacted lives of nearly 75,000
families. Under Skill Development, GVT has trained
1,158 candidates and has successfully placed 304
candidates.
GVT is always exploring other possibilities
in our way forward and in that effort; GVT has
received this year around 50 projects from Govt.

27
Shri N. Sambasiva Rao, Managing Director, KRIBHCO and Shri S.S. Yadav, CEO, GVT visited GVT site of mason training under Pradhanmantri Awas Yojana ( PMAY)
agencies and Corporate worth `15.94 Crore Projects
are mostly in the area of watershed development,
capacity building, training, health and sanitation.
GVT has made a greater penetration in the area of
climate change mitigation measures and offering
eco-friendly technology through its watershed
development and bio-digester based toilet
construction programmes.
Maharashtra Agriculture Competitiveness
Project (MACP) was implemented by GVT in January
2016 and was up to March 2017, which has been
extended for 2017-18 also. Under the Project, Farmers
Producers Organization (FPO’s) is given handholding
support to develop business proposals. World Bank
provides the Capex under the business proposals.
National Livelihood Resource Institute (NLRI)
at Ratlam has conducted 32 training programmes
during 2016-17 under which 1125 participants
were trained from different organizations like IWMP
-Watershed-RGM, Bhopal, Zilla Panchayat, ATMA,
Reliance Foundation, KRIBHCO and MANAGE-
Hyderabad. NLRI has started PGDRPM Course, which
is now in 3rd year under School of Rural Management
(SRM) at Ratlam. During the Financial Year, 31
enrolments have taken place under PGDRPM course.
20. HUMAN RESOURCE DEVELOPMENT (HRD)
Human Resources Development is a process by which employees of the organization are continuously helped in planned manner to acquire capabilities, knowledge, perspective attitude, values, skills, develop their general individual capabilities and to develop organization culture as a whole.
In line with this, Society conducted in-house training programs, workshops and seminars to develop and update knowledge of employees as well as to enable them to acquire latest skills. Wide ranges of Lectures by eminent faculty were arranged in-house on various topics like health, Science of Life; key of happiness, Retirement Planning, Change Management, Pranic Healing etc. for employees.
Employees were also sponsored to different Institutes for various programs like soft skill for better performance, achieving excellence through organizational values, vigilance role, functions and responsibilities, supply chain analytics, performance management for competitive advantage, leadership & teamwork for performance excellence, and emotional intelligence. The Society also celebrated “National Productivity Week” and ‘International Women’s day’. To recognize and motivate employees, the Society has introduced Excellent Service Award
Scheme for Employees of Head office & Central
Marketing Office.

28
Dr. Chandra Pal Singh, Chairman, KRIBHCO delivering inaugural speech on KRIBHCO Day Programme in the presence of Shri N. Sambasiva Rao, Managing Director and other Directors of KRIBHCO.
21. INDUSTRIAL RELATIONS
Employees’ Relations in the Society remained
cordial and peaceful. An atmosphere of mutual
trust, confidence and goodwill prevailed between
the Management and the employees represented
by their Unions and Associations. Traditionally,
Management maintained an open-door policy with
fair and transparent approach while dealing with
the employees, their Unions and Associations. As a
result, not a single man-day was lost during the year
due to Industrial Relations Problems.
The Management of the Society considers
its employees as a valuable asset and assigns
paramount importance to Employees Relations.
Continuous and untiring efforts towards maintaining
cordial and harmonious inter-personal relations has
been the key factor(s) in achieving all round better
performance of the Society.
22. INFORMATION TECHNOLOGY
Your society has moved a long way on Digital
transformation drive by strategic use of Information
and Communication Technology tools. Your
Society has always adopted latest technologies for
improvement in the business processes as per needs.
As per business plan, the Society has
implemented cloud based unified communication
system across the organization and has also set up
a Disaster Recovery centre to have un-interrupted
business operations on SAP ERP Application as a
Business Continuity plan in case of failure of Data
Center operation. The Society is in the process to
implement GST (Goods & Service Tax) as per Govt.
guidelines and shall be implemented in our SAP ERP
Applications.
Your Society has also facilitated number of
services to farmers through its modern testing
Laboratories functional in Corporate Office at Noida
by sending testing reports of soils & seeds. The
Society has always taken initiatives to empower its
employees by providing need-based trainings on
Information Technology for better productivity.
Your Society has implemented no. of schemes
for protecting the environment and e-waste
management
23. AWARDS AND HONOURS
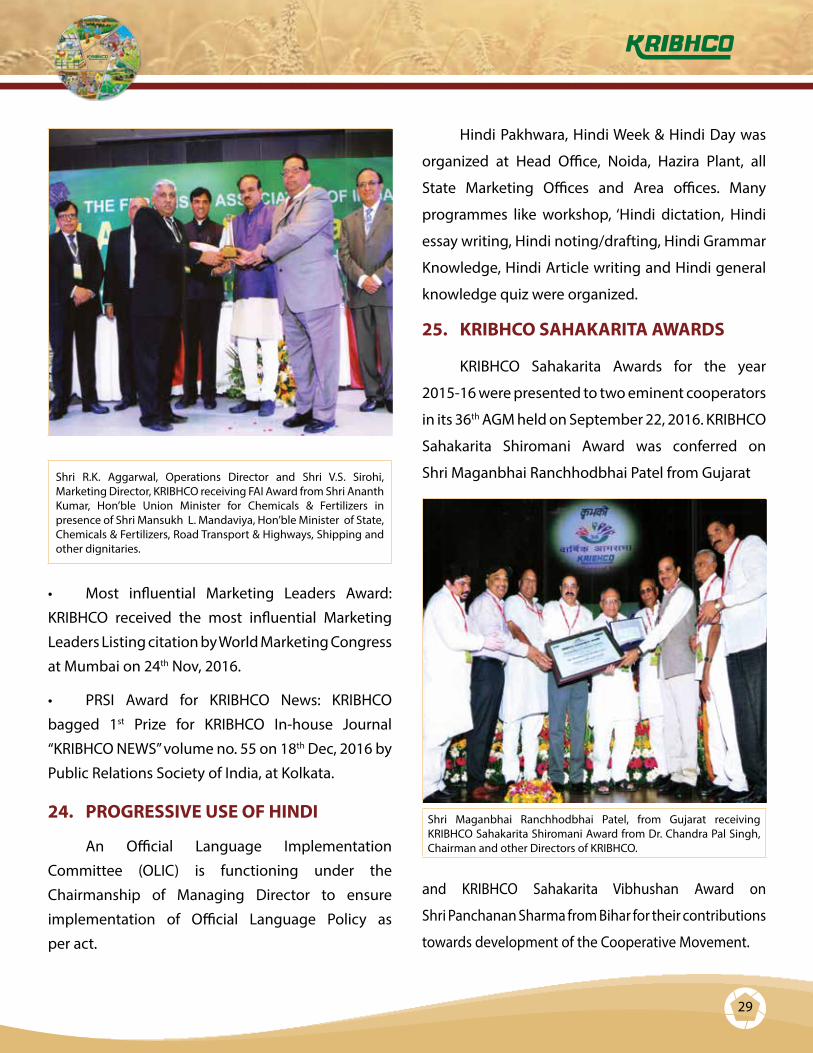
• FAI Special Award on Bio-fertilizer: KRIBHCO
has won Special Award on Bio-fertilizers 2016
for standing first for the third consecutive year
(2015-2016) in the field of high quality Production,
Promotion and Marketing of Bio-Fertilizers.
29
Shri R.K. Aggarwal, Operations Director and Shri V.S. Sirohi, Marketing Director, KRIBHCO receiving FAI Award from Shri Ananth Kumar, Hon’ble Union Minister for Chemicals & Fertilizers in presence of Shri Mansukh L. Mandaviya, Hon’ble Minister of State, Chemicals & Fertilizers, Road Transport & Highways, Shipping and other dignitaries.
• Most influential Marketing Leaders Award:
KRIBHCO received the most influential Marketing
Leaders Listing citation by World Marketing Congress
at Mumbai on 24th Nov, 2016.
• PRSI Award for KRIBHCO News: KRIBHCO
bagged 1st Prize for KRIBHCO In-house Journal
“KRIBHCO NEWS” volume no. 55 on 18th Dec, 2016 by
Public Relations Society of India, at Kolkata.
24. PROGRESSIVE USE OF HINDI
An Official Language Implementation
Committee (OLIC) is functioning under the
Chairmanship of Managing Director to ensure
implementation of Official Language Policy as
per act.
Hindi Pakhwara, Hindi Week & Hindi Day was
organized at Head Office, Noida, Hazira Plant, all
State Marketing Offices and Area offices. Many
programmes like workshop, ‘Hindi dictation, Hindi
essay writing, Hindi noting/drafting, Hindi Grammar
Knowledge, Hindi Article writing and Hindi general
knowledge quiz were organized.
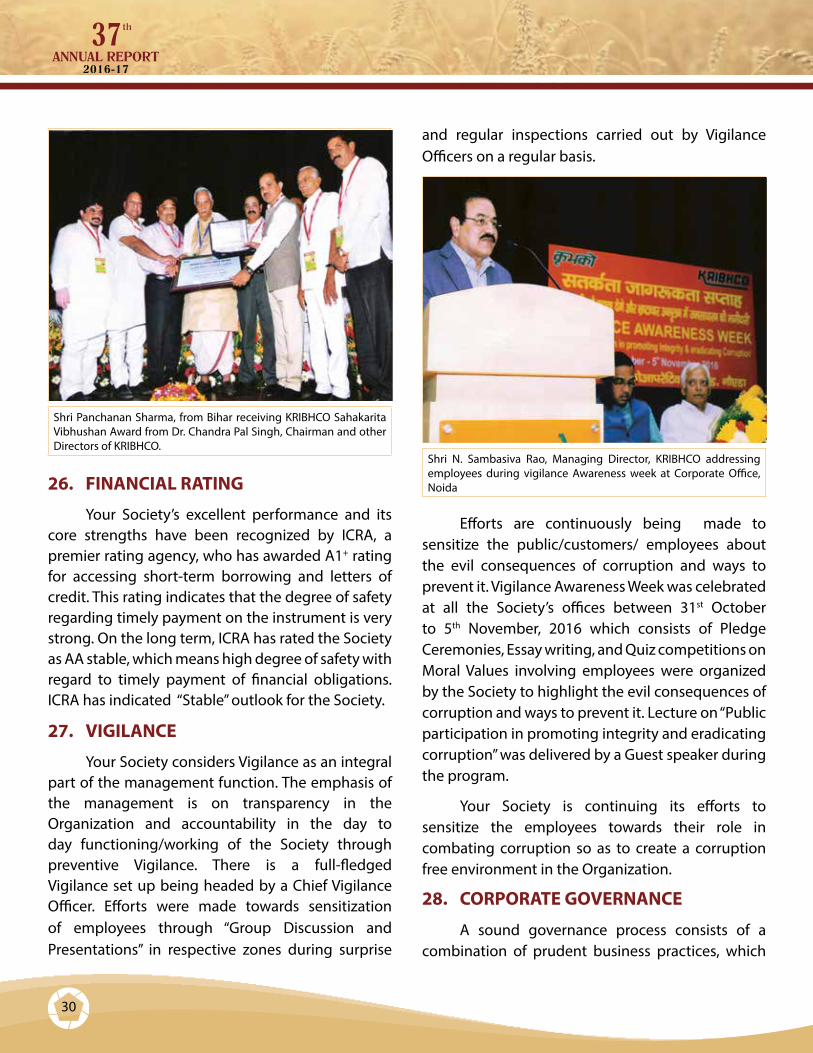
25. KRIBHCO SAHAKARITA AWARDS
KRIBHCO Sahakarita Awards for the year
2015-16 were presented to two eminent cooperators
in its 36th AGM held on September 22, 2016. KRIBHCO
Sahakarita Shiromani Award was conferred on
Shri Maganbhai Ranchhodbhai Patel from Gujarat
Shri Maganbhai Ranchhodbhai Patel, from Gujarat receiving KRIBHCO Sahakarita Shiromani Award from Dr. Chandra Pal Singh, Chairman and other Directors of KRIBHCO.
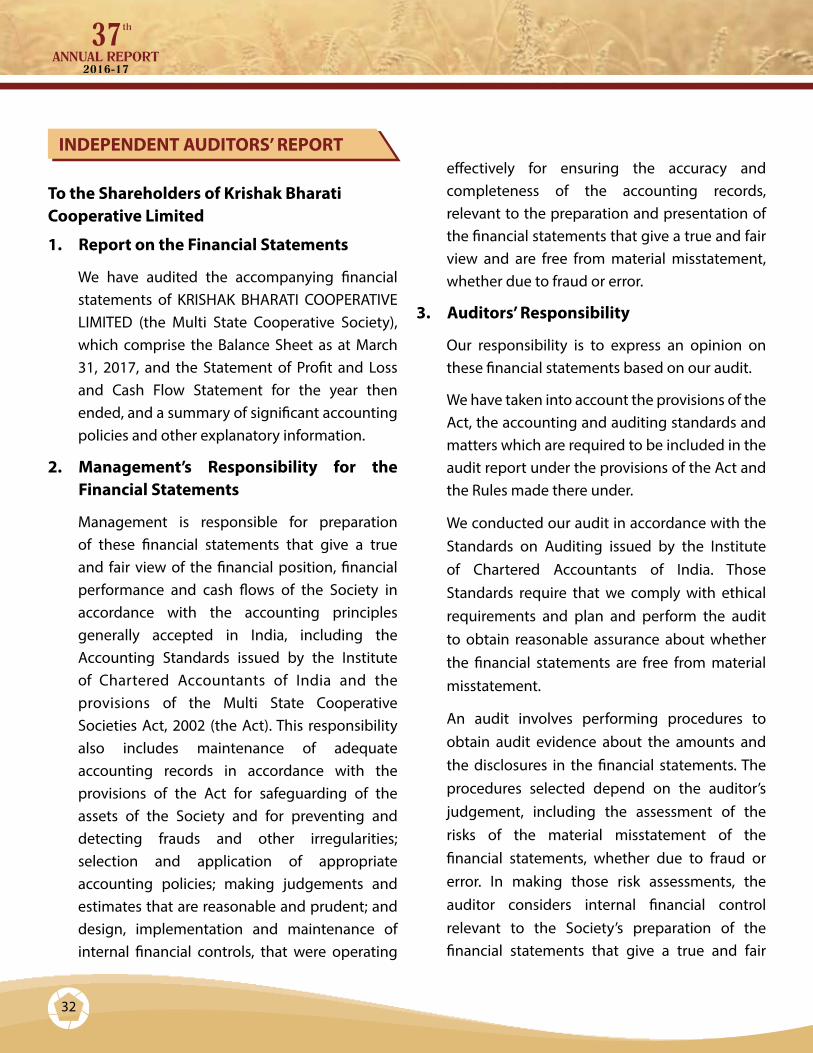
and KRIBHCO Sahakarita Vibhushan Award on
Shri Panchanan Sharma from Bihar for their contributions
towards development of the Cooperative Movement.
30
Shri Panchanan Sharma, from Bihar receiving KRIBHCO Sahakarita Vibhushan Award from Dr. Chandra Pal Singh, Chairman and other Directors of KRIBHCO.
26. FINANCIAL RATING
Your Society’s excellent performance and its core strengths have been recognized by ICRA, a premier rating agency, who has awarded A1+ rating for accessing short-term borrowing and letters of credit. This rating indicates that the degree of safety regarding timely payment on the instrument is very strong. On the long term, ICRA has rated the Society as AA stable, which means high degree of safety with regard to timely payment of financial obligations. ICRA has indicated “Stable” outlook for the Society.
27. VIGILANCE
Your Society considers Vigilance as an integral part of the management function. The emphasis of the management is on transparency in the Organization and accountability in the day to day functioning/working of the Society through preventive Vigilance. There is a full-fledged Vigilance set up being headed by a Chief Vigilance Officer. Efforts were made towards sensitization of employees through “Group Discussion and Presentations” in respective zones during surprise
and regular inspections carried out by Vigilance Officers on a regular basis.
Shri N. Sambasiva Rao, Managing Director, KRIBHCO addressing employees during vigilance Awareness week at Corporate Office, Noida
Efforts are continuously being made to sensitize the public/customers/ employees about the evil consequences of corruption and ways to prevent it. Vigilance Awareness Week was celebrated at all the Society’s offices between 31st October to 5th November, 2016 which consists of Pledge Ceremonies, Essay writing, and Quiz competitions on Moral Values involving employees were organized by the Society to highlight the evil consequences of corruption and ways to prevent it. Lecture on “Public participation in promoting integrity and eradicating corruption” was delivered by a Guest speaker during the program.
Your Society is continuing its efforts to sensitize the employees towards their role in combating corruption so as to create a corruption free environment in the Organization.
28. CORPORATE GOVERNANCE
A sound governance process consists of a combination of prudent business practices, which

31
result in enhancement of shareholders’ value and enable the Society to fulfill its obligation towards all the stakeholders, particularly to the Society at large. The constituents of corporate governance in the Society are the Board of Directors, the Shareholders and the Management.
The Thirty Sixth Annual General Body Meeting (AGM) of KRIBHCO was held on 22nd September, 2016. During the course of discussion, the delegates appreciated the excellent performance of the Society, especially on production and marketing fronts. The delegates also appreciated the sincere efforts put in by the Society in implementing the suggestions made by them in the last AGM.
Seven meetings of the Board of Directors, Seven meetings of the Executive Committee, two meetings of the Marketing Sub Committee and three meetings of the Audit Committee were held during the year. The observations/recommendations of the members are taken into account while formulating the future strategies and planning of the Society.
29. AUDITORS
M/s V. Sankar Aiyar & Co., M/s S.S. Kothari Mehta & Co. and M/s G.K. Choksi & Co. Chartered Accountants, who are statutory auditors of the Society will hold office until the conclusion of the ensuing Annual general meeting. Members are requested to consider reappointment of M/s V. Sankar Aiyar & Co., M/s S.S. Kothari Mehta & Co. and M/s G.K. Choksi & Co., Chartered Accountants as Joint Statutory Auditors of the Society for the Financial Year 2017-18.
30. DIRECTORS’ RESPONSIBILITY STATEMENTS
Your Directors hereby confirm that (a) In the preparation of the annual accounts, applicable Accounting Standards have been followed. The annual accounts contain proper explanation relating
to material departures, if any. (b) Appropriate Accounting Policies have been selected and applied consistently, and that the judgment and estimates made are reasonable and prudent so as to give a true and fair view of the state of affairs of the Society as of March 31, 2017 and of the profit of the Society for the year 2016-17. (c) Proper and sufficient care has been taken for the maintenance of adequate accounting records in accordance with the Multi State Cooperative Society Act 2002, for safeguarding the assets of the Society and for preventing and detecting fraud and irregularities (d) the Annual Accounts have been prepared on a going concern basis.
31. ACKNOWLEDGEMENTS
The Society received full support and cooperation from the Ministry of Chemicals and Fertilizers, from other concerned Ministries/Departments of the Government of India and FICC for which the Society expresses its gratefulness.
The Board of Directors also wishes to place on record its gratitude to those National and International Organizations, which have provided their valuable support. Special thanks are due to Society’s bankers and the Reserve Bank of India. Last but not the least, the Board places on record its high appreciation for the sustained, dedicated and sincere efforts put in by the Officers and Staff of the Society for their sustained high level of performance.
For and on behalf of the Board of Directors
(Chandra Pal Singh) Chairman
Dated: June 29, 2017
32
INDEPENDENT AUDITORS’ REPORT
To the Shareholders of Krishak Bharati Cooperative Limited
1. Report on the Financial Statements
We have audited the accompanying financial statements of KRISHAK BHARATI COOPERATIVE LIMITED (the Multi State Cooperative Society), which comprise the Balance Sheet as at March 31, 2017, and the Statement of Profit and Loss and Cash Flow Statement for the year then ended, and a summary of significant accounting policies and other explanatory information.
2. Management’s Responsibility for the Financial Statements
Management is responsible for preparation of these financial statements that give a true and fair view of the financial position, financial performance and cash flows of the Society in accordance with the accounting principles generally accepted in India, including the Accounting Standards issued by the Institute of Chartered Accountants of India and the provisions of the Multi State Cooperative Societies Act, 2002 (the Act). This responsibility also includes maintenance of adequate accounting records in accordance with the provisions of the Act for safeguarding of the assets of the Society and for preventing and detecting frauds and other irregularities; selection and application of appropriate accounting policies; making judgements and estimates that are reasonable and prudent; and design, implementation and maintenance of internal financial controls, that were operating
effectively for ensuring the accuracy and completeness of the accounting records, relevant to the preparation and presentation of the financial statements that give a true and fair view and are free from material misstatement, whether due to fraud or error.
3. Auditors’ Responsibility
Our responsibility is to express an opinion on these financial statements based on our audit.
We have taken into account the provisions of the Act, the accounting and auditing standards and matters which are required to be included in the audit report under the provisions of the Act and the Rules made there under.
We conducted our audit in accordance with the Standards on Auditing issued by the Institute of Chartered Accountants of India. Those Standards require that we comply with ethical requirements and plan and perform the audit to obtain reasonable assurance about whether the financial statements are free from material misstatement.
An audit involves performing procedures to obtain audit evidence about the amounts and the disclosures in the financial statements. The procedures selected depend on the auditor’s judgement, including the assessment of the risks of the material misstatement of the financial statements, whether due to fraud or error. In making those risk assessments, the auditor considers internal financial control relevant to the Society’s preparation of the financial statements that give a true and fair

33
view in order to design audit procedures that are appropriate in the circumstances, but not for the purpose of expressing an opinion on whether the company has in place an adequate internal financial controls system over financial reporting and the operating effectiveness of such controls. An audit also includes evaluating the appropriateness of the accounting policies used and reasonableness of the accounting estimates made by Management, as well as evaluating the overall presentation of the financial statements.
We believe that the audit evidence we have obtained is sufficient and appropriate to provide a basis for our audit opinion on the financial statements.
4. Opinion
In our opinion and to the best of our information and according to the explanations given to us, the aforesaid financial statements give the information required by the Act in the manner so required and give a true and fair view in conformity with the accounting principles generally accepted in India:
a) in the case of the Balance Sheet, of the state of affairs of the Society as at March 31, 2017;
b) in the case of the Statement of Profit and Loss, of the profit of the Society for the year ended on that date; and
c) in the case of the Cash Flow Statement, of the cash flows of the Society for the year ended on that date.
5. Other Matter
We did not audit the financial statements of Sur Branch at Oman included in the financial statements of the Society whose financial
statements information reflect total assets of `32,870.68 lakh as at 31st March, 2017 and total revenues of `6,097.90 lakh for the year ended on that date, as considered in the standalone financial statements. The financial statements of the branch have been audited by the branch auditors whose reports have been furnished to us, and our opinion in so far as it relates to the amounts and disclosures included in respect of the branch, is based solely on the report of such branch auditors.
Our opinion is not modified in respect of this matter.
6. Report on Other Legal and Regulatory Requirements
As required under the Multi State Cooperative Societies Act, 2002, we report that:
a) We have sought & obtained all the information and explanations which to the best of our knowledge and belief were necessary for the purpose of our audit;
b) In our opinion proper books of accounts as specified in the Multi-State Cooperative Societies Rules, 2002 have been kept by the Society so far as appears from our examination of those books and proper returns adequate for the purpose of our audit have been received from the Branch not visited by us;
c) The report on the accounts of Sur Branch at Oman audited by the local branch auditor has been forwarded to us and same has been appropriately dealt with in preparing this report in the manner considered necessary by us and;
34
For G. K. Choksi & Co. For V. Sankar Aiyar & Co. For S. S. Kothari Mehta & CoChartered Accountants Chartered Accountants Chartered Accountants
(Firm Regn. No. 101895W) (Firm Regn. No. 109208W) (Firm Regn. No. 000756N)
(Sandip A. Parikh) (R. Raghuraman) (Yogesh K. Gupta)
Partner Partner PartnerM.No. 040727 M.No. 081350 M.No. 093214
Place: New DelhiDated: May 18, 2017
d) The Balance Sheet, Statement of Profit and Loss, and Cash Flow Statement dealt with by this Report are in agreement with the books of accounts and with the returns received from the branches not visited by us.
e) In our opinion, the aforesaid financial statements comply with the accounting standards issued by the Institute of Chartered Accountant of India.
35
FINANCIAL STATEMENTS
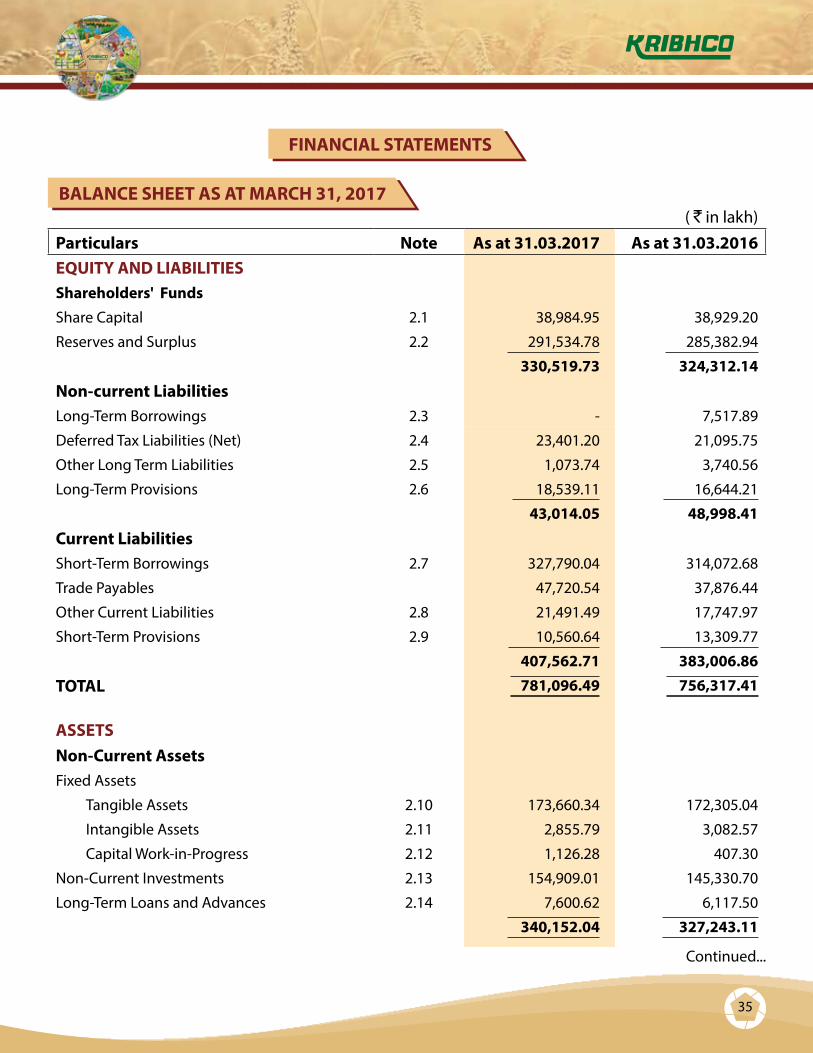
BALANCE SHEET AS AT MARCH 31, 2017( ` in lakh)
Particulars Note As at 31.03.2017 As at 31.03.2016EQUITY AND LIABILITIESShareholders' FundsShare Capital 2.1 38,984.95 38,929.20
Reserves and Surplus 2.2 291,534.78 285,382.94
330,519.73 324,312.14
Non-current LiabilitiesLong-Term Borrowings 2.3 - 7,517.89
Deferred Tax Liabilities (Net) 2.4 23,401.20 21,095.75
Other Long Term Liabilities 2.5 1,073.74 3,740.56
Long-Term Provisions 2.6 18,539.11 16,644.21
43,014.05 48,998.41
Current LiabilitiesShort-Term Borrowings 2.7 327,790.04 314,072.68
Trade Payables 47,720.54 37,876.44
Other Current Liabilities 2.8 21,491.49 17,747.97
Short-Term Provisions 2.9 10,560.64 13,309.77
407,562.71 383,006.86
TOTAL 781,096.49 756,317.41
ASSETSNon-Current AssetsFixed Assets
Tangible Assets 2.10 173,660.34 172,305.04
Intangible Assets 2.11 2,855.79 3,082.57
Capital Work-in-Progress 2.12 1,126.28 407.30
Non-Current Investments 2.13 154,909.01 145,330.70
Long-Term Loans and Advances 2.14 7,600.62 6,117.50
340,152.04 327,243.11
Continued...

36
BALANCE SHEET AS AT MARCH 31, 2017( ` in lakh)
Particulars Note As at 31.03.2017 As at 31.03.2016Current AssetsInventories 2.15 75,856.35 41,483.67
Trade Receivables 2.16 331,081.39 353,731.01
Cash and Bank Balances 2.17 6,269.81 6,998.85
Short-Term Loans and Advances 2.18 26,570.12 25,583.77
Other Current Assets 2.19 1,166.78 1,277.00
440,944.45 429,074.30
TOTAL 781,096.49 756,317.41
Significant Accounting Policies 1Notes on Accounts 2Notes referred above form an integral part of the Balance Sheet
Continued...
For and on behalf of Board of Directors
(Rajan Chowdhry) ( N. Sambasiva Rao) Finance Director Managing Director
As per our report of even dateFor G. K. Choksi & Co. For V. Sankar Aiyar & Co. For S. S. Kothari Mehta & Co
Chartered Accountants Chartered Accountants Chartered Accountants(Firm Regn. No. 101895W) (Firm Regn. No. 109208W) (Firm Regn. No. 000756N)
(Sandip A. Parikh) (R. Raghuraman) (Yogesh K. Gupta)Partner Partner Partner
M.No. 040727 M.No. 081350 M.No. 093214
Place: New DelhiDated: May 18, 2017

37
STATEMENT OF PROFIT AND LOSS FOR THE YEAR ENDED MARCH 31, 2017
( ` in lakh)
Particulars Note Year Ended 31.03.2017
Year Ended 31.03.2016
Revenue:Revenue from Operations (Net of Discounts/rebates)
662,655.17 739,614.53
Less: Excise Duty 2,681.63 3,468.92
Revenue from Operations (Net) 2.20 659,973.54 736,145.61
Other Income 2.21 8,059.09 16,768.80
Total Revenue 668,032.63 752,914.41
Expenses:Cost of Materials Consumed 2.22 318,362.61 357,578.68
Purchases of Stock in Trade 2.23 201,587.88 223,121.43
Changes in Inventories of Finished Goods, Semi-Finished, Stock-in-Process and Stock-in-Trade 2.24 (39,332.44) (13,894.38)
Employee Benefits Expense 2.25 34,519.94 32,321.03
Finance Costs 2.26 22,520.68 21,970.48
Depreciation and Amortization Expense 9,923.84 10,125.52
Other Expenses of Manufacturing, Administration, Selling and Distribution 2.27 104,987.34 94,200.48
Prior Period Items (Net) 2.28 (3,597.20) -
Total Expenses 648,972.65 725,423.24
Profit Before Tax 19,059.98 27,491.17
Tax Expense:Current Tax 4,600.00 5,200.00
Earlier Years 6.52 231.43
Deferred Tax 2,305.45 3,224.75
6,911.97 8,656.18
Profit for the year 12,148.01 18,834.99
Continued...

38
( ` in lakh)
Particulars Note Year Ended 31.03.2017
Year Ended 31.03.2016
Less: Amount Transferred to:Capital Repatriation Fund 20.00 20.00
Dividend Equalisation Fund - 2,500.00
20.00 2,520.00
Net Profit as per the Multi-State
Cooperative Societies Act 2002 12,128.01 16,314.99
Significant Accounting Policies 1
Notes on Accounts 2Notes referred above form an integral part of the Statement of Profit and Loss
STATEMENT OF PROFIT AND LOSS FOR THE YEAR ENDED MARCH 31, 2017Continued...
For and on behalf of Board of Directors
(Rajan Chowdhry) ( N. Sambasiva Rao) Finance Director Managing Director
As per our report of even dateFor G. K. Choksi & Co. For V. Sankar Aiyar & Co. For S. S. Kothari Mehta & Co.
Chartered Accountants Chartered Accountants Chartered Accountants(Firm Regn. No. 101895W) (Firm Regn. No. 109208W) (Firm Regn. No. 000756N)
(Sandip A. Parikh) (R. Raghuraman) (Yogesh K. Gupta)Partner Partner Partner
M.No. 040727 M.No. 081350 M.No. 093214
Place: New DelhiDated: May 18, 2017

39
CASH FLOW STATEMENT FOR THE YEAR ENDED MARCH 31, 2017
( ` in lakh)
Particulars Year Ended 31.03.2017
Year Ended 31.03.2016
(A) Cash Flow from Operating Activities:Net Profit Before Tax 19,059.98 27,491.17
Adjustments for:
Depreciation/Amortisation 9,923.84 10,125.52
Provision for diminution in value of inventory 456.40 6.37
Excess Provision Written Back (350.82) (346.53)
Profit/Loss on Sale of Assets (29.10) 15.45
Foreign Exchange Variation 1,272.06 1,139.47
Finance Cost 22,520.68 21,970.48
Interest income (174.61) (200.53)
Dividend Income (6,098.05) (15,052.22)
Operating Profit before working capital changes 46,580.38 45,149.18
Movements in working capital:Increase/(decrease) in liabilities and provisions 35,699.75 19,441.57
Decrease/(Increase) in trade receivables 6,145.87 (93,156.13)
Decrease/(Increase) in inventories (40,034.48) (13,379.36)
Decrease/(Increase) in Loans & Advances (7,593.23) 3,349.11
Cash generated from /(used in) operations 40,798.29 (38,595.63)
Direct Taxes paid (net of refunds) (5,311.39) (7,495.24)
Contribution to Cooperative Education Fund (163.15) (23.58)
Donations Paid (35.75) (23.10)
Net cash Flow from/ (used in) operating activities (A) 35,288.00 (46,137.55)
Continued...

40
( ` in lakh)
Particulars Year Ended 31.03.2017
Year Ended 31.03.2016
(B) Cash Flow from Investing Activities:Purchase of fixed assets (Including CWIP) (6,072.40) (4,356.18)
Proceeds from sale of fixed assets 722.61 94.64
Purchase of non-current investments (9,578.31) (10,201.47)
Interest received 368.52 343.19
Dividend received 6,098.05 16,929.95
Net cash Flow from/(used in) investing activities (B) (8,461.53) 2,810.13
(C ) Cash Flow from financing activities:Issue/Repatriation of Share Capital (Net) 55.75 (70.15)
Proceeds from long-term borrowings(Net) (9,518.46) (20,816.29)
Proceeds from short-term borrowings(net) 13,717.36 97,214.23
Interest Paid (22,801.97) (22,128.52)
Dividends paid on equity shares (7,736.13) (5,832.35)
Foreign Exchange Variation (1,272.06) (1,139.47)
Net cash flow/(used in) in financing activities (C) (27,555.51) 47,227.45
Net increase/(decrease) in cash and cash
equivalents (A+B+C) (729.04) 3,900.03
Cash and cash equivalents at the beginning of the year 6,998.85 3,098.82 Cash and cash equivalents at the end of the year 6,269.81 6,998.85 Components of Cash and cash equivalentsCash in hand 5.92 6.97
Cheques/ drafts on hand including remittances in transit 602.39 2,973.21
With banks on current account 4,924.43 3,394.28
Other bank balances 737.07 624.39
Total cash and cash equivalents 6,269.81 6,998.85
Continued...
Continued...
CASH FLOW STATEMENT FOR THE YEAR ENDED MARCH 31, 2017

41
( ` in lakh)
Particulars Year Ended 31.03.2017
Year Ended 31.03.2016
Notes:
1 Cash and Cash Equivalents consists of Cash-in-Hand, Balances with Banks and short term investments with an original maturity of three months or less. Cash and Cash Equivalents included in the cash flow statement comprise of following balance sheet amounts as per Note No 2.17Cash and Cash Equivalents 5,532.74 6,374.46 Other bank balances(*) 737.07 624.39Cash and cash equivalent as restated (Note No. 2.17) cash and bank balances 6,269.81 6,998.85*Amount which are not available for use towardsi. Unclaimed dividend 115.23 87.85 ii. Amount held as margin money and amount deposited as security with Government and other authorities. 621.84 536.54
737.07 624.39
2 Cash Flow Statement has been prepared under the indirect method as set out in the Accounting Standard (AS)-3 “Cash Flow Statements” issued by the Institute of Chartered Accountants of India.
3 Previous year’s figures have been regrouped / re- arranged wherever necessary.
Continued...
CASH FLOW STATEMENT FOR THE YEAR ENDED MARCH 31, 2017
For and on behalf of Board of Directors
(Rajan Chowdhry) ( N. Sambasiva Rao) Finance Director Managing Director
As per our report of even dateFor G. K. Choksi & Co. For V. Sankar Aiyar & Co. For S. S. Kothari Mehta & Co.
Chartered Accountants Chartered Accountants Chartered Accountants(Firm Regn. No. 101895W) (Firm Regn. No. 109208W) (Firm Regn. No. 000756N)
(Sandip A. Parikh) (R. Raghuraman) (Yogesh K. Gupta)Partner Partner Partner
M.No. 040727 M.No. 081350 M.No. 093214
Place: New DelhiDated: May 18, 2017
42
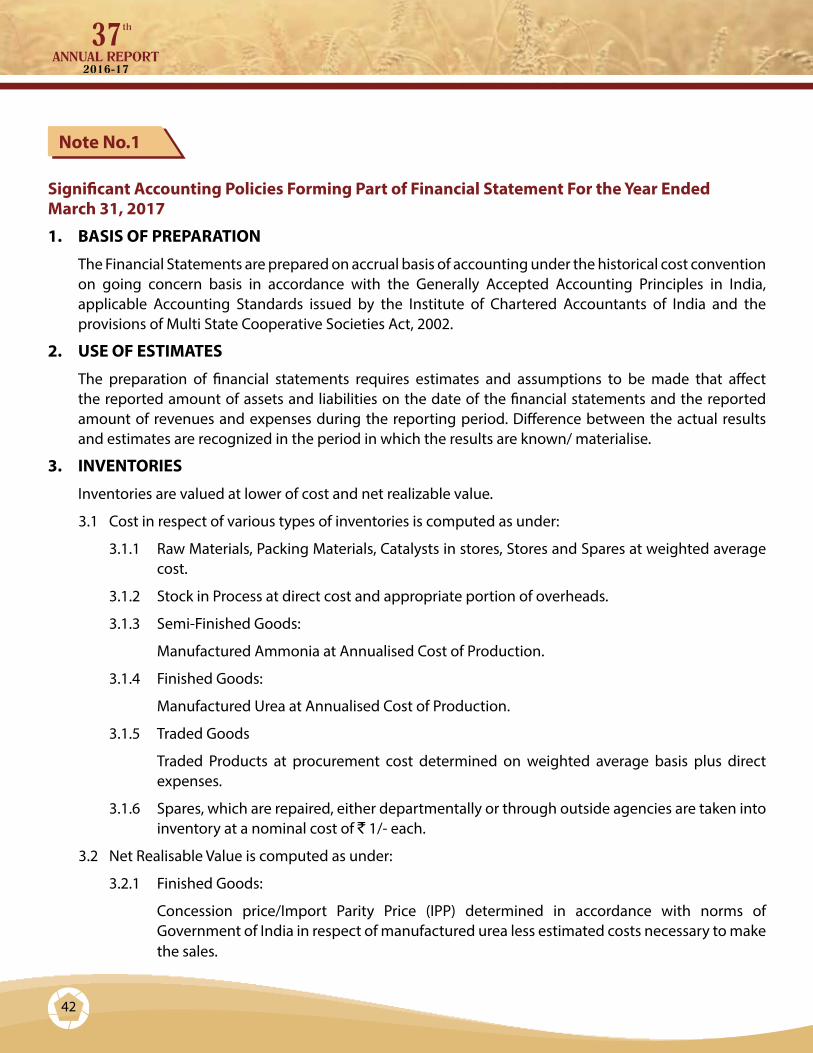
Note No.1
Significant Accounting Policies Forming Part of Financial Statement For the Year Ended March 31, 2017
1. BASIS OF PREPARATION
The Financial Statements are prepared on accrual basis of accounting under the historical cost convention on going concern basis in accordance with the Generally Accepted Accounting Principles in India, applicable Accounting Standards issued by the Institute of Chartered Accountants of India and the provisions of Multi State Cooperative Societies Act, 2002.
2. USE OF ESTIMATES
The preparation of financial statements requires estimates and assumptions to be made that affect the reported amount of assets and liabilities on the date of the financial statements and the reported amount of revenues and expenses during the reporting period. Difference between the actual results and estimates are recognized in the period in which the results are known/ materialise.
3. INVENTORIES
Inventories are valued at lower of cost and net realizable value.
3.1 Cost in respect of various types of inventories is computed as under:
3.1.1 Raw Materials, Packing Materials, Catalysts in stores, Stores and Spares at weighted average cost.
3.1.2 Stock in Process at direct cost and appropriate portion of overheads.
3.1.3 Semi-Finished Goods:
Manufactured Ammonia at Annualised Cost of Production.
3.1.4 Finished Goods:
Manufactured Urea at Annualised Cost of Production.
3.1.5 Traded Goods
Traded Products at procurement cost determined on weighted average basis plus direct expenses.
3.1.6 Spares, which are repaired, either departmentally or through outside agencies are taken into inventory at a nominal cost of ` 1/- each.
3.2 Net Realisable Value is computed as under:
3.2.1 Finished Goods:
Concession price/Import Parity Price (IPP) determined in accordance with norms of Government of India in respect of manufactured urea less estimated costs necessary to make the sales.
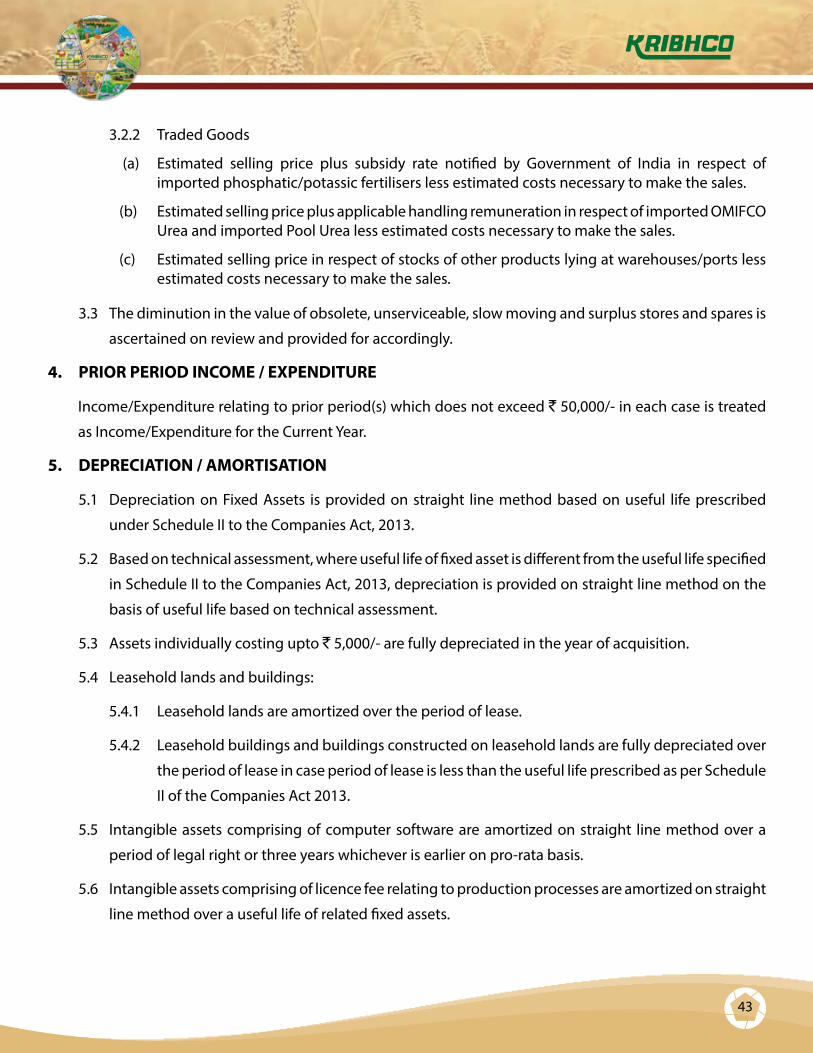
43
3.2.2 Traded Goods
(a) Estimated selling price plus subsidy rate notified by Government of India in respect of imported phosphatic/potassic fertilisers less estimated costs necessary to make the sales.
(b) Estimated selling price plus applicable handling remuneration in respect of imported OMIFCO Urea and imported Pool Urea less estimated costs necessary to make the sales.
(c) Estimated selling price in respect of stocks of other products lying at warehouses/ports less estimated costs necessary to make the sales.
3.3 The diminution in the value of obsolete, unserviceable, slow moving and surplus stores and spares is
ascertained on review and provided for accordingly.
4. PRIOR PERIOD INCOME / EXPENDITURE
Income/Expenditure relating to prior period(s) which does not exceed ` 50,000/- in each case is treated
as Income/Expenditure for the Current Year.
5. DEPRECIATION / AMORTISATION
5.1 Depreciation on Fixed Assets is provided on straight line method based on useful life prescribed
under Schedule II to the Companies Act, 2013.
5.2 Based on technical assessment, where useful life of fixed asset is different from the useful life specified
in Schedule II to the Companies Act, 2013, depreciation is provided on straight line method on the
basis of useful life based on technical assessment.
5.3 Assets individually costing upto ` 5,000/- are fully depreciated in the year of acquisition.
5.4 Leasehold lands and buildings:
5.4.1 Leasehold lands are amortized over the period of lease.
5.4.2 Leasehold buildings and buildings constructed on leasehold lands are fully depreciated over
the period of lease in case period of lease is less than the useful life prescribed as per Schedule
II of the Companies Act 2013.
5.5 Intangible assets comprising of computer software are amortized on straight line method over a
period of legal right or three years whichever is earlier on pro-rata basis.
5.6 Intangible assets comprising of licence fee relating to production processes are amortized on straight
line method over a useful life of related fixed assets.
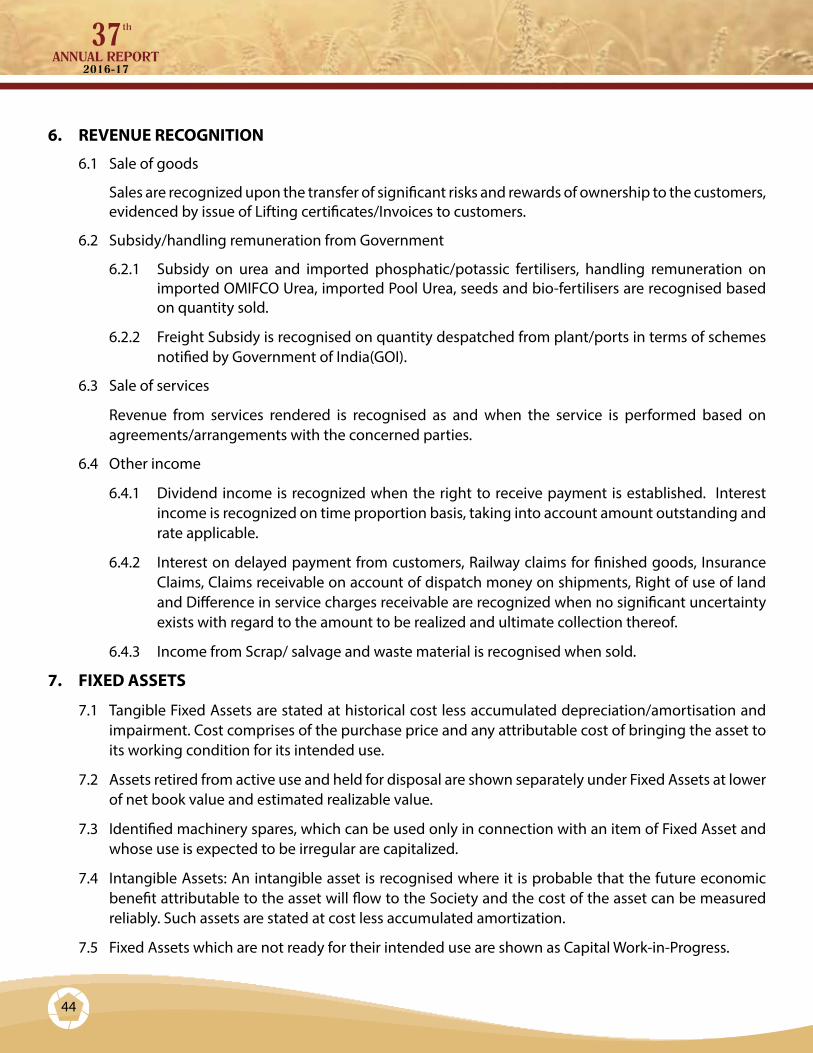
44
6. REVENUE RECOGNITION
6.1 Sale of goods
Sales are recognized upon the transfer of significant risks and rewards of ownership to the customers, evidenced by issue of Lifting certificates/Invoices to customers.
6.2 Subsidy/handling remuneration from Government
6.2.1 Subsidy on urea and imported phosphatic/potassic fertilisers, handling remuneration on imported OMIFCO Urea, imported Pool Urea, seeds and bio-fertilisers are recognised based on quantity sold.
6.2.2 Freight Subsidy is recognised on quantity despatched from plant/ports in terms of schemes notified by Government of India(GOI).
6.3 Sale of services
Revenue from services rendered is recognised as and when the service is performed based on agreements/arrangements with the concerned parties.
6.4 Other income
6.4.1 Dividend income is recognized when the right to receive payment is established. Interest income is recognized on time proportion basis, taking into account amount outstanding and rate applicable.
6.4.2 Interest on delayed payment from customers, Railway claims for finished goods, Insurance Claims, Claims receivable on account of dispatch money on shipments, Right of use of land and Difference in service charges receivable are recognized when no significant uncertainty exists with regard to the amount to be realized and ultimate collection thereof.
6.4.3 Income from Scrap/ salvage and waste material is recognised when sold.
7. FIXED ASSETS
7.1 Tangible Fixed Assets are stated at historical cost less accumulated depreciation/amortisation and impairment. Cost comprises of the purchase price and any attributable cost of bringing the asset to its working condition for its intended use.
7.2 Assets retired from active use and held for disposal are shown separately under Fixed Assets at lower of net book value and estimated realizable value.
7.3 Identified machinery spares, which can be used only in connection with an item of Fixed Asset and whose use is expected to be irregular are capitalized.
7.4 Intangible Assets: An intangible asset is recognised where it is probable that the future economic benefit attributable to the asset will flow to the Society and the cost of the asset can be measured reliably. Such assets are stated at cost less accumulated amortization.
7.5 Fixed Assets which are not ready for their intended use are shown as Capital Work-in-Progress.

45
8. FOREIGN CURRENCY TRANSACTIONS
8.1 Foreign currency transactions are recorded on initial recognition at the exchange rate prevailing on the date of the transaction. On settlement of transactions, the realized gains and losses on foreign exchange transactions are recognized in the Statement of Profit and Loss.
8.2 Foreign currency monetary items remaining unsettled at the end of the year are reported at year-end rates. The exchange rate differences arising thereof are recognized in the Statement of Profit and Loss. Non Monetary items which are carried at historical cost denominated in a foreign currency, are reported using the exchange rate at the date of the transaction.
8.3 Financial statements of Foreign branch are considered to be integral and are translated as follows:
8.3.1 Monetary assets and liabilities at rates of exchange prevailing at the end of the year.
8.3.2 Non-monetary items at exchange rates prevailing on the date of transaction.
8.3.3 Revenue items are accounted for at the exchange rate, which approximates the rate prevailing as on the date of transaction.
8.3.4 Resultant translation differences arising there from are recognized in the Statement of Profit and Loss.
8.4 In respect of forward contracts premium or discount arising at the inception of forward exchange contracts is amortised as an expense or income over the period of the contract. Forward contracts remaining unsettled at the end of the year are reported at year end rates. Any profit or loss arising on cancellation or renewal of forward exchange contracts is recognized as income or expense in the year in which such profit or loss arises.
9. GOVERNMENT GRANTS
9.1 Grants from the government are recognised when there is reasonable assurance that the grant will be received and all attaching conditions will be complied with.
9.2 When the grant relates to a revenue expenditure, it is recognised over period in which the related costs are incurred and are deducted from the related expenses.
9.3 Where the grant relates to an asset, its value is deducted in arriving at the carrying amount of the related asset.
10. INVESTMENTS
10.1 Current investments are valued at lower of cost and fair value determined on an individual assessment basis.
10.2 Long Term investments are carried at cost. Provision for diminution in the value of investments is made to recognize a decline, other than temporary, in the value of such investments.
46
11. EMPLOYEE BENEFITS
11.1 Short term Employee Benefits are recognized as an expense on an undiscounted basis in the Statement of Profit & Loss of the year in which the related service is rendered.
11.2 The Employees’ Group Gratuity Fund Scheme and Provident Fund Scheme are the Society’s defined benefit plans, which are funded by the Society, and are managed by separate trusts.
11.2.1 The present value of Society’s obligations under Gratuity Scheme is determined on the basis of actuarial valuation at the year end and the fair value of plan assets is reduced from the gross obligation under gratuity scheme, to recognize the obligation on net basis.
11.2.2 The contribution to Provident Fund and Family Pension Scheme is recognized as expense and is charged to the Statement of Profit & Loss.
The Society has an obligation to make good the shortfall, if any, between the return from the investments of Provident Fund Trust and the Notified interest rates. Liability, on account of such shortfall, if any, is recognized on the basis of actuarial valuation carried out at the year end.
11.3 The liability for other defined benefit plans such as leave encashment/ compensated absences, long service award, farewell gift and travel to home town on superannuation are recognized on the basis of an actuarial valuation made at the end of the year.
11.4 The liability for termination benefits payable in subsequent period to the employees opted for Voluntary Retirement Scheme is recognised on the basis of an actuarial valuation made at the end of the year.
11.5 The liability for contribution to Employees Superannuation Pension Scheme and Post Retirement Assistance Scheme is recognised as expense and charged to Statement of Profit and Loss.
11.6 Gains and Losses arising out of actuarial valuation are recognized immediately in the Statement of Profit and Loss.
12. BORROWING COSTS
Borrowing costs that are attributable to the acquisition or construction of qualifying assets are capitalized. All other borrowing costs are recognized as expenses in the period in which they are incurred.
13. OPERATING LEASES
Assets acquired on leases wherein a significant portion of the risks and rewards of ownership are retained by the Lessors are classified as ‘Operating Leases’. Lease rentals paid for such leases are recognised as an expense on straight line basis over the term of lease.

47
14. TAXATION
14.1 Provision for current income tax is made on the basis of assessable income as per Income Tax Act, 1961.
14.2 Deferred Tax resulting from “timing differences” between taxable income and accounting income is determined by using the tax rates and the tax laws that have been enacted or substantively enacted as on the Balance Sheet date. Deferred Tax Assets are carried forward to the extent it is reasonably/ virtually certain that future taxable profit will be available against which such Deferred Tax Assets can be realised.
15. IMPAIRMENT OF ASSETS
At each Balance Sheet date a review is made whether indication exists that asset has been impaired. In case such indication exists, an impairment loss is recognized wherever carrying amount of an asset exceeds its recoverable amount. Recoverable amount is higher of the ‘net selling price’ of assets and ‘value in use ‘.
16. PROVISIONS, CONTINGENT LIABILITIES AND CONTINGENT ASSETS
16.1 Provision is recognized when the Society has a present obligation as a result of a past event and it is probable that an outflow of resources will be required to settle the obligation and in respect of which a reliable estimate can be made. Provisions are determined based on management estimate required to settle the obligation at the balance sheet date and are not discounted to present value.
16.2 Contingent Liabilities are disclosed on the basis of judgement of the management/independent experts. These are reviewed at each balance sheet date and are adjusted to reflect the current management estimate.
16.3 Contingent Assets are neither recognized nor disclosed in the financial statements.
17. CATALYSTS
Catalysts issued are charged to revenue over their estimated useful life. Value of catalysts yet to be consumed in production process is considered as part of inventories.
18. PREPAID EXPENSES
Expenditure upto ` 25,000/- in each case, incurred in advance relating to the following year is accounted for in the year in which the expenditure is incurred.
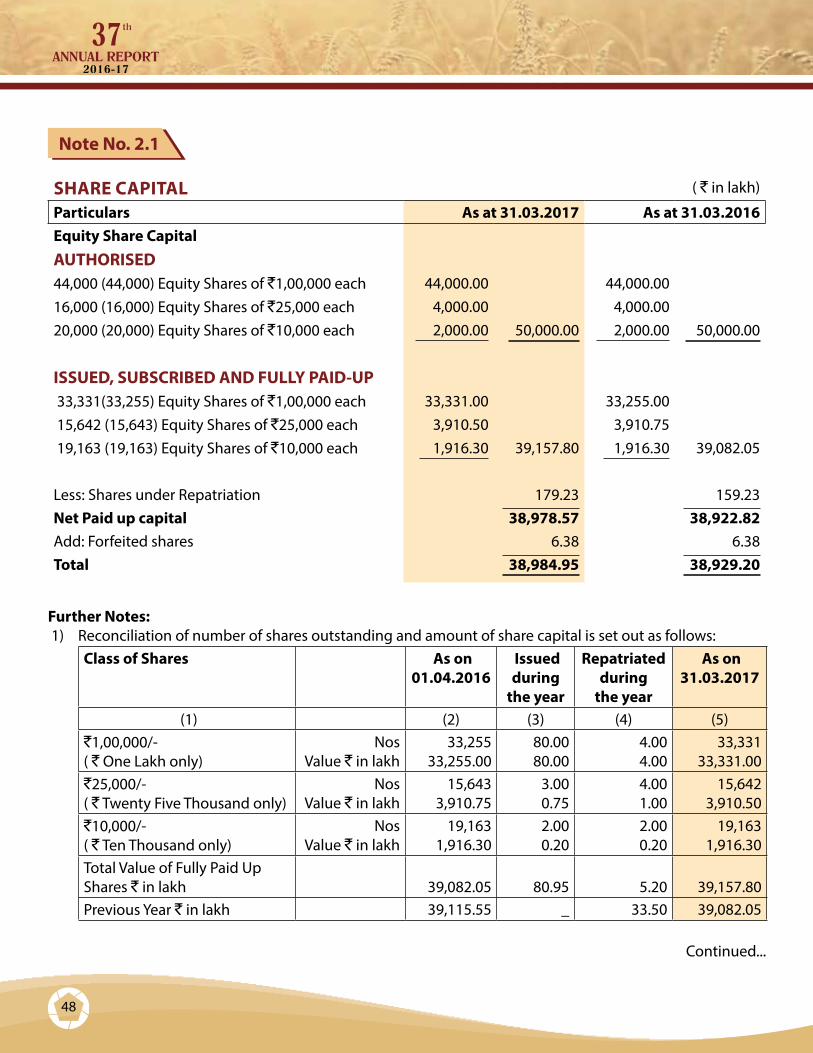
48
Note No. 2.1
SHARE CAPITAL ( ` in lakh)
Particulars As at 31.03.2017 As at 31.03.2016Equity Share CapitalAUTHORISED 44,000 (44,000) Equity Shares of `1,00,000 each 44,000.00 44,000.00 16,000 (16,000) Equity Shares of `25,000 each 4,000.00 4,000.00 20,000 (20,000) Equity Shares of `10,000 each 2,000.00 50,000.00 2,000.00 50,000.00
ISSUED, SUBSCRIBED AND FULLY PAID-UP 33,331(33,255) Equity Shares of `1,00,000 each 33,331.00 33,255.00 15,642 (15,643) Equity Shares of `25,000 each 3,910.50 3,910.75 19,163 (19,163) Equity Shares of `10,000 each 1,916.30 39,157.80 1,916.30 39,082.05
Less: Shares under Repatriation 179.23 159.23 Net Paid up capital 38,978.57 38,922.82 Add: Forfeited shares 6.38 6.38 Total 38,984.95 38,929.20
Further Notes: 1) Reconciliation of number of shares outstanding and amount of share capital is set out as follows:
Class of Shares As on 01.04.2016
Issued during
the year
Repatriated during
the year
As on 31.03.2017
(1) (2) (3) (4) (5)`1,00,000/- ( ` One Lakh only)
Nos Value ` in lakh
33,255 33,255.00
80.00 80.00
4.00 4.00
33,331 33,331.00
`25,000/- ( ` Twenty Five Thousand only)
Nos Value ` in lakh
15,643 3,910.75
3.00 0.75
4.00 1.00
15,642 3,910.50
`10,000/- ( ` Ten Thousand only)
Nos Value ` in lakh
19,163 1,916.30
2.00 0.20
2.00 0.20
19,163 1,916.30
Total Value of Fully Paid Up Shares ` in lakh 39,082.05 80.95 5.20 39,157.80 Previous Year ` in lakh 39,115.55 _ 33.50 39,082.05
Continued...
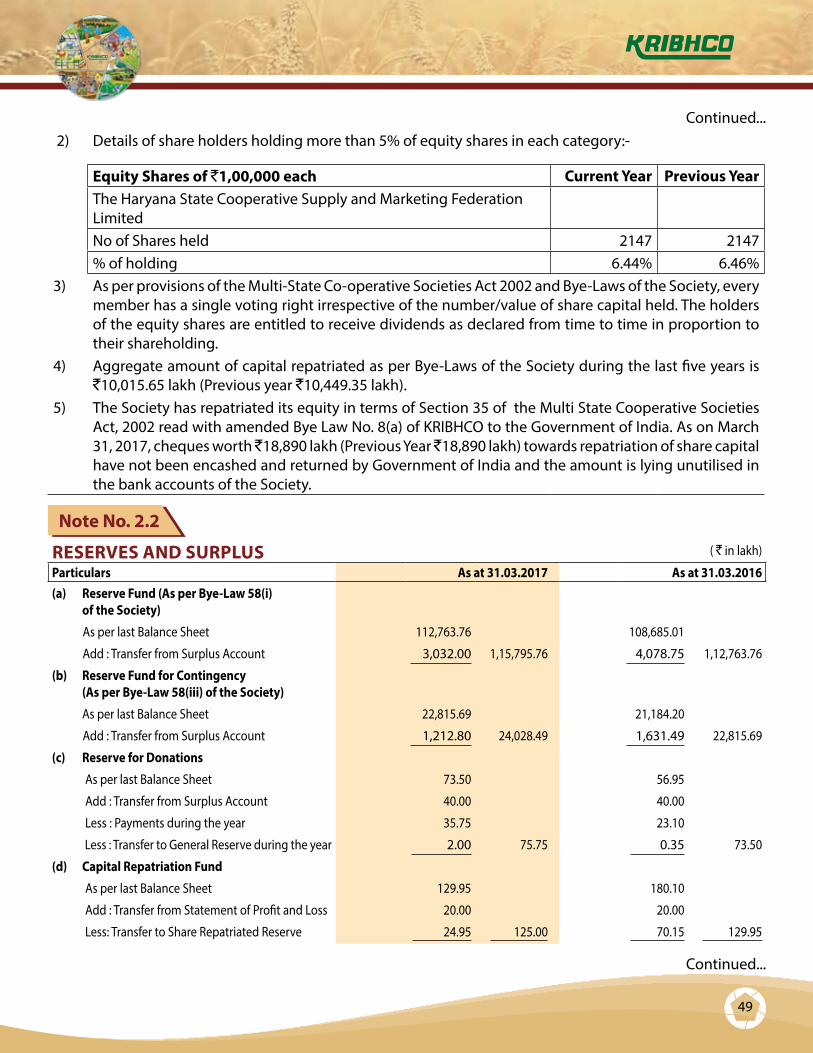
49
Note No. 2.2
RESERVES AND SURPLUS ( ` in lakh)
Particulars As at 31.03.2017 As at 31.03.2016(a) Reserve Fund (As per Bye-Law 58(i) of the Society)
As per last Balance Sheet 112,763.76 108,685.01
Add : Transfer from Surplus Account 3,032.00 1,15,795.76 4,078.75 1,12,763.76
(b) Reserve Fund for Contingency (As per Bye-Law 58(iii) of the Society)
As per last Balance Sheet 22,815.69 21,184.20
Add : Transfer from Surplus Account 1,212.80 24,028.49 1,631.49 22,815.69
(c) Reserve for Donations
As per last Balance Sheet 73.50 56.95
Add : Transfer from Surplus Account 40.00 40.00
Less : Payments during the year 35.75 23.10
Less : Transfer to General Reserve during the year 2.00 75.75 0.35 73.50
(d) Capital Repatriation Fund
As per last Balance Sheet 129.95 180.10
Add : Transfer from Statement of Profit and Loss 20.00 20.00
Less: Transfer to Share Repatriated Reserve 24.95 125.00 70.15 129.95
2) Details of share holders holding more than 5% of equity shares in each category:-
Equity Shares of `1,00,000 each Current Year Previous YearThe Haryana State Cooperative Supply and Marketing Federation LimitedNo of Shares held 2147 2147% of holding 6.44% 6.46%
3) As per provisions of the Multi-State Co-operative Societies Act 2002 and Bye-Laws of the Society, every member has a single voting right irrespective of the number/value of share capital held. The holders of the equity shares are entitled to receive dividends as declared from time to time in proportion to their shareholding.
4) Aggregate amount of capital repatriated as per Bye-Laws of the Society during the last five years is `10,015.65 lakh (Previous year `10,449.35 lakh).
5) The Society has repatriated its equity in terms of Section 35 of the Multi State Cooperative Societies Act, 2002 read with amended Bye Law No. 8(a) of KRIBHCO to the Government of India. As on March 31, 2017, cheques worth ̀ 18,890 lakh (Previous Year ̀ 18,890 lakh) towards repatriation of share capital have not been encashed and returned by Government of India and the amount is lying unutilised in the bank accounts of the Society.
Continued...
Continued...
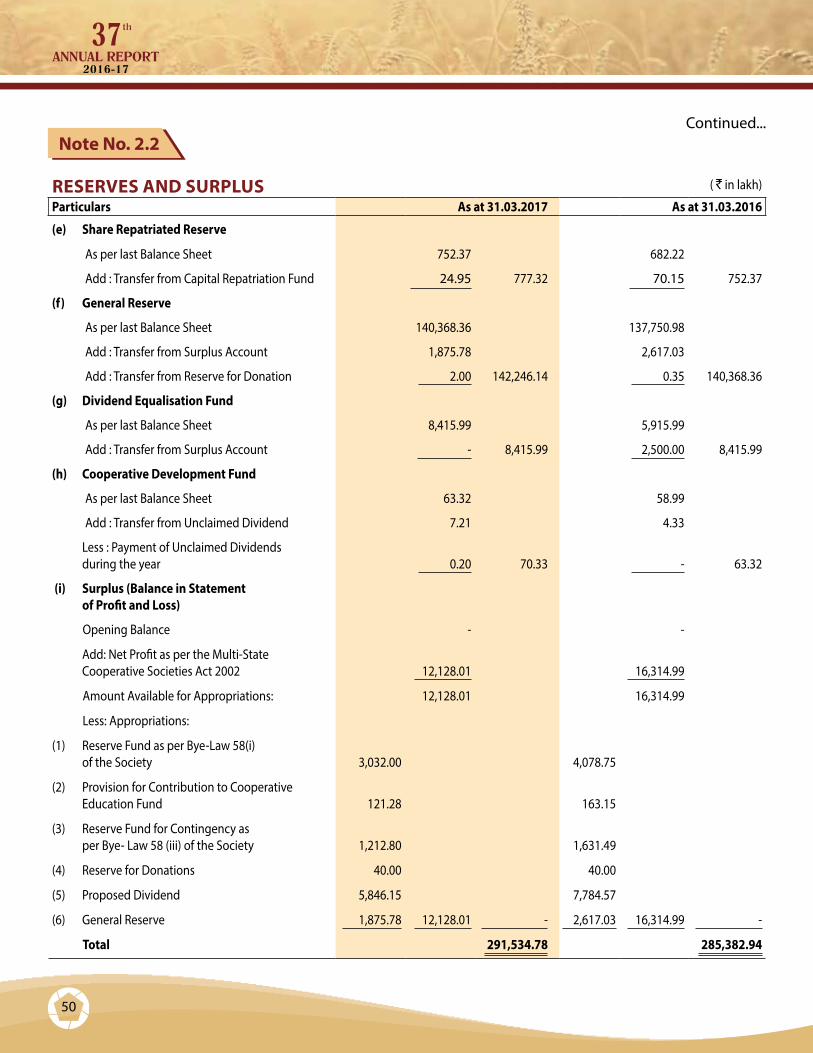
50
RESERVES AND SURPLUS ( ` in lakh)
Particulars As at 31.03.2017 As at 31.03.2016
(e) Share Repatriated Reserve
As per last Balance Sheet 752.37 682.22
Add : Transfer from Capital Repatriation Fund 24.95 777.32 70.15 752.37
(f) General Reserve
As per last Balance Sheet 140,368.36 137,750.98
Add : Transfer from Surplus Account 1,875.78 2,617.03
Add : Transfer from Reserve for Donation 2.00 142,246.14 0.35 140,368.36
(g) Dividend Equalisation Fund
As per last Balance Sheet 8,415.99 5,915.99
Add : Transfer from Surplus Account - 8,415.99 2,500.00 8,415.99
(h) Cooperative Development Fund
As per last Balance Sheet 63.32 58.99
Add : Transfer from Unclaimed Dividend 7.21 4.33
Less : Payment of Unclaimed Dividends during the year 0.20 70.33 - 63.32
(i) Surplus (Balance in Statement of Profit and Loss)
Opening Balance - -
Add: Net Profit as per the Multi-State Cooperative Societies Act 2002 12,128.01 16,314.99
Amount Available for Appropriations: 12,128.01 16,314.99
Less: Appropriations:
(1) Reserve Fund as per Bye-Law 58(i) of the Society 3,032.00 4,078.75
(2) Provision for Contribution to Cooperative Education Fund 121.28 163.15
(3) Reserve Fund for Contingency as per Bye- Law 58 (iii) of the Society 1,212.80 1,631.49
(4) Reserve for Donations 40.00 40.00
(5) Proposed Dividend 5,846.15 7,784.57
(6) General Reserve 1,875.78 12,128.01 - 2,617.03 16,314.99 -
Total 291,534.78 285,382.94
Note No. 2.2Continued...

51
LONG TERM BORROWINGS ( ` in lakh)Particulars As at 31.03.2017 As at 31.03.2016Term LoansFrom BanksSecured
Rupee Loans - 7,517.89Total - 7,517.89
Details of Security and Terms of RepaymentsCurrent Non Current Current Non Current
Loan of ` Nil (Previous Year ` 9,500.00 lakh) is secured by way of charge on the existing fixed assets of captive power plant of the Society at its Hazira Plant payable in 20 equal quarterly installments from March, 2016.
- - 2,000.00 7,500.00
Loan of ` 17.34 lakh (Previous Year ` 35.81 lakh) is secured against pledge of Fixed Deposit Receipt of ` 80.84 lakh (Previous year ` 80.84 lakh).
17.34 - 17.92 17.89
Total 17.34 - 2,017.92 7,517.89
DEFERRED TAX LIABILITIES (NET) ( ` in lakh)
Particulars As at 31.03.2017 As at 31.03.2016Deferred Tax LiabilityDifference of Book Depreciation and Tax Depreciation/ Allowance (A) 32,325.43 29,501.00Deferred Tax Assets Provision for Employees benefits allowable on payment basis 8,101.29 7,521.56 Provision for Doubtful Debts and Advances 134.74 135.56 Others 688.20 748.13 Total Deferred Tax Assets (B) 8,924.23 8,405.25
Deferred Tax Liability (Net) (A-B) 23,401.20 21,095.75
Further Notes:During the year net increase in deferred tax liability of ` 2,305.45 lakh is being recognised in the Statement of Profit & Loss (Previous Year increase of ` 3,224.75 lakh) .
Note No. 2.3
Note No. 2.4
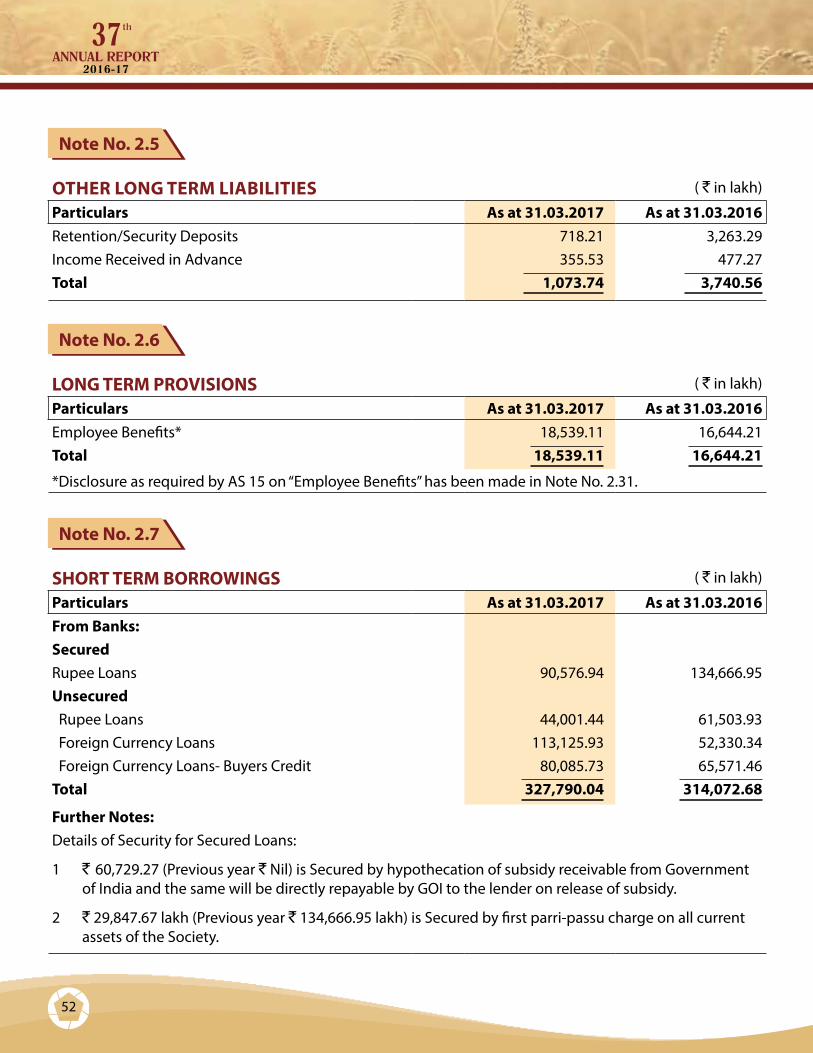
52
OTHER LONG TERM LIABILITIES ( ` in lakh)
Particulars As at 31.03.2017 As at 31.03.2016Retention/Security Deposits 718.21 3,263.29 Income Received in Advance 355.53 477.27 Total 1,073.74 3,740.56
LONG TERM PROVISIONS ( ` in lakh)
Particulars As at 31.03.2017 As at 31.03.2016Employee Benefits* 18,539.11 16,644.21 Total 18,539.11 16,644.21
*Disclosure as required by AS 15 on “Employee Benefits” has been made in Note No. 2.31.
SHORT TERM BORROWINGS ( ` in lakh)
Particulars As at 31.03.2017 As at 31.03.2016From Banks:SecuredRupee Loans 90,576.94 134,666.95 Unsecured Rupee Loans 44,001.44 61,503.93 Foreign Currency Loans 113,125.93 52,330.34 Foreign Currency Loans- Buyers Credit 80,085.73 65,571.46 Total 327,790.04 314,072.68
Further Notes:Details of Security for Secured Loans:
1 ` 60,729.27 (Previous year ` Nil) is Secured by hypothecation of subsidy receivable from Government of India and the same will be directly repayable by GOI to the lender on release of subsidy.
2 ` 29,847.67 lakh (Previous year ` 134,666.95 lakh) is Secured by first parri-passu charge on all current assets of the Society.
Note No. 2.5
Note No. 2.6
Note No. 2.7

53
OTHER CURRENT LIABILITIES ( ` in lakh)
Particulars As at 31.03.2017 As at 31.03.2016Current maturities of long term borrowings 17.34 2,017.92 Interest accrued but not due on borrowings 135.73 417.02 Income received in advance 218.77 177.97 Unpaid / Unclaimed Dividends* 167.08 125.66 Amount Payable under Forward Contract 9,340.70 4,260.78 Other Payables
Advances from customers and others 1,285.40 1,477.10 Deposits from contractors and others 3,520.92 3,347.77 Statutory Dues 1,818.66 3,337.99 Employees Dues 4,551.05 1,510.80 For Capital Goods 435.68 1,073.98 Capital Grant Received in Advance 0.16 0.98
Total 21,491.49 17,747.97
Further Notes: *Unpaid / Unclaimed Dividend represents the amounts which have not been claimed by the investors/
shareholders.
SHORT TERM PROVISIONS ( ` in lakh)
Particulars As at 31.03.2017 As at 31.03.2016Employee Benefits* 4,593.21 5,362.05 Others
Proposed Dividend 5,846.15 7,784.57 Cooperative Education Fund 121.28 163.15
Total 10,560.64 13,309.77
*Disclosure as required by AS 15 on “Employee Benefits” has been made in Note No. 2.31.
Note No. 2.8
Note No. 2.9

54
Note No. 2.10
Note No. 2.11
FIXED ASSETS -TANGIBLE ASSETS ( ` in lakh)
Particulars Gross Block Depreciation/Amortisation Net Block
As at 01.04.2016
Additions Sales Deductions /Adjustments
As at 31.03.2017
Upto 31.03.2016
For the year
Deductions on Sales
Deductions / Adjustments
Upto 31.03.2017
As at 31.03.2017
As at 31.03.2016
LAND
Freehold* 5,053.00 1,467.11 0.25 - 6,519.86 - - - - - 6,519.86 5,053.00
Leasehold 1,662.31 - - - 1,662.31 427.73 42.65 - - 470.38 1,191.93 1,234.58
Sub-total 6,715.31 1,467.11 0.25 - 8,182.17 427.73 42.65 - - 470.38 7,711.79 6,287.58
BUILDING
Freehold 15,784.12 327.31 - - 16,111.43 6,969.18 309.07 - - 7,278.25 8,833.18 8,814.94
Leasehold 1,881.20 446.58 - - 2,327.78 445.07 66.12 - - 511.19 1,816.59 1,436.13
Sub-total 17,665.32 773.89 - - 18,439.21 7,414.25 375.19 - - 7,789.44 10,649.77 10,251.07
ROADS, CULVERTS & DRAINS 3,962.30 56.41 - - 4,018.71 3,113.44 199.72 - - 3,313.16 705.55 848.86
PLANT AND EQUIPMENTS** 255,685.85 8,940.44 46.42 86.80 264,493.07 104,454.87 8,586.96 42.04 (1.16) 113,000.95 151,492.12 151,230.98
ROLLING STOCK 4,162.57 - - - 4,162.57 4,162.56 - - - 4,162.56 0.01 0.01
RAILWAY SIDINGS*** 4,206.53 - - 529.64 3,676.89 2,319.69 (9.96) - - 2,309.73 1,367.16 1,886.84
FURNITURE AND FIXTURES 1,521.70 44.76 10.22 - 1,556.24 1,229.46 59.68 5.55 - 1,283.59 272.65 292.24
VEHICLES 823.91 240.95 158.71 - 906.15 459.64 97.34 109.27 - 447.71 458.44 364.27
OFFICE EQUIPMENTS 3,045.54 198.66 63.74 - 3,180.46 2,475.49 218.97 55.49 (1.63) 2,640.60 539.86 570.05
OTHERS 1,281.68 23.65 15.79 - 1,289.54 708.54 126.51 8.50 - 826.55 462.99 573.14
Sub-total 270,727.78 9,448.46 294.88 616.44 279,264.92 115,810.25 9,079.50 220.85 (2.79) 124,671.69 154,593.23 154,917.53
Total 299,070.71 11,745.87 295.13 616.44 309,905.01 126,765.67 9,697.06 220.85 (2.79) 136,244.67 173,660.34 172,305.04
Previous year's Total 293,544.91 5,794.76 268.96 - 299,070.71 117,043.67 9,880.84 158.84 - 126,765.67 172,305.04 -
*Title deed for land acquired at Krishnapatnam for ` 2,926.90 lakh (Previous Year ` 1,459.79 lakh) is pending for execution. **Net off ` 0.82 lakh (Previous Year ` 6.69 lakh) towards capital grant received from Government.***An amount of ` 138.42 lakh (Previous Year ` 12.01 lakh ) deducted from Depreciation on Railway Siding, as a result of receipt of ONGC’s share for Upgradation.
FIXED ASSETS -INTANGIBLE ASSETS ( ` in lakh)
Particulars Gross Block Amortisation Net Block
As at 01.04.2016
Additions Sales Ded/ Adj As at 31.03.2017
Upto 31.03.2016
For the year
Ded on Sales
Ded / Adj Upto 31.03.2017
As at 31.03.2017
As at 31.03.2016
Computer Software 1,500.54 - - - 1,500.54 1,476.09 24.42 - - 1,500.51 0.03 24.45
Licence Fee 3,844.83 - - - 3,844.83 786.71 202.36 - - 989.07 2,855.76 3,058.12
Total 5,345.37 - - - 5,345.37 2,262.80 226.78 - - 2,489.58 2,855.79 3,082.57
Previous year's Total 5,348.22 2.85 - 5,345.37 2,020.97 244.68 2.85 - 2,262.80 3,082.57 -
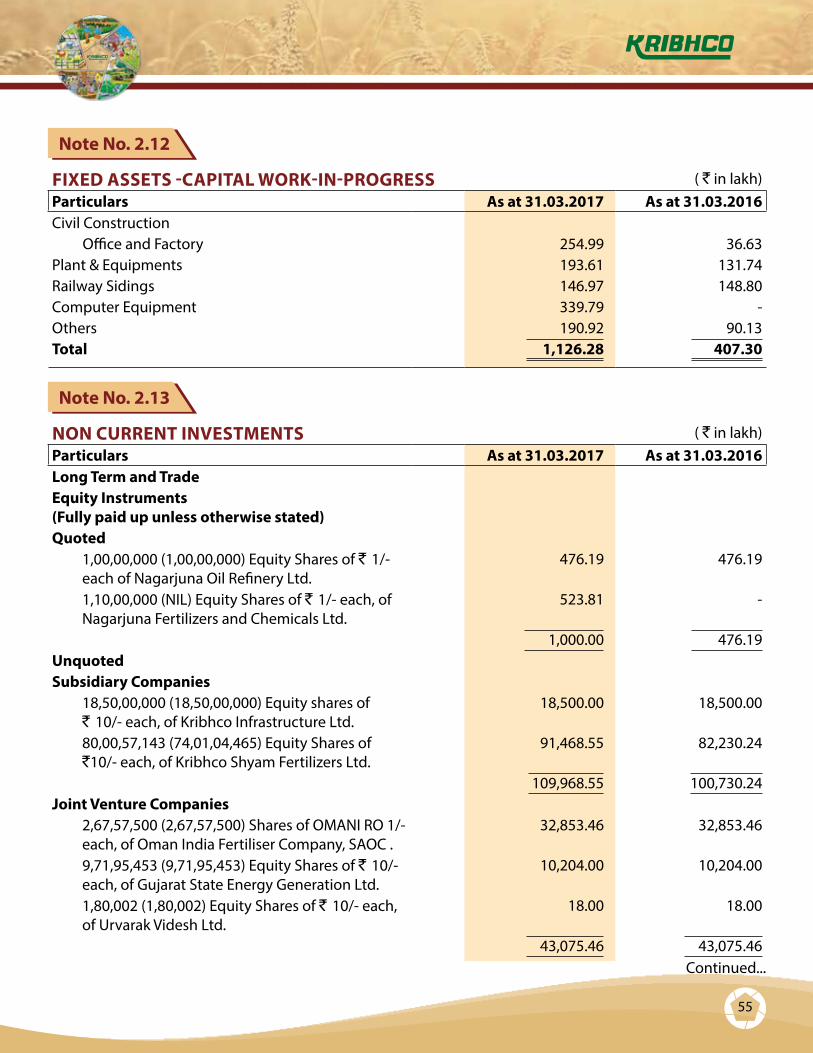
55
FIXED ASSETS -CAPITAL WORK-IN-PROGRESS ( ` in lakh)Particulars As at 31.03.2017 As at 31.03.2016Civil Construction
Office and Factory 254.99 36.63 Plant & Equipments 193.61 131.74Railway Sidings 146.97 148.80 Computer Equipment 339.79 -Others 190.92 90.13Total 1,126.28 407.30
NON CURRENT INVESTMENTS ( ` in lakh)Particulars As at 31.03.2017 As at 31.03.2016Long Term and TradeEquity Instruments (Fully paid up unless otherwise stated)Quoted 1,00,00,000 (1,00,00,000) Equity Shares of ` 1/-
each of Nagarjuna Oil Refinery Ltd. 476.19 476.19
1,10,00,000 (NIL) Equity Shares of ` 1/- each, of Nagarjuna Fertilizers and Chemicals Ltd.
523.81 -
1,000.00 476.19Unquoted Subsidiary Companies 18,50,00,000 (18,50,00,000) Equity shares of
` 10/- each, of Kribhco Infrastructure Ltd. 18,500.00 18,500.00
80,00,57,143 (74,01,04,465) Equity Shares of `10/- each, of Kribhco Shyam Fertilizers Ltd.
91,468.55 82,230.24
109,968.55 100,730.24 Joint Venture Companies 2,67,57,500 (2,67,57,500) Shares of OMANI RO 1/-
each, of Oman India Fertiliser Company, SAOC .32,853.46 32,853.46
9,71,95,453 (9,71,95,453) Equity Shares of ` 10/- each, of Gujarat State Energy Generation Ltd.
10,204.00 10,204.00
1,80,002 (1,80,002) Equity Shares of ` 10/- each, of Urvarak Videsh Ltd.
18.00 18.00
43,075.46 43,075.46
Note No. 2.12
Note No. 2.13
Continued...

56
NON CURRENT INVESTMENTS ( ` in lakh)Particulars As at 31.03.2017 As at 31.03.2016Others 1,34,00,000 (1,00,00,000) Equity Shares of ` 5/- each, of
Indian Commodity Exchange Ltd. 840.00 500.00 80 (80) Equity Shares of `25,000/- each, of National
Agricultural Cooperative Marketing Federation of India Ltd. 20.00 20.00 50 (50) Equity Shares of `10,000/- each, of Cooperative
Bank of India Ltd. 5.00 5.00 NIL (1,10,00,000) Equity Shares of `1/- each, of Nagarjuna
Fertilizers and Chemicals Ltd.(Transferred to quoted investments during the year). - 523.81
865.00 1,048.81
Total 154,909.01 145,330.70
Further Notes:1. (i) Aggregate amount of quoted investments 1,000.00 476.19 (ii) Market value of quoted investments 2,410.00 370.00 (iii) Aggregate amount of un-quoted investments 153,909.01 144,854.51 2. Investments have been valued as per Accounting Policy No. 10 disclosed in Note No. 1 to the financial statements.3. Figures in brackets relates to previous year.
LONG TERM LOANS AND ADVANCES(Unsecured Considered good, unless otherwise stated) ( ` in lakh)Particulars As at 31.03.2017 As at 31.03.2016Capital Advances 266.00 2,091.34Security Deposits 16.12 12.96Loans:Employees (including interest accrued)
Secured 3,572.93 3,999.98Un-Secured 4.98 3,577.91 12.22 4,012.20
Recoverable towards Employee Benefits from HAEP 3,740.09 -
Others 0.50 1.00
Total 7,600.62 6,117.50
Note No. 2.13
Note No. 2.14
Continued...
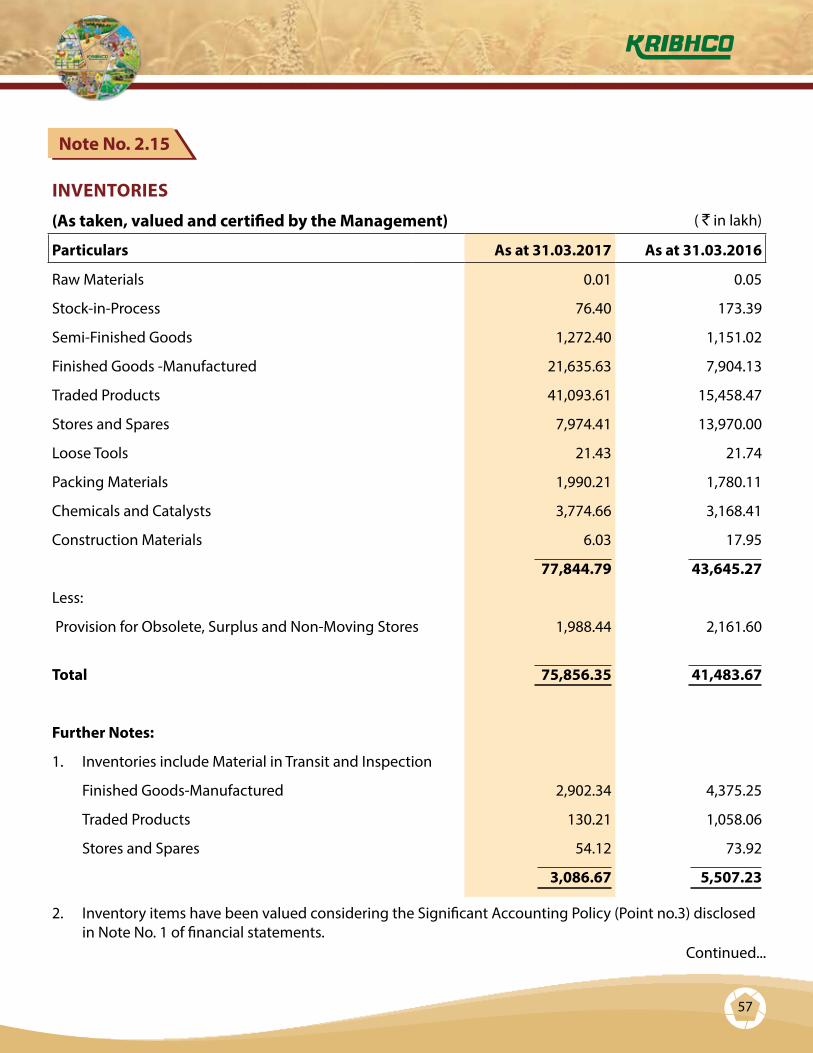
57
INVENTORIES
(As taken, valued and certified by the Management) ( ` in lakh)
Particulars As at 31.03.2017 As at 31.03.2016
Raw Materials 0.01 0.05
Stock-in-Process 76.40 173.39
Semi-Finished Goods 1,272.40 1,151.02
Finished Goods -Manufactured 21,635.63 7,904.13
Traded Products 41,093.61 15,458.47
Stores and Spares 7,974.41 13,970.00
Loose Tools 21.43 21.74
Packing Materials 1,990.21 1,780.11
Chemicals and Catalysts 3,774.66 3,168.41
Construction Materials 6.03 17.95
77,844.79 43,645.27
Less:
Provision for Obsolete, Surplus and Non-Moving Stores 1,988.44 2,161.60
Total 75,856.35 41,483.67
Further Notes:
1. Inventories include Material in Transit and Inspection
Finished Goods-Manufactured 2,902.34 4,375.25
Traded Products 130.21 1,058.06
Stores and Spares 54.12 73.92
3,086.67 5,507.23
2. Inventory items have been valued considering the Significant Accounting Policy (Point no.3) disclosed in Note No. 1 of financial statements.
Note No. 2.15
Continued...
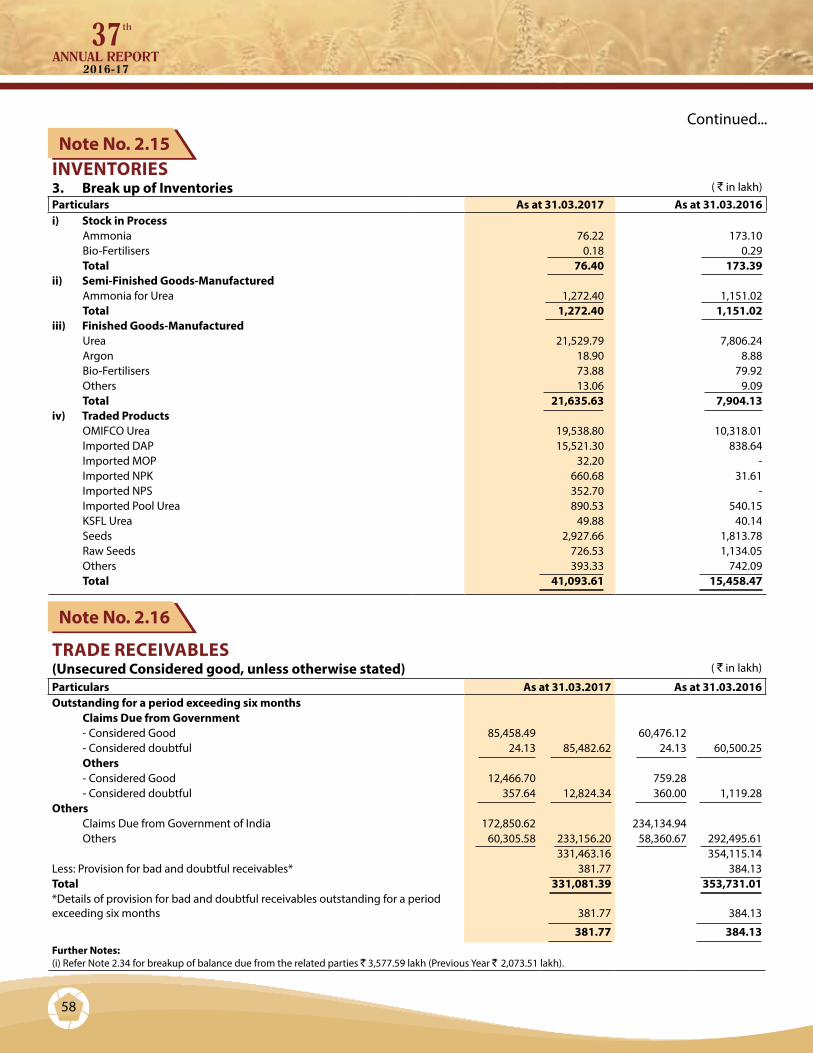
58
INVENTORIES3. Break up of Inventories ( ` in lakh)Particulars As at 31.03.2017 As at 31.03.2016i) Stock in Process
Ammonia 76.22 173.10 Bio-Fertilisers 0.18 0.29 Total 76.40 173.39
ii) Semi-Finished Goods-ManufacturedAmmonia for Urea 1,272.40 1,151.02 Total 1,272.40 1,151.02
iii) Finished Goods-ManufacturedUrea 21,529.79 7,806.24 Argon 18.90 8.88 Bio-Fertilisers 73.88 79.92 Others 13.06 9.09 Total 21,635.63 7,904.13
iv) Traded ProductsOMIFCO Urea 19,538.80 10,318.01 Imported DAP 15,521.30 838.64 Imported MOP 32.20 - Imported NPK 660.68 31.61 Imported NPS 352.70 - Imported Pool Urea 890.53 540.15 KSFL Urea 49.88 40.14 Seeds 2,927.66 1,813.78 Raw Seeds 726.53 1,134.05 Others 393.33 742.09 Total 41,093.61 15,458.47
Note No. 2.15
Note No. 2.16
TRADE RECEIVABLES(Unsecured Considered good, unless otherwise stated) ( ` in lakh)
Particulars As at 31.03.2017 As at 31.03.2016Outstanding for a period exceeding six months
Claims Due from Government- Considered Good 85,458.49 60,476.12 - Considered doubtful 24.13 85,482.62 24.13 60,500.25 Others- Considered Good 12,466.70 759.28 - Considered doubtful 357.64 12,824.34 360.00 1,119.28
Others Claims Due from Government of India 172,850.62 234,134.94 Others 60,305.58 233,156.20 58,360.67 292,495.61
331,463.16 354,115.14 Less: Provision for bad and doubtful receivables* 381.77 384.13 Total 331,081.39 353,731.01 *Details of provision for bad and doubtful receivables outstanding for a period exceeding six months 381.77 384.13
381.77 384.13 Further Notes: (i) Refer Note 2.34 for breakup of balance due from the related parties ` 3,577.59 lakh (Previous Year ` 2,073.51 lakh).
Continued...

59
Note No. 2.18
SHORT TERM LOANS AND ADVANCES(Unsecured considered good, unless otherwise stated) ( ` in lakh)Particulars As at 31.03.2017 As at 31.03.2016LOANSRelated Parties 50.00 -Employees (including interest accrued)
Secured 859.70 941.77 Un-Secured 0.83 860.53 1.82 943.59 Sub Total 910.53 943.59
ADVANCESRelated Parties 0.31 0.01 Employees 227.30 227.47 Contractors & Suppliers, including material issued on loan
UnsecuredConsidered Good 7,928.06 8,384.64 Considered Doubtful 7.54 7,935.60 7.54 8,392.18
Balance with Revenue Authorities 1,317.84 757.98
CASH & BANK BALANCES ( ` in lakh)Particulars As at 31.03.2017 As at 31.03.2016Cash and Cash Equivalents -Balances with banks -Current/Cash Credit Accounts 4,924.43 3,394.28 -Remittances-in-transit - 1,162.18 -Cheques & drafts on hand 602.39 1,811.03 -Cash in hand 5.92 6.97
-Other Bank Balances -Others* 737.07 624.39 Total 6,269.81 6,998.85
Further Notes: *Not available for use and includes -Unpaid/Unclaimed dividend account balance 115.23 87.85 -Amount held as margin money, Security against borrowings and Other Commitments 621.84 536.54
Note No. 2.17
Continued...

60
SHORT TERM LOANS AND ADVANCES(Unsecured considered good, unless otherwise stated) ( ` in lakh)Particulars As at 31.03.2017 As at 31.03.2016Income Tax Advance including TDS (Net of provision of ` 16,718.70 (Previous Year ` 12,118.70 lakh)) 15,065.33 14,360.46
Recoverable towards Employee Benefits from HAEP 179.51 -Others 941.24 909.62
25,667.13 24,647.72 Less: Provision for bad & doubtful advances 7.54 7.54 Sub Total 25,659.59 24,640.18
Total 26,570.12 25,583.77
Further Notes:(i) Refer Note 2.34 for breakup of balance outstanding for Loans and Advances due from related parties
` 50 lakh and ` 0.31 lakh respectively (Previous Year ` Nil and ` 0.01 lakh respectively).
(ii) The advance to contractors and suppliers of ` 7,928.06 lakh (Previous Year ` 8,384.64 lakh) includes a sum of ` 4,134.28 lakh (Previous Year ` 4,134.28 lakh) towards debit note raised for amount recoverable from an entity of Govt. of People’s Republic of China on account of loss of subsidy consequent to DAP cargo supplied by them having declared “non-standard” in the year 2013-2014 by Govt. of India and the same has been considered good in view of unconditional acceptance of terms and conditions of purchase order and acknowledgement of Debit note by the said supplier, which is as per the legal opinion amounts to acceptance of claim. Though the dispute is pending in Arbitrational Tribunal but the management and the independent legal advisor believes that the said sum is recoverable by the society. The recoverable amount in foreign currency has been freezed in Indian Rupees on transaction date due to ongoing arbitration.
OTHER CURRENT ASSETS ( ` in lakh)
Particulars As at 31.03.2017 As at 31.03.2016Interest Accrued but not due: Term Deposits 25.10 27.77 Deferred Premium of Forward Contract 1,141.68 1,249.23
Total 1,166.78 1,277.00
Note No. 2.18
Note No. 2.19
Continued...
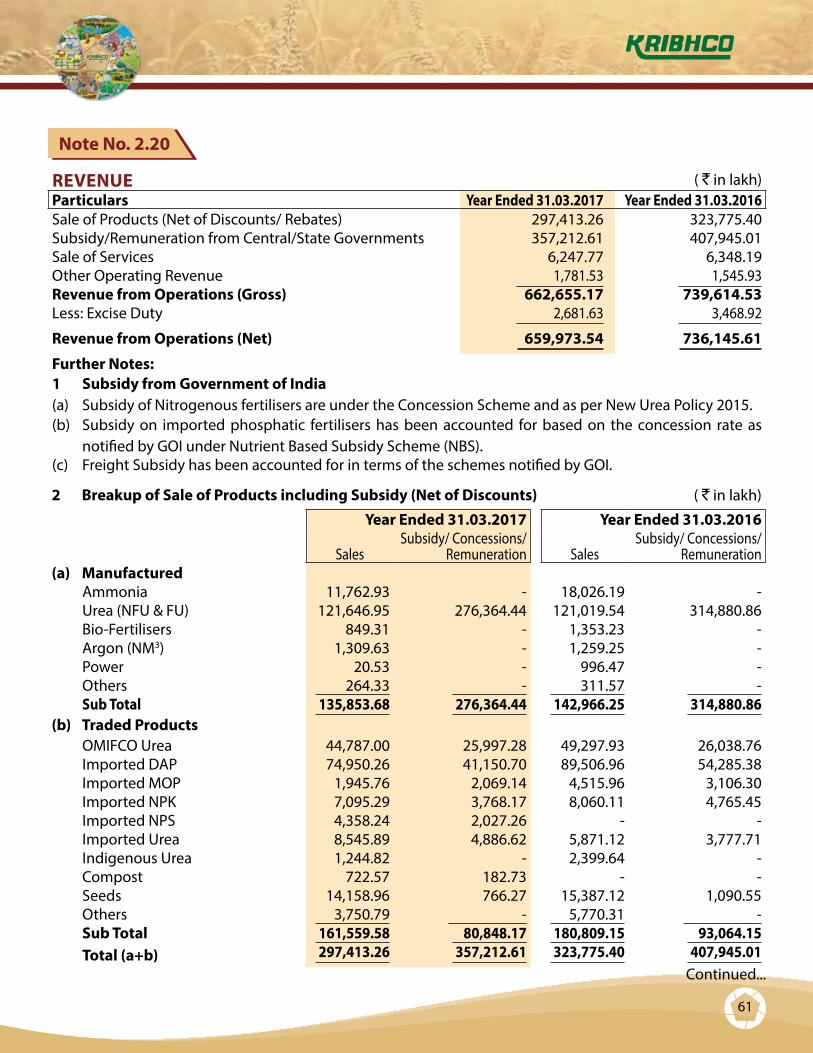
61
REVENUE ( ` in lakh)Particulars Year Ended 31.03.2017 Year Ended 31.03.2016Sale of Products (Net of Discounts/ Rebates) 297,413.26 323,775.40 Subsidy/Remuneration from Central/State Governments 357,212.61 407,945.01 Sale of Services 6,247.77 6,348.19 Other Operating Revenue 1,781.53 1,545.93 Revenue from Operations (Gross) 662,655.17 739,614.53 Less: Excise Duty 2,681.63 3,468.92
Revenue from Operations (Net) 659,973.54 736,145.61
Further Notes:1 Subsidy from Government of India (a) Subsidy of Nitrogenous fertilisers are under the Concession Scheme and as per New Urea Policy 2015.(b) Subsidy on imported phosphatic fertilisers has been accounted for based on the concession rate as
notified by GOI under Nutrient Based Subsidy Scheme (NBS).(c) Freight Subsidy has been accounted for in terms of the schemes notified by GOI.
2 Breakup of Sale of Products including Subsidy (Net of Discounts) ( ` in lakh)
Year Ended 31.03.2017 Year Ended 31.03.2016
SalesSubsidy/ Concessions/
Remuneration SalesSubsidy/ Concessions/
Remuneration(a) Manufactured
Ammonia 11,762.93 - 18,026.19 - Urea (NFU & FU) 121,646.95 276,364.44 121,019.54 314,880.86 Bio-Fertilisers 849.31 - 1,353.23 - Argon (NM3) 1,309.63 - 1,259.25 - Power 20.53 - 996.47 - Others 264.33 - 311.57 - Sub Total 135,853.68 276,364.44 142,966.25 314,880.86
(b) Traded ProductsOMIFCO Urea 44,787.00 25,997.28 49,297.93 26,038.76 Imported DAP 74,950.26 41,150.70 89,506.96 54,285.38 Imported MOP 1,945.76 2,069.14 4,515.96 3,106.30 Imported NPK 7,095.29 3,768.17 8,060.11 4,765.45 Imported NPS 4,358.24 2,027.26 - -Imported Urea 8,545.89 4,886.62 5,871.12 3,777.71 Indigenous Urea 1,244.82 - 2,399.64 - Compost 722.57 182.73 - - Seeds 14,158.96 766.27 15,387.12 1,090.55 Others 3,750.79 - 5,770.31 - Sub Total 161,559.58 80,848.17 180,809.15 93,064.15 Total (a+b) 297,413.26 357,212.61 323,775.40 407,945.01
Note No. 2.20
Continued...

62
REVENUE ( ` in lakh)Particulars Year Ended 31.03.2017 Year Ended 31.03.20163 Breakup of Sale of Services
Service Charges from HAEP 2,257.68 2,032.77 Urea Sales Fee from OMIFCO 2,469.40 2,496.94 TSA/PSA from OMIFCO 101.00 171.08 Marketing Service Charges from KSFL 1,083.66 1,159.59 Leave and License Fee from KRIL 316.97 299.73 Deputation Services/Others 0.08 149.97 Lease of Wagons to Railways 18.98 38.11 Total 6,247.77 6,348.19
4 Breakup of Other Operating RevenueRecovery from Employees 115.28 115.79 Despatch Money 96.75 112.12 Insurance Claims Received 1,159.82 728.02
Claims/Recoveries from contractors & Others (including ` 222.06 lakh (Previous Year ` 212.03 lakh) from HAEP for use of Public services) 409.68 590.00
Total 1,781.53 1,545.93
Note No. 2.20
OTHER INCOME ( ` in lakh)
Particulars Year Ended 31.03.2017 Year Ended 31.03.2016Interest
From Employees 139.36 159.84 From Indian Banks 27.40 36.02 From Others 7.85 174.61 4.67 200.53
Dividend From non current investments-Trade
Joint Ventures 6,097.90 15,052.07 Others 0.15 6,098.05 0.15 15,052.22
Other Non-Operating IncomeProfit on disposal/retirement of fixed assets 62.23 6.27 Lease and Equipment hire charges 1.25 4.05 Rental Income 672.24 626.24 Sale of Scrap and Other items 137.85 238.14 Penalties & Liquidated damages 128.61 196.82 Excess Provision Written back/Unclaimed Amount (Net) 350.82 346.53 Income towards Employee Benefits from HAEP 315.45 - Others 117.98 98.00
Total 8,059.09 16,768.80
Note No. 2.21
Continued...

63
COST OF MATERIALS CONSUMED ( ` in lakh)
Particulars Year Ended 31.03.2017 Year Ended 31.03.2016Raw Materials 243,722.32 282,894.62 Packing Materials 13,973.56 13,078.61 Chemicals and Catalysts* 3,455.67 3,297.73 Power, Fuel and Water 57,211.06 58,307.72 Total 318,362.61 357,578.68 Further Notes:1 Breakup of Raw Materials Natural Gas 243,722.28 282,891.54 Others 0.04 3.08 Total 243,722.32 282,894.62 2 Break up of Power, Fuel and Water Power 3,664.52 3,087.94 Fuel (Boiler Gas) 51,019.23 53,138.31 Water Charges 2,527.31 2,081.47
Total 57,211.06 58,307.72
*Net off ` NIL (Previous Year ` 0.36 lakh) towards grant received from Government.
PURCHASES OF STOCK-IN-TRADE ( ` in lakh)Particulars Year Ended 31.03.2017 Year Ended 31.03.2016OMIFCO Urea 50,697.35 55,628.77 Imported DAP/ DAP Lite 107,967.25 123,966.66 Imported MOP 3,466.75 6,370.43 Imported NPK 8,599.30 10,919.22 Imported NPS 5,726.60 - Imported Urea 8,492.13 6,047.60 Imported Water Soluble Fertilisers - 1,881.77 Indigenous Urea 1,196.19 2,409.31 Other Indigenous Fertilisers 3,889.11 3,514.48 Seeds, Chemicals and Other Products 11,553.20 12,383.19 Total 201,587.88 223,121.43
Note No. 2.22
Note No. 2.23

64
CHANGES IN INVENTORIES OF FINISHED GOODS, SEMI-FINISHED GOODS, STOCK-IN-PROCESS AND STOCK-IN-TRADE ( ` in lakh)
Particulars Year Ended 31.03.2017 Year Ended 31.03.2016Opening Stock:
Stock-in-Process 173.39 78.05 Semi Finished Goods 1,151.02 1,789.11 Finished Goods-Manufactured 7,904.13 3,299.79 Stock-in-Trade 15,458.47 24,687.01 5,612.85 10,779.80
Closing Stock:Stock-in-Process 76.40 173.39 Semi Finished Goods 1,272.40 1,151.02 Finished Goods-Manufactured 21,635.63 7,904.13 Stock-in-Trade 41,093.61 64,078.04 15,458.47 24,687.01
(Accretion)/Decretion in inventory (39,391.03) (13,907.21)Less: Excise Duty included in change in inventories (58.59) (12.83)
Net (Accretion)/Decretion (39,332.44) (13,894.38)
EMPLOYEE BENEFITS EXPENSE ( ` in lakh)Particulars Year Ended 31.03.2017 Year Ended 31.03.2016Salaries and Wages 28,480.53 26,291.75Contribution to Provident and Other Funds 3,698.91 3,789.72Staff Welfare Expenses 2,340.50 2,239.56Total 34,519.94 32,321.03
FINANCE COSTS ( ` in lakh)Particulars Year Ended 31.03.2017 Year Ended 31.03.2016Interest on :Rupee Term Loans 218.09 2,300.05 Foreign Currency Short Term Loans 7,871.99 2,290.35 Cash Credit and Short Term Loans 9,727.49 13,703.78 Buyer's Credit 4,701.85 1,365.85 Others 1.26 0.95
22,520.68 19,660.98Exchange differences regarded asadjustment to interest cost - 2,309.50
- 2,309.50 Total 22,520.68 21,970.48
Note No. 2.24
Note No. 2.25
Note No. 2.26
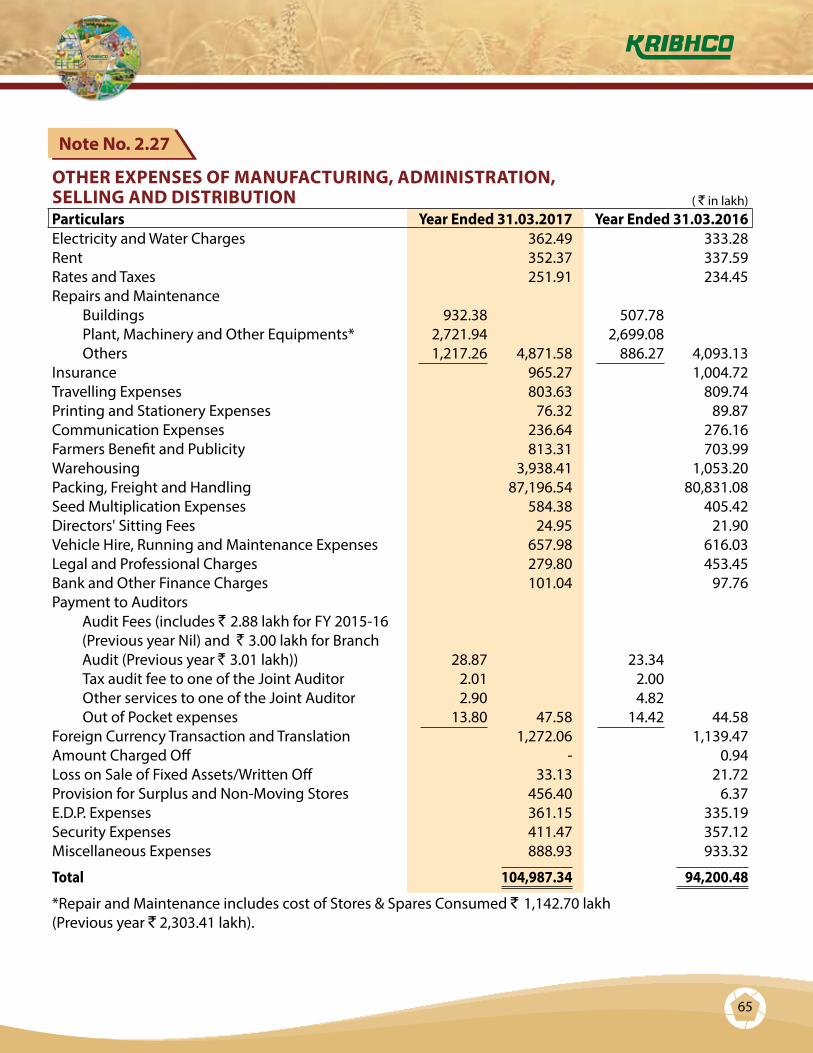
65
OTHER EXPENSES OF MANUFACTURING, ADMINISTRATION, SELLING AND DISTRIBUTION ( ` in lakh)Particulars Year Ended 31.03.2017 Year Ended 31.03.2016Electricity and Water Charges 362.49 333.28 Rent 352.37 337.59 Rates and Taxes 251.91 234.45 Repairs and Maintenance
Buildings 932.38 507.78 Plant, Machinery and Other Equipments* 2,721.94 2,699.08 Others 1,217.26 4,871.58 886.27 4,093.13
Insurance 965.27 1,004.72 Travelling Expenses 803.63 809.74 Printing and Stationery Expenses 76.32 89.87 Communication Expenses 236.64 276.16 Farmers Benefit and Publicity 813.31 703.99 Warehousing 3,938.41 1,053.20 Packing, Freight and Handling 87,196.54 80,831.08 Seed Multiplication Expenses 584.38 405.42 Directors' Sitting Fees 24.95 21.90 Vehicle Hire, Running and Maintenance Expenses 657.98 616.03 Legal and Professional Charges 279.80 453.45 Bank and Other Finance Charges 101.04 97.76 Payment to Auditors Audit Fees (includes ` 2.88 lakh for FY 2015-16
(Previous year Nil) and ` 3.00 lakh for Branch Audit (Previous year ` 3.01 lakh)) 28.87 23.34 Tax audit fee to one of the Joint Auditor 2.01 2.00 Other services to one of the Joint Auditor 2.90 4.82 Out of Pocket expenses 13.80 47.58 14.42 44.58
Foreign Currency Transaction and Translation 1,272.06 1,139.47 Amount Charged Off - 0.94 Loss on Sale of Fixed Assets/Written Off 33.13 21.72 Provision for Surplus and Non-Moving Stores 456.40 6.37 E.D.P. Expenses 361.15 335.19 Security Expenses 411.47 357.12 Miscellaneous Expenses 888.93 933.32
Total 104,987.34 94,200.48
*Repair and Maintenance includes cost of Stores & Spares Consumed ` 1,142.70 lakh (Previous year ` 2,303.41 lakh).
Note No. 2.27
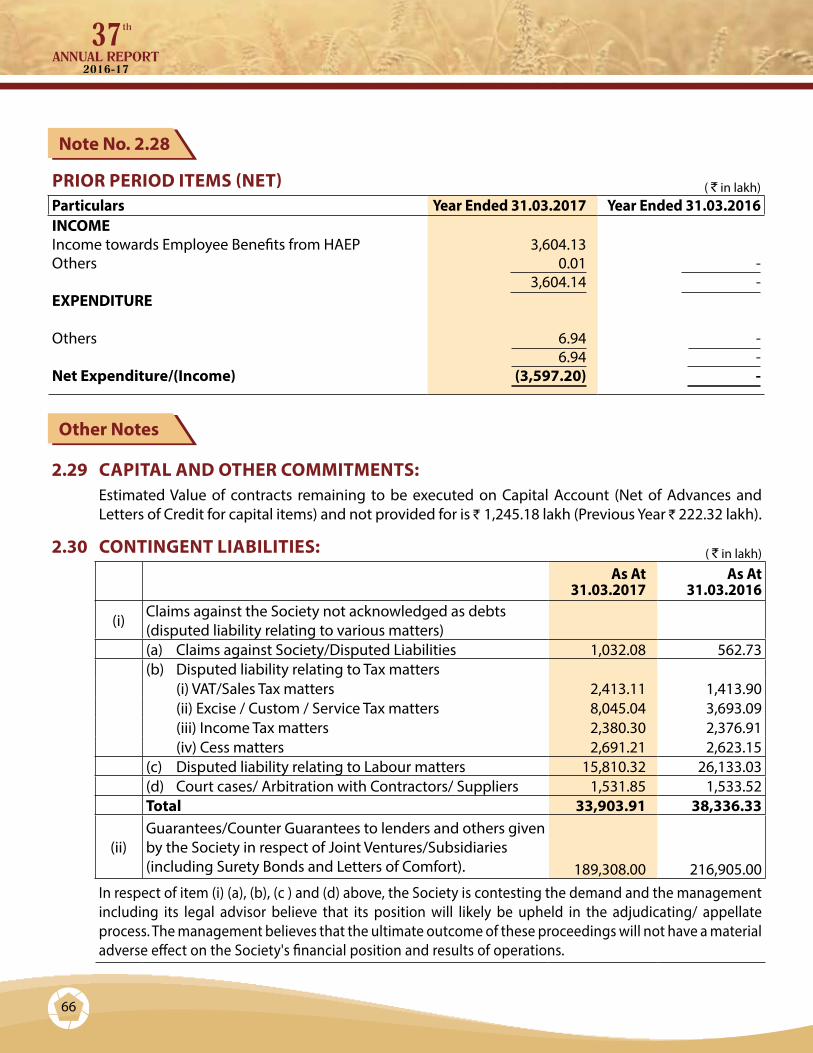
66
PRIOR PERIOD ITEMS (NET) ( ` in lakh)Particulars Year Ended 31.03.2017 Year Ended 31.03.2016INCOMEIncome towards Employee Benefits from HAEP 3,604.13 Others 0.01 -
3,604.14 - EXPENDITURE
Others 6.94 - 6.94 -
Net Expenditure/(Income) (3,597.20) -
2.29 CAPITAL AND OTHER COMMITMENTS:Estimated Value of contracts remaining to be executed on Capital Account (Net of Advances and Letters of Credit for capital items) and not provided for is ` 1,245.18 lakh (Previous Year ` 222.32 lakh).
2.30 CONTINGENT LIABILITIES: ( ` in lakh)
As At 31.03.2017
As At 31.03.2016
(i) Claims against the Society not acknowledged as debts (disputed liability relating to various matters)(a) Claims against Society/Disputed Liabilities 1,032.08 562.73 (b) Disputed liability relating to Tax matters (i) VAT/Sales Tax matters 2,413.11 1,413.90 (ii) Excise / Custom / Service Tax matters 8,045.04 3,693.09 (iii) Income Tax matters 2,380.30 2,376.91 (iv) Cess matters 2,691.21 2,623.15 (c) Disputed liability relating to Labour matters 15,810.32 26,133.03 (d) Court cases/ Arbitration with Contractors/ Suppliers 1,531.85 1,533.52 Total 33,903.91 38,336.33
(ii)Guarantees/Counter Guarantees to lenders and others given by the Society in respect of Joint Ventures/Subsidiaries (including Surety Bonds and Letters of Comfort). 189,308.00 216,905.00
In respect of item (i) (a), (b), (c ) and (d) above, the Society is contesting the demand and the management including its legal advisor believe that its position will likely be upheld in the adjudicating/ appellate process. The management believes that the ultimate outcome of these proceedings will not have a material adverse effect on the Society's financial position and results of operations.
Note No. 2.28
Other Notes

67
2.31 EMPLOYEE BENEFITS:2.31.1 Disclosures as required under Accounting Standard 15 (Revised) “Employee Benefits”, issued
by the Institute of Chartered Accountants of India, in respect of Defined Benefit Obligations are as under:-
(a) The principal actuarial assumptions used are as below –
Year Ended 31.03.2017
Year Ended 31.03.2016
(i) Method Used Projected Unit Credit Method
(ii) Discount Rate 7.00% 7.75%
(iii)Expected rate of return on Plan Assets-Gratuity Fund 8.40% 9.15%
(iv)Expected rate of increase in Compensation Level 6.25% 6.25%
The estimate of future salary increase considered in actuarial valuation, take account of inflation, seniority, promotion and other relevant factors, such as supply and demand in the employment market.
(b) Changes in the present value of the obligations - ( ` in lakh)
Gratuity Leave Encashment / Compensated Absences
(Funded) (Unfunded)
Year Ended 31.03.2017
Year Ended 31.03.2016
Year Ended 31.03.2017
Year Ended 31.03.2016
Present Value of Obligations as at beginning of year 22,435.48 21,247.57 19,888.60 18,015.85
Interest Cost 1,738.75 1,651.20 1,541.36 1,400.05
Current Service Cost 934.31 900.79 912.50 857.04
Benefits Paid (1,739.01) (1,950.82) (2,078.53) (2,378.78)
Actuarial Loss on Obligations 80.14 586.74 284.07 1,994.44
Present Value of Obligations as at end of the year 23,449.67 22,435.48 20,548.00 19,888.60

68
(c) Changes in the fair value of the plan assets -( ` in lakh)
Gratuity Leave Encashment / Compensated Absences
(Funded) (Unfunded)
Year Ended 31.03.2017
Year Ended 31.03.2016
Year Ended 31.03.2017
Year Ended 31.03.2016
Fair Value of Plan Assets as at beginning of the year 21,377.78 19,328.59 - -
Actual return on Plan Assets 1,599.02 1,923.18 - -
Employers’ Contribution 733.09 2,076.83 - -
Benefits Paid (1,739.01) (1,950.82) - -
Fair Value of Plan Assets as at end of the year* 21,970.88 21,377.78 - -
*Gratuity Fund is managed by Life Insurance Corporation of India (LIC). Individual investment-wise details of Plan Assets are not provided by the LIC.
(d) Liability recognized in the Balance Sheet - ( ` in lakh)
Gratuity Leave Encashment / Compensated Absences
(Funded) (Unfunded)
As at 31.03.2017
As at 31.03.2016
As at 31.03.2017
As at 31.03.2016
Present Value of Obligations as at end of the year 23,449.67 22,435.48 20,548.00 19,888.60
Fair Value of Plan Assets as at end of the year 21,970.88 21,377.78 - -
Net unfunded Liability / (Assets) recognized in Balance Sheet 1,478.79 1,057.70 20,548.00 19,888.60

69
(e) Expenses recognized in the Statement of Profit and Loss- ( ` in lakh)
Gratuity Leave Encashment / Compensated Absences
(Funded) (Unfunded)
Year Ended 31.03.2017
Year Ended 31.03.2016
Year Ended 31.03.2017
Year Ended 31.03.2016
Current Service Cost 934.31 900.79 912.50 857.04
Interest Cost 1,738.75 1,651.20 1,541.36 1,400.05
Expected return on Plan Assets (1,781.61) (1,773.24) - -
Net Actuarial (Gain)/Loss recognized during the year 94.54 487.90 284.07 1,994.44
Total Expense recognized in the Statement of Profit and Loss 985.99 1,266.65 2,737.93 4,251.53
(f ) Experience adjustments( ` in lakh)
Year Ended 31.03.2017
Year Ended 31.03.2016
Gratuity
(i) Plan Assets- Loss/(Gain) (250.74) (118.21)
(ii) Obligations- Loss/(Gain) 173.46 586.74
Leave Encashment/Compensated Absences (Obligations)-Loss/(Gain) 284.07 1,994.44
(g) The Society's best estimate of contribution towards gratuity for the financial year 2017-18 will be ` 2,639.74 lakh (Previous Year ` 2,413.22 lakh).
2.31.2 Provision for long service award, farewell gift and travel to home town on superannuation amounting to ` 77.61 lakh (Previous Year ` 192.04 lakh) have been made on the basis of actuarial valuation at the year end and expensed in Statement of Profit & Loss.
2.31.3 The Society pays fixed contribution to provident fund at predetermined rates to a separate trust, which invests the funds in permitted securities. Contribution to family pension scheme is paid to the appropriate authorities. The contribution of ` 1,762.72 lakh (Previous year `1,694.76 lakh) for the year is recognized as expense and is charged to the Statement of Profit & Loss. The obligation of the Society is to make such fixed contribution

70
and to ensure a minimum rate of return to the members as specified by Government of India. As per report of the actuary, no expected shortfall has been observed considering the surplus in the Providend Fund Trust hence no provision has been made for the year.
2.31.4 Provision for additional monthly payments payable in subsequent periods to the employees opted for Voluntary Retirement Scheme 2011 amounting to ` 109.93 lakh (Previous Year ̀ 141.98 lakh) have been made on the basis of actuarial valuation at the year end and decrease in liability for the year is accounted for ` 32.05 lakh in the Statement of Profit & Loss (Previous Year ` 37.08 lakh).
2.31.5 During the year the Society has provided a sum of ` 402.86 lakh (Previous Year ` 545.00 lakh) towards Employees Superannuation Pension Scheme and the same has been charged to Statement of Profit and Loss.
2.31.6 During the year the Society has provided a sum of ̀ 50.00 lakh (Previous year ̀ 68.00 lakh) towards contribution to Employees Benevolent Fund Trust for Post Retirement Medical Assistance Scheme and the same has been charged to Statement of Profit and Loss.
2.32 BORROWING COST
Borrowing cost capitalised during the year is ` Nil (Previous Year ` Nil).
2.33 SEGMENT INFORMATION:
Disclosures as required under AS 17 - Segment Reporting:-
2.33.1 PRIMARY SEGMENT
a) Business Segments:
The Society’s operating business are organized and managed according to the nature of products and services provided. The three identified segments are ‘Urea and Ammonia-Manufactured’, ‘Imported Fertilizers’ and ‘Other Products’. The ‘Urea and Ammonia-Manufactured’ segment includes manufacture and marketing of Urea and Ammonia. ‘Imported Fertilizers’ segment includes trading of Imported OMIFCO Urea, Imported Pool Urea, Imported Phosphatic/ Potasic Fertilizers. ‘Other Products’ segment includes Trading and Manufacturing of bio-fertilizers, seeds, pesticides, indigenous fertilizers, agro inputs, argon gas etc.
b) Segment Accounting Policies:
Direct revenue and expenses are allocated to respective segments. Indirect revenue and expenses are allocated amongst the segments on a reasonable basis. Segment Assets include all operating assets used by segment comprising Non Current Assets and Current Assets. Segment Liabilities include all operating liabilities and consist principally of trade payables and other current liabilities. Unallocated items include general corporate income and expense items which are not allocated to any business segment.

71
2.33.2 SECONDARY SEGMENT
The operation of the Society is mainly carried out within the country and therefore there is no reportable geographical segments.
PRIMARY SEGMENT( ` in lakh)
Business Segments
Urea & Ammonia-Manufactured
Imported Fertilisers Other Products Total
Year Ended Year Ended Year Ended Year Ended
31.03.2017 31.03.2016 31.03.2017 31.03.2016 31.03.2017 31.03.2016 31.03.2017 31.03.2016
Revenue :
- Sales 131,138.09 136,028.29 142,405.41 159,113.06 21,188.13 25,165.13 294,731.63 320,306.48
- Concession/Remuneration from GOI 276,364.43 314,880.85 79,899.16 91,973.60 949.00 1,090.55 357,212.59 407,945.00
Other Revenue 6,817.90 1,511.41 239.17 514.41 6,362.72 7,363.57 13,419.79 9,389.39
Total Revenue 414,320.42 452,420.55 222,543.74 251,601.07 28,499.85 33,619.25 665,364.01 737,640.87
Expenditure
- Operating and Other Expenses 386,001.21 429,264.11 221,616.96 249,064.62 22,433.13 24,957.40 630,051.30 703,286.13
Total Expenditure 386,001.21 429,264.11 221,616.96 249,064.62 22,433.13 24,957.40 630,051.30 703,286.13
Segment Operating Result 28,319.21 23,156.44 926.78 2,536.45 6,066.72 8,661.85 35,312.71 34,354.74
Unallocated Expenses
- Interest and Financial charges 22,520.68 21,970.48
- Other Unallocated 4.71 166.63
Total Unallocated 22,525.39 22,137.11
- Other Revenue including Dividend 6,098.05 15,073.01
- Interest Income 174.61 200.53
Profit Before Tax 19,059.98 27,491.17
- Income Tax (Net) 6,911.97 8,656.18
Net Profit after Tax 12,148.01 18,834.99
Capital Employed
- Segment Assets 446,905.28 446,958.21 117,723.69 98,937.65 37,106.42 35,897.67 601,735.39 581,793.53
- Unallocated Corporate Assets 178,234.82 174,116.58
- Capital Work-in-Progress 1,126.28 407.30
Total Assets 446,905.28 446,958.21 117,723.69 98,937.65 37,106.42 35,897.67 781,096.49 756,317.41
- Segment Liabilities 58,963.91 54,778.78 10,627.31 11,804.90 12,538.22 5,751.84 82,129.44 72,335.52
- Unallocated Corporate Liabilities 368,447.32 359,669.75
Total Liabilities 58,963.91 54,778.78 10,627.31 11,804.90 12,538.22 5,751.84 450,576.76 432,005.27
Other Information
- Capital Expenditure incurred during the year (including CWIP) 12,464.85 4,356.19 12,464.85 4,356.19
- Depreciation 7,576.99 7,700.10 414.35 545.18 1,932.50 1,880.24 9,923.84 10,125.52
- Unallocated
- Non Cash Expenditure (other than depreciation) 472.56 9.83 5.83 0.07 11.14 7.10 489.53 17.00
SEGMENT REPORTS AS AT MARCH 31, 2017

72
2.34 RELATED PARTY DISCLOSURES:2.34.1 Related parties:
2.34.1.1 Key Management Personnel: (i) Mr. N. Sambasiva Rao Managing Director (ii) Mr. R.K. Aggarwal Operations Director (iii) Mr. Rajan Chowdhry Finance Director (iv) Mr. V S Sirohi Marketing Director2.34.1.2 Subsidiary Companies: (i) KRIBHCO Infrastructure Limited (KRIL) (ii) KRIBHCO Shyam Fertilisers Limited (KSFL)2.34.1.3 Joint ventures: (i) Oman India Fertiliser Co. SAOC (OMIFCO) (ii) Urvarak Videsh Limited. (UVL) (iii) Gujarat State Energy Generation Limited (GSEG) (iv) Anya Polytech & Fertilizers Pvt. Limited (APFPL) -
[Joint Venture of KRIL, subsidiary of the Society]2.34.1.4 Associates: (i) Gramin Vikas Trust (GVT)
2.34.2 Transactions with the related parties at (2.34.1) above are as follows:( ` in lakh)
Nature of Transaction Related Party 2016-2017 2015-2016Investment during the year KSFL 9,238.31 10,201.47
Total 9,238.31 10,201.47Dividend Received OMIFCO 6,097.90 15,052.07
Total 6,097.90 15,052.07Receipts for Fee/ Services KRIL 316.97 299.73
KSFL 1,083.66 1,159.59OMIFCO 2,570.40 2,668.02
GSEG 96.92 91.37Total 4,067.95 4,218.71
Purchase of Assets KSFL - 0.36 Total - 0.36
Payment of Fee for Management & Erection Services for Railway Siding KRIL 5.70 6.19
Total 5.70 6.19 Rental Income KSFL 15.82 17.37
KRIL 48.36 38.95APFPL 3.63 3.07
GVT 18.90 15.39Total 86.71 74.78
Continued...
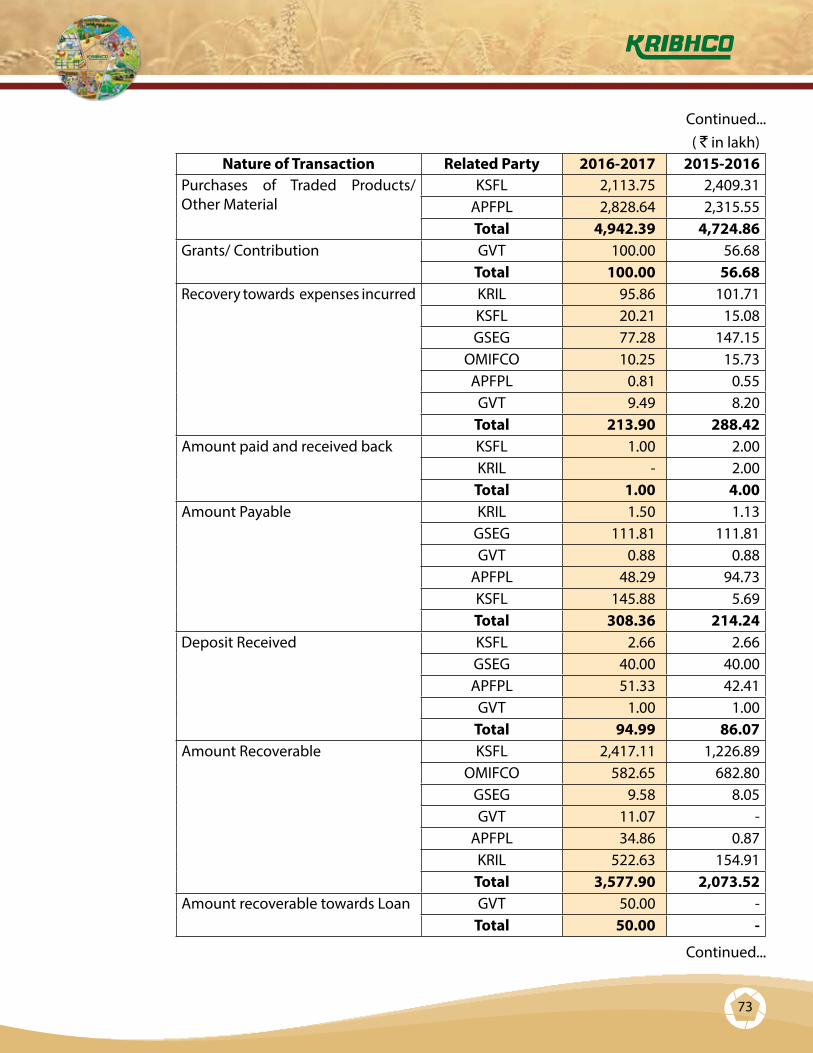
73
( ` in lakh)Nature of Transaction Related Party 2016-2017 2015-2016
Purchases of Traded Products/ Other Material
KSFL 2,113.75 2,409.31 APFPL 2,828.64 2,315.55 Total 4,942.39 4,724.86
Grants/ Contribution GVT 100.00 56.68Total 100.00 56.68
Recovery towards expenses incurred KRIL 95.86 101.71KSFL 20.21 15.08GSEG 77.28 147.15
OMIFCO 10.25 15.73 APFPL 0.81 0.55
GVT 9.49 8.20Total 213.90 288.42
Amount paid and received back KSFL 1.00 2.00 KRIL - 2.00
Total 1.00 4.00 Amount Payable KRIL 1.50 1.13
GSEG 111.81 111.81 GVT 0.88 0.88
APFPL 48.29 94.73 KSFL 145.88 5.69 Total 308.36 214.24
Deposit Received KSFL 2.66 2.66 GSEG 40.00 40.00 APFPL 51.33 42.41
GVT 1.00 1.00 Total 94.99 86.07
Amount Recoverable KSFL 2,417.11 1,226.89 OMIFCO 582.65 682.80
GSEG 9.58 8.05 GVT 11.07 -
APFPL 34.86 0.87 KRIL 522.63 154.91
Total 3,577.90 2,073.52 Amount recoverable towards Loan GVT 50.00 -
Total 50.00 -
Continued...
Continued...
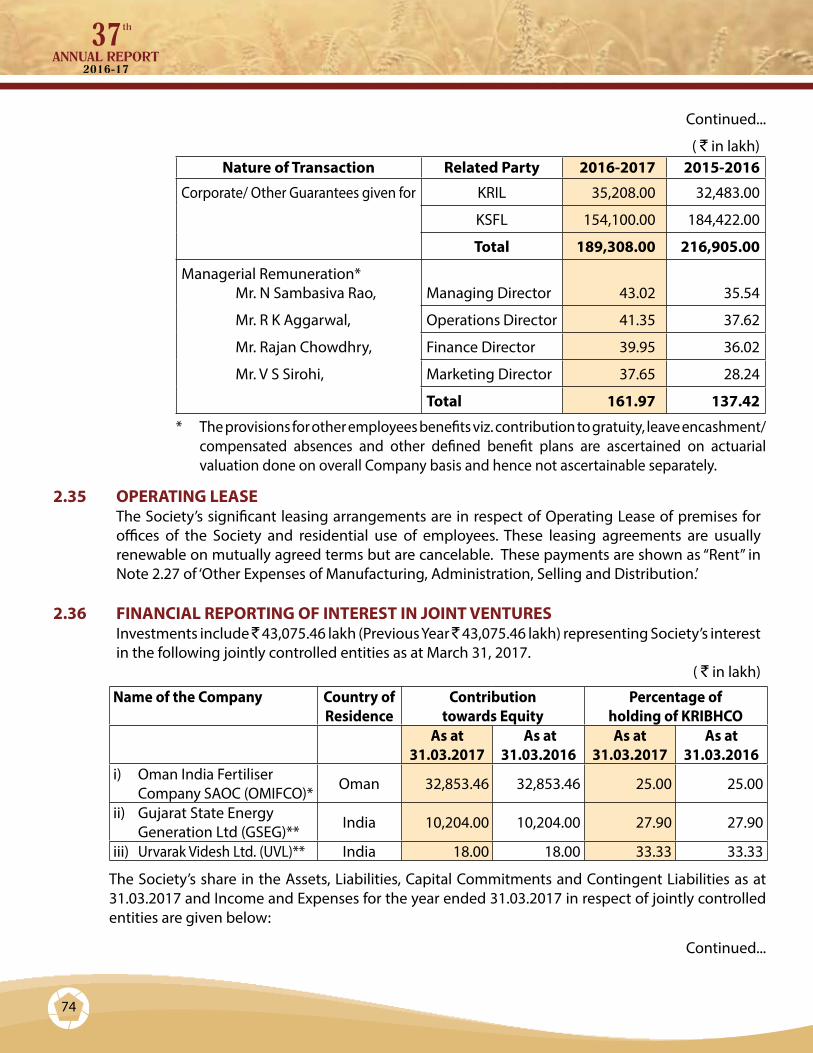
74
( ` in lakh)Nature of Transaction Related Party 2016-2017 2015-2016
Corporate/ Other Guarantees given for KRIL 35,208.00 32,483.00
KSFL 154,100.00 184,422.00
Total 189,308.00 216,905.00
Managerial Remuneration* Mr. N Sambasiva Rao,
Managing Director 43.02 35.54
Mr. R K Aggarwal, Operations Director 41.35 37.62
Mr. Rajan Chowdhry, Finance Director 39.95 36.02
Mr. V S Sirohi, Marketing Director 37.65 28.24
Total 161.97 137.42
* The provisions for other employees benefits viz. contribution to gratuity, leave encashment/ compensated absences and other defined benefit plans are ascertained on actuarial valuation done on overall Company basis and hence not ascertainable separately.
2.35 OPERATING LEASEThe Society’s significant leasing arrangements are in respect of Operating Lease of premises for offices of the Society and residential use of employees. These leasing agreements are usually renewable on mutually agreed terms but are cancelable. These payments are shown as “Rent” in Note 2.27 of ‘Other Expenses of Manufacturing, Administration, Selling and Distribution.’
2.36 FINANCIAL REPORTING OF INTEREST IN JOINT VENTURESInvestments include ̀ 43,075.46 lakh (Previous Year ̀ 43,075.46 lakh) representing Society’s interest in the following jointly controlled entities as at March 31, 2017.
( ` in lakh)
Name of the Company Country of Residence
Contribution towards Equity
Percentage of holding of KRIBHCO
As at 31.03.2017
As at 31.03.2016
As at 31.03.2017
As at 31.03.2016
i) Oman India Fertiliser Company SAOC (OMIFCO)* Oman 32,853.46 32,853.46 25.00 25.00
ii) Gujarat State Energy Generation Ltd (GSEG)** India 10,204.00 10,204.00 27.90 27.90
iii) Urvarak Videsh Ltd. (UVL)** India 18.00 18.00 33.33 33.33
The Society’s share in the Assets, Liabilities, Capital Commitments and Contingent Liabilities as at 31.03.2017 and Income and Expenses for the year ended 31.03.2017 in respect of jointly controlled entities are given below:
Continued...
Continued...
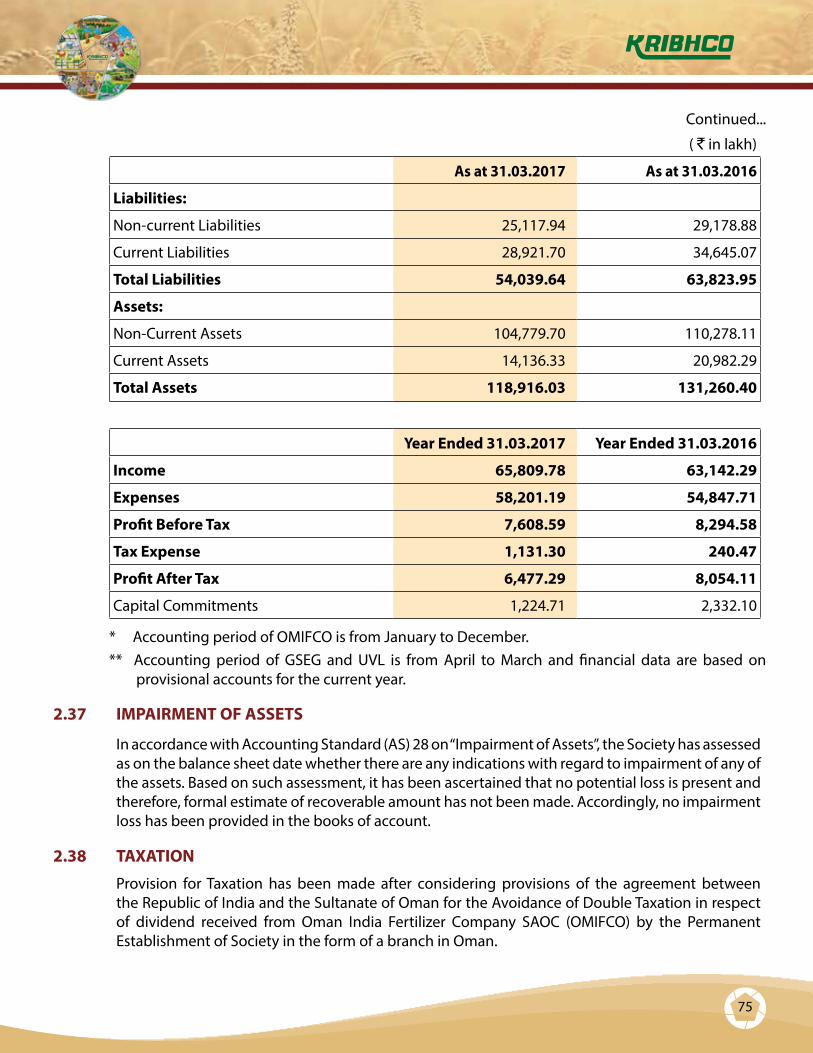
75
Continued...
( ` in lakh)
As at 31.03.2017 As at 31.03.2016
Liabilities:
Non-current Liabilities 25,117.94 29,178.88
Current Liabilities 28,921.70 34,645.07
Total Liabilities 54,039.64 63,823.95
Assets:
Non-Current Assets 104,779.70 110,278.11
Current Assets 14,136.33 20,982.29
Total Assets 118,916.03 131,260.40
Year Ended 31.03.2017 Year Ended 31.03.2016
Income 65,809.78 63,142.29
Expenses 58,201.19 54,847.71
Profit Before Tax 7,608.59 8,294.58
Tax Expense 1,131.30 240.47
Profit After Tax 6,477.29 8,054.11
Capital Commitments 1,224.71 2,332.10
* Accounting period of OMIFCO is from January to December. ** Accounting period of GSEG and UVL is from April to March and financial data are based on
provisional accounts for the current year.
2.37 IMPAIRMENT OF ASSETS
In accordance with Accounting Standard (AS) 28 on “Impairment of Assets”, the Society has assessed as on the balance sheet date whether there are any indications with regard to impairment of any of the assets. Based on such assessment, it has been ascertained that no potential loss is present and therefore, formal estimate of recoverable amount has not been made. Accordingly, no impairment loss has been provided in the books of account.
2.38 TAXATION
Provision for Taxation has been made after considering provisions of the agreement between the Republic of India and the Sultanate of Oman for the Avoidance of Double Taxation in respect of dividend received from Oman India Fertilizer Company SAOC (OMIFCO) by the Permanent Establishment of Society in the form of a branch in Oman.

76
2.39 FOREIGN CURRENCY EXPOSURE
2.39.1 Particulars of foreign currency exposure not hedged by derivative instruments or otherwise:
Sl. No. Particulars Amount of Foreign Currency Amount ` in lakh
As At 31.03.2017
As At 31.03.2016
As At 31.03.2017
As At 31.03.2016
(i) Borrowings, including interest accrued but not due thereon
US $ 204,056.00 US $ 104,333.00 132.31 69.21
(ii) Trade Payables/ deposits and retention money /Advance from Customers
US $ 852,594.85 US $ 1,382,691 551.33 916.56
Euro 276,613.00 Euro 276,613 191.55 207.74
RO 5,420.00 RO 1,750 9.18 3.01
(iii) Trade Receivable Debtors and Bank Balances / Advance to Suppliers
US $ 9,476,331.83 US $ 791,694.52 5,806.53 4,820.72
- GBP 760 - 0.72
RO 9,521.76 RO 6,494 16.03 11.19
2.39.2 Particulars of hedged foreign currency exposure:
Particulars Amount of Foreign Currency Amount ` in lakh
As At 31.03.2017
As At 31.03.2016
As At 31.03.2017
As At 31.03.2016
Import Credit including interest
US $ 297,988,634 US $ 178,045,929 193,211.66 118,103.03

77
2.40 INFORMATION IN RESPECT OF MICRO, SMALL AND MEDIUM ENTERPRISES AS REQUIRED BY THE MICRO, SMALL AND MEDIUM ENTERPRISES DEVELOPMENT ACT, 2006 AS AT 31.03.2017
Sr. No. Particulars 2016-17 2015-16
1 The principal amount and the interest due thereon remaining unpaid to any supplier as at the end of each accounting year:
(i) Principal Amount due Nil Nil
(ii) Interest due thereon Nil Nil
2 The amount of interest paid by the buyer in terms of section 18, along with the amounts of the payment made to the supplier beyond the appointed day during each accounting year as announced by any dispute resolution council/authority Nil Nil
3 The amount of interest due and payable for the period of delay in making payment (which have been paid but beyond the appointed day during the year) but without adding the interest specified under this Act: Nil Nil
(i) Payment made to supplier (Other than interest) beyond the appointed day during the year Nil Nil
(ii) Interest paid to supplier on principal amount paid beyond the appointed day during the year Nil Nil
(iii) Interest due and payable to supplier on principal amount paid beyond the appointed day during the year Nil Nil
4 The amount of interest accrued and remaining unpaid at the end of each accounting year; and Nil Nil
5 The amount of further interest remaining due and payable even in the succeeding years, until such date when the interest dues as above are actually paid to the small enterprise, for the purpose of disallowance as a deductible expenditure under section 23. Nil Nil
The above information has been provided to the extent such parties have been identified on the basis of information available with the Society.

78
2.41 VALUE OF IMPORTS CALCULATED ON C.I.F.:
( ` in lakh)
Particulars Year Ended 31.03.2017
Year Ended 31.03.2016
2.41.1 Components and Spare parts 28.90 148.42
2.41.2 Capital Goods 2,726.00 83.78
Total 2,754.90 232.20
2.42 EXPENDITURE IN FOREIGN CURRENCY:
( ` in lakh)
Particulars Year Ended 31.03.2017
Year Ended 31.03.2016
2.42.1 Legal & professional Charges - -
2.42.2 Purchase of Imported Fertilisers 118,441.58 134,831.33
2.42.3 Purchase of Raw Material (Gas Supply) 4,074.65 5,078.37
2.42.4 Others 303.23 259.05
Total 122,819.46 140,168.75
2.43 EXPENDITURE IN FOREIGN CURRENCY:
( ` in lakh)
Particulars Year Ended 31.03.2017
Year Ended 31.03.2016
2.43.1 Dividend 6,097.90 15,052.07
2.43.2 Other Income
Urea Sales Fee 2,570.40 2,668.02
Others 52.90 203.56
Total 2,623.30 2,871.58

79
2.44 During the year spares lying in the Inventory under head “Stores & Spares” having carrying value of ` 5,205.40 lakh have been capitalised w.e.f. April 1, 2016 and depreciated over the remaining useful life of the plant. Accordingly, Inventory of “Stores & Spares” is reduced by ̀ 5,205.40 lakh and Plant and Machinery is increased by the same amount. The depreciation has also been increased during the year by ` 347.02 lakh on account of the above reclassification.
2.45 As per the O&M agreement with HWB, amount of Gratuity and Leave Encashment for the employees working in HAEP is recoverable from HWB. Accordingly, Society has shown an amount of ` 3,604.13 lakh as recoverable which is prior to 1st April 2016 and shown as Income towards Employee Benefits from HAEP under the head 'Prior Period Items (Net)'.
2.46 Balances of some of the contractors/customers/suppliers/receivable/payable and deposits with others are subject to confirmation/ reconciliation and consequential adjustments, if any, which in the opinion of the management would not be material.
2.47 In the opinion of the management, the value of any of the assets other than Fixed Assets and Non-Current Investments on realisation in the ordinary course of business will not be less than the value at which these are stated.
2.48 The Previous Year figures have been re-grouped/rearranged, wherever considered necessary, to make them comparable with the Current Year figures.
2.49 Amount in financial statements are presented ` in lakh except as otherwise stated .
For and on behalf of Board of Directors
(Rajan Chowdhry) ( N. Sambasiva Rao) Finance Director Managing Director
As per our report of even dateFor G. K. Choksi & Co. For V. Sankar Aiyar & Co. For S. S. Kothari Mehta & Co.
Chartered Accountants Chartered Accountants Chartered Accountants(Firm Regn. No. 101895W) (Firm Regn. No. 109208W) (Firm Regn. No. 000756N)
(Sandip A. Parikh) (R. Raghuraman) (Yogesh K. Gupta)Partner Partner Partner
M.No. 040727 M.No. 081350 M.No. 093214
Place: New DelhiDated: May 18, 2017

80
Dr. Chandra Pal Singh, Chairman, KRIBHCO participated in 10th Asia –Pacific Conference of Cooperative Minister’s at Hanoi, Vietnam.


![Performance Highlights [Company Update]](https://static.fdocuments.in/doc/165x107/577ca51f1a28abea748b6586/performance-highlights-company-update.jpg)