1 On the Accuracy of Embeddings for Internet Coordinate Systems Eng Keong Lua, Tim Griffin, Marcelo...
44
1 On the Accuracy of Embeddings for Internet Coordinate Systems Eng Keong Lua, Tim Griffin, Marcelo Pias, Han Zheng, Jon Crowcroft. University of Cambridge, Computer Laboratory.
-
date post
18-Dec-2015 -
Category
Documents
-
view
215 -
download
0
Transcript of 1 On the Accuracy of Embeddings for Internet Coordinate Systems Eng Keong Lua, Tim Griffin, Marcelo...

1
On the Accuracy of Embeddings for Internet Coordinate SystemsEng Keong Lua, Tim Griffin,
Marcelo Pias, Han Zheng, Jon Crowcroft.University of Cambridge, Computer Laboratory.

2
RTT Estimation : Is this a good one?
Measured RTT from planetlab1.comet.columbia.edu
Estimated RTT from planetlab1.comet.columbia.edu
PlanetLab’s sites, from closest to farthest using measured RTT
RT
T (
ms)
Depends on the APPLICATIONS!

3
RTT Estimation : Is this a good one?
PlanetLab’s sites, from closest to farthest using measured RTT
RT
T (
ms)
Estimated RTT from planetlab1.pop-mg.rnp.br
Measured RTT from planetlab1.pop-mg.rnp.br

4
Internet Coordinates: How accurateare they?
What are Internet Coordinates? A Close Look at the Lipschitz Embedding New Sets of Accuracy Metrics Experimental Methodology - PlanetLab Experiments Using Other Embeddings Revisiting Previous Work Conclusion
Both of the previous examples where generatedusing the same Internet coordinate
technique on the same data set
Outline

5
What are Internet Coordinates? Internet Coordinate System
Embed Round-Trip-Times (RTTs) into geometric spaces
Unmeasured RTTs are estimated using geometric distance
Why Internet Coordinate Systems? Extensive measurement of network delays can be
time consuming add to network load
Construction of overlay topologies through scalable distance estimation
If accurate, embedding techniques allow us to predict Internet RTTs without extensive measurements.

6
How embeddings work
L
L H
H
L
L H
H
Embed = Associate a point with each node
in N
Compute“distance”
matrix
Measured RTT matrix
Estimated RTT matrix
L = Landmarks H = Hosts N = Nodes = L + H
A Metric Space
This datais not used in
embedding.(But is needed
for judging accuracy!)
Why we don’t use Skitter data!

7
Full Embedding: L = N
L
L
L
L
Embed
Compute“distance”
matrix
Measured RTT matrix
Estimated RTT matrix
A Metric Space
In general,some accuracy
is lost even when the
“full mesh” of data is used

8
Two Basic Approaches: Method I
L
L H
H
|L| = m
Space of n dimensions
Embed using optimization algorithms w.r.t an accuracy metric
(n < m)
• Vivaldi [Dabek, Cox, Kaashoek, Morris. SIGCOMM 2004]
Measured RTT matrix
• PIC [Costa, Kastro, Rowstron, Key. ICDCS 2004]
• Big Bang Simulation (BBS) [Shavitt, Tankel. INFOCOM 2003, 2004]
• Predicting Internet Network Distance with Coordinates-based Approaches (GNP) [Ng, Zhang. INFOCOM 2002]
9
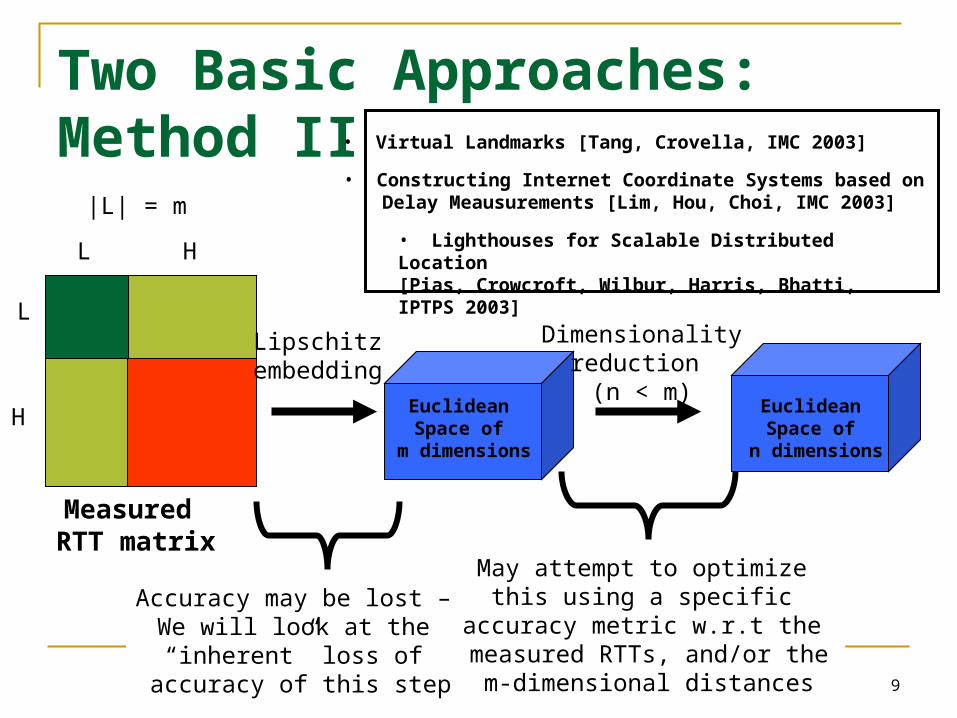
Two Basic Approaches: Method II
L
L H
H
Lipschitzembedding
Euclidean Space of
m dimensions
|L| = m
Euclidean Space of
n dimensions
Dimensionalityreduction
(n < m)
• Virtual Landmarks [Tang, Crovella, IMC 2003]
• Constructing Internet Coordinate Systems based on Delay Meausurements [Lim, Hou, Choi, IMC 2003]
• Lighthouses for Scalable Distributed Location [Pias, Crowcroft, Wilbur, Harris, Bhatti, IPTPS 2003]
Accuracy may be lost – We will look at the “inherent” loss of
accuracy of this step
May attempt to optimize this using a specific
accuracy metric w.r.t the measured RTTs, and/or the
m-dimensional distances
Measured RTT matrix

10
Full Lipschitz embedding into R7 by reading each Row 7-dimensional Coordinate of the node:E.g. Coordinates of Node 1 is Φ(1) =[0, 1, 2, 2, 1, 2, 2]
Lipschitz Embedding – Example using binary trees

11
View from a leaf in a binary tree, depth 4 Full 32-D Lipschitz

12
View from root in a binary tree, depth 4

13
What should Accuracy Mean? Several ways to capture Accuracy formally
Notion depend on the needs of an application
Some applications require the distances in embedding accurately reflect the original distances
In earlier example,we have Φ(7) = [2, 3, 4, 4, 1, 2, 0]δ(1,7) ≈ 4.47
But it is only 2 in original metric space

14
Relative Rank Loss (rrl)
Relative distance of other nodes
Is Node A closer than Node B?
Relative ranking of distances is not lost
We define Relative Rank Loss (rrl)
From Node z, if sign(R) ≠ sign(R’) Order has changed!

15
Formal Definition - rrl
),, ~ ))(),(()),(),((()),(),,((
if w.r.t swapped are ,
y x if 1
y x if 0
y x if 1
),(
yxSwapped(zyzxzRyzdxzdR
zyx
yxR
φφδφφδ≠
⎪⎩
⎪⎨
⎧
>=<−
=
)},,( and |),{(:)(
}){(x}){()(
yxzSwappedyxyxzP
zXzXzP
≠−−⊆
Define:
rrl is a type of “swap distance”

16
Formal Definition - rrl
Define Local rrl at Node z is
Note that 0 (0%) < rrl(Φ,z) < 1 (100%)
Maximal Local rrl at Node z = MAX(rrl(Φ,z))
Average Local rrl at Node z =
2
)2)(1( where
)(),(
−−==
XXs
szP
zrrl φ
),(
X
xrrlXx∑ ∈
φ
17
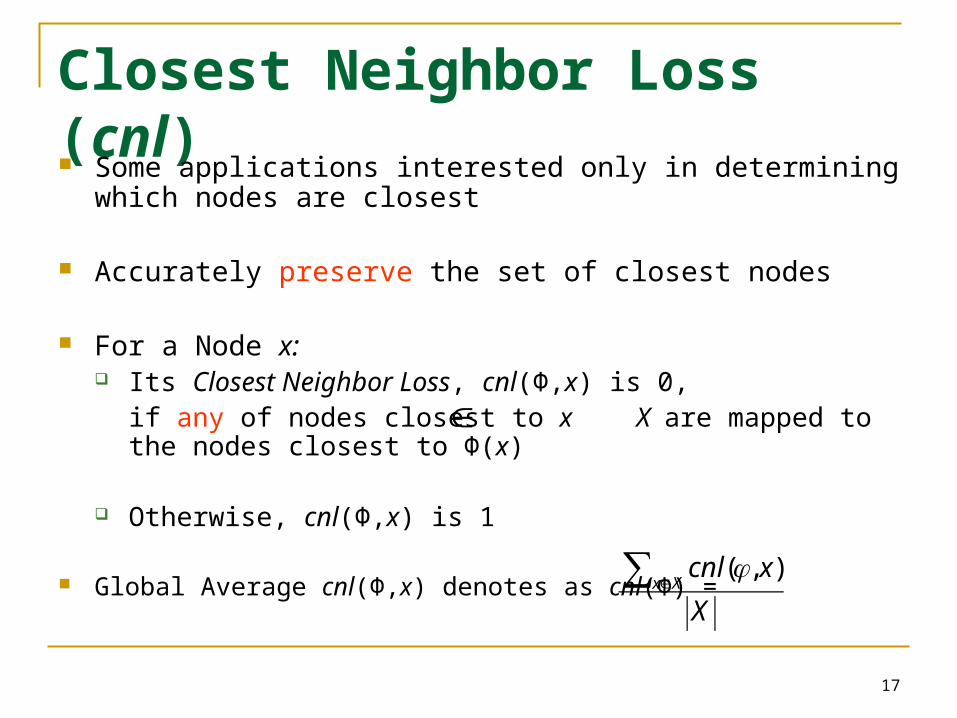
Closest Neighbor Loss (cnl) Some applications interested only in determining
which nodes are closest
Accurately preserve the set of closest nodes
For a Node x: Its Closest Neighbor Loss, cnl(Φ,x) is 0,
if any of nodes closest to x X are mapped to the nodes closest to Φ(x)
Otherwise, cnl(Φ,x) is 1
Global Average cnl(Φ,x) denotes as cnl(Φ) =
∈
),(
X
xcnlXx∑ ∈
φ

18
Relative error for Lipschitz embedding on binary trees, depth 1 (3 nodes) to 8 (511 nodes)
It is not obvious or intuitive how to interpret

19
Scalar independent measures for Lipschitz embedding on binary trees, depth 1 to 8
cnl tells us that about 96% of 511 nodes in a tree of depth 8 have a different closest neighbors
rrl shows that on average nodes see over 20% of their relative distance relationships swapped
Maximal Local rrl tells us that at least 1 node see over 30% of its relative distance relationships swapped

20
View from a leaf in a hub with 30 spokes
Root node is PUSHED away to a
distance of 3.3

21
Hub and Spoke Accuracyn spokes and 1 root, where n ranges from 1 to 30
Rising cnl and falling
rrl after n=6

22
Why PlanetLab? Skitter project makes RTT data available from a small number of monitoring nodes n to m target nodes, m is order of hundreds of thousands Yields an asymmetric n x m Embedded distances between target nodes cannot be verified
PlanetLab – testbed for Internet planetary-scale mesh topology

23
Methodology
RTT measurement data collected between PlanetLab nodes from March 22-28, 2004
Minimum value between each pair of nodes on consecutive of 15-min periods
Each day has 96 matrices of pair-wise RTT, with size of each matrix is 325 x 325
Over 7-day period, we have 672 matrices

24
Methodology A representative node is selected in each site to
build a site-by-site matrix, and clean up for missing entries
Finally, we have 69 x 69 RTT site-by-site matrix
We further classify into geographical locations: North America (NA-PL): 44 x 44 RTT site matrix, majority sites obtain connectivity through Abilene
Outside North America (ONA-PL): 25 x 25 RTT site matrix between research and commercial, includes Australia, Europe, Latin America and Asia
ALL (ALL-PL): 69 x 69 RTT site matrix, consists of NA-PL & ONA-PL

25
Results and Observations – ALL-PL Apply full Lipschitz Embedding
Minimum, Mean and Maximum rrl
Difference between Max and Min rrls is high (57.71%) – Flip a coin is better!
Global cnl measure is 84.06%, only about 15% of the sites retain their closest neighbors in their embedding

26
Scalability (Meta-) Metric: Can embeddings scale?
Suppose applications only interested in a subset of nodes, e.g. North America
Would it be better to use an Internet Coordinate System from ALL-PL or from NA-PL?
To answer to this question will determine if embedding services could scale
If Y X, we first could use the full Lipschitz embedding to obtain Φ(X), then restrict this to nodes in Y, denote as Superspace embedding
Φ(Y) and may have very different embeddings with different accuracy for metric space spanned by Y
Y(X)↓φ
⊆
Y(X)↓φ

27
Superspace and Subspace EmbeddingsLooking at NA-PL

28
Superspace and Subspace Results We used NA-PL as a Subspace of ALL-PL: Φ(NA-PL) = Subspace Embedding of NA-PLΦ(NA-ALL) NA-PL = Superspace Embedding of NA-PL
Lipschitz Subspace embedding in Euclidean space is a much better one
Embeddings Min Mean Max
Φ(NA-PL) 0.1141 0.1897 0.3023
Φ(NA-ALL) NA-PL
0.1606 0.2916 0.4452↓
↓

29
North America (Superspace Embedding):
PlanetLab site with Maximum rrl – planetlab1.flux.utah.edu

30
North America (Subspace Embedding):
PlanetLab site with Maximum rrl – planetlab1.enel.ucalgary.ca

31
CDFs of rrl for Subspace and Superspace Embeddings

32
Using Other Embeddings with our PlanetLab ALL-PL sites using our Accuracy Metrics Both BBS (Euclidean) and Vivaldi embeddings in Euclidean space have the same cnl measure of 75.36% BBS (Hyperbolic) LRN has the lowest cnl
Vivaldi has higher maximum rrl compared to BBS (Euclidean) BBS (Euclidean) has lowest maximum rrl
BBS (Hyperbolic) TP embedding has a much higher maximum rrl than BBS (Hyperbolic) LRN embedding It has the largest maximum rrl Its minimum rrl is lower than BBS (Hyperbolic) LRN

33
Signature plots: BBS (Hyperbolic) TP
Lists of close neighbors are being pushed away in
embedded geometric space

34
Signature plots: Vivaldi
Lists of close neighbors are being pushed away in
embedded geometric space

35
Scalability (Meta-) Metric – Superspace and Subspace embeddings Vivaldi and BBS embeddings in Euclidean space have same behavior as Lipschitz embedding Subspace embedding has better rrl accuracy than Superspace embedding in Euclidean space
BBS embeddings in Hyperbolic space Superspace embedding tends to have a close or better rrl accuracy than Subspace embedding in Hyperbolic space

36
Revisiting Previous Work with their data sets using our Accuracy Metrics BBS (Hyperbolic) TP in Hyperbolic space has similar inaccuracy behaviors in rrl as Lipschitz embedding in Euclidean space for tree-like network topology
All experiments show list of closest nodes being pushed away with sharp bi-modal errors
BBS (Hyperbolic) LRN, list of close neighbors is being pushed away very much further and has higher maximum rrl

37
BBS (Euclidean) using Jan 2000 AS Hierarchical Tree Network Topology of 150 nodes

38
BBS (Hyperbolic) TP using Jan 2000 AS Hierarchical Tree Network Topology of 150 nodes

39
BBS (Hyperbolic) TP using BA Network Topology of 150 nodes

40
BBS (Hyperbolic) TP using Mar 2001 AS Network Topology of 200 nodes

41
BBS (Hyperbolic) LRN using Mar 2001 AS Network Topology of 200 nodes

42
Conclusion Goal of this work is to apply our new accuracy metrics to
study the accuracy of embeddings for Internet Coordinate systems
Results of this attempt is not encouraging
Worthwhile to develop a collection of accuracy metrics that are able to quantify different aspects of user-oriented quality
Can we characterize the impact of network topologies that have good embeddings with respect to an accuracy metric?
Embeddable Overlay Network (EON) Routing nodes are selected to avoid violations of triangle
inequality (for overlay forwarding)
Overlay topology selected to embed with high accuracy with respect to multiple useful accuracy metrics

43
Discussion
Strength Extensive study on the accuracy of diverse
embedding techniques New metrics for measuring the accuracy of diverse
embeddings Weakness
Lack of verification studies of cnl and rrl rrl and cnl can be biased Topology dependent metrics
Will RTT based mechanisms be working? Speed of light for measuring the distance to the
planets vs. RTT for measuring the distance to the destinations
Measuring the distances by time in error prone environments

44
Thank you.
Questions?