1 Offshore Wind Accelerator Access Systems Marc Costa Ros 30 September 2014 G9 Safe by Design...
25
1 ffshore Wind Accelerator cess Systems Marc Costa Ros 30 September 2014 G9 Safe by Design Workshop (September 2014, Lon
-
Upload
shauna-booth -
Category
Documents
-
view
217 -
download
0
Transcript of 1 Offshore Wind Accelerator Access Systems Marc Costa Ros 30 September 2014 G9 Safe by Design...

1
Offshore Wind AcceleratorAccess Systems
Marc Costa Ros30 September 2014
G9 Safe by Design Workshop (September 2014, London)

2
The Carbon Trust has accelerated sustainable, low carbon development for more than 12 years
Advice Footprinting Technology
We advise businesses, governments and the public sector on opportunities in a sustainable, low carbon economy
We measure and certify the environmental footprint of organisations, products and services
We help develop and deploy low carbon technologies and solutions, from energy efficiency to renewable power

3
Offshore Wind Accelerator
Offshore Wind AcceleratorObjective: Reduce cost of energy by 10% in time for Round 3
Joint industry project involving 9 developers + Carbon Trust
Only developers are members– Commercially-focused– International outlook for best ideas
>£60m programme– 2/3 industry, 1/3 public (UK’s
Department of Energy and Climate Change – DECC)
Set up 2009, runs to beyond 2015
Value to members– New technologies, ready to use– Insights into best technologies for R3– Funding for demo projects
¾ of licensed capacity in UK waters

4
OWA focuses on areas where it can have the largest impact
Source: Navigant (offshore)
LCOE Breakdown
Types of project:– Common R&D project (Desk-based studies funded by the 9 OWA partners)– Discretionary Projects (Demo type projects funded by interested partners + 3rd Parties)
OWA Focuses on everything but the turbine, representing ~70% of offshore wind costs, including cost of energy (CapEx and OpEx) and (+Cost of Finance)
OWA

5
Market screening suggested technologies unsuited to R3New technologies required
Source: Carbon Trust Offshore Wind Accelerator 2010
Vision: Increase accessibility to improve availability on R3 sites
Competition•1,500 info packs •450 entries•30 countries•13 finalists
6
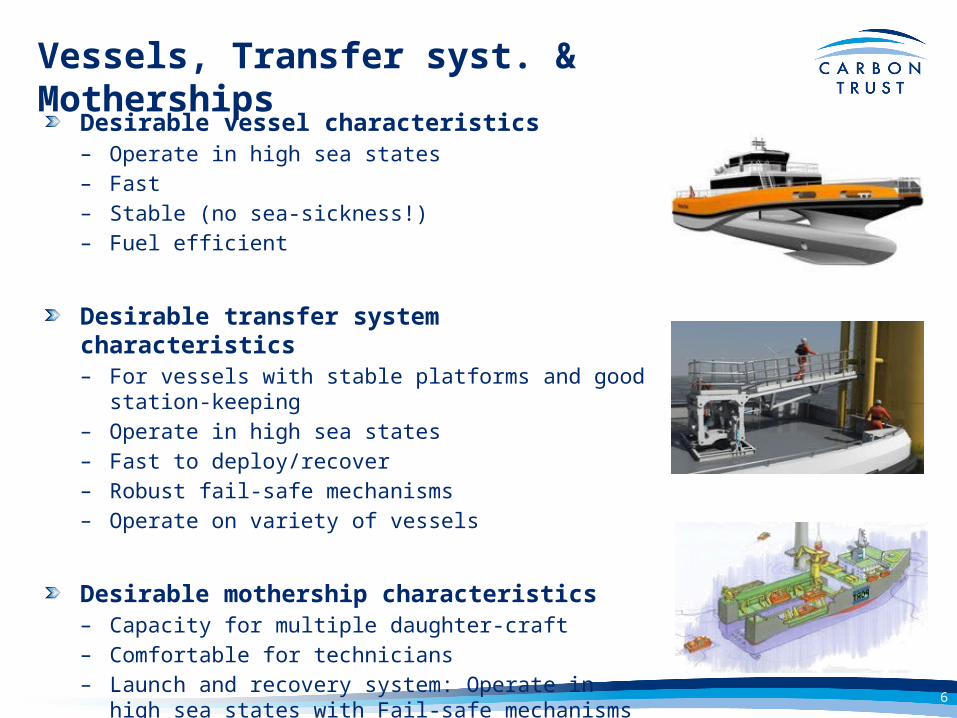
Vessels, Transfer syst. & Motherships
Desirable vessel characteristics– Operate in high sea states– Fast – Stable (no sea-sickness!)– Fuel efficient
Desirable transfer system characteristics– For vessels with stable platforms and good
station-keeping– Operate in high sea states– Fast to deploy/recover– Robust fail-safe mechanisms– Operate on variety of vessels
Desirable mothership characteristics– Capacity for multiple daughter-craft– Comfortable for technicians– Launch and recovery system: Operate in high sea
states with Fail-safe mechanisms

7
WindServers [Fjellstrand, Norway]
Source: Fjellstrand 2013 7
Advantage- Fast and efficient- Stability in station-keeping

8
2 Play[Nauti-Craft, Australia]
8
Source: NautiCraft, 2013
Advantage- Fast, comfortable- Hydraulic connections
system compensates heave
8m Demo at SeaWork 2014

9
WaveCraft (Surface Effect Ship)[Umoe Mandal, Norway]
Source: Umoe Mandal 2013
9
Advantage- Speed- Air cushion compensates
motions
1st Wave Craft will be built by end of 2014

10
TAS [Houlder + BMT-NG, UK]
Source: BMT Nigel Gee and Houlder 10
Advantage- Heave compensation- Retro-fittable- Rollers improve performance
Trials undertaken Q2 2014

11
Autobrow [OTSO, UK]
Source: Autobrow 201311
Advantage- Simplicity- Retro-fittable

12
MOTS [momac, GE]
Source: NOS / momac
Advantage- Full motion
compensation- Can stand-off
the foundation

13
Turbine Docking Device[Offshore Transfer Systems, Wales]
13Source: Offshore Transfer Devices
Advantages- Simple- Retro-fittable

14
Z Port [Z Technologies, NE]
Source: Z Technologies, 2013
Advantage- Allows multiple crew
transfer vessels- Simple launch and
recovery

15
Launch And Recovery System(LARS) [Divex, Scotland]
Source: Divex, 2013 15
Advantage- Adaptable to
daughter craft- Retrofittable

16
OWA Performance MetricsNew proposal to assess performance
Current methods of assessing access system based only in Hs – Limited and not fully reliable– Difficult to define an accurate O&M strategy
Performance Metrics– Assess vessel performance considering key environmental parameters:
– Wave Direction– Wave Height (Hs)– Wave Period– Current…
– But also speed, capacity, comfort, safety, fuel economy, charter costs
Main Benefits– Evaluate & Benchmark Vessels & Transfer Systems– Optimise and Increase reliability of O&M modelling
Source: OWA Trial Procedures

17
Performance EvaluationPossible sources
Numerical Modelling Tank Testing Full Scale Sea Trials
(Condition dependent)
Easy to run high number of scenarios
Limited number of trialsSignificant number of
scenarios
Flexibility &# Data Resolution
Statistically limited confidence
Time or Cost / Data Resolution
Certainty
O&M Model
Scaled model Testing in open seas
18
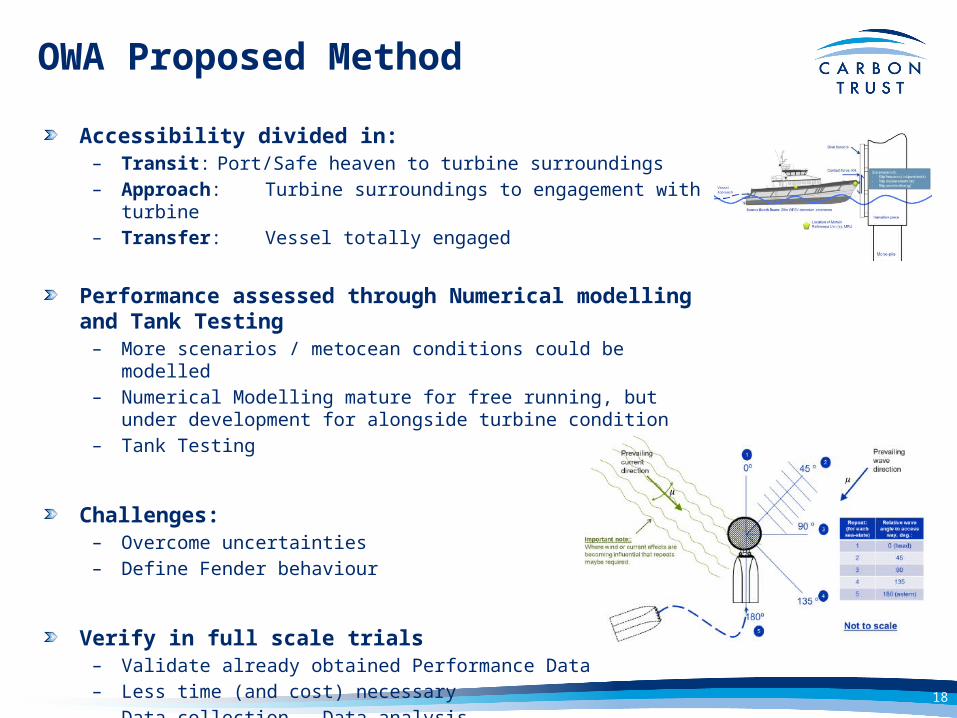
OWA Proposed Method
Accessibility divided in:– Transit: Port/Safe heaven to turbine surroundings– Approach: Turbine surroundings to engagement with
turbine– Transfer:Vessel totally engaged
Performance assessed through Numerical modelling and Tank Testing
– More scenarios / metocean conditions could be modelled– Numerical Modelling mature for free running, but under
development for alongside turbine condition– Tank Testing
Challenges:– Overcome uncertainties– Define Fender behaviour
Verify in full scale trials– Validate already obtained Performance Data– Less time (and cost) necessary– Data collection – Data analysis

19
What we measure:
Transit:Goal: Technicians must arrive at the turbine fit to work as fast as possibleMeasure
– Maximum speed a CTV can achieve in a given sea state– Parameters: Different Wave heights, Wave directions and 2 different Wave spectra
(for near offshore and far offshore sites)– Limit: A given Motion Sickness value
ApproachGoal: Ability of the vessel to reach the turbineMeasures in development
Transit:Goal: Safely transfer to the turbineMeasure
– Maximum Wave heights a CTV that guarantee a safe transfer in a given sea state– Parameters: Different Wave directions, Current directions and 2 different Wave
spectra (for near offshore and far offshore sites)– Limit: A given “slip frequency” / “confidence value” for non-slip condition.

20
Some (illustrative) Examples:
Example of a Transit P-Plot and example of a Transit performance table
Example of a Transit P-Plot and example of a Transit performance table
Tran
sit
Tran
sfe
r

21
P-Plots Vision: An Industry standard
One-pager vessels specifications with:
P-Plots (2 Transit + 2 Transfer)
Vessel Geometry:– Length over all (LOA)– Normal Operational Displacement [lightship
displacement + 10t]
Additional Vessel Features– Number of passengers– Cargo Capacity / Payload– Type of Thrust and Installed power– Fuel consumption and tank capacity– Noise levels
Other information:– Company details– Class / Flag– …
Source: Fjellstrand / OWA Trial Procedures

22
Performance Evaluation Method
P-PLOT
Benchmarking
Cost-Benefit
Vessel Performance
Graphsas an Tool
Figures as an Input
Site Specific Weather Data
LCOE Reduction from Base Case scenario
Initial screening tool to assess suitable vessels
Vessel SelectionFocussed in
Numerical Modelling+ Tank Testing
Based on Base-line OWF and vesselsFlexible tool
Design
Best match Access System - OWF
Transit
Transfer
Deep Water
ShallowWater
Deep Water
ShallowWater

23
Next Steps
Update of the OWA Trial procedures
New Sea Trials within OWA to check approach
Extensive data collection to define properly:– Transit limits (motion sickness dose value)– Transfer limits (slip)
Publication for extensive industry usage.

24
Key take-away points
As we move further from shore, we need new in-field crew transfer vessels, more capable transfer systems, and motherships, with high potential of increasing availability, which will reduce cost of energy
There a number of innovative concepts on the drawing board, and many of them are now close to reaching the market and will also improve performance in close-to-shore sites
We need to move beyond wave height as a measure of performance. This will help us to improve– Vessel selection– O&M modelling
We aim that more quantitative and objective performance evaluation will be adopted by industry as a standard

25
Thank you!
Carbon Trust Offshore Wind Accelerator
Marc Costa Ros30 September 2014
G9 Safe by Design Workshop (September 2014, London)