1 of 35Timing Timing Exercises (1-3) E-Prime 2002 Workshop Files on My Documents\My...
35
1 of 35 Timing Timing Exercises Timing Exercises (1-3) (1-3) E-Prime 2002 Workshop E-Prime 2002 Workshop Files on My Documents\My Files on My Documents\My Experiments\Workshop\E-Prime Experiments\Workshop\E-Prime Exercises Exercises Exercises Exercises Copyright Psychology Software Tools Inc. 2002 Copyright Psychology Software Tools Inc. 2002 These materials may be used for local educational purposes These materials may be used for local educational purposes only. all other use requires approval in writing. Please send only. all other use requires approval in writing. Please send requests to [email protected] requests to [email protected]
-
date post
20-Dec-2015 -
Category
Documents
-
view
224 -
download
1
Transcript of 1 of 35Timing Timing Exercises (1-3) E-Prime 2002 Workshop Files on My Documents\My...

1 of 35Timing
Timing Exercises (1-3)Timing Exercises (1-3)
E-Prime 2002 WorkshopE-Prime 2002 Workshop
Files on My Documents\My Experiments\Files on My Documents\My Experiments\Workshop\E-Prime ExercisesWorkshop\E-Prime Exercises
E-Prime Timing ExercisesE-Prime Timing Exercises
Copyright Psychology Software Tools Inc. 2002Copyright Psychology Software Tools Inc. 2002
These materials may be used for local educational purposes only. all These materials may be used for local educational purposes only. all other use requires approval in writing. Please send requests to other use requires approval in writing. Please send requests to
[email protected]@pstnet.com

2 of 35Timing
List of ExercisesList of Exercises 1. Varying Probe Duration – 1. Varying Probe Duration –
TimingParadigm3TimingParadigm3
2. Cumulative Timing of a Repeating 2. Cumulative Timing of a Repeating Sequence of Events – Sequence of Events – TimingParadigm4TimingParadigm4
3. Continuous sequences of events at 3. Continuous sequences of events at high rate with short stimulus times – high rate with short stimulus times – TimingParadigm5TimingParadigm5

3 of 35Timing
General Rule For TimingGeneral Rule For Timing Set the timing of the critical event to Set the timing of the critical event to
be equal the intended time rounded to be equal the intended time rounded to the nearest millisecond and set the nearest millisecond and set prerelease equal to greater than the prerelease equal to greater than the longest time to get ready for the next longest time to get ready for the next display. display.
Examples assume 60 Hz, 16.67ms Examples assume 60 Hz, 16.67ms refresh subtract set the prerelease to refresh subtract set the prerelease to 17 ms and refresh time of 17 ms and refresh time of Refreshes 60 72
1 17 142 33 283 50 42
Refresh Rate Hz

4 of 35Timing
Timing Exercise 1Timing Exercise 1
1. Open My Documents\My Experiments\Workshop\1. Open My Documents\My Experiments\Workshop\E-Prime Exercises\ TimingParadigm3 and run to E-Prime Exercises\ TimingParadigm3 and run to create an EDAT filecreate an EDAT file
2. Verify Display.RefreshRate2. Verify Display.RefreshRate
3. Use E-DataAid to arrange columns to check 3. Use E-DataAid to arrange columns to check timing accuracytiming accuracy
4. Copy columns into Excel4. Copy columns into Excel
5. Perform calculations using Excel5. Perform calculations using Excel
This exercise presents a masking experiments presenting This exercise presents a masking experiments presenting displays for 1-3 refreshes (17-50ms). In this exercise you will:displays for 1-3 refreshes (17-50ms). In this exercise you will:

5 of 35Timing
Timing Exercise 1- Verify Refresh Timing Exercise 1- Verify Refresh RateRate
1. Use E-DataAid to O1. Use E-DataAid to Open pen My Documents\My Experiments\My Documents\My Experiments\Workshop\E-Prime Exercises\ Workshop\E-Prime Exercises\ TimingParadigm3-3-1.EDAT TimingParadigm3-3-1.EDAT (which was previously created)(which was previously created)
2. Verify Display.RefreshRate2. Verify Display.RefreshRate

6 of 35Timing
Timing Exercise 1 – Arrange Timing Exercise 1 – Arrange ColumnsColumns
3. Select Arrange 3. Select Arrange Columns tools, Columns tools, click Remove All.click Remove All.
4. Next to the 4. Next to the Select button Select button type type *.OnsetTime; *.OnsetTime; ProbeDuration; ProbeDuration; Time* and click Time* and click SelectSelect
5. Click Add and 5. Click Add and click OKclick OK

7 of 35Timing
Timing Exercise 1- Copy to Timing Exercise 1- Copy to ExcelExcel
5. Arrange columns move 5. Arrange columns move Mask.OnsetTime after Mask.OnsetTime after Probe.OnsetTime. Click on Probe.OnsetTime. Click on column heading to select column heading to select then click & drag to move then click & drag to move
6. Select all columns, 6. Select all columns, copy, open Excel and copy, open Excel and paste.To select cellspaste.To select cells click on click on
Fixation.OnsetTime Fixation.OnsetTime heading and drag across to heading and drag across to TimeProbetoMask. TimeProbetoMask.
Go to Edit and select CopyGo to Edit and select Copy Open Excel Open Excel Paste (Ctrl-V) the cells into Paste (Ctrl-V) the cells into
the first cell of the the first cell of the spreadsheetspreadsheet

8 of 35Timing
Timing Exercise 1- Calculate Timing Exercise 1- Calculate ResultsResults
7. Calculate the 7. Calculate the Probe to Mask timeProbe to Mask time Create a Probe-Mask Create a Probe-Mask
columncolumn In first cell of that In first cell of that
column type the column type the formula: formula: =C2-B2=C2-B2
Copy formula down to Copy formula down to last row last row
Notes the times are Notes the times are about 17,33, and 50 about 17,33, and 50 msms
Compare to Compare to TimeProbeToMask TimeProbeToMask column, they should column, they should be the samebe the same
9 of 35Timing
Timing Exercise 1- Calculate Timing Exercise 1- Calculate ResultsResults
8. Calculate the 8. Calculate the Fixation to Probe timeFixation to Probe timeCreate a Fixation-Create a Fixation-
Probe columnProbe column In first cell of that In first cell of that
column type the column type the formula: =B2-A2formula: =B2-A2
Copy formula down to Copy formula down to last rowlast row
Note the times are Note the times are ~516 ms~516 ms
Compare to Compare to TimeFixationToProbe TimeFixationToProbe column, they should column, they should be the same be the same

10 of 35Timing
Timing Exercise 1- View ResultsTiming Exercise 1- View Results
If you know how to If you know how to use Excel pivot use Excel pivot tablestables, create a pivot , create a pivot table by selecting table by selecting columns ProbeDuration columns ProbeDuration to Mask-Probe, on Data to Mask-Probe, on Data menu, choose pivot menu, choose pivot table, press Next twice, table, press Next twice, choose Layout, Copy choose Layout, Copy and drag and drag ProbeDuration to row ProbeDuration to row and Mask-Probe to data and Mask-Probe to data twice, double click and twice, double click and select Average and select Average and StdDev as on the leftStdDev as on the left
Open My Documents\My Open My Documents\My Experiments\Workshop\E-Prime Experiments\Workshop\E-Prime Exercises\TimingExercises excel Exercises\TimingExercises excel spreadsheet and select spreadsheet and select Exercise1Pivot tabExercise1Pivot tab
View the calculated means and View the calculated means and SD of Probe and Mask time SD of Probe and Mask time
View the Pivot table of Probe-View the Pivot table of Probe-Mask based on ProbeDurationMask based on ProbeDuration
OR:OR:
11 of 35Timing
What would your report to a What would your report to a Journal?Journal?
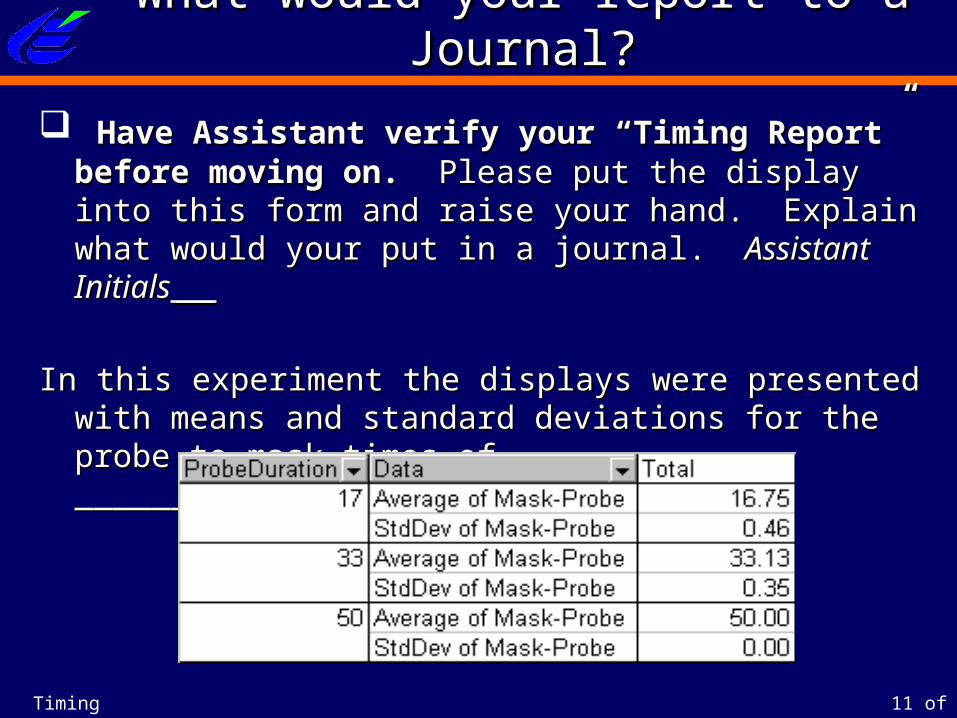
Have Assistant verify your “Timing Report” Have Assistant verify your “Timing Report” before moving on. before moving on. Please put the display into this Please put the display into this form and raise your hand.form and raise your hand. Explain what would your Explain what would your put in a journal. put in a journal. Assistant InitialsAssistant Initials ___ ___
In this experiment the displays were presented with In this experiment the displays were presented with means and standard deviations for the probe to means and standard deviations for the probe to mask times of ___________________________mask times of ___________________________

12 of 35Timing
Exercise 1a (Optional) – Use Script to Exercise 1a (Optional) – Use Script to Log Time Between Stimulus Log Time Between Stimulus
OnsetsOnsets
You can add an Inline object and add You can add an Inline object and add script to calculate and log the onset to script to calculate and log the onset to onset time for later analysis in E-onset time for later analysis in E-DataAid.DataAid.

13 of 35Timing
Timing Exercise 1 Study Timing Exercise 1 Study QuestionsQuestions
Could you at this point answer these questions?Could you at this point answer these questions?1.1. What would expect if you ran this exercise on What would expect if you ran this exercise on
a 100 Hertz monitor if it is set up for a 60 Hertz a 100 Hertz monitor if it is set up for a 60 Hertz monitor?monitor?
2.2. What if the PreRelease were set to 0 what What if the PreRelease were set to 0 what would you expect the times to be on a 60 would you expect the times to be on a 60 Hertz monitor?Hertz monitor?
3.3. How might you put in code to detect if the How might you put in code to detect if the times were different from the intended time by times were different from the intended time by more than a millisecond and log the problem?more than a millisecond and log the problem?
4.4. How might you put in code to be sure that the How might you put in code to be sure that the program is running on a 60 Hertz monitor?program is running on a 60 Hertz monitor?
Short Answers are included in the Exercise AppendixShort Answers are included in the Exercise Appendix

14 of 35Timing
Timing Exercise 2Timing Exercise 2This exercise contrasts event mode and This exercise contrasts event mode and
cumulative mode timing. Cumulative mode cumulative mode timing. Cumulative mode minimizes cumulative time error in an minimizes cumulative time error in an experiment. In this exercise you will:experiment. In this exercise you will:
1. Run My Documents\My Experiments\1. Run My Documents\My Experiments\Workshop\E-Prime Exercises\Workshop\E-Prime Exercises\TimingParadigm4AllModes and analyze the TimingParadigm4AllModes and analyze the timing.timing.
2. Use E-DataAid to output graphs and table 2. Use E-DataAid to output graphs and table for Excelfor Excel
3. Report the problem errors in timing3. Report the problem errors in timing

15 of 35Timing
Timing Exercise 2 – Create or Open EDAT Timing Exercise 2 – Create or Open EDAT filefile
1. Either run 1. Either run TimingParadigm4AllModes.es TimingParadigm4AllModes.es oror use the existing file. use the existing file.
2. In E-DataAid o2. In E-DataAid open My pen My Documents\My Experiments\Documents\My Experiments\Workshop\E-Prime Exercises\Workshop\E-Prime Exercises\TimingParadigm4 and run or open TimingParadigm4 and run or open TimingParadigmAllModes100-TimingParadigmAllModes100-1.EDAT file for data (which was 1.EDAT file for data (which was previously created) with E-previously created) with E-DataAid.DataAid.
16 of 35Timing
Get Cumulative Time Get Cumulative Time GraphGraph
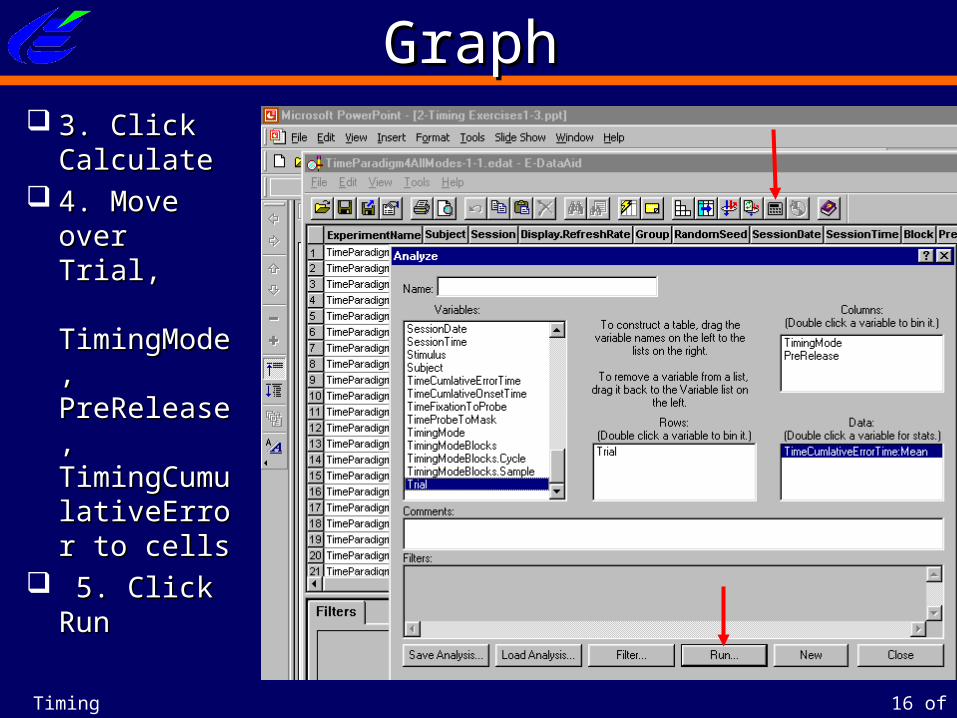
3. Click 3. Click CalculateCalculate
4. Move 4. Move over Trial, over Trial, TimingModTimingMode, e, PreReleasePreRelease, , TimingCumTimingCumulativeErroulativeError to cellsr to cells
5. Click 5. Click RunRun

17 of 35Timing
Examine Timing Send Examine Timing Send ExcelExcel
6. Select Plot6. Select Plot 7. Click Excel 7. Click Excel
PlotPlot
18 of 35Timing
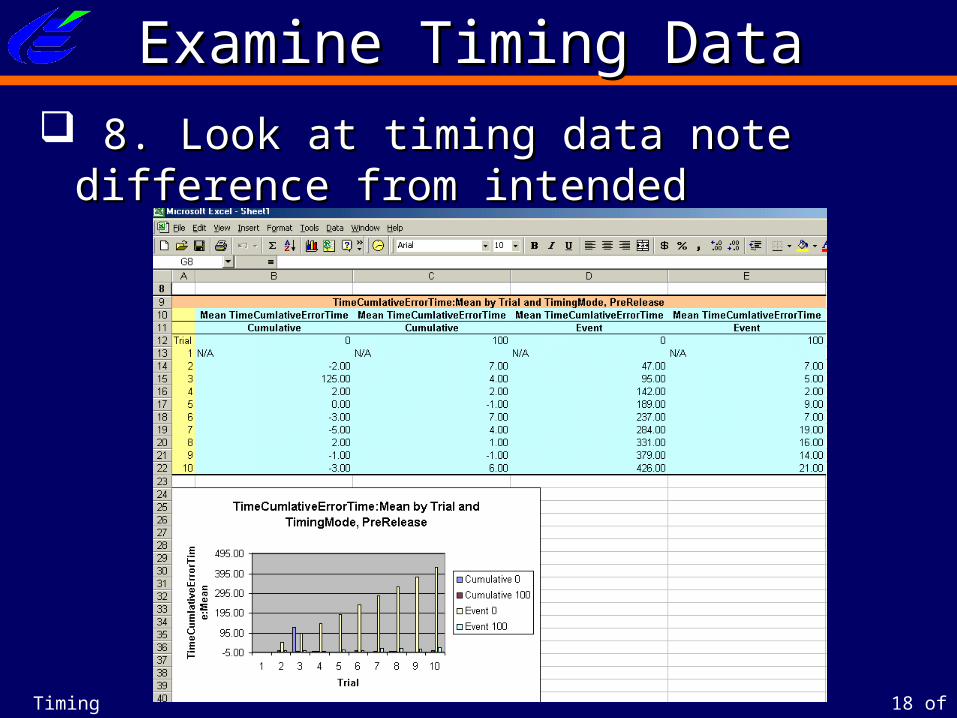
Examine Timing DataExamine Timing Data 8. Look at timing data note difference 8. Look at timing data note difference
from intendedfrom intended

19 of 35Timing
Zoom in on Timing ErrorZoom in on Timing Error 9. Click on Excel Graph change chart 9. Click on Excel Graph change chart
mode to line graph.mode to line graph. 10. Click on the Y-axis and right click 10. Click on the Y-axis and right click
and set max Y to 50. Note differences and set max Y to 50. Note differences in errorsin errors

20 of 35Timing
Use E-DataAid to Output Timing Use E-DataAid to Output Timing TableTable
11. Return to E-11. Return to E-DataAid, change DataAid, change Analysis Analysis Set Rows to Set Rows to
TimingModeTimingModePreReleasePreRelease
Set Data toSet Data toTimeCumulativeErroTimeCumulativeErro
rTimerTimeTimeFixationToProbeTimeFixationToProbeTimeProbeToMaskTimeProbeToMask TimeProbeOnsetTo TimeProbeOnsetTo
Onset meanOnset mean Time ProbeOnsetTo Time ProbeOnsetTo
Onset SD of SampleOnset SD of Sample

21 of 35Timing
Export Table to ExcelExport Table to Excel 12. Export to Excel by selecting 12. Export to Excel by selecting
StatView format and Excel CopyStatView format and Excel Copy

22 of 35Timing
Identify Poor TimingIdentify Poor Timing 13. Identify poor timing cases (off by a 13. Identify poor timing cases (off by a
refresh cycle). Note cumulative 100 ms refresh cycle). Note cumulative 100 ms prerelease correct, errors in all other cases. prerelease correct, errors in all other cases.

23 of 35Timing
How would your run your experiment?How would your run your experiment?How would you report it?How would you report it?
Have Assistant verify your “Timing Report” Have Assistant verify your “Timing Report” for a cumulative experimiment. for a cumulative experimiment. In this In this experiment we used ______ timing mode with the experiment we used ______ timing mode with the stimulus to stimulus time mean of ______ and SD of stimulus to stimulus time mean of ______ and SD of ______. ______.
Please put the display into this form and raise your Please put the display into this form and raise your hand.hand. Explain what would your put in a journal. Explain what would your put in a journal.
Assistant InitialsAssistant Initials ___ ___

24 of 35Timing
Timing Exercise 2a (optional) - Run Timing Timing Exercise 2a (optional) - Run Timing Paradigm4 Paradigm4
In Cumulative Mode, Change Event, RerunIn Cumulative Mode, Change Event, Rerun
1. Open TimingParadigm4.es file (My Documents\1. Open TimingParadigm4.es file (My Documents\My Experiments\Workshop\E-Prime Exercises).My Experiments\Workshop\E-Prime Exercises).
2. Run the program with subject number 1.2. Run the program with subject number 1. 3. Change the Timing Mode on the TrialProc 3. Change the Timing Mode on the TrialProc
displays (TrialInstructions, Fixation, Probe, Mask, displays (TrialInstructions, Fixation, Probe, Mask, FeedbackDisplay1) to Event and Prereleases to “0” FeedbackDisplay1) to Event and Prereleases to “0” or or load load TimingParadgim4EventTimeNoPreRelease.es.TimingParadgim4EventTimeNoPreRelease.es.
4. Run the experiment with subject number 2. 4. Run the experiment with subject number 2.

25 of 35Timing
Plot Cumulative Time Errors Plot Cumulative Time Errors Cumulative Mode With PreReleaseCumulative Mode With PreRelease
5. Make table and graph 5. Make table and graph of TimeCumulativeError of TimeCumulativeError by Block Cumulative Run by Block Cumulative Run 1-11-1 Open Program E-DataAidOpen Program E-DataAid Open data file Open data file
TimingParadigm4-TimingParadigm4-1-1-1.1.edat edat
Click CalculateClick Calculate Move Block to rowMove Block to row Move Move
TimeCumulativeErrorTimTimeCumulativeErrorTime to Data e to Data
Click RunClick Run Click PlotClick Plot Click Excel PlotClick Excel Plot
6. Note time variation 6. Note time variation within one refresh and within one refresh and not not increasingnot not increasing
TimeCumlativeErrorTime:Mean by Block
-2.00
-1.00
0.00
1.00
2.003.00
4.00
5.00
6.00
7.00
1 2 3 4 5 6 7 8 9 10 11 12 13 14 15 16
Block
Tim
eC
um
lati
veE
rro
rTim
e:M
ea
n

26 of 35Timing
Plot Cumulative Time Errors Plot Cumulative Time Errors Event Mode Without PreReleaseEvent Mode Without PreRelease
TimeCumlativeErrorTime:Mean by Block
0.00
100.00200.00
300.00
400.00
500.00600.00
700.00
800.00
1 2 3 4 5 6 7 8 9 10 11 12 13 14 15 16
Block
Tim
eC
um
lati
veE
rro
rTim
e:M
ea
n
7. Make table and graph 7. Make table and graph of TimeCumulativeError of TimeCumulativeError by Block Evente Run 2-1by Block Evente Run 2-1 Close E-Data Aid Close E-Data Aid
WindowsWindows Open data file Open data file
TimingParadigm4-TimingParadigm4-22--1.1.edat edat
Click CalculateClick Calculate Move Block to rowMove Block to row Move Move
TimeCumulativeErrorTimTimeCumulativeErrorTime to Data e to Data
Click RunClick Run Click PlotClick Plot Click Excel PlotClick Excel Plot
8. Note time variation is 8. Note time variation is increasing with every increasing with every refreshrefresh

27 of 35Timing
Compare Results from Both Compare Results from Both ModesModes
9. Note 9. Note characteristics of characteristics of datadata Cumulative mode Cumulative mode
errors within a refresh errors within a refresh (maximum of 7ms no (maximum of 7ms no cumulative drift)cumulative drift)
Event mode increase Event mode increase by significant amount by significant amount with each event with each event causing substantial causing substantial cumulative drift (in cumulative drift (in this example an this example an average of 47 ms with average of 47 ms with a maximum of 710 a maximum of 710 ms)ms)
-2.00
-1.00
0.00
1.00
2.00
3.00
4.00
5.00
6.00
7.00
1 2 3 4 5 6 7 8 9 10 11 12 13 14 15 16
Block
Tim
eC
um
lati
veE
rro
rTim
e:M
ea
n
0.00
100.00
200.00
300.00
400.00
500.00
600.00
700.00
800.00
1 2 3 4 5 6 7 8 9 10 11 12 13 14 15 16
Block
Tim
eC
um
lati
veE
rro
rTim
e:M
ea
n
Cumulative Mode PreReleaseCumulative Mode PreRelease
Event Mode No PreReleaseEvent Mode No PreRelease

28 of 35Timing
Timing Exercise3Timing Exercise3 1. Open My Documents\My Experiments\1. Open My Documents\My Experiments\
Workshop\E-Prime Exercises\Workshop\E-Prime Exercises\TimingParadigm5 and runTimingParadigm5 and run
2. Note Steps involved in Caching Images2. Note Steps involved in Caching Images
3. Use E-DataAid to select TargetDuration 3. Use E-DataAid to select TargetDuration and OnsetToOnsetand OnsetToOnset
4. Plot the difference between Target and 4. Plot the difference between Target and Actual TimeActual Time

29 of 35Timing
Steps to Caching ImagesSteps to Caching Images• Create CanvasCacheCreate CanvasCache
• Load CacheLoad Cache
• Display CacheDisplay Cache

30 of 35Timing
Arrange ColumnsArrange Columns 1. Open 1. Open
TimingParadigm5-3-TimingParadigm5-3-1.edat file1.edat file
2. Select Arrange 2. Select Arrange Columns tools, click Columns tools, click Remove AllRemove All
3. Select 3. Select TargetDuration and TargetDuration and OnsetToOnset, click Add OnsetToOnset, click Add and OKand OK
4. Copy two columns to 4. Copy two columns to ExcelExcel

31 of 35Timing
Chart Results in ExcelChart Results in Excel In Excel select In Excel select
both columns both columns and click on and click on Graph WizardGraph Wizard
Make line Make line chart of timechart of time
Note error Note error target versus target versus intendedintended

32 of 35Timing
View ResultsView Results Note error target versus intendedNote error target versus intended

33 of 35Timing
View ResultsView Results Determine max speed presentation Determine max speed presentation
with disk reads and caching.with disk reads and caching.
Network Server Intended and Acutal Display
0
50
100
150
200
250
1
28
55
82
10
9
13
6
16
3
19
0
21
7
24
4
27
1
29
8
32
5
35
2
37
9
Image
Mill
ise
co
nd
s
TargetDuration
OnsetToOnset

34 of 35Timing
Timing Exercise 2 Cumulative Timing Exercise 2 Cumulative TimeTime
Could you at this point?Could you at this point?
1.1. Specify when to use Cumulative Time and Specify when to use Cumulative Time and Event Time methods?Event Time methods?
2.2. Analyze the timing of a cumulative Analyze the timing of a cumulative experiment and report accurately the experiment and report accurately the timing precision in a journal article?timing precision in a journal article?
3.3. Specify the disadvantage of using Specify the disadvantage of using PreRelease and when must you be careful PreRelease and when must you be careful about it?about it?
Short Answers are included in the Exercise AppendixShort Answers are included in the Exercise Appendix

35 of 35Timing
Timing Exercise 3 Caching Timing Exercise 3 Caching QuestionsQuestions
Could you at this point?Could you at this point?
1.1. Specify the range of display times in which Specify the range of display times in which prerelease is sufficient for the computer to prerelease is sufficient for the computer to keep up and caching is not necessary?keep up and caching is not necessary?
2.2. Determine the maximal rate at which you Determine the maximal rate at which you could display images before the computer could display images before the computer can not keep up?can not keep up?
3.3. Add new images to TimingParadigm 5 to Add new images to TimingParadigm 5 to allow rapid presentation of those images?allow rapid presentation of those images?
Short Answers are included in the Exercise AppendixShort Answers are included in the Exercise Appendix


![Surgical Timing and Rehabilitation for Multiple Ligament Knee … · 2018-05-29 · [WBAT] gait and unrestricted range of motion [ROM] exercises starting within one week of surgery](https://static.fdocuments.in/doc/165x107/5c987dd009d3f2c9198bf497/surgical-timing-and-rehabilitation-for-multiple-ligament-knee-2018-05-29.jpg)