1 Novo Nordisk A focused global healthcare company with biotech expertise Investor Presentation...
51
1 Novo Nordisk Novo Nordisk A focused global healthcare company A focused global healthcare company with biotech expertise with biotech expertise Investor Presentation Investor Presentation August 2001 August 2001
-
date post
22-Dec-2015 -
Category
Documents
-
view
221 -
download
6
Transcript of 1 Novo Nordisk A focused global healthcare company with biotech expertise Investor Presentation...
1
Novo NordiskNovo Nordisk
A focused global healthcare company A focused global healthcare company with biotech expertisewith biotech expertise
Investor PresentationInvestor Presentation
August 2001August 2001
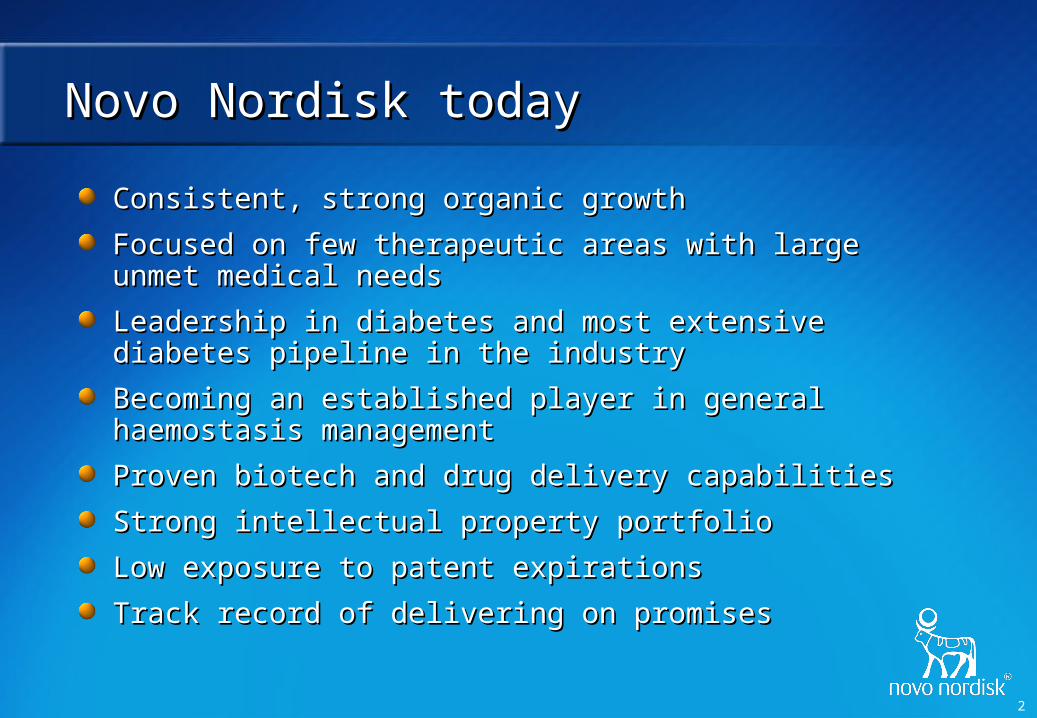
2
Novo Nordisk todayNovo Nordisk today
Consistent, strong organic growthConsistent, strong organic growth
Focused on few therapeutic areas with large unmet Focused on few therapeutic areas with large unmet medical needsmedical needs
Leadership in diabetes and most extensive diabetes Leadership in diabetes and most extensive diabetes pipeline in the industrypipeline in the industry
Becoming an established player in general haemostasis Becoming an established player in general haemostasis managementmanagement
Proven biotech and drug delivery capabilitiesProven biotech and drug delivery capabilities
Strong intellectual property portfolioStrong intellectual property portfolio
Low exposure to patent expirationsLow exposure to patent expirations
Track record of delivering on promisesTrack record of delivering on promises
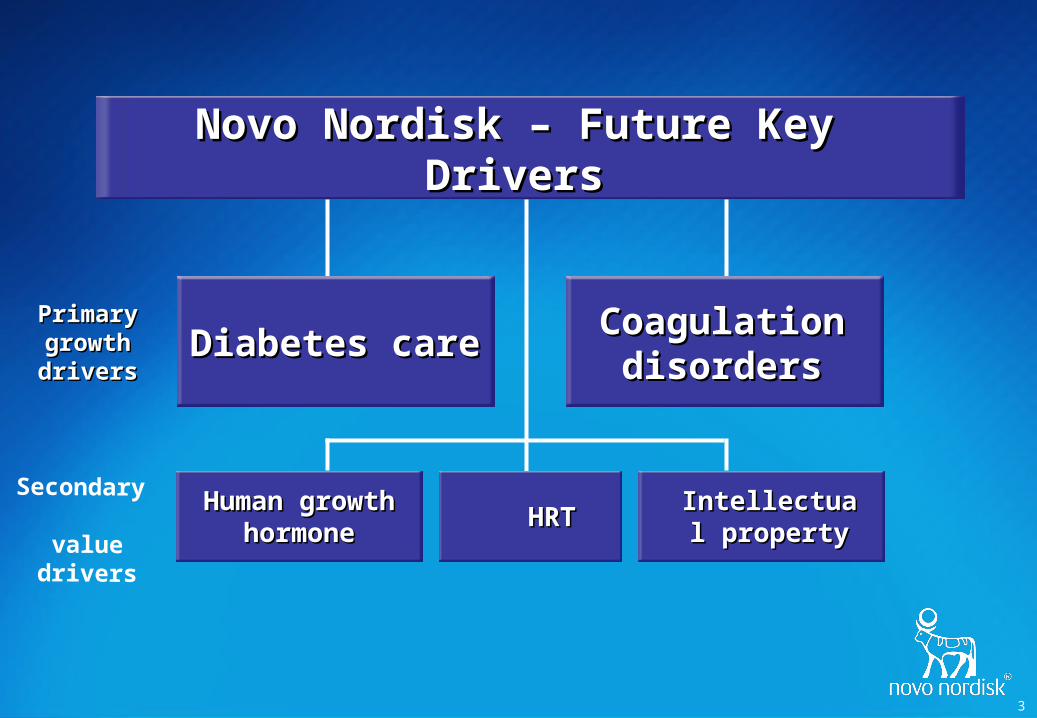
3
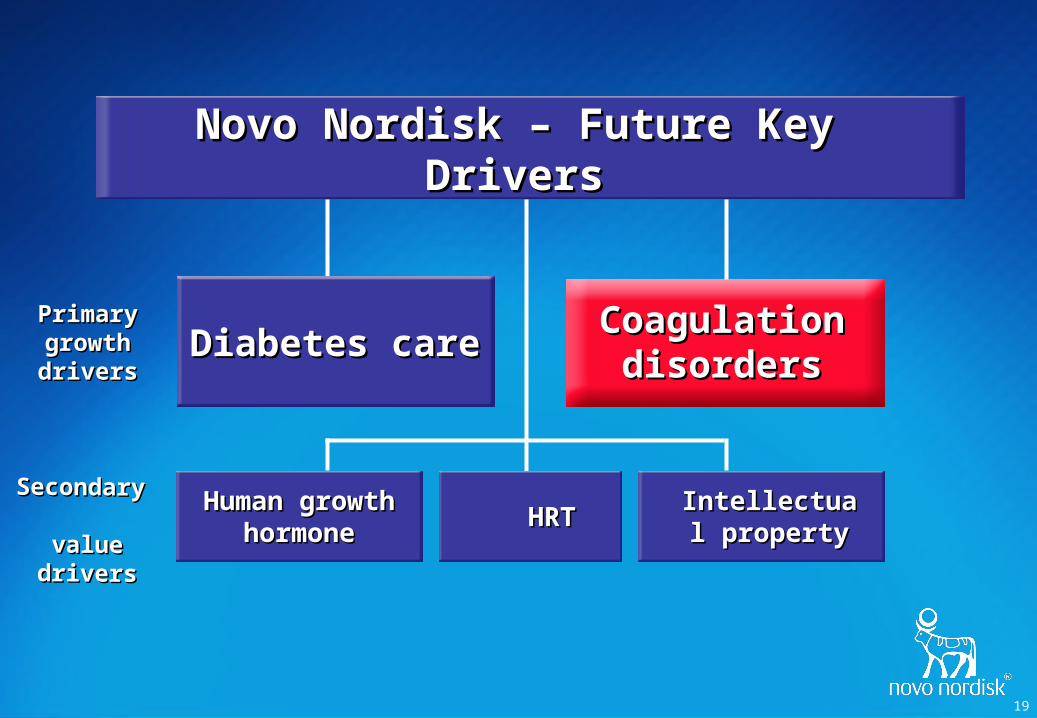
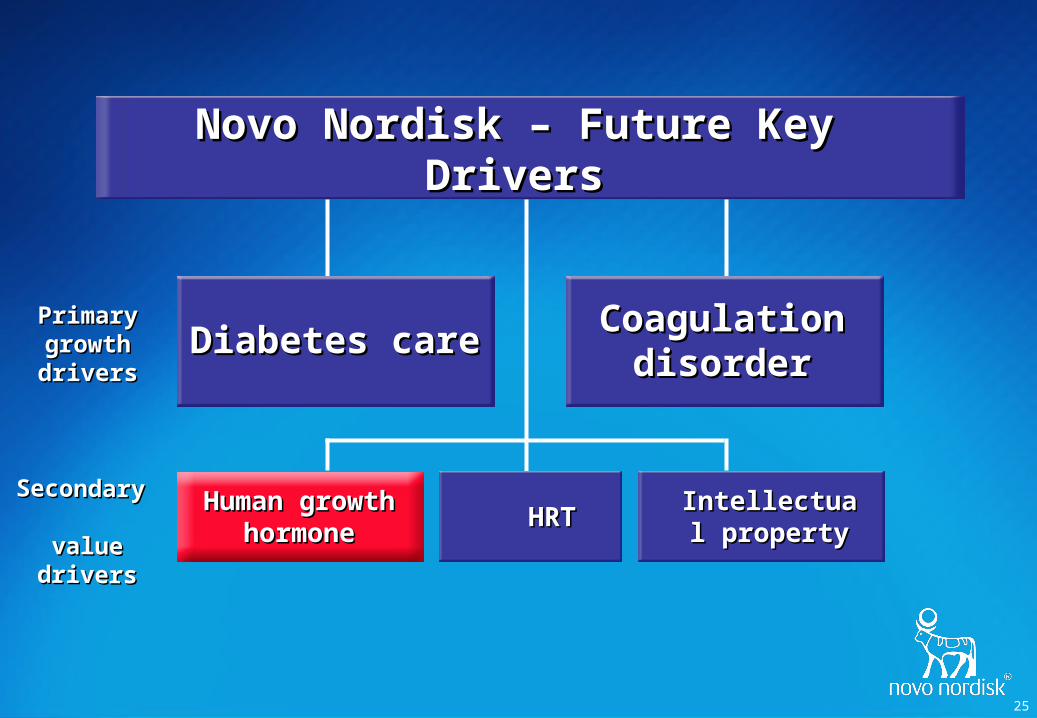
HRTHRTHuman growth Human growth hormonehormone
Intellectual Intellectual propertyproperty
Diabetes careDiabetes care Coagulation Coagulation disordersdisorders
PrimaryPrimarygrowth growth driversdrivers
Secondary value
drivers
Novo Nordisk – Future Key DriversNovo Nordisk – Future Key Drivers
4
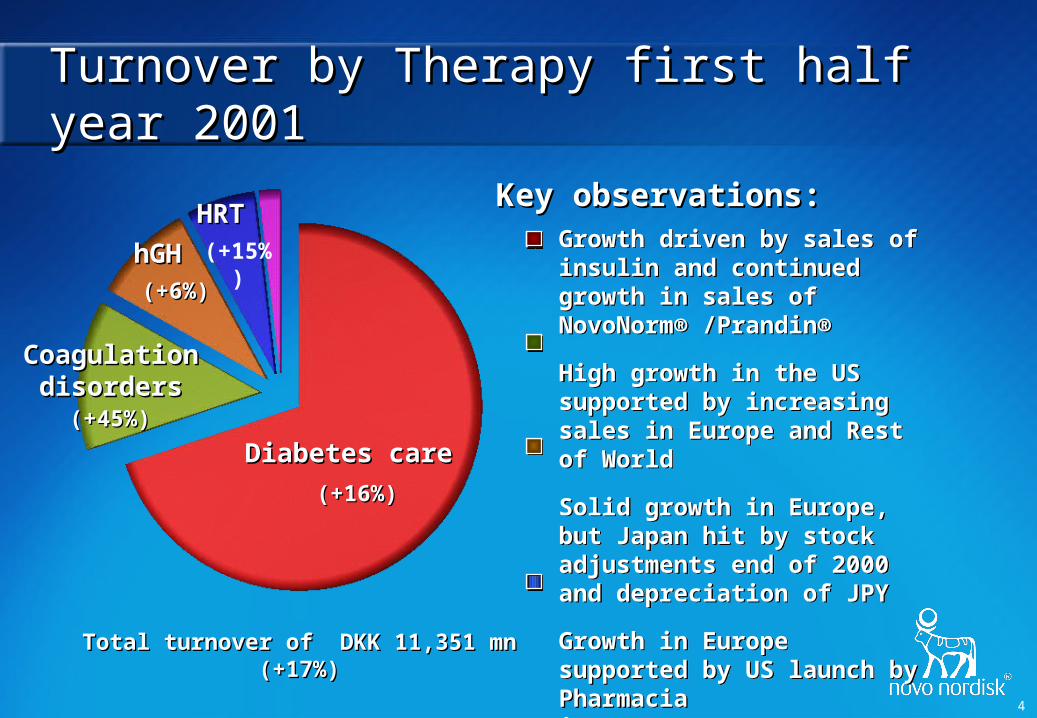
Turnover by Therapy first half year 2001Turnover by Therapy first half year 2001
Growth driven by sales of insulin and continued growth in sales of NovoNorm® /Prandin®
High growth in the US supported by increasing sales in Europe and Rest of World
Solid growth in Europe, but Japan hit by stock adjustments end of 2000 and depreciation of JPY
Growth in Europe supported by US launch by Pharmacia in Q2/Q3 2000
Diabetes careDiabetes care
(+16%)(+16%)
CoagulationCoagulationdisordersdisorders
(+45%)(+45%)
(+6%)(+6%)
hGHhGH
HRTHRT(+15%)
Key observations:Key observations:
Total turnover of DKK 11,351 mn (+17%)Total turnover of DKK 11,351 mn (+17%)
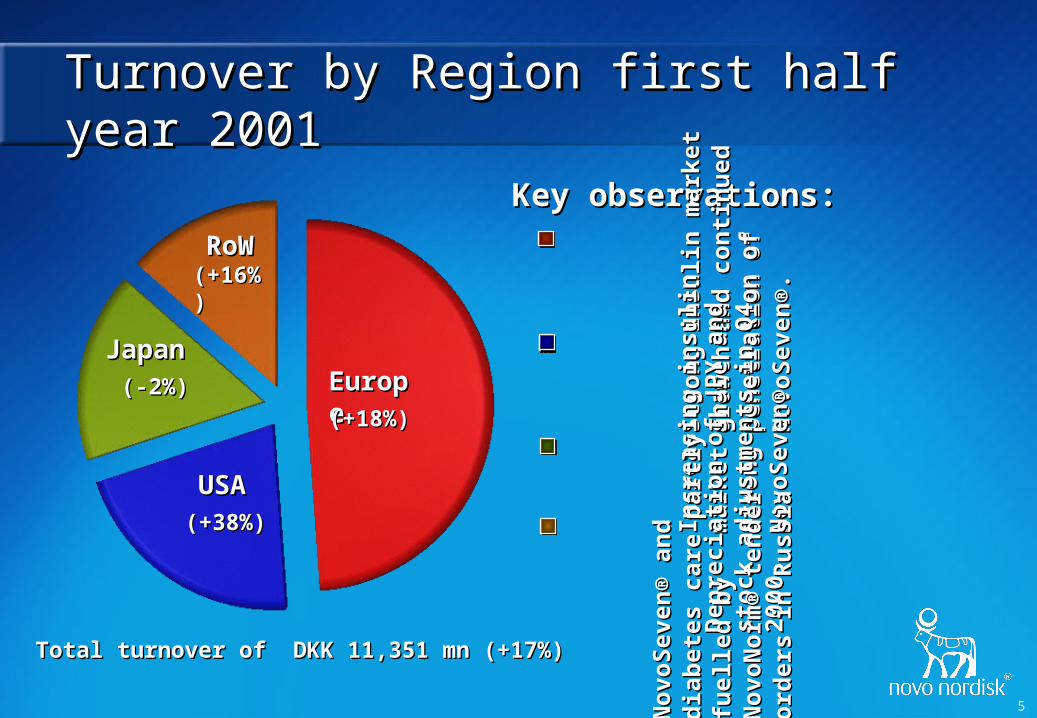
5
Key observations:Key observations:
Turnover by Region first half year 2001Turnover by Region first half year 2001
Str
on
g i
nsu
lin
mar
ket
gro
wth
S
tro
ng
in
suli
n m
arke
t g
row
th
and
co
nti
nu
ed p
enet
rati
on
of
and
co
nti
nu
ed p
enet
rati
on
of
No
voS
even
No
voS
even
®®. .
Incr
easi
ng
in
suli
n m
arke
t In
crea
sin
g i
nsu
lin
mar
ket
shar
e an
d s
tro
ng
sh
are
and
str
on
g
pen
etra
tio
n o
f N
ovo
Sev
enp
enet
rati
on
of
No
voS
even
®®
Dep
reci
atio
n o
f JP
Y a
nd
sto
ck
Dep
reci
atio
n o
f JP
Y a
nd
sto
ck
adju
stm
ents
in
Q4
2000
adju
stm
ents
in
Q4
2000
No
voS
even
No
voS
even
® a
nd
dia
bet
es
® a
nd
dia
bet
es
care
par
tly
fuel
led
by
care
par
tly
fuel
led
by
No
voN
orm
No
voN
orm
®® t
end
er
ten
der
o
rder
s in
Ru
ssia
ord
ers
in R
uss
ia
EuropeEurope(+18%)(+18%)
RoWRoW(+16%)(+16%)
USAUSA(+38%)(+38%)
JapanJapan(-2%)(-2%)
Total turnover of DKK 11,351 mn (+17%)Total turnover of DKK 11,351 mn (+17%)

6
HRTHRTHuman growth Human growth hormonehormone
Intellectual Intellectual propertyproperty
Diabetes careDiabetes care Coagulation Coagulation disordersdisorders
PrimaryPrimarygrowth growth driversdrivers
Secondary value
drivers
Novo Nordisk – Future Key DriversNovo Nordisk – Future Key Drivers
Diabetes careDiabetes care
7
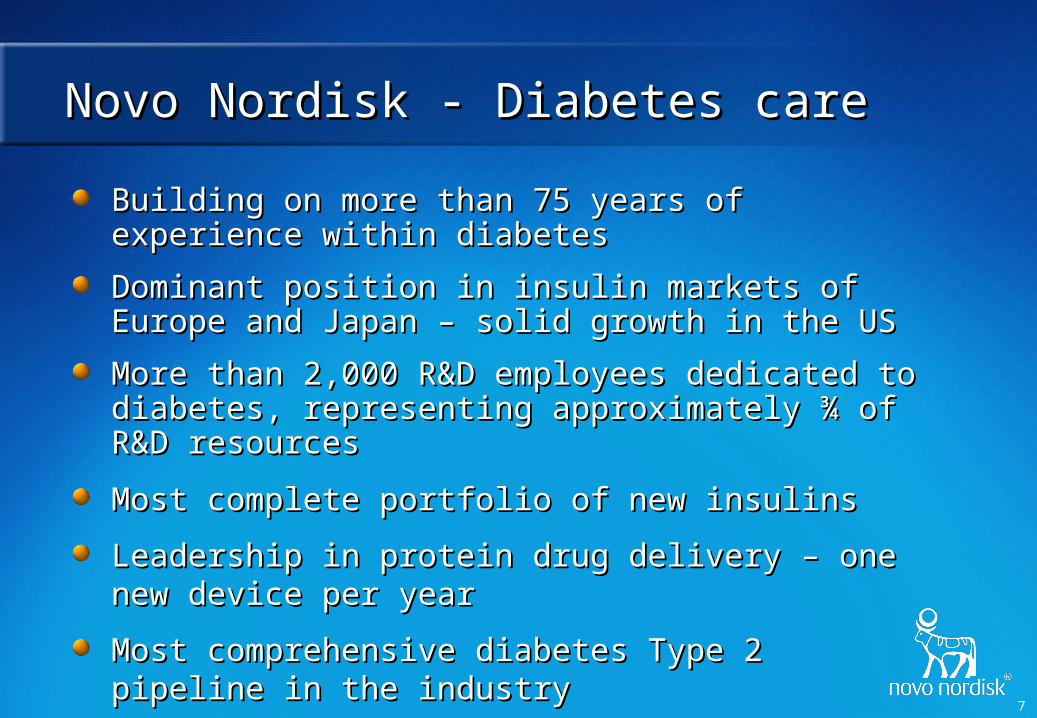
Novo Nordisk - Diabetes careNovo Nordisk - Diabetes care
Building on more than 75 years of experience within Building on more than 75 years of experience within diabetesdiabetes
Dominant position in insulin markets of Europe and Dominant position in insulin markets of Europe and Japan – solid growth in the USJapan – solid growth in the US
More than 2,000 R&D employees dedicated to diabetes, More than 2,000 R&D employees dedicated to diabetes, representing approximately ¾ of R&D resourcesrepresenting approximately ¾ of R&D resources
Most complete portfolio of new insulinsMost complete portfolio of new insulins
Leadership in protein drug delivery – one new device per Leadership in protein drug delivery – one new device per yearyear
Most comprehensive diabetes Type 2 pipeline in the Most comprehensive diabetes Type 2 pipeline in the industryindustry
8
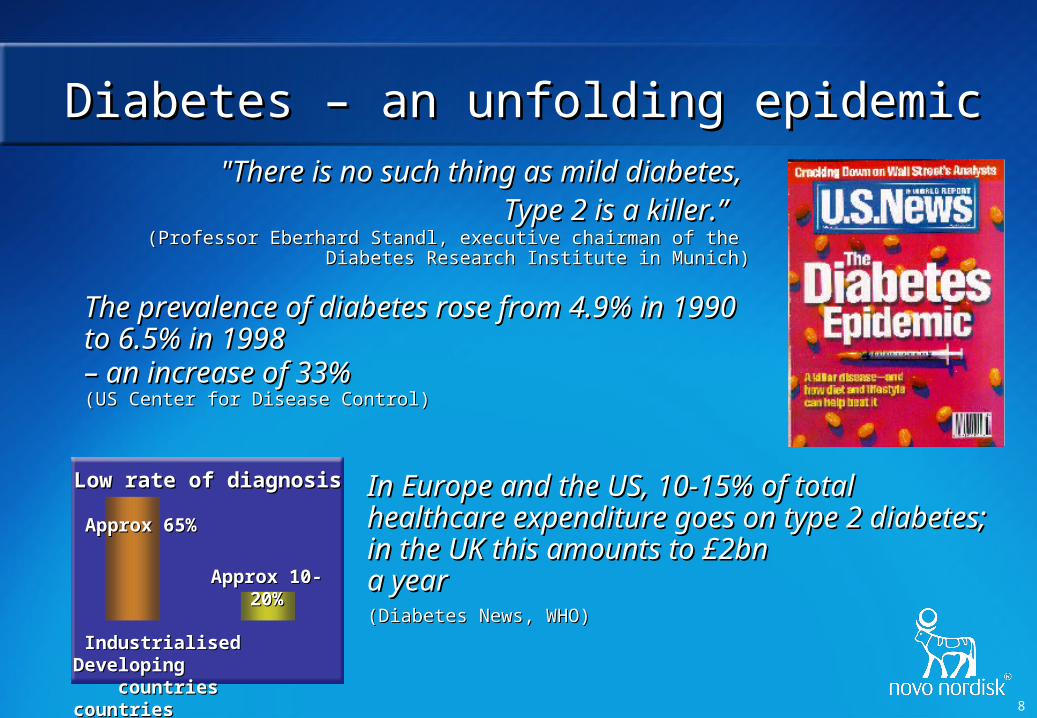
Diabetes – an unfolding epidemicDiabetes – an unfolding epidemic
Industrialised Developing Industrialised Developing countries countriescountries countries
Low rate of diagnosisLow rate of diagnosis
Approx 65%Approx 65%
Approx 10-20%Approx 10-20%
"There is no such thing as mild diabetes, "There is no such thing as mild diabetes, Type 2 is a killer.”Type 2 is a killer.”
(Professor Eberhard Standl, executive chairman of the (Professor Eberhard Standl, executive chairman of the Diabetes Research Institute in Munich)Diabetes Research Institute in Munich)
The prevalence of diabetes rose from 4.9% in 1990 The prevalence of diabetes rose from 4.9% in 1990 to 6.5% in 1998 to 6.5% in 1998 – an increase of 33%– an increase of 33% (US Center for Disease Control)(US Center for Disease Control)
In Europe and the US, 10-15% of total In Europe and the US, 10-15% of total healthcare expenditure goes on type 2 healthcare expenditure goes on type 2 diabetes; in the UK this amounts to £2bn diabetes; in the UK this amounts to £2bn a year a year (Diabetes News, WHO)(Diabetes News, WHO)

9
Towards more intensive/flexible treatmentTowards more intensive/flexible treatment
Short-acting market growth: Short-acting market growth: 11.5% CAGR since 199611.5% CAGR since 1996
Premixed market growth: Premixed market growth: 9.3% CAGR since 19969.3% CAGR since 1996
Long-acting market growth: Long-acting market growth: 0.4% CAGR since 19960.4% CAGR since 1996
Note: Note: All figures are based on MAT Q1 volumes, industrialised world only. All figures are based on MAT Q1 volumes, industrialised world only.
Novo NordiskNovo Nordiskmarket share 2001market share 2001
00
2020
4040
6060
8080
100100
120120
140140
160160
180180
19961996 19971997 19981998 19991999 20002000 20012001
Meg
a Un
its in 1,000
Meg
a Un
its in 1,000
Insulin market volumeInsulin market volume
25% 39%
36%25%
39% 36%
19%19%
33% 47%
33% 47%
+6%+6%+8%+8%
+8%+8%+3%+3%+5%+5%
39%39%
52%52%
41%41%
Long-actingLong-acting
PremixedPremixed
Short-acting Short-acting
10
6.2%6.2%
4.0%4.0%
9.1%9.1%
11.8%11.8%
0.8%0.8%
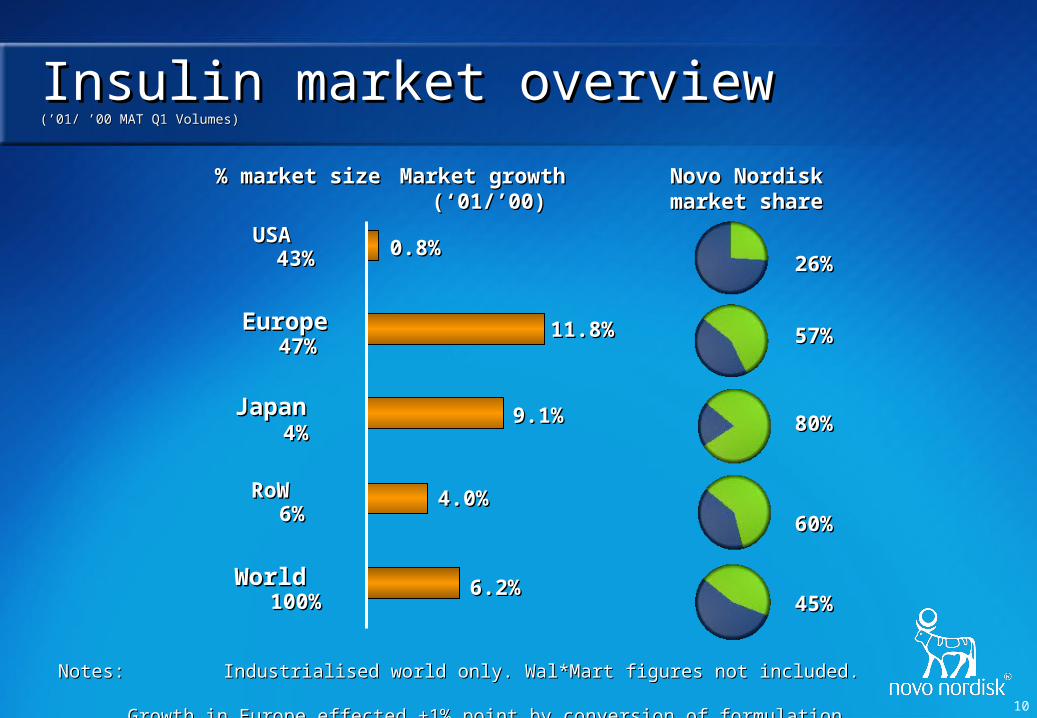
World World
RoW RoW
Japan Japan
Europe Europe
USA USA
Insulin market overviewInsulin market overview(’01/ ’00 MAT Q1 Volumes)(’01/ ’00 MAT Q1 Volumes)
Novo NordiskNovo Nordiskmarket sharemarket share
Market growth Market growth (‘(‘001/’00)1/’00)
4343%%
4747%%
4%4%
66%%
% market size % market size
100%100%
Notes: Notes: Industrialised world only. Wal*Mart figures not included. Industrialised world only. Wal*Mart figures not included. Growth in Europe effected +1% point by conversion of formulation. Growth in Europe effected +1% point by conversion of formulation.
26%26%
57%57%
80%80%
60%60%
45%45%

11
Upgrading the insulin marketUpgrading the insulin market
De
vic
e p
en
etr
atio
nD
ev
ice
pe
ne
trat
ion
Insu
lin a
nal
og
ue
Insu
lin a
nal
og
ue
pe
ne
tra
tio
np
en
etr
ati
on
100%
100%
100%
100%
0%0%
(+50
% p
rem
ium
)(+
50%
pre
miu
m)
(+30
% p
rem
ium
)(+
30%
pre
miu
m)
Increasing turnover Increasing turnover per patientper patient
US
A
Jap
anE
uro
pe
12
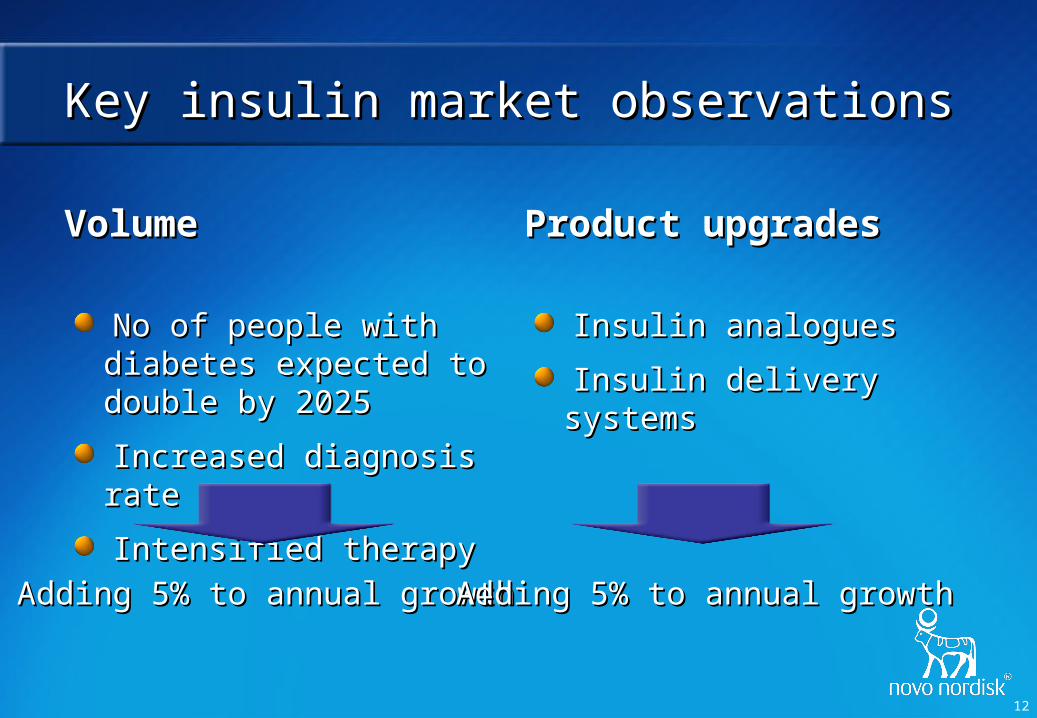
Key insulin market observationsKey insulin market observations
VolumeVolume
No of people with diabetes No of people with diabetes expected to double by 2025expected to double by 2025
Increased diagnosis rateIncreased diagnosis rate
Intensified therapyIntensified therapy
Product upgradesProduct upgrades
Insulin analoguesInsulin analogues
Insulin delivery systemsInsulin delivery systems
Adding 5% to annual growthAdding 5% to annual growth Adding 5% to annual growthAdding 5% to annual growth++
13
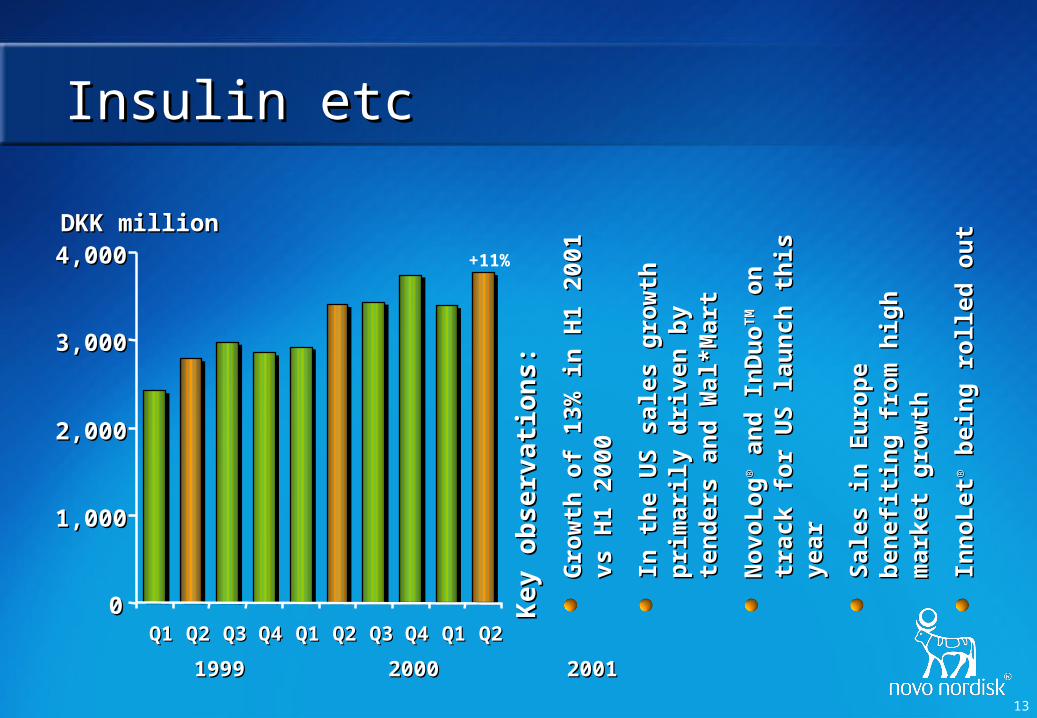
Insulin etcInsulin etc
Ke
y o
bs
erva
tio
ns
:K
ey
ob
ser
vati
on
s:
Gro
wth
of
13%
in
H1
2001
vs
Gro
wth
of
13%
in
H1
2001
vs
H1
2000
H1
2000
In t
he
US
sal
es g
row
th
In t
he
US
sal
es g
row
th
pri
mar
ily
dri
ven
by
ten
der
s p
rim
aril
y d
rive
n b
y te
nd
ers
and
Wal
*Mar
tan
d W
al*M
art
No
voL
og
No
voL
og
®® a
nd
In
Du
o a
nd
In
Du
oT
MT
M o
n
on
tr
ack
for
US
lau
nch
th
is y
ear
trac
k fo
r U
S l
aun
ch t
his
yea
r
Sal
es i
n E
uro
pe
ben
efit
ing
S
ales
in
Eu
rop
e b
enef
itin
g
fro
m h
igh
mar
ket
gro
wth
fr
om
hig
h m
arke
t g
row
th
Inn
oL
etIn
no
Let
®® b
ein
g r
oll
ed o
ut
bei
ng
ro
lled
ou
t
00
1,0001,000
2,0002,000
3,0003,000
4,0004,000
Q1Q1 Q2Q2 Q3Q3 Q4Q4 Q1Q1 Q2Q2 Q3Q3 Q4Q4 Q1Q1 Q2Q2
DKK millionDKK million
19991999 2000 2001 2000 2001
+11%
14
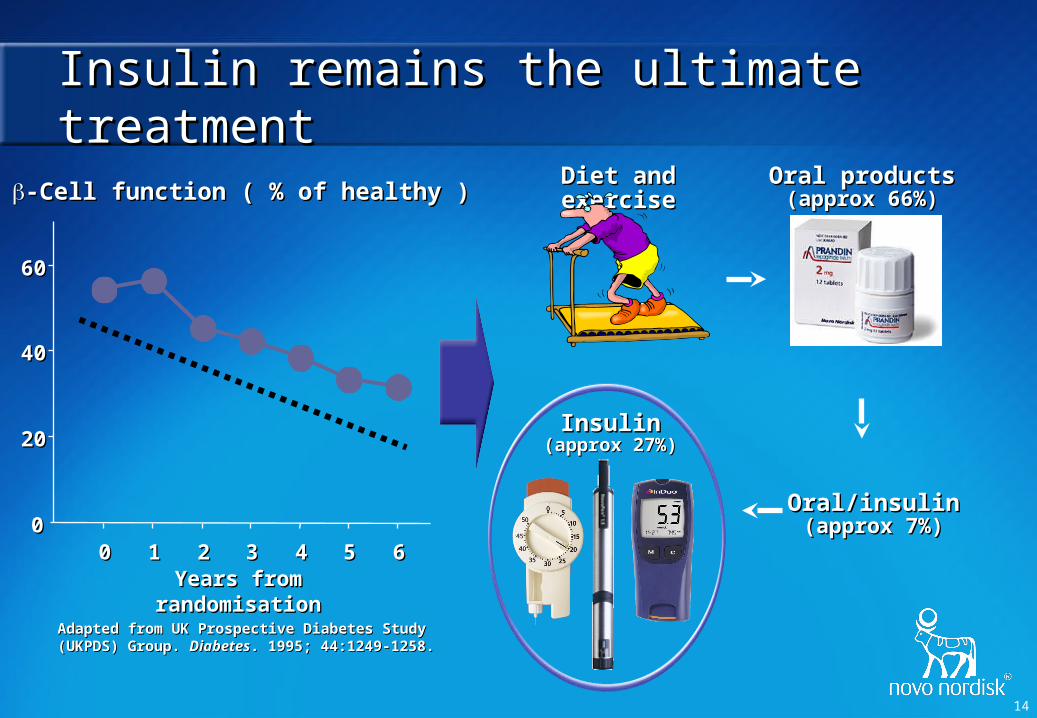
Insulin remains the ultimate treatmentInsulin remains the ultimate treatment
00
2020
4040
6060
00 11 22 33 44 55 66Years from randomisationYears from randomisation
Adapted from UK Prospective Diabetes Study (UKPDS) Adapted from UK Prospective Diabetes Study (UKPDS) Group. Group. DiabetesDiabetes. 1995; 44:1249-1258.. 1995; 44:1249-1258.
-Cell function ( % of healthy ) -Cell function ( % of healthy ) Diet and exerciseDiet and exercise Oral productsOral products
(approx 66%)(approx 66%)
Oral/insulinOral/insulin(approx 7%)(approx 7%)
InsulinInsulin(approx 27%)(approx 27%)

15
NovoNormNovoNorm®® /Prandin /Prandin®®
Ke
y o
bs
erva
tio
ns
:K
ey
ob
ser
vati
on
s:
Gro
wth
of
50%
in
H1
2001
G
row
th o
f 50
% i
n H
1 20
01
vs H
1 20
00vs
H1
2000
In E
uro
pe
No
voN
orm
In
Eu
rop
e N
ovo
No
rm ®®
co
nti
nu
ed t
o p
enet
rate
co
nti
nu
ed t
o p
enet
rate
n
icel
yn
icel
y
Fir
st h
alf
2001
eff
ecte
d b
y F
irst
hal
f 20
01 e
ffec
ted
by
ten
der
ord
ers
in R
uss
ia a
nd
te
nd
er o
rder
s in
Ru
ssia
an
d
sto
ck p
ilin
g i
n t
he
US
sto
ck p
ilin
g i
n t
he
US
Fir
st m
ove
in
to O
ral
An
ti
Fir
st m
ove
in
to O
ral
An
ti
Dia
bet
ics
(OA
D)
Dia
bet
ics
(OA
D)
DKK millionDKK million
19991999 2000 2001 2000 2001
00
100100
200200
300300
400400
500500
Q1Q1 Q2Q2 Q3Q3 Q4Q4 Q1Q1 Q2Q2 Q3Q3 Q4Q4 Q1Q1 Q2Q2
+49%

16
00
5050
100100
150150
200200
250250
300300
350350
19961996 19971997 19981998 19991999 20002000 20012001
MA
TQ
1.19
96=
100
MA
TQ
1.19
96=
100
Growth opportunities in OADGrowth opportunities in OAD
Sales development in USDSales development in USDCAGR: 26%CAGR: 26%
No of treated patientsNo of treated patients CAGR: 13%CAGR: 13%
Growth in USD 5.8 bn OAD marketGrowth in USD 5.8 bn OAD marketKey observations Novo NordiskKey observations Novo Nordisk
Experience in the OAD Experience in the OAD market from market from NovoNormNovoNorm®® /Prandin /Prandin®®
Novartis partner on Novartis partner on NN622 for North NN622 for North AmericaAmerica
Broad pipeline of Broad pipeline of innovative approaches innovative approaches for Type 2 diabetesfor Type 2 diabetes

17
Diabetes pipelineDiabetes pipeline
NN2211NN2211 (GLP-1 analogue)(GLP-1 analogue)
NN1215NN1215 (LABI)(LABI)
NN1998NN1998 (AERx)(AERx)
NN4201NN4201 (Hepatic glucose regulator)(Hepatic glucose regulator)
NN304NN304 (Basal analogue) (Basal analogue)
NN414NN414 (Insulin secretion)(Insulin secretion)
NN622NN622 (Dual-acting sensitiser)(Dual-acting sensitiser)
Phase 1Phase 1 Phase 2Phase 2 Phase 3Phase 3
NN2344NN2344 (Insulin sensitiser)(Insulin sensitiser)
18
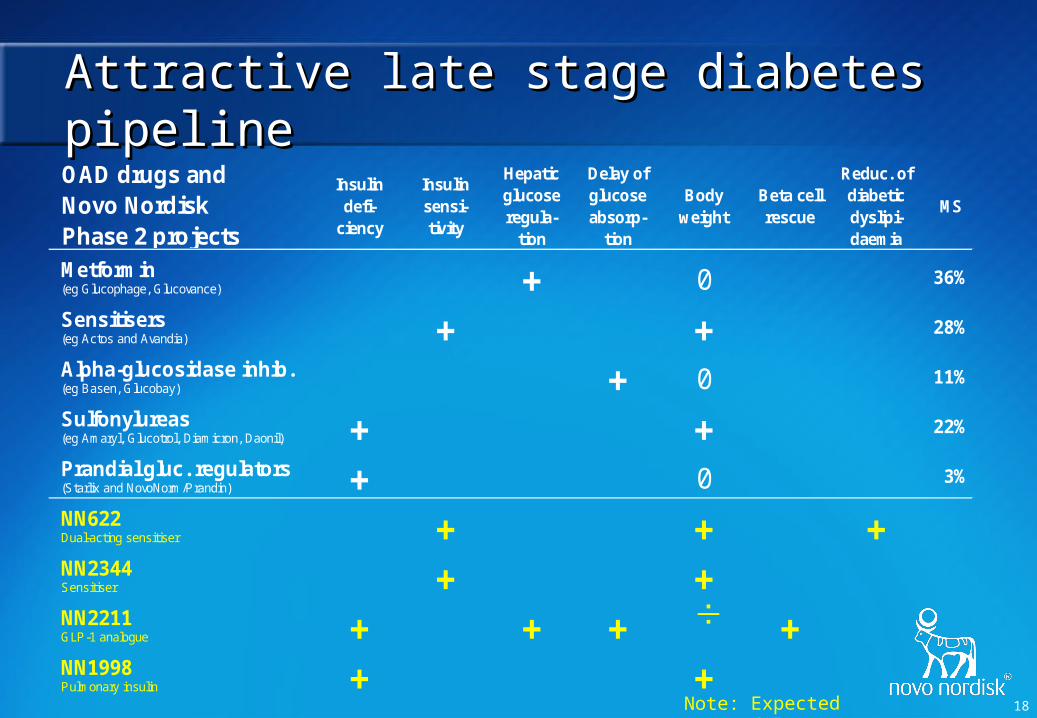
Attractive late stage diabetes pipelineAttractive late stage diabetes pipelineOAD drugs and Novo Nordisk Phase 2 projects
Insulin defi-
ciency
Insulin sensi-tivity
Hepatic glucose regula-
tion
Delay of glucose absorp-
tion
Body weight
Beta cell rescue
Reduc. of diabetic dyslipi-daemia
MS
Metformin (eg Glucophage, Glucovance) + 0 36%
Sensitisers (eg Actos and Avandia) + + 28%
Alpha-glucosidase inhib. (eg Basen, Glucobay) + 0 11%
Sulfonylureas (eg Amaryl, Glucotrol, Diamicron, Daonil) + + 22%
Prandial gluc. regulators (Starlix and NovoNorm/Prandin) + 0 3%
NN622Dual-acting sensitiser + + +NN2344Sensitiser + +NN2211GLP-1 analogue + + + +NN1998Pulmonary insulin + +
Note: Expected profiles
19
Novo Nordisk – Future Key DriversNovo Nordisk – Future Key Drivers
Diabetes careDiabetes careCoagulation Coagulation
disordersdisorders
PrimaryPrimarygrowth growth driversdrivers
Secondary Secondary valuevalue
driversdrivers HRTHRTHuman growth Human growth
hormonehormoneIntellectual Intellectual
propertyproperty
20
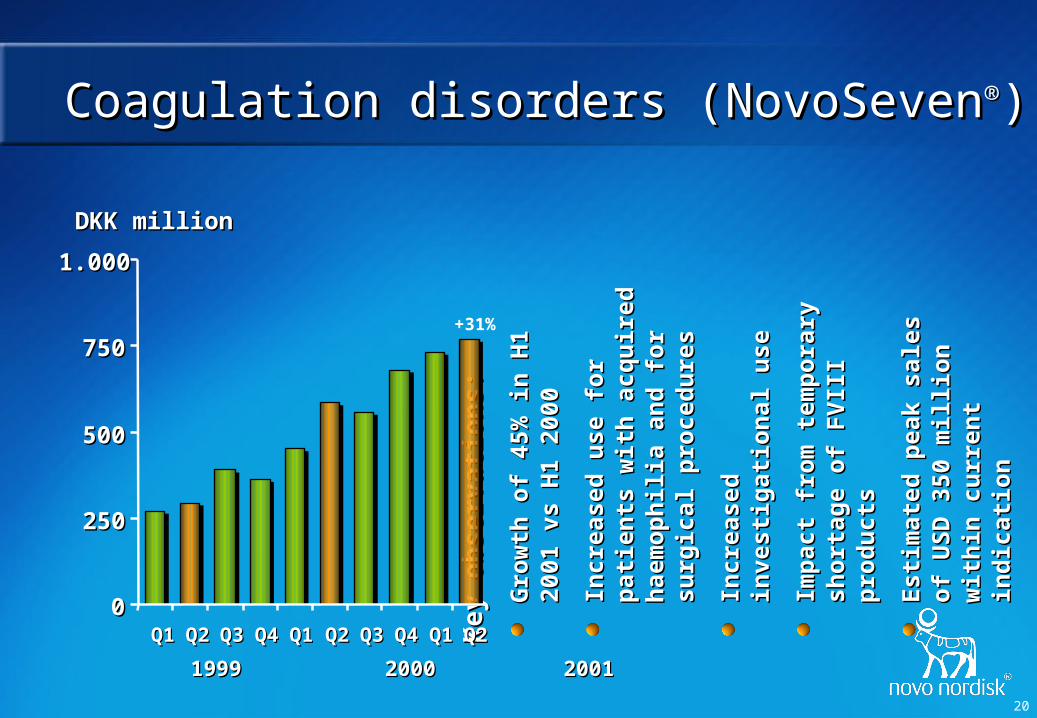
Coagulation disorders (NovoSevenCoagulation disorders (NovoSeven®®))
Ke
y o
bs
erva
tio
ns
:K
ey
ob
ser
vati
on
s:
Gro
wth
of
45%
in
H1
2001
G
row
th o
f 45
% i
n H
1 20
01
vs H
1 20
00vs
H1
2000
Incr
ease
d u
se f
or
pat
ien
ts
Incr
ease
d u
se f
or
pat
ien
ts
wit
h a
cqu
ired
hae
mo
ph
ilia
w
ith
acq
uir
ed h
aem
op
hil
ia
and
fo
r su
rgic
al p
roce
du
res
and
fo
r su
rgic
al p
roce
du
res
Incr
ease
d i
nve
stig
atio
nal
In
crea
sed
in
vest
igat
ion
al
use
use
Imp
act
fro
m t
emp
ora
ry
Imp
act
fro
m t
emp
ora
ry
sho
rtag
e o
f F
VII
I p
rod
uct
ssh
ort
age
of
FV
III
pro
du
cts
Est
imat
ed p
eak
sale
s o
f E
stim
ated
pea
k sa
les
of
US
D 3
50 m
illi
on
wit
hin
U
SD
350
mil
lio
n w
ith
in
curr
ent
ind
icat
ion
curr
ent
ind
icat
ion
DKK millionDKK million
19991999 2000 2001 2000 2001
00
250250
500500
750750
1.0001.000
Q1Q1 Q2Q2 Q3Q3 Q4Q4 Q1Q1 Q2Q2 Q3Q3 Q4Q4 Q1Q1 Q2Q2
+31%

21
The key advantages of NovoSevenThe key advantages of NovoSeven®® are: are:
Injury site selective activation of platelets Injury site selective activation of platelets creates high local thrombin generation creates high local thrombin generation which secures a tight fibrin clotwhich secures a tight fibrin clot
Efficacy independent of inhibitor titerEfficacy independent of inhibitor titer
Effective during & after surgeryEffective during & after surgery
Low thrombogenicityLow thrombogenicity
Good safety profileGood safety profile
Home treatmentHome treatment
Attractive cost/benefit ratioAttractive cost/benefit ratio
Advantages of NovoSevenAdvantages of NovoSeven®®
A bleeding episode
FVIIa/NovoSeven®®
Tissue factor

22
Beyond haemophilia treatmentBeyond haemophilia treatment
HaemostasisHaemostasisManagementManagement
NovoSevenNovoSeven®® in bleeding conditions in bleeding conditions Coagulation factor deficienciesCoagulation factor deficiencies
Platelet defectsPlatelet defects
General haemostasisGeneral haemostasis
Reduction of blood and plasma transfusionsReduction of blood and plasma transfusions
No product offers this safety and efficacy profileNo product offers this safety and efficacy profile
Increasing supportive data from investigational useIncreasing supportive data from investigational use
NovoSevenNovoSeven®® is a science-driven product is a science-driven product
HaeHaemmophiliaophiliaTreatmentTreatment

23
SpontaneousSpontaneousbleedingbleeding
Single Single FactorFactor
MultipleMultipleFactorsFactors
SurgicalSurgicalbleedingbleeding
Lack ofLack ofplateletsplatelets
DefectiveDefectiveplateletsplatelets
Coagulation FactorCoagulation FactorDeficiencyDeficiency
PlateletPlateletDisorderDisorder
GeneralGeneralHaemostasisHaemostasis
Haemophilia Haemophilia with inhibitorswith inhibitors
Upper Upper gastrointestinal gastrointestinal
bleedings *)bleedings *)
Orthotopic liver Orthotopic liver transplantations *)transplantations *)
Liver resection *)Liver resection *)
Intra-cerebral Intra-cerebral bleedingsbleedings
TraumatologyTraumatology
Vitamin K-Vitamin K-antagonistsantagonists
Stem cell Stem cell transplantationtransplantation
Liver resection Liver resection
*) *) == Patients with chronic liver diseasePatients with chronic liver disease
NovoSevenNovoSeven®® indication expansions indication expansions

24
Clinical areaClinical area Status on projectStatus on project
Building Strong Scientific EvidenceBuilding Strong Scientific Evidence
Orthotopic liver transplantation*Orthotopic liver transplantation* Ongoing Ph 2/3 projectOngoing Ph 2/3 projectUpper GI bleeds*Upper GI bleeds* Ph 2 study has been initiatedPh 2 study has been initiatedLiver resection*Liver resection* Ph 2 study has been initiatedPh 2 study has been initiated
Liver resectionLiver resection Exploratory Ph 2 study has been initiatedExploratory Ph 2 study has been initiatedBone marrow transplantationsBone marrow transplantations Ph 2 study has been initiatedPh 2 study has been initiatedIntra-cerebral bleedsIntra-cerebral bleeds Exploratory Ph 2 study has been initiatedExploratory Ph 2 study has been initiated
Reversal of anti-coagulantia therapyReversal of anti-coagulantia therapy Ph 2 study expected to start later this yearPh 2 study expected to start later this year
TraumatologyTraumatology Ph 2 study expected to start by year end 2001Ph 2 study expected to start by year end 2001
* Patients with chronic liver disease. * Patients with chronic liver disease.
25
Novo Nordisk – Future Key DriversNovo Nordisk – Future Key Drivers
Diabetes careDiabetes care Coagulation Coagulation disorderdisorder
PrimaryPrimarygrowth growth driversdrivers
Secondary Secondary valuevalue
driversdrivers
Human growth Human growth hormonehormone
Intellectual Intellectual propertyproperty HRTHRT
26
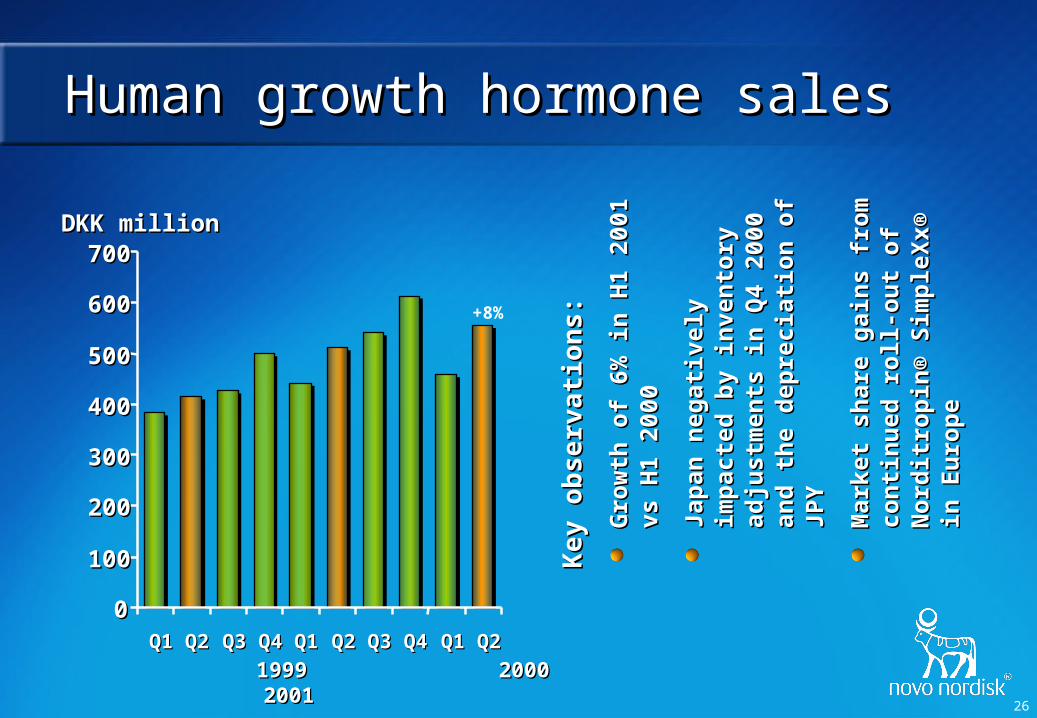
Ke
y o
bs
erva
tio
ns
:K
ey
ob
ser
vati
on
s:
Gro
wth
of
6% i
n H
1 20
01 v
s G
row
th o
f 6%
in
H1
2001
vs
H1
2000
H1
2000
Jap
an n
egat
ivel
y im
pac
ted
Ja
pan
neg
ativ
ely
imp
acte
d
by
inve
nto
ry a
dju
stm
ents
in
b
y in
ven
tory
ad
just
men
ts i
n
Q4
2000
an
d t
he
dep
reci
atio
n
Q4
2000
an
d t
he
dep
reci
atio
n
of
JPY
of
JPY
Mar
ket
shar
e g
ain
s fr
om
M
arke
t sh
are
gai
ns
fro
m
con
tin
ued
ro
ll-o
ut
of
con
tin
ued
ro
ll-o
ut
of
No
rdit
rop
in®
Sim
ple
Xx®
in
N
ord
itro
pin
® S
imp
leX
x® i
n
Eu
rop
eE
uro
pe
Human growth hormone salesHuman growth hormone sales
1999 2000 20011999 2000 2001
00
100100
200200
300300
400400
500500
600600
700700
Q1Q1 Q2Q2 Q3Q3 Q4Q4 Q1Q1 Q2Q2 Q3Q3 Q4Q4 Q1Q1 Q2Q2
DKK millionDKK million
+8%

27
Novo Nordisk – Future Key DriversNovo Nordisk – Future Key Drivers
Diabetes careDiabetes care Coagulation Coagulation disorderdisorder
PrimaryPrimarygrowth growth driversdrivers
Secondary Secondary valuevalue
driversdrivers
Intellectual Intellectual propertyproperty
HRTHRTHuman growth Human growth hormonehormone
28
Ke
y o
bs
erva
tio
ns
:K
ey
ob
ser
vati
on
s:
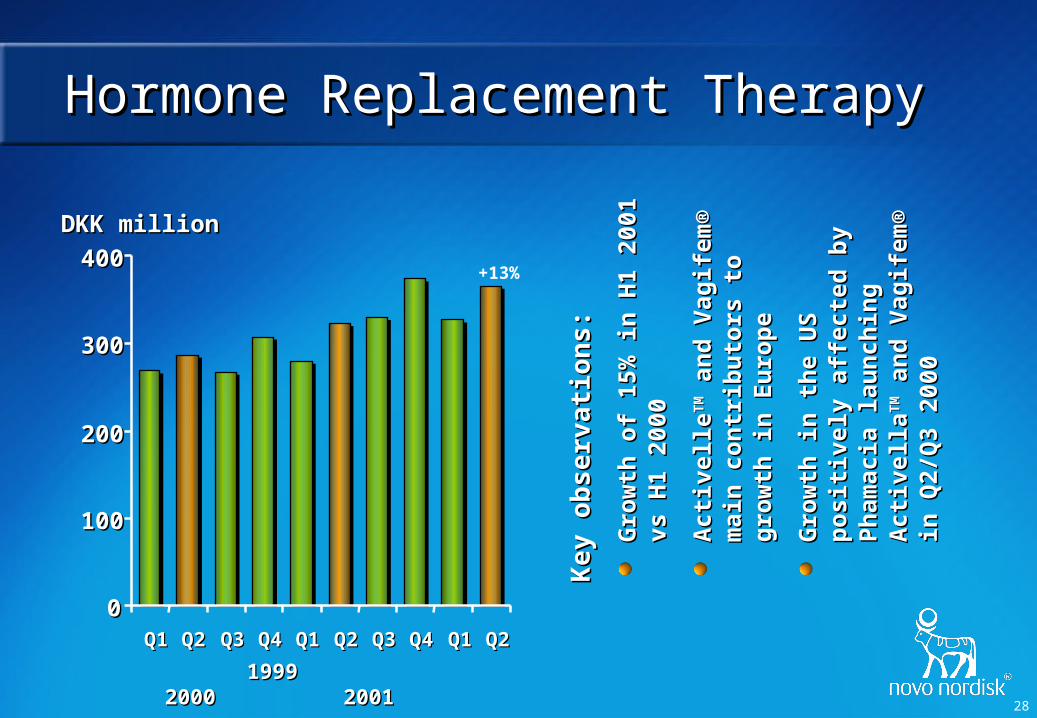
Gro
wth
of
15%
in
H1
2001
G
row
th o
f 15
% i
n H
1 20
01
vs H
1 20
00vs
H1
2000
Act
ivel
leA
ctiv
elle
TM
TM a
nd
Vag
ifem
® m
ain
a
nd
Vag
ifem
® m
ain
co
ntr
ibu
tors
to
gro
wth
in
co
ntr
ibu
tors
to
gro
wth
in
E
uro
pe
Eu
rop
e
Gro
wth
in
th
e U
S p
osi
tive
ly
Gro
wth
in
th
e U
S p
osi
tive
ly
affe
cted
by
Ph
amac
ia
affe
cted
by
Ph
amac
ia
lau
nch
ing
Act
ivel
lala
un
chin
g A
ctiv
ella
TM
TM a
nd
a
nd
V
agif
em®
in
Q2/
Q3
2000
Vag
ifem
® i
n Q
2/Q
3 20
00
Hormone Replacement TherapyHormone Replacement Therapy
19991999 2000 2001 2000 2001
00
100100
200200
300300
400400
Q1Q1 Q2Q2 Q3Q3 Q4Q4 Q1Q1 Q2Q2 Q3Q3 Q4Q4 Q1Q1 Q2Q2
DKK millionDKK million
+13%

29
Novo Nordisk – Future Key DriversNovo Nordisk – Future Key Drivers
Diabetes careDiabetes careCoagulation Coagulation
disorderdisorder
PrimaryPrimarygrowth growth driversdrivers
Secondary Secondary valuevalue
driversdrivers HRTHRTHuman growth Human growth
hormonehormoneIntellectual Intellectual
propertyproperty
30
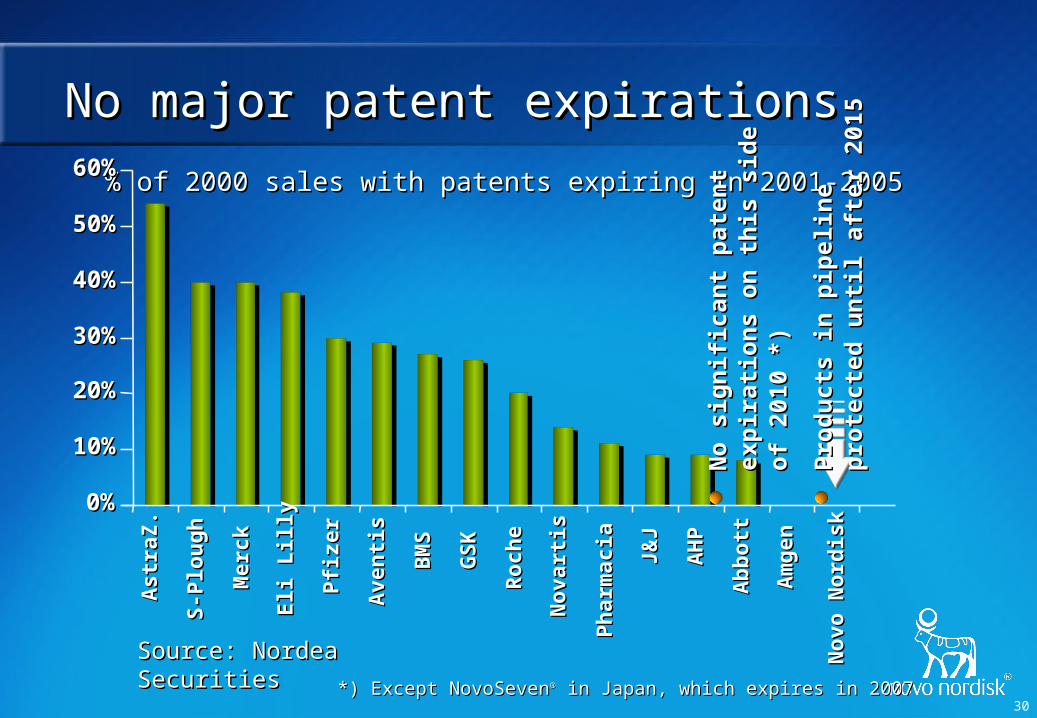
Source: Nordea SecuritiesSource: Nordea Securities
% of 2000 sales with patents expiring in 2001-2005% of 2000 sales with patents expiring in 2001-2005
No major patent expirationsNo major patent expirations
0%0%
10%10%
20%20%
30%30%
40%40%
50%50%
60%60%A
stra
Z.
Ast
raZ
.
S-P
lou
gh
S-P
lou
gh
Mer
ckM
erck
Eli
Lill
yE
li L
illy
Pfi
zer
Pfi
zer
Ave
nti
sA
ven
tis
BM
SB
MS
GS
KG
SK
Ro
che
Ro
che
NNoo
vart
isva
rtis
Ph
arm
acia
Ph
arm
acia
J&J
J&J
AH
PA
HP
Ab
bo
ttA
bb
ott
Am
gen
Am
gen
No
vo N
ord
isk
No
vo N
ord
isk
No
sig
nif
ican
t p
aten
t ex
pir
atio
ns
No
sig
nif
ican
t p
aten
t ex
pir
atio
ns
on
th
is s
ide
of
2010
*)
on
th
is s
ide
of
2010
*)
Pro
du
cts
in p
ipel
ine
pro
tect
ed
Pro
du
cts
in p
ipel
ine
pro
tect
ed
un
til
afte
r 20
15u
nti
l af
ter
2015
*) Except NovoSeven*) Except NovoSeven®® in Japan, which expires in 2007 in Japan, which expires in 2007

31
FinancialsFinancials

32
FFinancial results first inancial results first half year 2001half year 2001
Net turnoverNet turnover 11,35111,351 9,6699,669 1717
Operating profit as reported Operating profit as reported 2,7402,740 2,2712,271 2121Operating profit adjustedOperating profit adjusted*) *) 2,4452,445 1,9411,941 2626
Financial itemsFinancial items 241241 66 N/AN/AProfit before taxProfit before tax 2,9812,981 2,2772,277 3131Net profitNet profit 1,9081,908 1,4201,420 3434
Earnings per share (DKK)Earnings per share (DKK) 5.485.48 4.044.04 3636 Earnings Earnings per ADS (USD)**per ADS (USD)**)) 0.620.62 0.460.46 3636
**)) Excluding non-recurring items such as Seroxat® licence income and one-off settlements Excluding non-recurring items such as Seroxat® licence income and one-off settlements of patent disputes of patent disputes
****)) Translated for convenience at the end of June 2001 at the exchange rate of Translated for convenience at the end of June 2001 at the exchange rate of USD 100 = DKK USD 100 = DKK 878.98878.98
DKK millionDKK million 20012001 20002000 % change % change
33
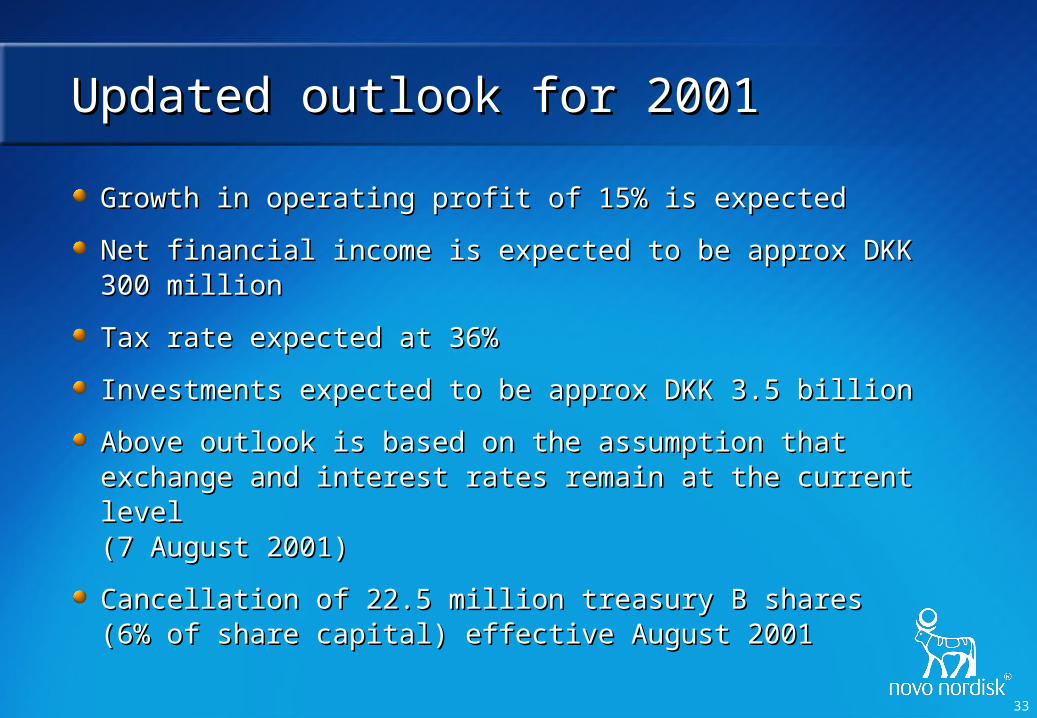
Updated outlook for 2001Updated outlook for 2001
Growth in operating profit of 15% is expectedGrowth in operating profit of 15% is expected
Net financial income is expected to be approx DKK 300 Net financial income is expected to be approx DKK 300 millionmillion
Tax rate expected at 36%Tax rate expected at 36%
Investments expected to be approx DKK 3.5 billionInvestments expected to be approx DKK 3.5 billion
Above outlook is based on the assumption that exchange Above outlook is based on the assumption that exchange and interest rates remain at the current level and interest rates remain at the current level (7 August 2001)(7 August 2001)
Cancellation of 22.5 million treasury B shares Cancellation of 22.5 million treasury B shares (6% of share capital) effective August 2001(6% of share capital) effective August 2001

34
Long-term Financial Targets Long-term Financial Targets
Financial targets Financial targets
EBIT growth of 15% per annumEBIT growth of 15% per annum
EBIT margin of 25%EBIT margin of 25%
ROIC of 25% (post-tax) per annumROIC of 25% (post-tax) per annum
Cash to earnings of 60%Cash to earnings of 60%
Balancing Balancing growth and valuegrowth and value
Observations from 2000 Observations from 2000
EBIT growth of 37%EBIT growth of 37%
EBIT margin of 23.1%EBIT margin of 23.1%
ROIC (post-tax) of 22.3%ROIC (post-tax) of 22.3%
Cash earnings ratio of 87.9%Cash earnings ratio of 87.9%
35
Estimated market potential Estimated market potential for current NovoSeven® for current NovoSeven® indication of USD 350 million indication of USD 350 million
Entering 6 new clinical areas Entering 6 new clinical areas with 8 new studies in 2001with 8 new studies in 2001
Strategy for making Strategy for making NovoSeven® the first general NovoSeven® the first general haemostatic agenthaemostatic agent
Patent protection in Europe Patent protection in Europe and the US until 2011, in and the US until 2011, in Japan until 2007Japan until 2007
PrimaryPrimarygrowthgrowthdriversdrivers
Secondary Secondary valuevalue
driversdrivers
Novo Nordisk – Key DriversNovo Nordisk – Key Drivers
World leader with steady growthWorld leader with steady growth for more than 75 years for more than 75 years
2/3 of business (insulin) growing2/3 of business (insulin) growing >10% pa >10% pa
Growth platform in the USGrowth platform in the US
The most comprehensive insulin The most comprehensive insulin and insulin device portfolio and insulin device portfolio – one new device per year– one new device per year
Sensitisers (NN622 and NN2344)Sensitisers (NN622 and NN2344)
GLP-1 analogue (NN2211)GLP-1 analogue (NN2211)
Diabetes careDiabetes care Coagulation disordersCoagulation disorders
HRTHRTHuman growth Human growth
hormonehormoneIntellectual Intellectual
propertyproperty

36
Forward-looking statementsForward-looking statements
This presentation contains forward-looking statements as the term is defined in the US This presentation contains forward-looking statements as the term is defined in the US Private Securities Litigation Reform Act of 1995. Private Securities Litigation Reform Act of 1995.
Such forward-looking statements are subject to risk and uncertainties that may cause Such forward-looking statements are subject to risk and uncertainties that may cause actual results to differ materially from expectations, including unexpected actual results to differ materially from expectations, including unexpected developments in the international currency exchange and securities markets, developments in the international currency exchange and securities markets, government-mandated or market-driven price decreases for Novo Nordisk's products in government-mandated or market-driven price decreases for Novo Nordisk's products in the company's major markets and the introduction of competing products within Novo the company's major markets and the introduction of competing products within Novo Nordisk's core businesses. Nordisk's core businesses.
These and other risks and uncertainties are further described in reports filed with the These and other risks and uncertainties are further described in reports filed with the US Securities and Exchange Commission (SEC) by Novo Nordisk and readily available US Securities and Exchange Commission (SEC) by Novo Nordisk and readily available to the public, including the company's Form 20-F, which was filed on 27 April 2001. to the public, including the company's Form 20-F, which was filed on 27 April 2001.
37
Investor InformationInvestor Information
Investor Relations contacts:Investor Relations contacts:
Novo Nordisk A/S Novo Nordisk A/S Investor Relations Investor Relations Novo Allé Novo Allé DK 2880 BagsværdDK 2880 BagsværdDenmark Denmark Fax (+45) 4444 2314. Fax (+45) 4444 2314.
Peter HaahrPeter HaahrPhone (+45) 4442 1207Phone (+45) 4442 1207 E-mail: [email protected]: [email protected]
Palle Holm Olesen Palle Holm Olesen Phone (+45) 4442 6175Phone (+45) 4442 6175 E-mail: [email protected]: [email protected]
Rasmus JorgensenRasmus JorgensenPhonePhone (+1) 212 867 0123 (+1) 212 867 0123 E-mail: [email protected]: [email protected]
Share informationShare information
Novo Nordisk’sNovo Nordisk’s B shares are listed B shares are listed on the stock exchanges in on the stock exchanges in Copenhagen and London. Its Copenhagen and London. Its ADSs are listed on the New York ADSs are listed on the New York Stock Exchange under the symbol Stock Exchange under the symbol "NVO". For further company "NVO". For further company information, visit Novo Nordisk on information, visit Novo Nordisk on the Internet at the Internet at
http://www.novonordisk.comhttp://www.novonordisk.com

38
AppendixAppendix
39
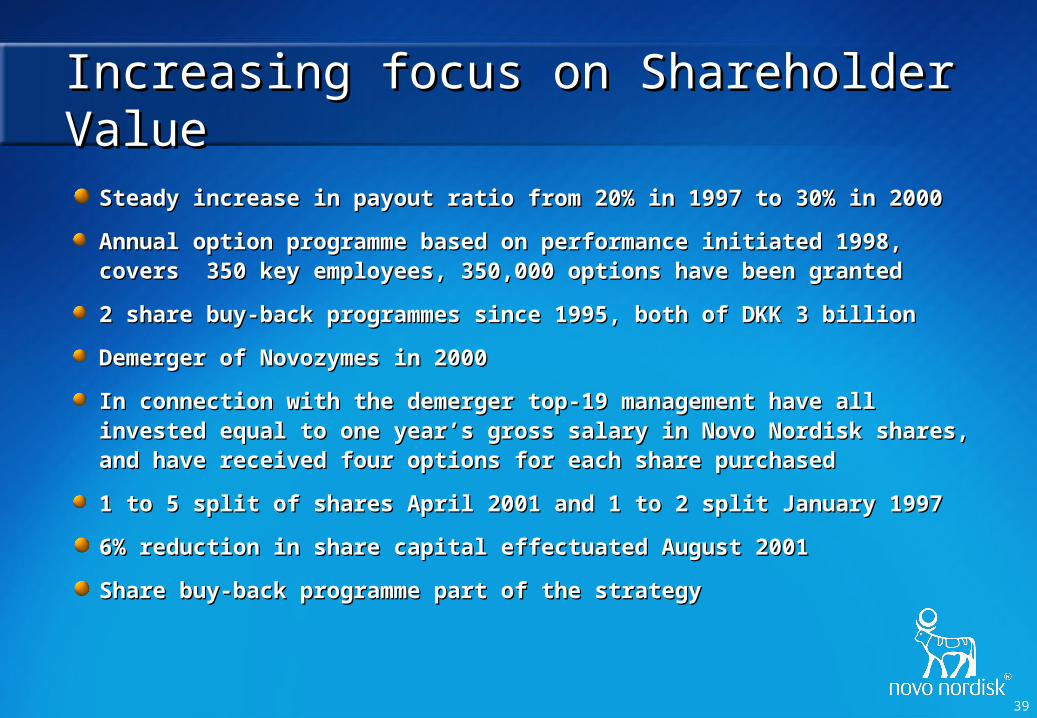
Increasing focus on Shareholder Value Increasing focus on Shareholder Value
Steady increase in payout ratio from 20% in 1997 to 30% in 2000 Steady increase in payout ratio from 20% in 1997 to 30% in 2000
Annual option programme based on performance initiated 1998, Annual option programme based on performance initiated 1998, covers 350 key employees, 350,000 options have been grantedcovers 350 key employees, 350,000 options have been granted
2 share buy-back programmes since 1995, both of DKK 3 billion 2 share buy-back programmes since 1995, both of DKK 3 billion
Demerger of Novozymes in 2000Demerger of Novozymes in 2000
In connection with the demerger top-19 management have all In connection with the demerger top-19 management have all invested equal to one year’s gross salary in Novo Nordisk shares, invested equal to one year’s gross salary in Novo Nordisk shares, and have received four options for each share purchasedand have received four options for each share purchased
1 to 5 split of shares April 2001 and 1 to 2 split January 19971 to 5 split of shares April 2001 and 1 to 2 split January 1997
6% reduction in share capital effectuated August 20016% reduction in share capital effectuated August 2001
Share buy-back programme part of the strategyShare buy-back programme part of the strategy

40
TTurnover by therapy first half year 2001urnover by therapy first half year 2001
DKK million 2001 2000 % of total % change(H1 2001)
Insulin etc 7,169 6,321 63 13
NovoNorm®/Prandin® 769 513 7 50
Diabetes care, total 7,938 6,834 70 16
Coagulation disorders* 1,499 1,034 13 45
Human growth hormone 1,011 952 9 6
HRT 692 603 6 15
Other 211 246 2 -14
Total 11,351 9,669 100 17
* NovoSeven®
41
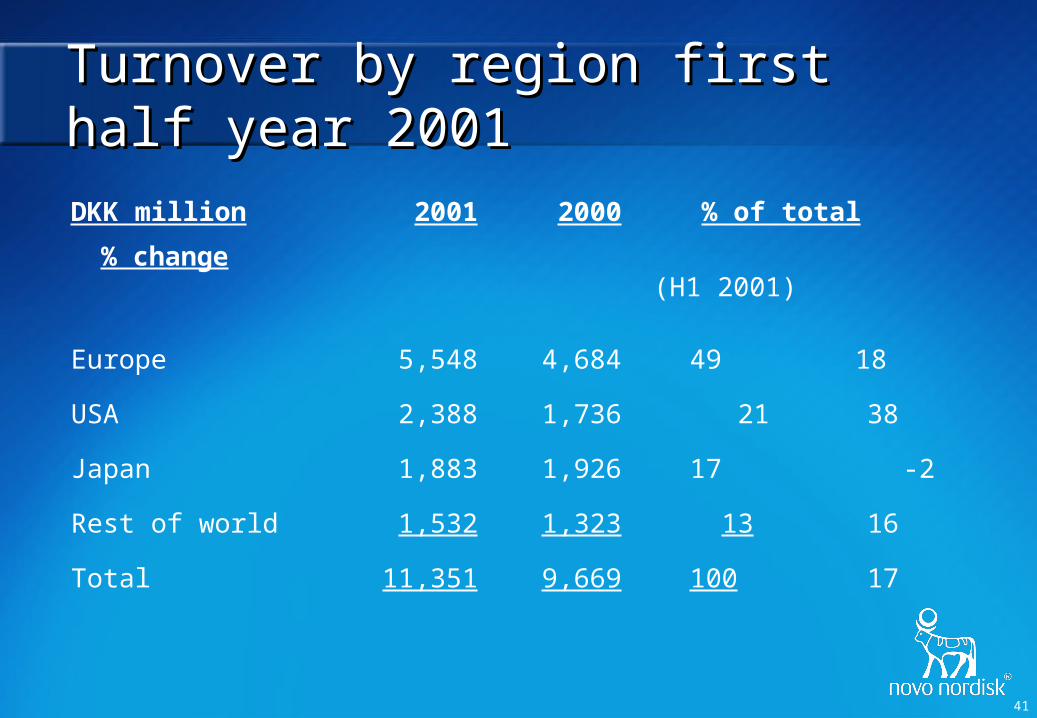
Turnover by region first half year 2001Turnover by region first half year 2001
DKK million 2001 2000 % of total % change (H1 2001)
Europe 5,548 4,684 49 18
USA 2,388 1,736 21 38
Japan 1,883 1,926 17 -2
Rest of world 1,532 1,323 13 16
Total 11,351 9,669 100 17
42
Profit & Loss 1998-2000Profit & Loss 1998-2000
DKK millionDKK million 19981998 19991999 20002000
Net turnoverNet turnover 13,64713,647 16,42316,423 20,81120,811
Y/Y growthY/Y growth +8.4%+8.4% +20.3%+20.3% +26.7%+26.7%
Gross profitGross profit 9,8969,896 12,19612,196 15,76715,767
EBITEBIT 2,9332,933 3,5273,527 4,8164,816
EBIT-marginEBIT-margin 21.5%21.5% 21.5%21.5% 23.1%23.1%
Net financeNet finance 243243 -178-178 2424
Pre-tax profitPre-tax profit 3,1763,176 3,3493,349 4,8404,840
Tax rateTax rate 36.5%36.5% 40.3%40.3% 36.2%36.2%
Net profitNet profit 2,0162,016 2,0012,001 3,0873,087
43
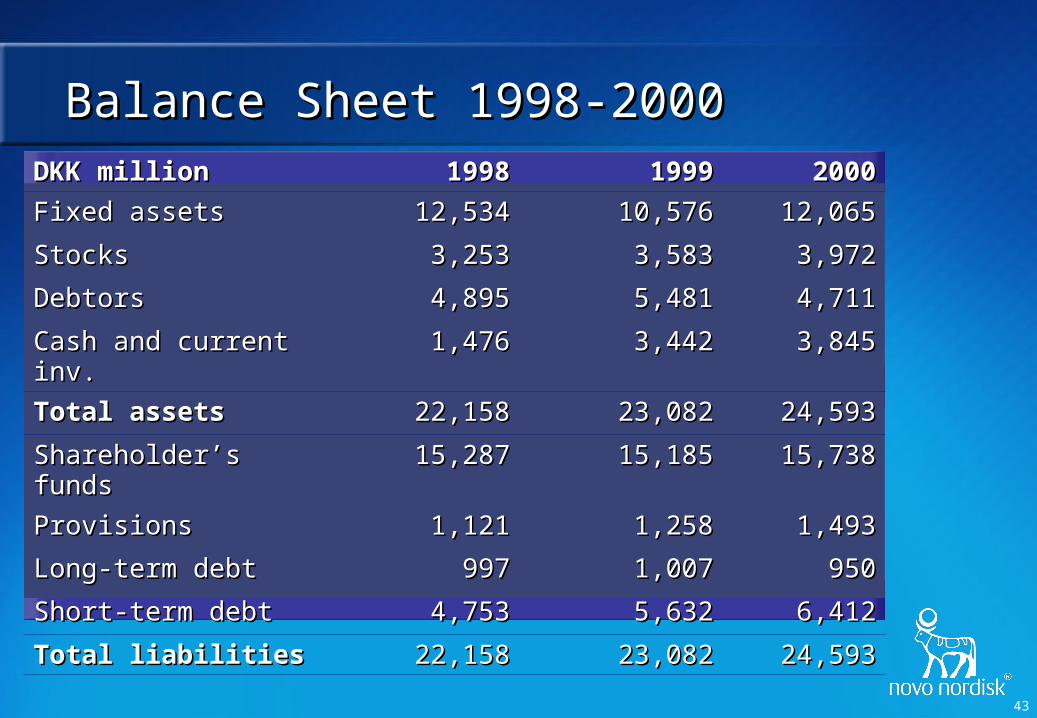
DKK millionDKK million 19981998 19991999 20002000
Fixed assetsFixed assets 12,53412,534 10,57610,576 12,06512,065
StocksStocks 3,2533,253 3,5833,583 3,9723,972
DebtorsDebtors 4,8954,895 5,4815,481 4,7114,711
Cash and current inv.Cash and current inv. 1,4761,476 3,4423,442 3,8453,845
Total assetsTotal assets 22,15822,158 23,08223,082 24,59324,593
Shareholder’s fundsShareholder’s funds 15,28715,287 15,18515,185 15,73815,738
ProvisionsProvisions 1,1211,121 1,2581,258 1,4931,493
Long-term debtLong-term debt 997997 1,0071,007 950950
Short-term debtShort-term debt 4,7534,753 5,6325,632 6,4126,412
Total liabilitiesTotal liabilities 22,15822,158 23,08223,082 24,59324,593
Balance Sheet 1998-2000Balance Sheet 1998-2000

44
Margin DevelopmentMargin Development
Note: EBIT margin as reportedNote: EBIT margin as reported
00
10001000
20002000
30003000
40004000
50005000
60006000
70007000
19971997 19981998 19991999 20002000
DK
K m
illio
nD
KK
mill
ion
R&D costsR&D costsS&D costsS&D costsAdm. costsAdm. costs
00
10001000
20002000
30003000
40004000
50005000
60006000
19971997 19981998 19991999 20002000
DK
K m
illio
nD
KK
mill
ion Production costsProduction costs Development in gross- andDevelopment in gross- and
EBIT-margin 1997-2000EBIT-margin 1997-2000
65%
67%
69%
71%
73%
75%
77%
79%
1997 1998 1999 2000
10%
12%
14%
16%
18%
20%
22%
24%
Gross margin (left-hand scale)
EBIT-margin (right-hand scale)
65%
67%
69%
71%
73%
75%
77%
79%
1997 1998 1999 2000
10%
12%
14%
16%
18%
20%
22%
24%
Gross margin (left-hand scale)
EBIT-margin (right-hand scale)
17
.4%
17
.4%
27
.9%
27
.9% 12
.1%
12
.1%
16
.3%
16
.3% 9.0
%9
.0%
30
.1%
30
.1%

45
Therapy:Therapy: Diet/ExerciseDiet/Exercise Oral products Oral products Oral/InsulinOral/Insulin InsulinInsulin Approx 66% Approx 66% Approx 7% Approx 27% Approx 7% Approx 27%
From diet and exercise to insulinFrom diet and exercise to insulin
Type 1:Type 1:(4 million patients*)(4 million patients*)
Type 2:Type 2:(147 million patients*)(147 million patients*)
* Estimated year 2000 incl. undiagnosed.* Estimated year 2000 incl. undiagnosed.
An estimated 25-30 million using medicationAn estimated 25-30 million using medication

46
06000600
NormalNormal
Type 2 diabetesType 2 diabetes
10001000 14001400 18001800 22002200 02000200 06000600
800800
700700
600600
500500
400400
300300
200200
100100
Insu
lin
Sec
reti
on
(p
mo
l/m
in)
Insu
lin
Sec
reti
on
(p
mo
l/m
in)
Kilde: O'MEARA et al. Am. J. Medicine, 1990; 89.Kilde: O'MEARA et al. Am. J. Medicine, 1990; 89.
Insulin Secretion in Normal People and People with Type 2 DiabetesInsulin Secretion in Normal People and People with Type 2 Diabetes
47
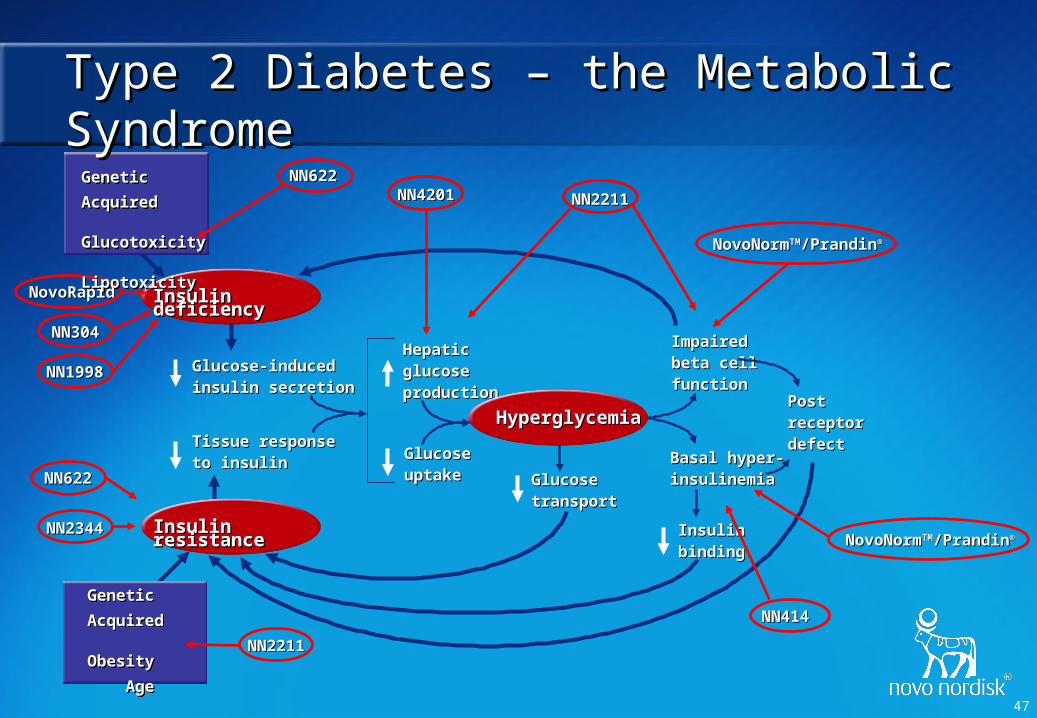
NovoNormNovoNormTMTM/Prandin/Prandin®®
NovoNormNovoNormTMTM/Prandin/Prandin®®
NN304NN304
NN1998NN1998
NN2344NN2344
Glucose-induced Glucose-induced insulin secretioninsulin secretion
Tissue response Tissue response to insulinto insulin
Hepatic Hepatic glucose glucose productionproduction
Glucose Glucose uptakeuptake
ImpairedImpairedbeta cellbeta cellfunctionfunction
Basal hyper- Basal hyper- insulinemiainsulinemia
Post Post receptor receptor defectdefect
GlucoseGlucosetransporttransport
Insulin Insulin bindingbinding
NN414NN414
NN4201NN4201
Genetic
Acquired
Obesity
Age
Genetic
Acquired
Obesity
Age
Insulin deficiencyInsulin deficiency
Insulin resistanceInsulin resistance
NovoRapidNovoRapid
Type 2 Diabetes – the MetabolicType 2 Diabetes – the Metabolic SyndromeSyndrome
Insulin deficiencyInsulin deficiency
Insulin resistanceInsulin resistance
HyperglycemiaHyperglycemia
NN2211NN2211
NN2211NN2211
NN622NN622
NN622NN622Genetic
Acquired Glucotoxicity Lipotoxicity
Genetic
Acquired Glucotoxicity Lipotoxicity

48
The key advantages of NovoSevenThe key advantages of NovoSeven®® are: are:
Injury site selective activation of platelets Injury site selective activation of platelets creates high local thrombin generation creates high local thrombin generation which secures a tight fibrin clotwhich secures a tight fibrin clot
Efficacy independent of inhibitor titerEfficacy independent of inhibitor titer
Effective during & after surgeryEffective during & after surgery
Low thrombogenicityLow thrombogenicity
Good safety profileGood safety profile
Home treatmentHome treatment
Attractive cost/benefit ratioAttractive cost/benefit ratio
Advantages of NovoSevenAdvantages of NovoSeven®®
A bleeding episode
FVIIa/NovoSeven®®
Tissue factor
The key advantages of NovoSevenThe key advantages of NovoSeven®® are: are:
Injury site selective activation of Injury site selective activation of platelets creates high local thrombin platelets creates high local thrombin generation which secures a tight fibrin generation which secures a tight fibrin clotclot
Efficacy independent of inhibitor titerEfficacy independent of inhibitor titer
Effective during & after surgeryEffective during & after surgery
Low thrombogenicityLow thrombogenicity
Good safety profileGood safety profile
Home treatmentHome treatment
Attractive cost/benefit ratioAttractive cost/benefit ratio
TF-Bearing CellTF-Bearing Cell
Activated PlateletActivated Platelet
PlateletPlatelet
VaVa
VaVaTFTFXaXa
XX IIIIThrombinThrombin
VV VaVa
IIIIXX
XaXaVIIIaVIIIa
IXIX
XXXaXa
IIII
IXaIXa
IXaIXa ThrombinThrombin
ThrombinThrombin
TFTF

49
Studies aimed at expanding the indication
Orthotopic liver transplantions*) Reduce bleeding, leading to fewer transfusions and thereby reducing post-operative complications
Liver resections*) Fast induction of haemostasis and hopefully allow for transfusion-free surgery
Upper gastrointestinal bleedings*) Faster haemostasis and reduce re-bleeding episodes
Liver resections in patients with no coagulation disorders
Fast induction of haemostasis and hopefully allow for transfusion-free surgery
Intra-cerebral bleedings Fast haemostasis, reduced mortality and morbidity, thus increased quality of life
Reversal of anticoagulation therapy (vitamin K-antagonists)
Faster haemostasis and reduced number of transfusions, leading to faster recovery
Stem cell/bone marrow transplantations
Faster haemostasis, reduced mortality and number of transfusions. Fewer patients with platelet antibodies
Traumatology Faster haemostasis, reduced mortality and number of transfusions. Fewer multi-organ failures and thereby less surgery and faster recovery
Expected benefits of NovoSeven®New clinical area targeted
*) Patients with chronic liver disease
50
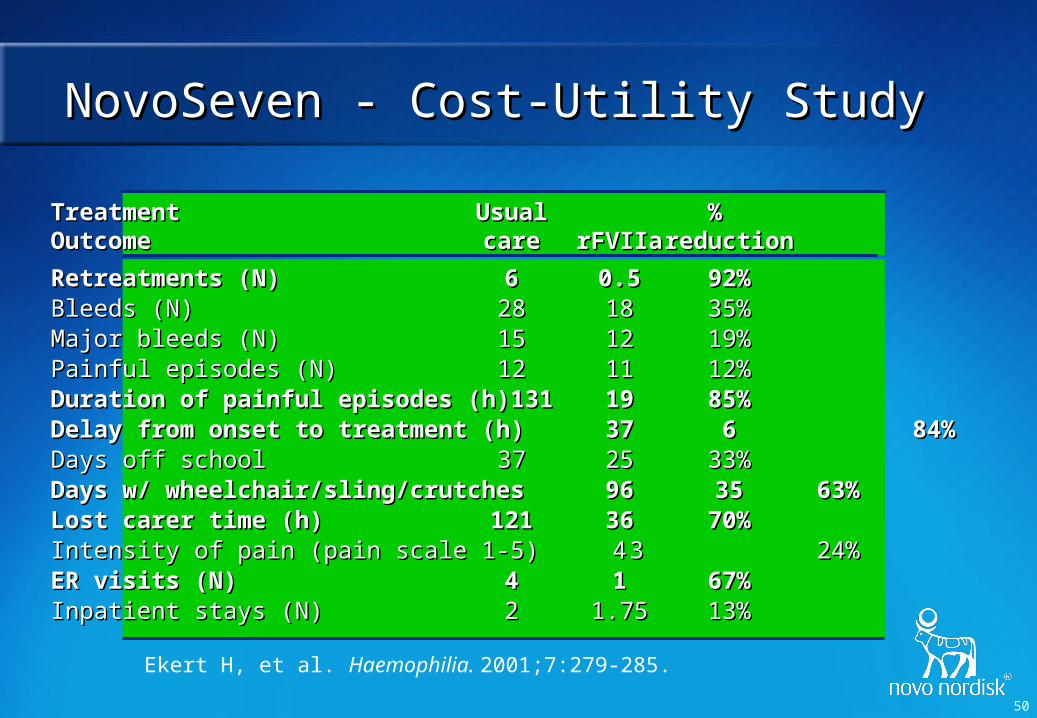
NovoSeven - Cost-Utility StudyNovoSeven - Cost-Utility Study
TreatmentTreatment UsualUsual % % OutcomeOutcome carecare rFVIIarFVIIa reductionreduction
Retreatments (N)Retreatments (N) 66 0.50.5 92%92%Bleeds (N)Bleeds (N) 2828 1818 35%35%Major bleeds (N)Major bleeds (N) 1515 1212 19%19%Painful episodes (N)Painful episodes (N) 1212 1111 12%12%Duration of painful episodes (h)Duration of painful episodes (h) 131131 1919 85%85%Delay from onset to treatment (h)Delay from onset to treatment (h) 3737 66 84%84%Days off schoolDays off school 3737 2525 33%33%Days w/ wheelchair/sling/crutchesDays w/ wheelchair/sling/crutches 9696 3535 63%63%Lost carer time (h)Lost carer time (h) 121121 3636 70%70%Intensity of pain (pain scale 1-5)Intensity of pain (pain scale 1-5) 44 33 24%24%ER visits (N)ER visits (N) 44 11 67%67%Inpatient stays (N)Inpatient stays (N) 22 1.751.75 13%13%
Ekert H, et al. Haemophilia. 2001;7:279-285.

51
Triple Bottom LineTriple Bottom Line
Environmentally Environmentally soundsound
Socially Socially ResponsibleResponsible
EconomicallyEconomicallyviableviable