1 NOAA Briefing for the Western Congressional Caucus Providing New National Capabilities to...
37
1 Providing New National Capabilities to Anticipate, Prepare for, and Respond to Drought Randall M. Dole, NOAA Research Martin Hoerling, NOAA Research Douglas Lecomte, NOAA National Weather Service September 27, 2004 Dust storm during the 1930s Drought North Platte river, May 22, 2002 Mean flow - 1310 cfs, Observed - 0
-
Upload
nelson-cobb -
Category
Documents
-
view
213 -
download
0
Transcript of 1 NOAA Briefing for the Western Congressional Caucus Providing New National Capabilities to...

1
NOAA Briefing for the Western Congressional Caucus
Providing New National Capabilities to Anticipate, Prepare for, and Respond to Drought
Randall M. Dole, NOAA ResearchMartin Hoerling, NOAA Research
Douglas Lecomte, NOAA National Weather Service
September 27, 2004
Dust storm during the 1930s Drought North Platte river, May 22, 2002Mean flow - 1310 cfs, Observed - 0

2
Why should we care?
1988 Drought($61.9B)1980 Drought
($48.4B)
2002 Drought($10.0B)
A bottom-line issue: Although determining the full economic impacts of drought is difficult, annual losses in the USA are estimated to be several billion dollars.

3
Why Now? The Western Drought
““Whiskey is for Drinking and Water is for Fighting” Whiskey is for Drinking and Water is for Fighting” - Mark Twain. - Mark Twain. “Water is life” - “Water is life” - Wallace Stegner.Wallace Stegner.
The severe drought gripping the western U.S. has raised:
• Public and media attention
• Management concerns including the possibility for the first-ever “call” on the Colorado River under the terms of the Colorado River Compact.
There are new concerns for the sustainability of western U.S. water resources to meet growing demands
• Does this drought foretell climate change?
Dillon Reservoir, 2002

4
President Bush directs that research activities provide the best President Bush directs that research activities provide the best possible scientific information to support public discussion and possible scientific information to support public discussion and decision making on climate issues decision making on climate issues
(US Climate Change Science Program [CCSP], July, 2003).(US Climate Change Science Program [CCSP], July, 2003).
• The U.S. CCSP identifies drought as a key science challenge.• “Drought Preparedness” Acts have been introduced in the House and Senate.• Western Governors’ propose a National Integrated Drought Information System. • Department of Interior identifies potential for water supply crises by 2025Department of Interior identifies potential for water supply crises by 2025
New Mandates for Science Information

5
To deliver sound scientific information to meet the needs of the public, resource managers and policy-makers in preparing for and responding to drought.
Overview Questions:
• Is the present drought “unprecedented”?Is the present drought “unprecedented”?
• What are causes for this drought?What are causes for this drought? natural variability natural variability climate change climate change
• What is the prognosis for western drought?What is the prognosis for western drought?
• What is NOAA doing to improve national What is NOAA doing to improve national capabilities to better anticipate and prepare for droughts?capabilities to better anticipate and prepare for droughts?
Following the overview, we will provide an open forum to respond to any Following the overview, we will provide an open forum to respond to any additional information needs or questions you have regarding drought.additional information needs or questions you have regarding drought.
NOAA’s Role

6
Is the Current Western Drought Unprecedented?

7
A Hydrological Drought
3400
3450
3500
3550
3600
3650
3700
1960 1965 1970 1975 1980 1985 1990 1995 2000 2005
Lake Powell Water Level (ft)
Filled1980
• Lake Powell is at 40% capacity• Lake levels have dropped ~ 120 feet• Reservoirs above Lake Powell are
currently at 60% of capacity• Net flow of water for WY 2004 to date is
58% of average.
Glen Canyon Dam

8
5-Year Precipitation Deficits
15 to 20 inchesin some areas
15 to 20 inchesin some areas

9
Palmer Drought Index- area in severe drought
Western U.S. 1895-2004
1930s“Dust bowl”
Colorado River Compact Signed
2002

10
Reconstructions of Western Drought
Droughts over the past two millennia dwarf anything in the modern instrumental record.

11
U.S. Drought MonitorDerived by synthesizing various information sources
(NOAA CPC, NCDC, with USDA and NDMC)
A large scale product. Agricultural (A), hydrological (H) designate primary impacts (drought types). Manifold indirect impacts, e.g., on recreation, energy production, water quality, fire risk, air quality, ecosystems, endangered species.
12
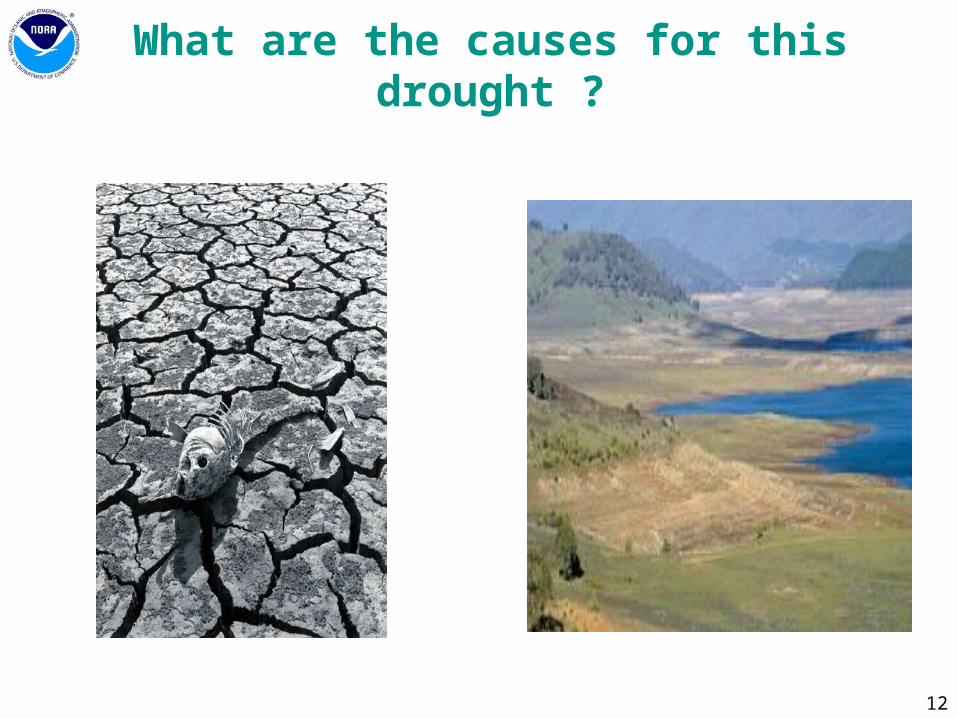
What are the causes for this drought ?

13
Western U.S. Precipitation1950 to 2004

14
Role of Oceans in DroughtSouthwest U.S.
El NiñoLa Niña

15
What is the Prognosis for What is the Prognosis for Western DroughtWestern Drought?

16
NOAA Extended Precipitation Outlook

17
NOAA Seasonal Drought Outlook

18
Likelihood for Recovery of Precipitation Deficits by February 2005
Odds are less than 10%
basedon past data
Odds are less than 10%
basedon past data

19
Trends in Western Climate

20
Western Precipitation Variations1950 to 2004
No significant precipitation trend - if anything, slightly wetter.Strong interannual to decadal variability, oceans play a major role.
21
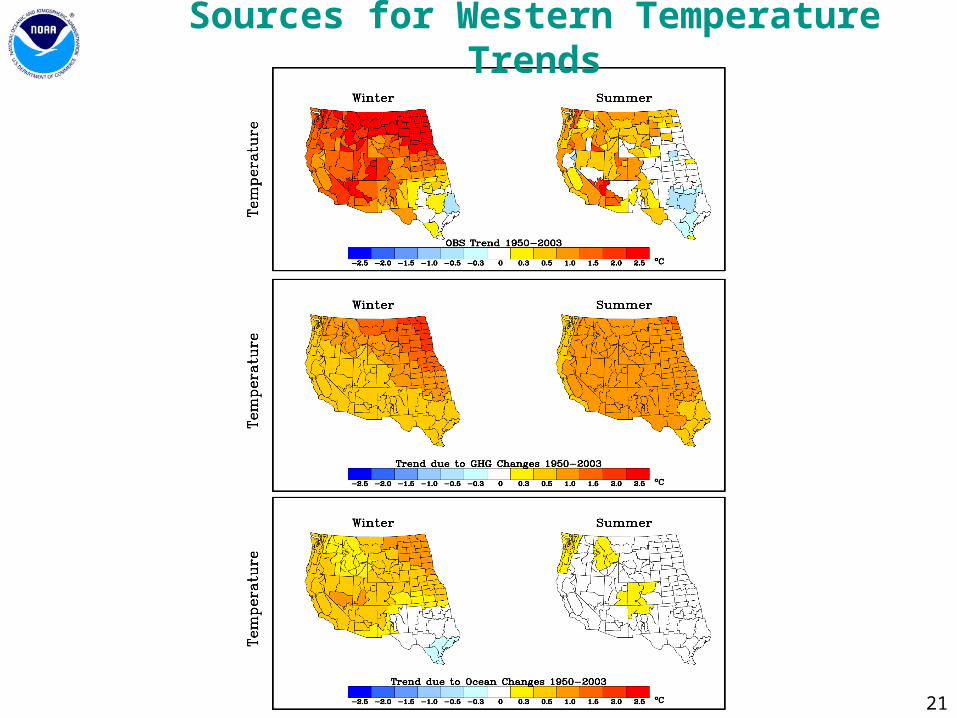
Sources for Western Temperature Trends

22
Trends in Western Stream Flow
From Stewart, Cayan, and Dettinger (2004)
•Trend towards an earlier melt out and earlier peak flows throughout the Western US are consistent with a warming trend. •Changes in seasonal cycle have potentially important implications for water management. Both supply and demand are affected.

23
Climate Model Projections for Western U.S.Climate Model Projections for Western U.S.
• Regional projections have less confidence than global projectionsRegional projections have less confidence than global projections
• High model consistency on warming, precipitation highly variableHigh model consistency on warming, precipitation highly variable

24
What is NOAA doing to Improve National What is NOAA doing to Improve National Capabilities to Better Anticipate and Capabilities to Better Anticipate and
Prepare for DroughtsPrepare for Droughts?

25
• Goal:Goal: To enable the Nation to move To enable the Nation to move from a reactive to a more proactive from a reactive to a more proactive approach to droughts.approach to droughts.
• The Western Governors’ Association developed the 2004 report in close partnership with NOAA. Many others contributed.
• Recent advances in understanding and predicting droughts makes the NIDIS Goal feasible. More must be done to provide a fully useful drought decision-support system.
National Integrated Drought Information System (NIDIS)National Integrated Drought Information System (NIDIS)
www.westgov.org/wga/publicat/nidis.pdf
“Creating a National Drought Early Warning System”

26
Research PredictionMonitoring
ImpactMitigation
ProactivePlanning
ImprovedResponses
Customer defined measures of drought
Better informed decision making at state, local and individual levels
Integrating Tools
NIDIS Framework for Enhanced Decision Support

27
• Improving and Integrating Observations and Data Systems
• Developing New Tools for analysis and decision support.
• Coordinating research and science.
• Improving information dissemination and feedback.
Key NIDIS ComponentsKey NIDIS Components

28
•NOAA Climate Services - Contributions from all NOAA Line Offices, Joint Institutes, Regional Integrated Science Assessments, Regional Climate Centers, State Climatologists
• NOAA Operational Monitoring and Outlooks - Weekly Drought Monitor and Monthly Drought Outlook
• NOAA Research - Applied climate research to understand and predict
drought onset, duration, and impacts
•NOAA Cooperative Observer Network Modernization- Implementation of a National Mesonet would provide near real time climate, weather, and water observations for resource and emergency management
NOAA Programs Supporting the NIDISNOAA Programs Supporting the NIDIS
Current network has poorest coverage in Current network has poorest coverage in the West, especially at high elevations the West, especially at high elevations where most precipitation falls as snow.where most precipitation falls as snow.

29
New water 2025
“Water is the lifeblood of the American West and the foundation
of its economy”(Water 2025: Preventing Crises and Conflict in the West)
“Existing water supplies are, or will be inadequate to meet the water demands of people, cities, farms, and the environment”
NOAA monitoring, research, and forecast products will provide the nation with new capabilities to anticipate, to prepare for, and to respond to these complex water issues.
30
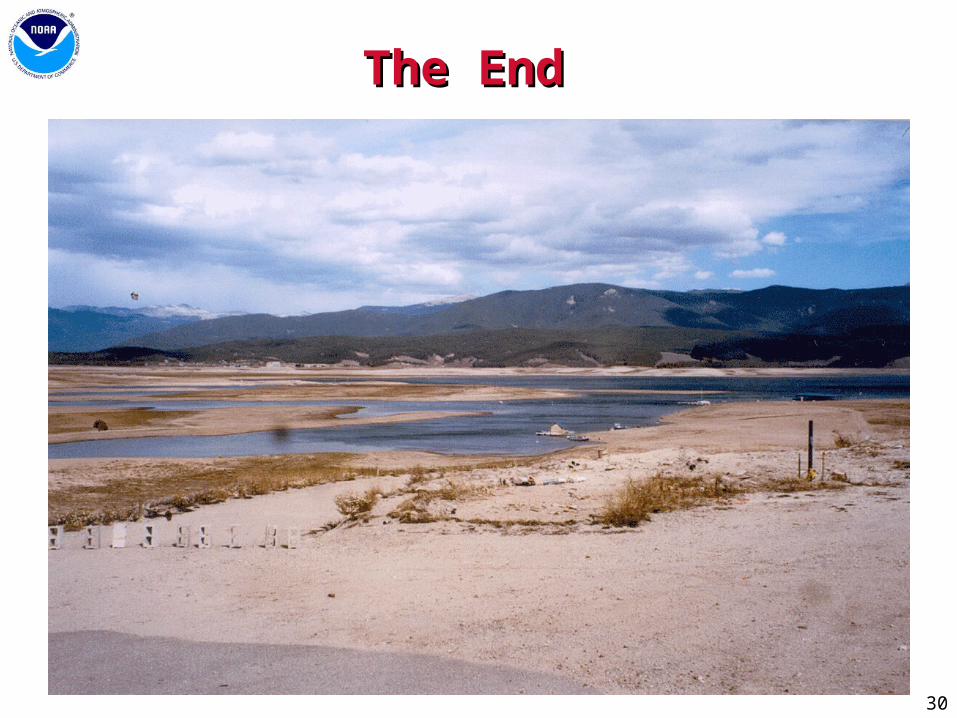
The EndThe End

31
NOAA Seasonal Climate Outlook

32
What would a warmer future climate imply for the mountainous west and adjacent regions, e.g., for water resources, ecosystems, recreation?
What are some potential implications?
A few possibilities:A few possibilities:
• Less efficient water storage and release.Less efficient water storage and release.
• Increased vegetative stress - species, ecosystem losses.Increased vegetative stress - species, ecosystem losses.
• Longer growing season, increased evaporation, and increased demand Longer growing season, increased evaporation, and increased demand for already scarce water resources.for already scarce water resources.
Western fires, 2002Western fires, 200219281928 20002000
Retreat of South Cascade Glacier, WashingtonRetreat of South Cascade Glacier, Washington

33
Drought Early Warning through Ocean Monitoring
TOA/Triton Moored Array and Argo Floats

34
NA Drought Monitor

35
Drought Monitor Inputs
USGS Streamflow
CPC Daily Soil Model
Satellite Veg Health
30-day Precip.USDA Soil Ratings
Palmer Drought Index

36
Average Annual Rainfall

37
Drought - Future Pressures
US Bureau of Reclamation analysis of potential water supply crises and conflicts in the western US by the year 2025 based on a combination of technical and other factors, including population trends and potential endangered species needs for water.
Note: There is an underlying assumption of a statistically stationary climate.