1-New Seminar Theory of FTIR NIR and Raman
33
The Science Behind What We Do
-
Upload
andrea-molina-torres -
Category
Documents
-
view
226 -
download
1
description
Teoria de FTIR, NIR y Raman.
Transcript of 1-New Seminar Theory of FTIR NIR and Raman

The Science Behind What We Do
What we can learn
Using the Using the QualitativeQualitative properties of the spectral dataproperties of the spectral data
• Structural conformation of new materials can be determined• Contaminants can be identified• Competitive products can be determined chemically
Using the Using the QuantitativeQuantitative properties of the spectral dataproperties of the spectral data
2
Using the Using the QuantitativeQuantitative properties of the spectral dataproperties of the spectral data
• Concentration of critical additives can be determined• Consistency of product mixtures can be monitored• Quality of starting materials can be determined
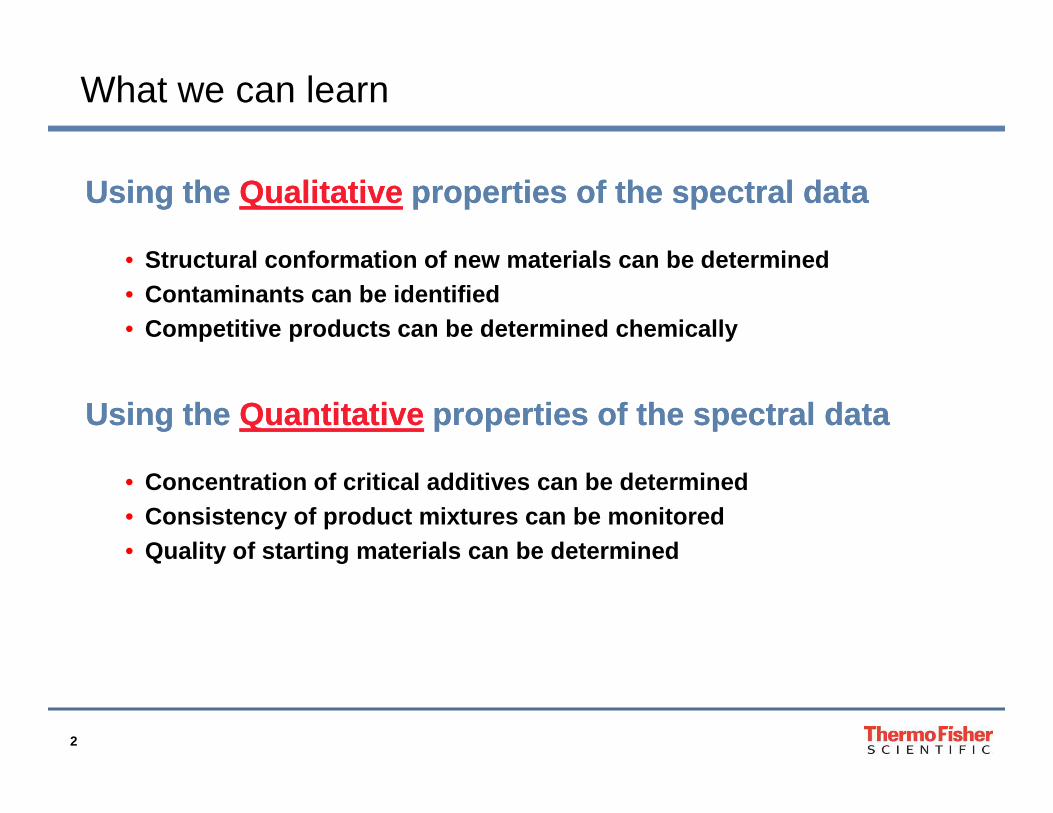
FTIR Basics
• With FTIR we measure light energy at many different frequencies• FTIR generates energy using a light bulb• That light travels trough space to a detector that measures the energy
present at some of the different frequencies available.• The interesting part is how the light energy changes between the light
bulb and the detector.
3
Light Source
SampleDetectorReadout
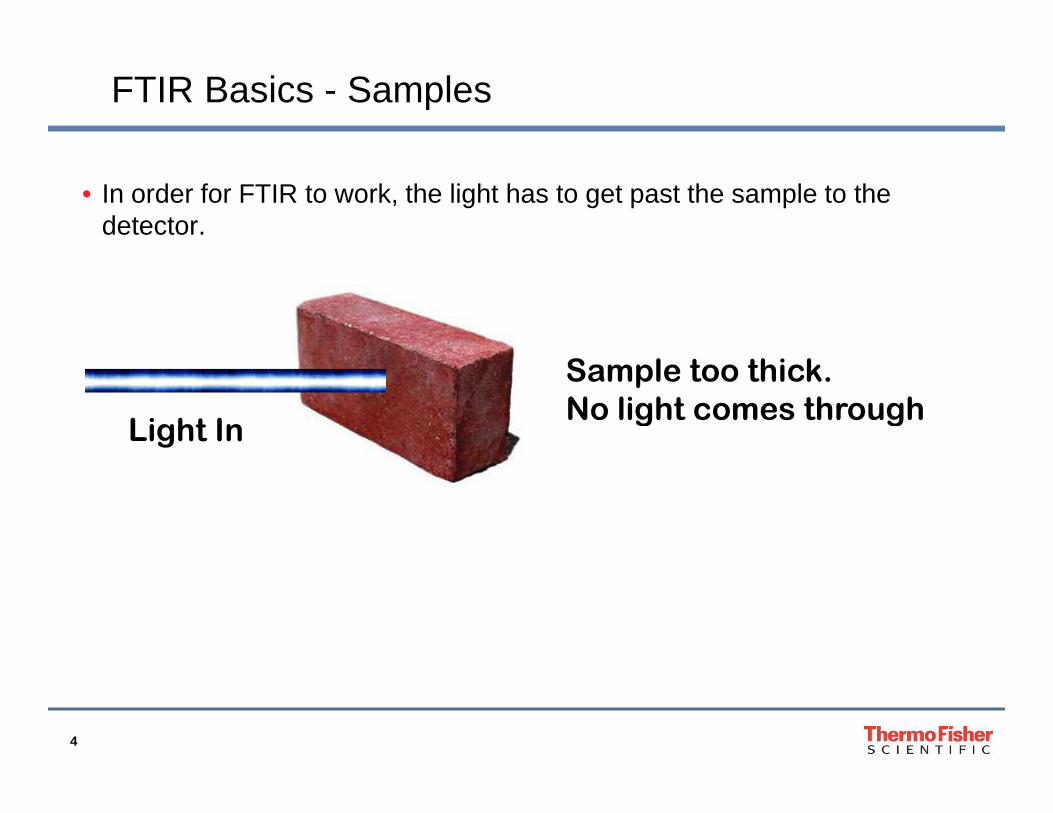
FTIR Basics - Samples
• In order for FTIR to work, the light has to get past the sample to the detector.
Sample too thick.No light comes through
4
No light comes throughLight In
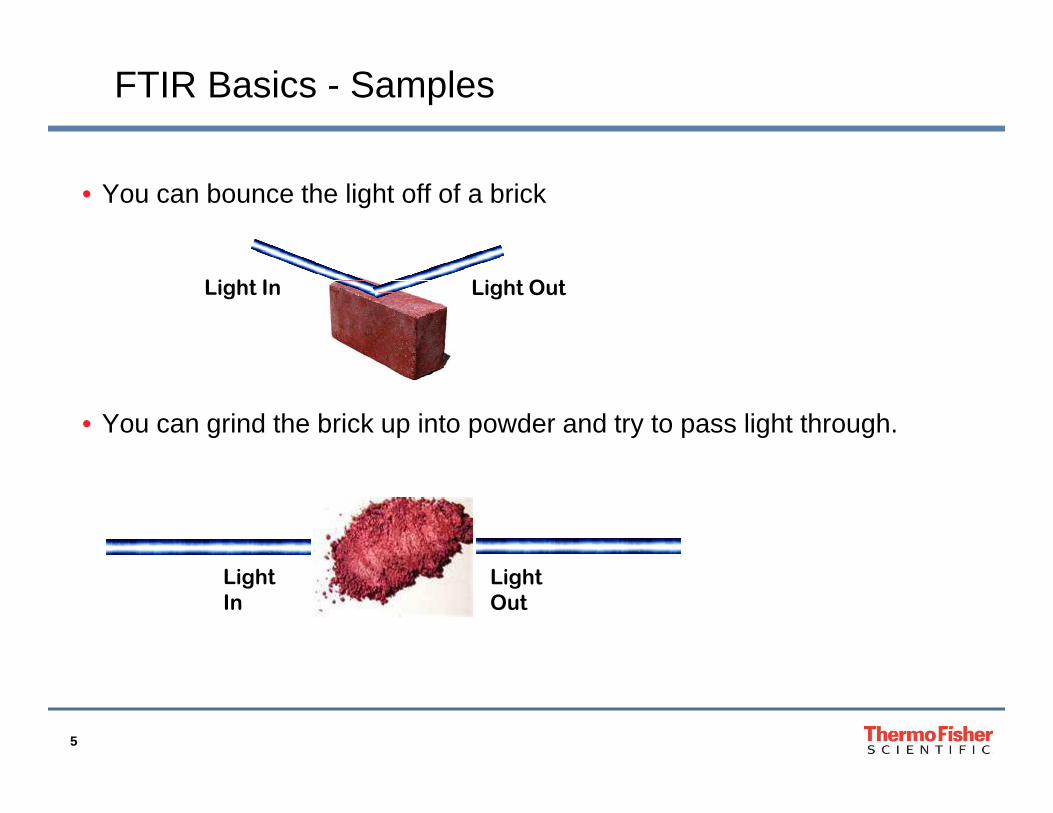
• You can bounce the light off of a brick
Light In Light Out
FTIR Basics - Samples
5
• You can grind the brick up into powder and try to pass light through.
Light In
Light Out
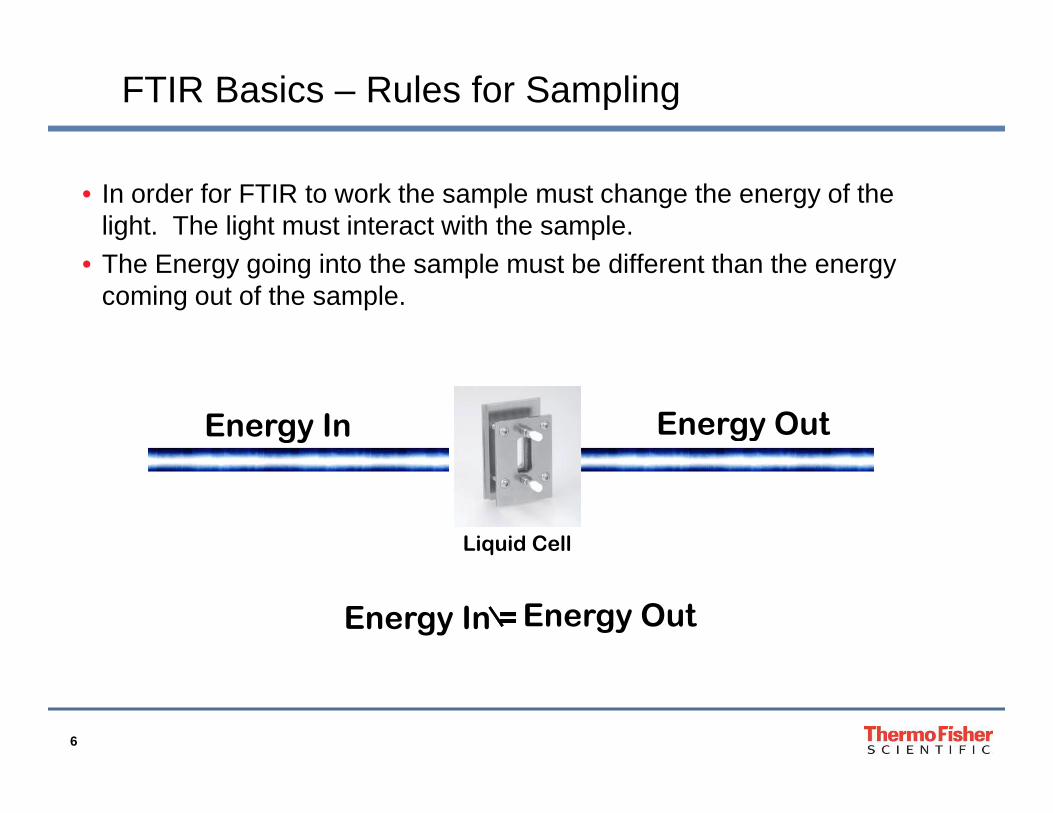
FTIR Basics – Rules for Sampling
• In order for FTIR to work the sample must change the energy of the light. The light must interact with the sample.
• The Energy going into the sample must be different than the energy coming out of the sample.
Energy In Energy Out
6
Energy In Energy Out
Energy In = Energy Out
Liquid Cell
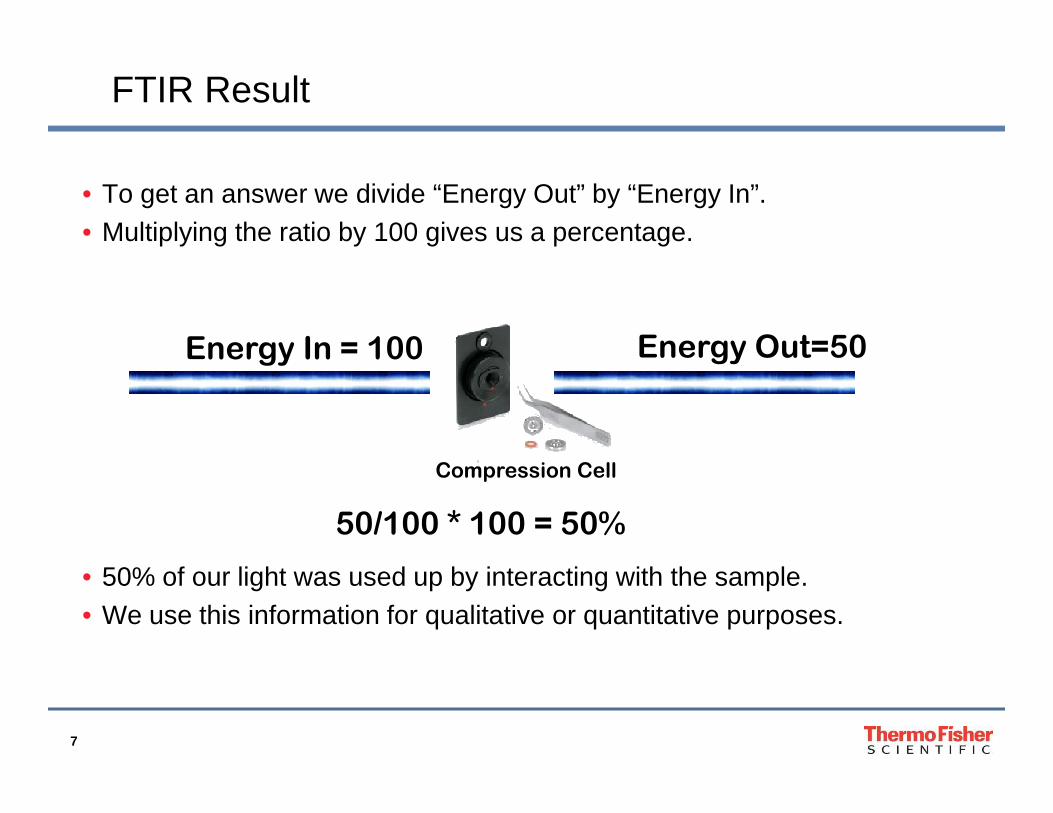
FTIR Result
• To get an answer we divide “Energy Out” by “Energy In”. • Multiplying the ratio by 100 gives us a percentage.
Energy In = 100 Energy Out=50
7
• 50% of our light was used up by interacting with the sample.• We use this information for qualitative or quantitative purposes.
50/100 * 100 = 50%
Compression Cell

100
Stretching Deformation
Molecular Vibrations Provide Information
8
20
30
40
50
60
70
80
90
100
%T
1000 1500 2000 2500 3000 3500 4000 Wavenumbers (cm-1)

The Source – Making sure you have frequencies to measure
• The Source is a light bulb that produces energy at different frequencies• We must select a source that produces light frequencies that we wish to
measure• 99% of the time we want to see frequencies of light that interact with
our sample. Sometimes we want to make sure that certain frequencies do not interact with our sample.
• We have a source for producing Mid-IR frequencies (4000-400 cm-1)
9
• We have a source for producing Mid-IR frequencies (4000-400 cm-1)• We have a source for producing NIR frequencies(12,000-4000 cm-1)• When designing a spectrometer we have to match the hardware so we
can measure the desired frequencies.

The Detector – Making sure you can measure those frequencies
• The detector must be able to measure the intensities of the frequencies of interest.
• There are many choices of detectors offering many different advantages
• Speed – Collect data faster• Sensitivity – Collect data from small amounts of sample• Frequency range – Collect the frequency range with relevant data
10
• Frequency range – Collect the frequency range with relevant data• Linearity – Collect data accurately over broader quantities of interaction
• In some systems, having multiple detectors is possible.• Detectors can overfill. Be careful! Too much energy is bad.
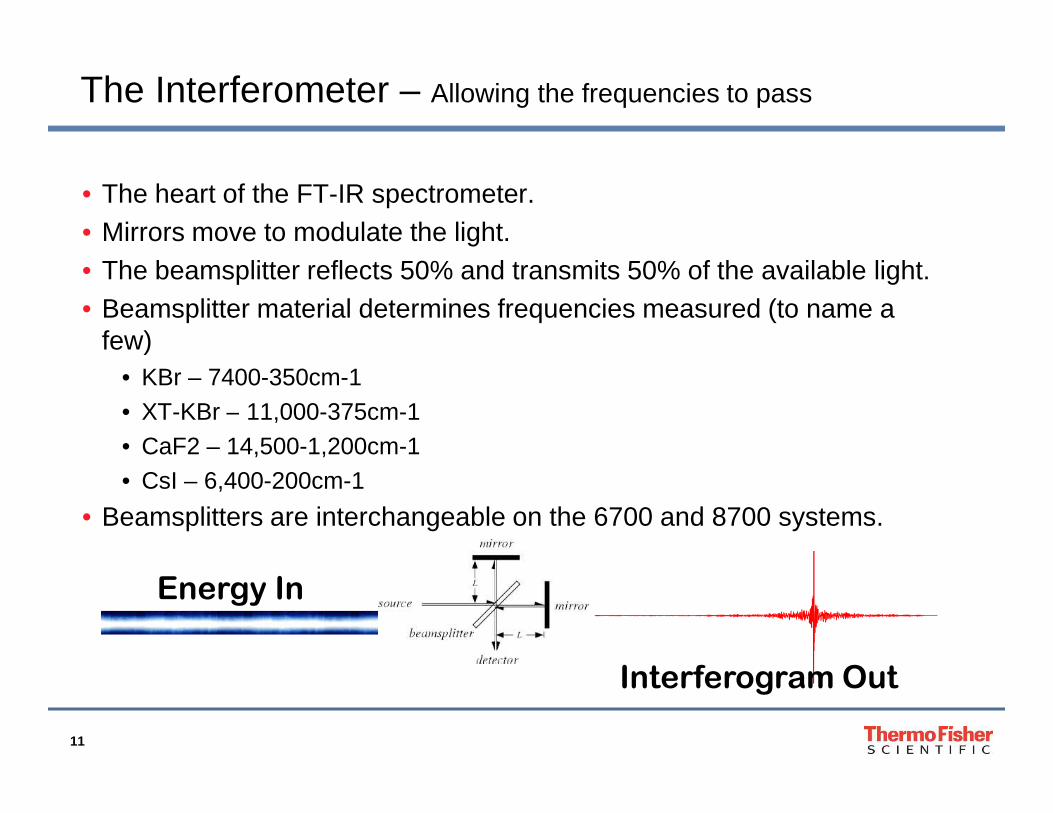
The Interferometer – Allowing the frequencies to pass
• The heart of the FT-IR spectrometer.• Mirrors move to modulate the light.• The beamsplitter reflects 50% and transmits 50% of the available light.• Beamsplitter material determines frequencies measured (to name a
few)• KBr – 7400-350cm-1• XT-KBr – 11,000-375cm-1
11
• XT-KBr – 11,000-375cm-1• CaF2 – 14,500-1,200cm-1• CsI – 6,400-200cm-1
• Beamsplitters are interchangeable on the 6700 and 8700 systems.
Energy In
Interferogram Out

The Interferogram
• Every datapoint in the interferogram contains the energy reading of every frequency of light available.
• The interferogram is collected over time while the mirror moves.• The larger the Interferogram peak to peak height, the more energy is
12
• The larger the Interferogram peak to peak height, the more energy is reaching the detector. (Useful for positioning and alignment)
• The longer the interferogram, the higher the resolution.• Higher resolution defines more of the frequencies measured• Higher resolution takes more time to collect• Higher resolution has more noise

The Background
• To collect a “finished” spectrum there must be a background.• The background is the energy available to analyze the sample• The background energy is used to determine the amount of energy that
the sample interacted with. We measure the relative change in energy.• If possible, the hardware configuration should match the configuration
when collecting the sample data, less the sample itself.
Sin
gle
Be
am
13
Vo
lts
1800 1900 2000 2100 2200 2300 2400
Data points
Vo
lts
1900 1950 2000 2050 2100 2150 2200 Data points
Interferograms
Sin
gle
Be
am
1000 2000 3000 4000
Wavenumbers (cm-1)
Sin
gle
Be
am
1000 2000 3000 4000 Wavenumbers (cm-1)
Single Beams %T
1000 2000 3000 Wavenumbers (cm-1)
Spectrum
Background
Sample
Ratio

What is the Spectrum?
• A representation of the interaction between our sample and the frequencies of light we are measuring
• The pattern of frequencies interacting tells us what the molecular structure of our sample is – Qualitative analysis
• The intensities of those interactions tell us about how much sample we have in the analysis – Quantitative analysis
• We typically view the data as the % of light that passed through our sample (units of %T) or we look at the amount of light that was
14
sample (units of %T) or we look at the amount of light that was absorbed by the sample (units of ABS)
% Transmission Absorbance
0 %
100%
O ABS
6 ABS

Good Vs Bad Data
• These are general guidelines:• 0% Transmission = 6 ABS = no energy to the detector for that group of
frequencies. Data not reliable when energy measured is 0, or close to 0.• Quantitative analysis – Use frequencies where the maximum energy
interaction is >10%T or <1 ABS• Qualitative analysis – If the data “looks” good, it is probably good enough.• Never use system cutoffs for measurements. ie. KBr cuts off at 350cm-1.
Never perform quant using 400-350cm-1.
15
Never perform quant using 400-350cm-1.• Software corrections can fix data qualitatively. Quantitatively if corrections
are needed it is better to find a different collection technique.• The lower the resolution, the better. But you still need to solve the problem.

FTIR Instruments
Nicolet iS5 – Simple, Robust, Inexpensive, Limited
Nicolet iS10 – Greater Versatility, High Performance
16
Nicolet iS50 – Highest capability and Versatility.If FTIR can do it, the iS50 can do it.

NIR Theory
• The same technology as Mid-infrared.• Source, beamsplitter, detector perform the same function with a
different set of frequencies.• Data collected represents combinations of interactions generating
spectral change. Data is a more general representation.• Quantitatively, data is excellent.• Qualitatively, data is harder to interpret.
17
• Qualitatively, data is harder to interpret.• Benefits of NIR:
• Can analyze through glass and plastic. These materials absorb all of the mid-infrared light.
• Can use fiber optic cables• Can handle much larger sample sizes• Better for real time, process control data analysis• Excellent hardware and software validation tools. Essential for some
industries

NIR Spectrum
1.1
1.2
Combinatio
Fundamental Vibration
3000 cm-16000 cm-19000 cm-112000 cm-1
3rd Overtone2nd Overtone
1st Overtone
18
0.1
0.2
0.3
0.4
0.5
0.6
0.7
0.8
0.9
1.0
1.1
Ab
so
rba
nc
e
4000 5000 6000 7000 8000 9000 10000 11000 Wavenumbers (cm-1)
3rd
Overtone
2nd Overtone
1st Overtone
Combination
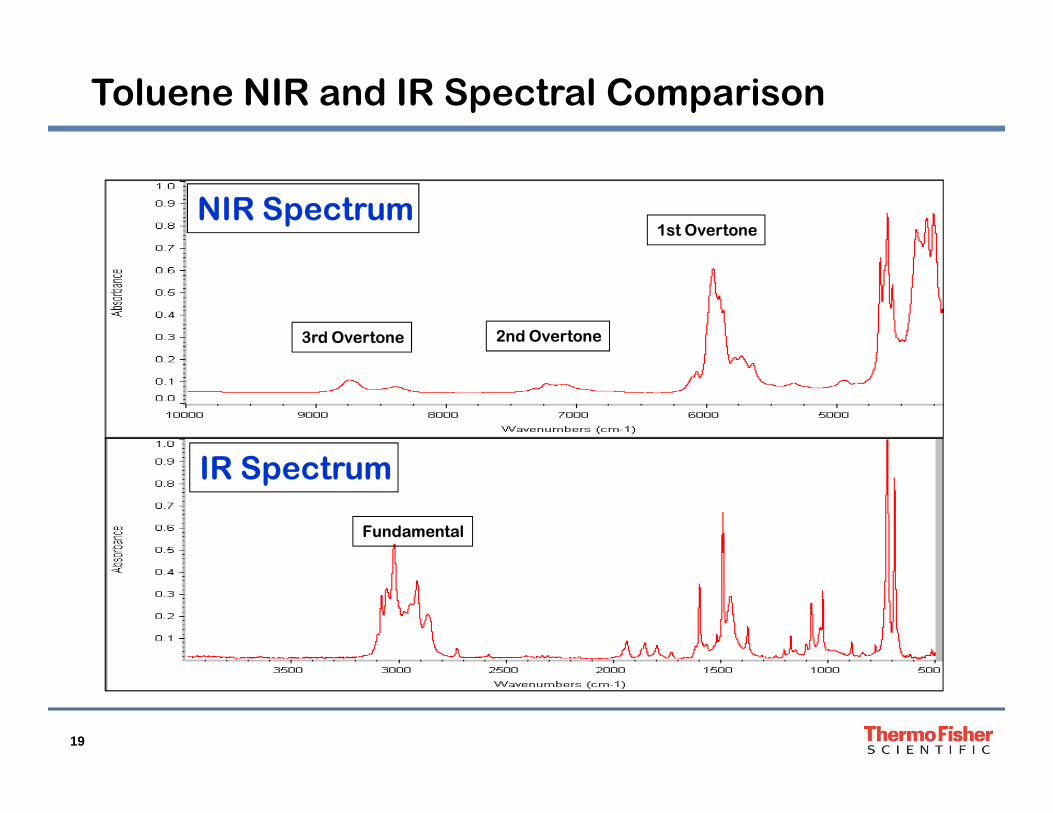
Toluene NIR and IR Spectral Comparison
NIR Spectrum1st Overtone
2nd Overtone3rd Overtone
19
IR Spectrum
Fundamental
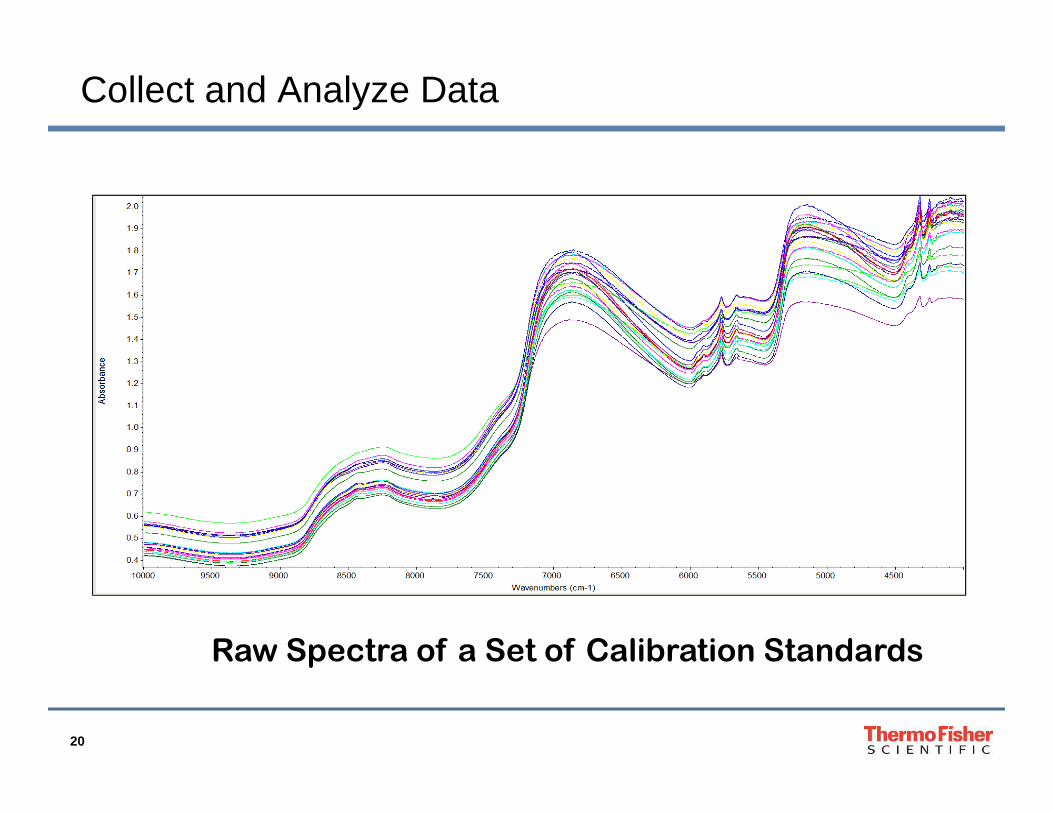
Collect and Analyze Data
20
Raw Spectra of a Set of Calibration Standards

Typical FT-NIR Spectral Changes between Samples
21
First Derivative of Raw Spectra

Build a Calibration Curve
• NIR is a secondary technique• Concentration values are used to build a calibration curve• The curve is then used to calculate real numbers from samples which
are unknown
22
SamplesWith
KnownValues
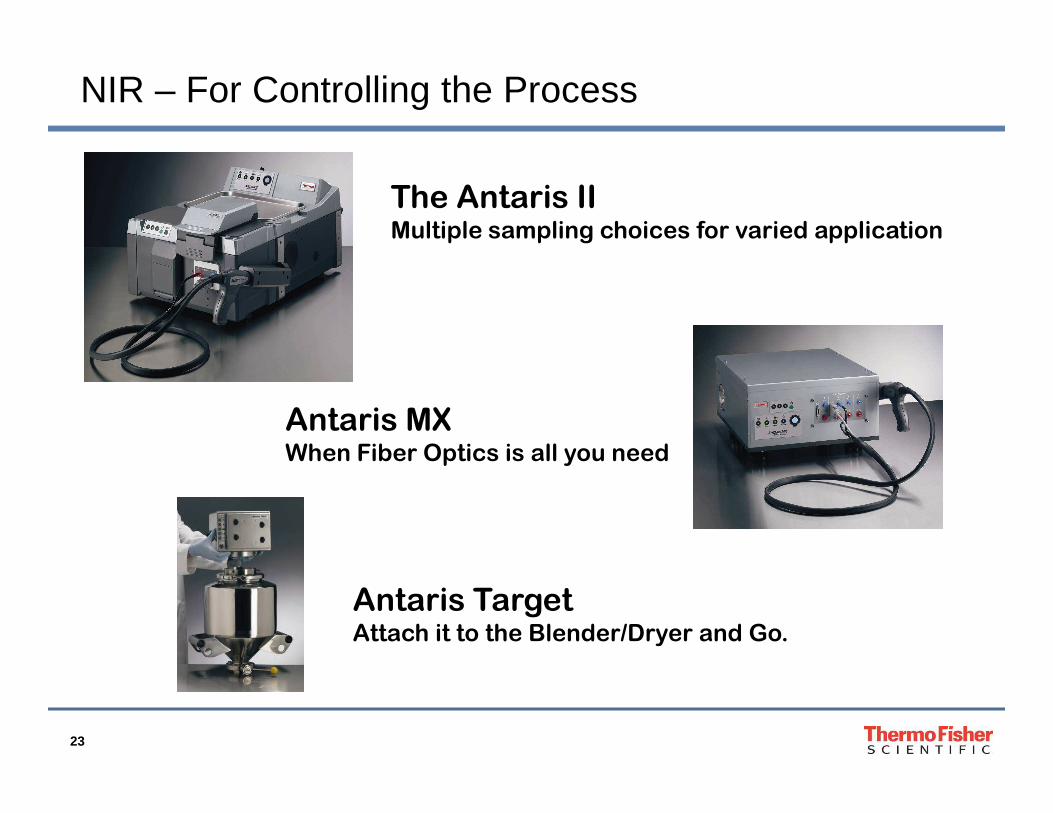
NIR – For Controlling the Process
The Antaris IIMultiple sampling choices for varied application
Antaris MX
23
Antaris MXWhen Fiber Optics is all you need
Antaris TargetAttach it to the Blender/Dryer and Go.
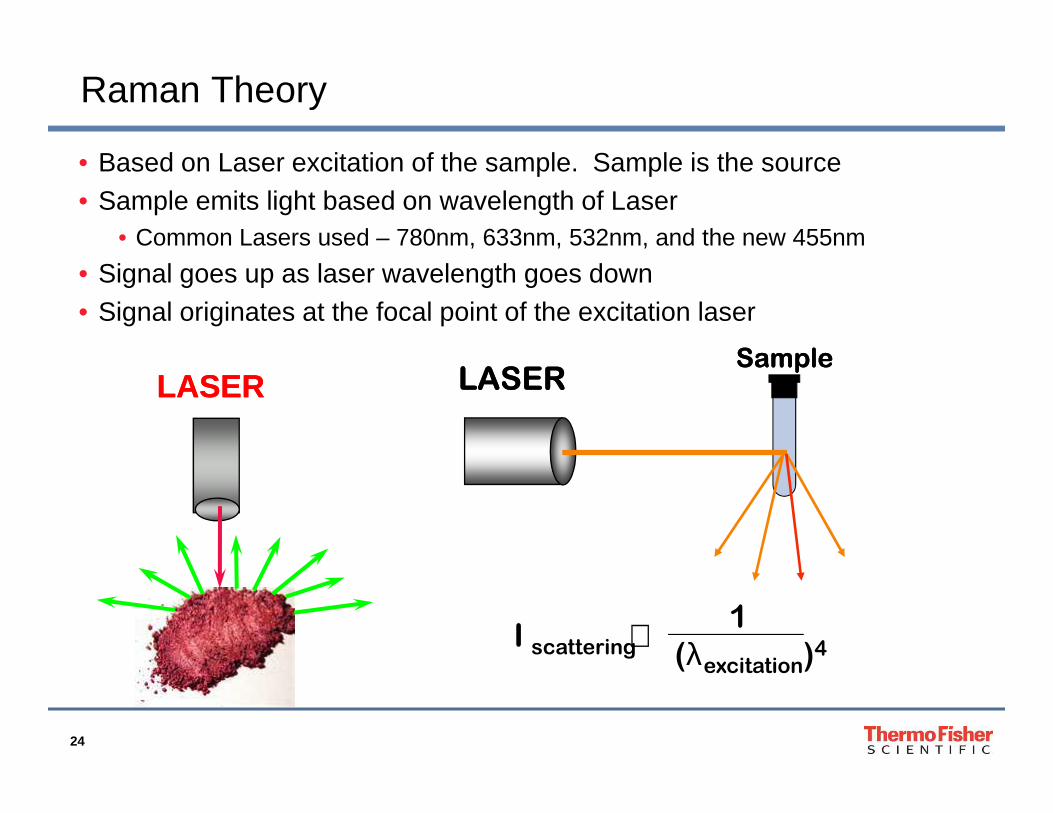
Raman Theory
• Based on Laser excitation of the sample. Sample is the source• Sample emits light based on wavelength of Laser
• Common Lasers used – 780nm, 633nm, 532nm, and the new 455nm
• Signal goes up as laser wavelength goes down• Signal originates at the focal point of the excitation laser
LASERLASER LASERLASERSampleSample
24
I scattering∝1
(λexcitation)4

Raman Spectra – Unshifted - Wavenumbers
Laser Wavenumber18796 cm-1
17795 cm-1
14801 cm-1
25
Laser Wavenumber12820 cm-1
Laser Wavenumber15798 cm-1
14801 cm-1
11819 cm-1

Shifted Raman Spectra – Laser Frequency is Zero
1001 cm-1
1001 cm-1
Laser
26
1001 cm-1

Benefits Offered by Raman – Complementary to IRF
T-I
R
� Complementary use of Raman and FT-IR for structural elucidation
� Example: Trans-cinnamyl acetate
27
C=O C-OC=C
C=O
C=C
C-O
C=C
Ra
ma
n

Raman Hardware
• Laser -1064nm, 780nm, 633nm, 532nm, 455nm• Detector – NIR CCD or InGaAs detectors used• Filter
• Need to remove the laser frequency• Intensity at the laser frequency is too great• Filter cutoff determines low end spectral cutoff
• Grating
28
• Grating• Disperses raman scatter in predictable angles like a prism• Acts to separate frequencies for individual measurement• The greater the separation, the higher the resolution

Benefits Offered by Raman – Complementary to IR
• Highly Complementary to Infrared• Weak IR absorbers often strong Raman emitters• Symmetric bonds represented more in Raman (S-S, C-C, etc.)• Molecular backbone emphasized more than end groups• Sample preparation not needed for Raman, just place sample at laser focus• Analyze through glass, through plastic, in water• Can penetrate into sample without manipulation• Raman provides Far-IR information
29
• Raman provides Far-IR information• Can use fiber optic technology• Extremely high spatial resolution: <1 micron• Microscopic or macroscopic• Great for qualitative subtractions• Essential in Pharmaceutical and Forensic labs• Excellent for Polymer studies
IR (photo)
Raman (x-ray)

Problems with Raman
• Safety issues with lasers• Raman systems have safety locks – Class1 Laser safe
• Weak signal at times• Can adjust laser power to magnify signal
• Sample heating• Dark samples exhibit more heating • Samples can heat to the point of burning
30
• Samples can heat to the point of burning
• Almost impossible to analyze gases• Gases need to be at very high concentration or pressure
• Fluorescence• If sample fluoresces it will give off measureable signal that distorts data• Fluorescence can complete wipe out sample spectrum
Fluorescence Avoidance
• Spectral correction after collection• Several specialized baseline correction algorithms exist• Not viable in cases where fluorescence saturates detector
• Confocal optics – signal comes from laser focus point• Can work well when the source of fluorescence is the substrate rather than
the sample
• Excitation laser change
31
• Excitation laser change• Most reliable means of avoiding fluorescence• Switch to an excitation frequency that does not stimulate fluorescence in the
sample• Typically this means switching to longer (NIR) wavelengths• FT-Raman operating with 1064 excitation rarely exhibits fluorescence

The Raman Instruments
DXRxi Imaging SystemiS50 with Raman
32
Raman DXRMicroAnd
Macro
DXRxi Imaging SystemiS50 with Raman

Review
• FTIR and NIR work because the samples absorb light• Raman works by the sample emitting light• FTIR and Raman show fundamental frequencies of vibration• NIR shows combinations of frequencies and overtones• FTIR and NIR give excellent quantitative results• FTIR and Raman give excellent qualitative results
33
• FTIR looks at the “outside” of the molecule• Raman looks at the “backbone” or inside of the molecule• Raman and NIR both work through glass, plastic, and fiber optics• Raman doesn’t care about water• Raman needs little or no sample preparation• All systems can be validated• All Thermo Instruments operate on our award winning OMNIC software